where’s the real money charlie chubet associate media director, mec digital anne hunter vp,...
TRANSCRIPT

Where’s the Real MoneyWhere’s the Real MoneyCharlie ChubetAssociate Media Director, MEC DigitalAnne HunterVP, Advertising Effectiveness, comScore Bethany R. MachManaging Director, Client Leadership, Mindshare New YorkPauline Malcolm-JohnEVP, Sales, Wee World
Charlie ChubetAssociate Media Director, MEC DigitalAnne HunterVP, Advertising Effectiveness, comScore Bethany R. MachManaging Director, Client Leadership, Mindshare New YorkPauline Malcolm-JohnEVP, Sales, Wee World
Tweet#imediasummit

Where’s the Beef?

When Money Moves to DigitalWhen Money Moves to DigitalcomScore, Anne HuntercomScore, Anne Hunter

Background• Last year comScore and ValueClick presented a paper to the ARF on
the impact of various media placement strategies in digital media• The goal of the research was to help marketers understand how to
allocate the money they were moving to digital and potentially provide a basis for a Market Mix Model for digital
• The response to the paper was overwhelming– Over 1,500 people downloaded it from the comScore site– Presented at the MIXX conference and IAB site

What We Learned
• Different strategies drove very different results• The best performing strategies changed from the short-term to long-
term• Retargeting drove both organic search and site visitations better than
all other online display buying strategies• When multiple strategies were used in concert, results were often
higher than when a single strategy was used alone
Using behavioral search and site visitation lifts using AdEffx ™ Action Lift™

Site Visitation Lifts By Media Placement Strategy Over 4 Weeks
Highest % Lift in Visitation within 1 week
1. Retargeting*
2. Audience
3. Efficiency*
4. RON*
5. Contextual
6. Premium
Highest % Lift in Visitation within 4 weeks
1. Retargeting*
2. Audience
3. Contextual
4. Premium
5. RON*
6. Efficiency*
*indicates strategy that is based on optimizing to site visitation*indicates strategy that is based on optimizing to site visitation

Insights Lead to Questions
• Do placement strategies work the same way when measured by attitudinal data?
• What are the effects outside of a single ad network?• How are different strategies affected by frequency?• Could frequency be the cause of the multiplier effect?
Clients asked us to continue the research
Methods• In order reflect current pricing and buying methods, 6,362 individual
placements which ran between April 2010 through March 2011 were used in the cost evaluation.
• All costs were normalized to a CPM basis.• Reach was determined using census tags placed on all ads in
combination with comScore’s 2 million worldwide person panel to create a unified person based reach calculation. 4,454 of the above placements were used to calculate the reach and frequency estimates using AdEffx™ Campaign Essentials™ .

Methods• 256 campaigns which included 4,454 individual placements which ran
between April 2010 through March 2011 were used in the attitudinal analysis with AdEffx™ Brand Survey Lift™.
• All campaigns had a brand focused objective and at least 15 distinct campaigns per strategy with most strategies averaging 62 studies per strategy. There were an average of 36,500 survey respondents per strategy.
• Altitudinal lift was calculated from in-flight survey responses. On scaled questions top two boxes out of seven were considered positive. comScore’s Smart Control™ methodology was used based on the difference between the base lifts and incremental lifts generated by exposure.

Placement Strategies Evaluated• Audience Targeted – ads placed run of site or run of network which were additionally targeted to
a specific demographic or behavior usually by cookie targeting• Context – ads which were placed in content relevant to the brand• High Impact* – ads which took over a high percentage of the viewers screen usually involving
sight, sound and motion such as home page takeover units• Retargeting – ads where were shown to people who had previously visited the marketer’s site• ROS and RON – ads placed either run of site or run of network which did not have any additional
targeting. They are often auto optimized via an ad server to the high converting audiences.• Sponsorship* – ads which surrounded premium content, usually in a permanent position and
implied support of the content*new to wave 2

New StrategiesThere is no standard definition for social or video so we looked to ads than ran on sites which define themselves as selling this type of media.Only brand ads were measured.
• Social – ads that ran on Facebook, LinkedIn and MySpace• Video – ads that ran on Brightroll, Hulu, YouTube and Tremor media

Measures Evaluated
• Ad Recall – did they remember seeing the measured brand ads
• Aided Awareness – were they aware of the measured brand when prompted
• Top of Mind Recall – when asked for the first brand they thought of, did they mention the measured brand
• Brand Favorability – did they think highly of the measured brand
• Intent to Recommend – would they recommend the measured brand to a friend
• Intent to Purchase – did they intend to buy the measured brand
Awareness Measures Impact Measures

Strategies Vary in Cost
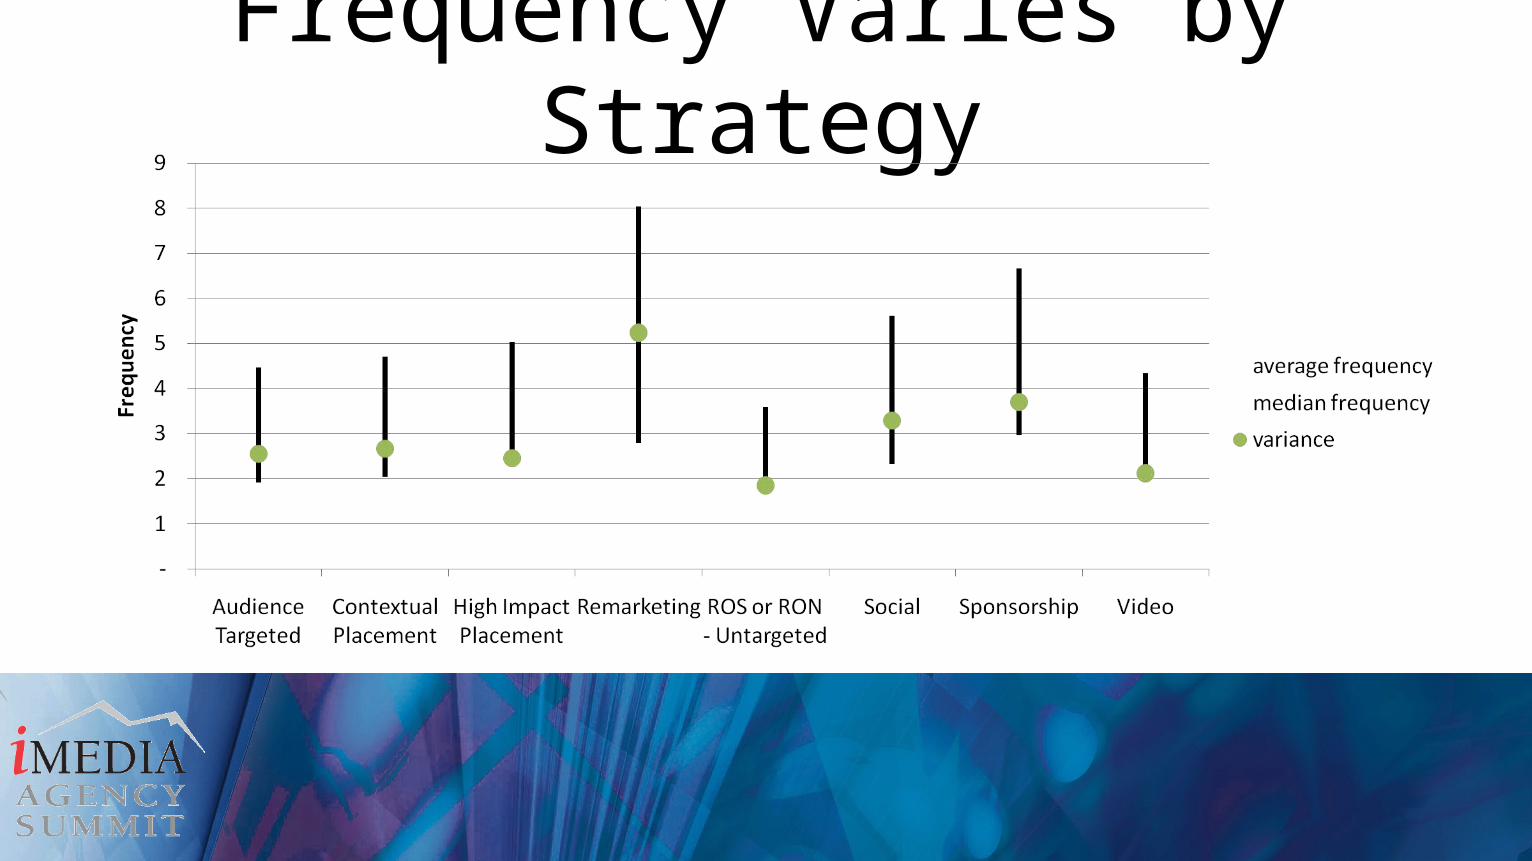
Frequency Varies by Strategy

Example: Sponsorship Frequency Distribution Variance
Average frequency is 6.67, median
is 2.96

The More You Show Ads, The More People Are Aware of Them
Results significant at 90% confidence

But Not All Ad Strategies Generate the Same Awareness

The More You Show Ads, The More They Influence People
But generating lift in impact is much harder
than generating lift in awareness
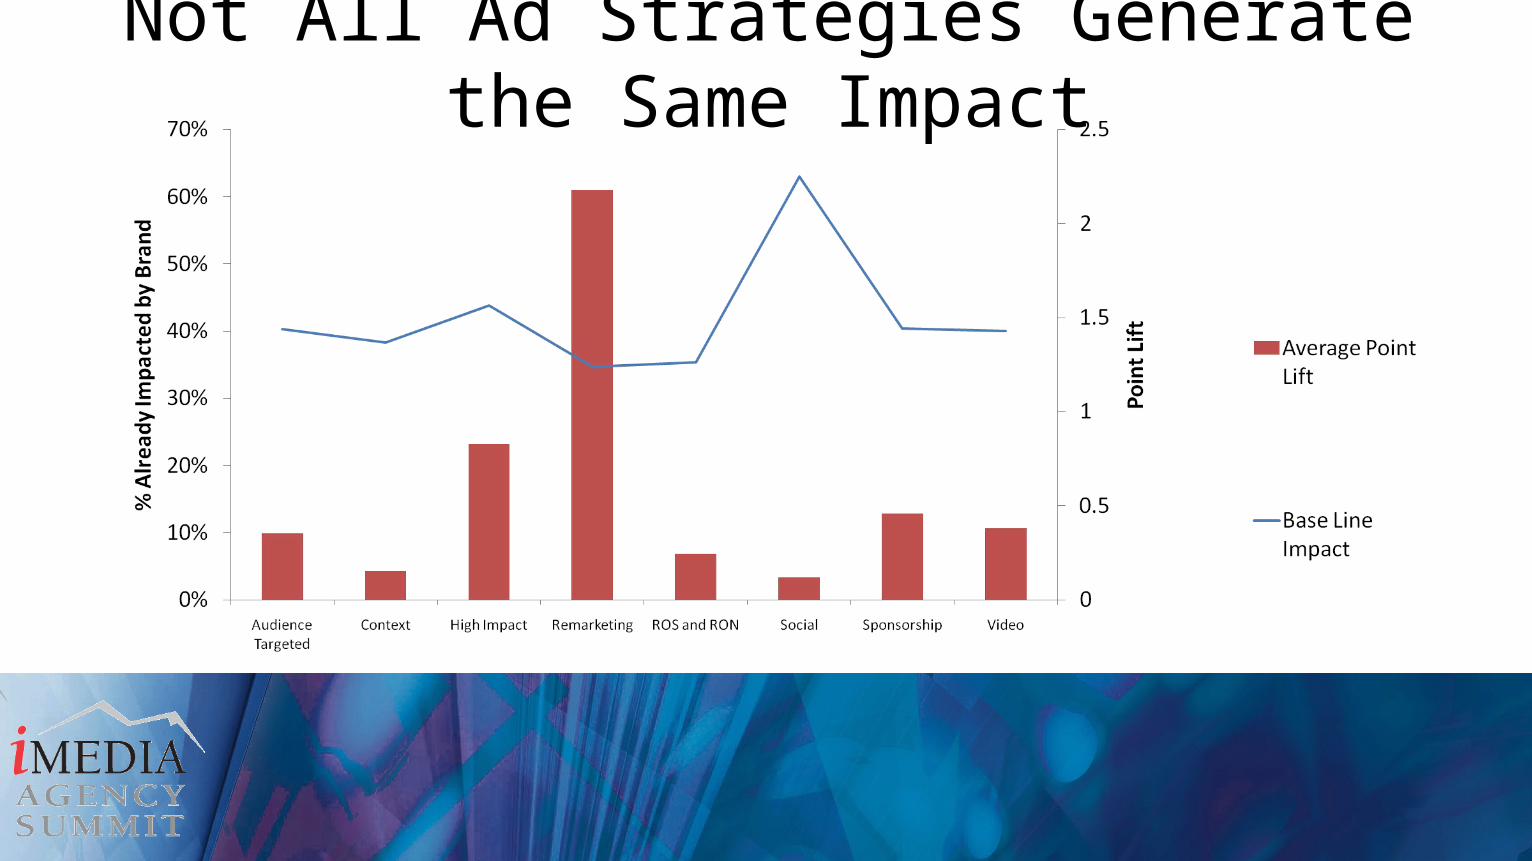
Not All Ad Strategies Generate the Same Impact
Conclusions• Remarketing continues to be a highly effective strategy for awareness and impact
measures which is consistent with it’s earlier success in lifting Wave 1 behavioral measures
• RON and ROS advertising works well at generating awareness but viewers are not persuaded by the messaging, similar to the finding in wave 1 where effectiveness of RON wore off quickly.
• Social and Video work extremely well at generating awareness but not as well as generating impact
• Better managing frequency can drive greater results for the same dollar
Ideas reinforced and new learnings
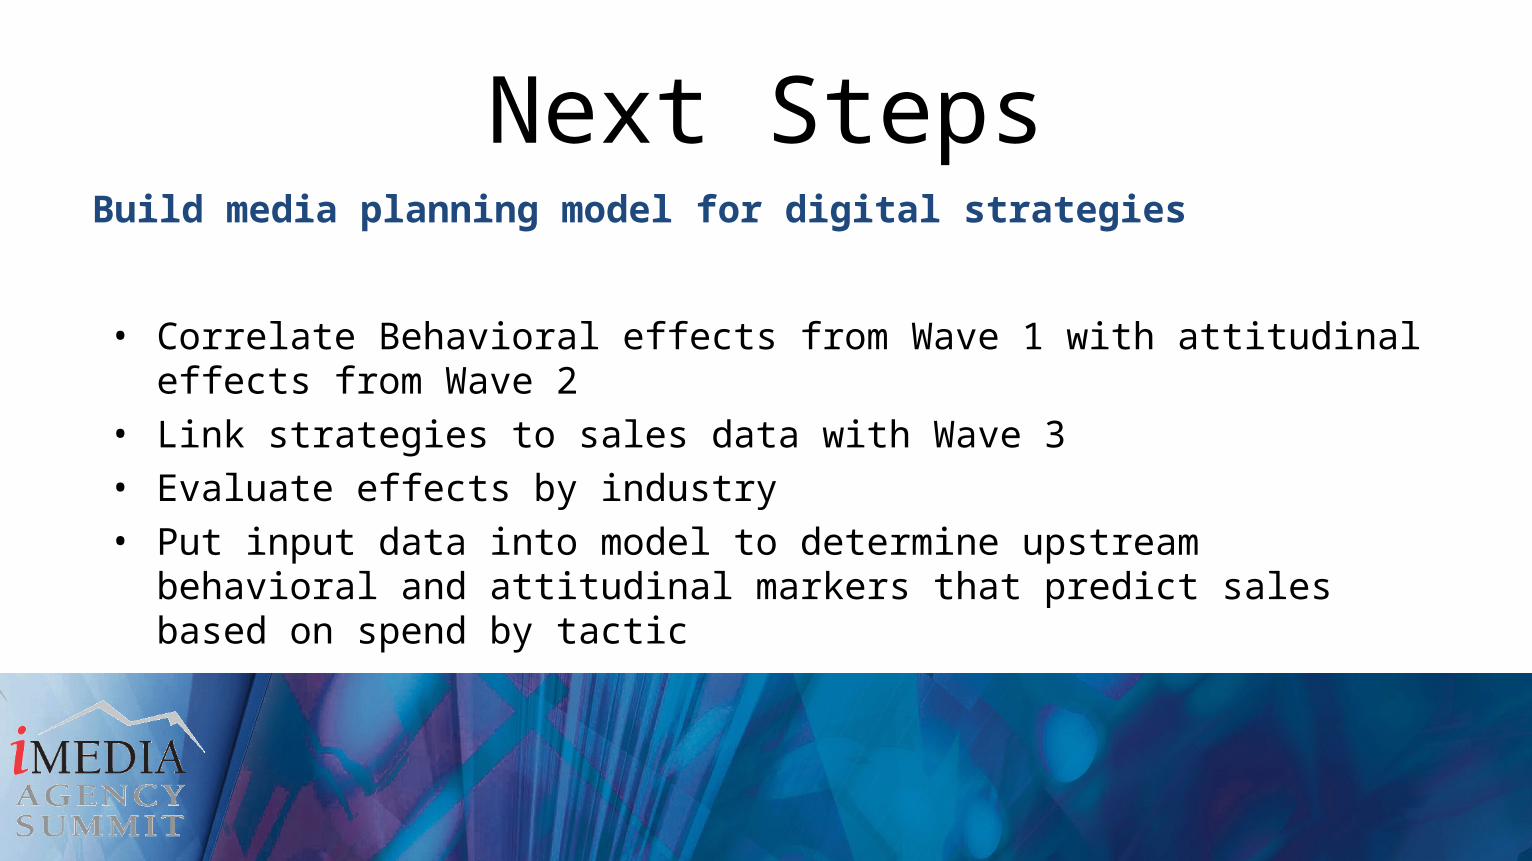
Next Steps
• Correlate Behavioral effects from Wave 1 with attitudinal effects from Wave 2
• Link strategies to sales data with Wave 3• Evaluate effects by industry• Put input data into model to determine upstream behavioral and
attitudinal markers that predict sales based on spend by tactic
Build media planning model for digital strategies

The Agency Perspective• Translating• Applying Insights
Beth Mach, Managing Director, Client Leadership - Mindshare

Skintimate Case StudySkintimate Case StudyPauline Malcolm-John
EVP of Strategic Partnerships, WeeWorld, Inc.
Charles ChubetAssociate Media Director, MEC
Pauline Malcolm-John EVP of Strategic Partnerships, WeeWorld, Inc.
Charles ChubetAssociate Media Director, MEC
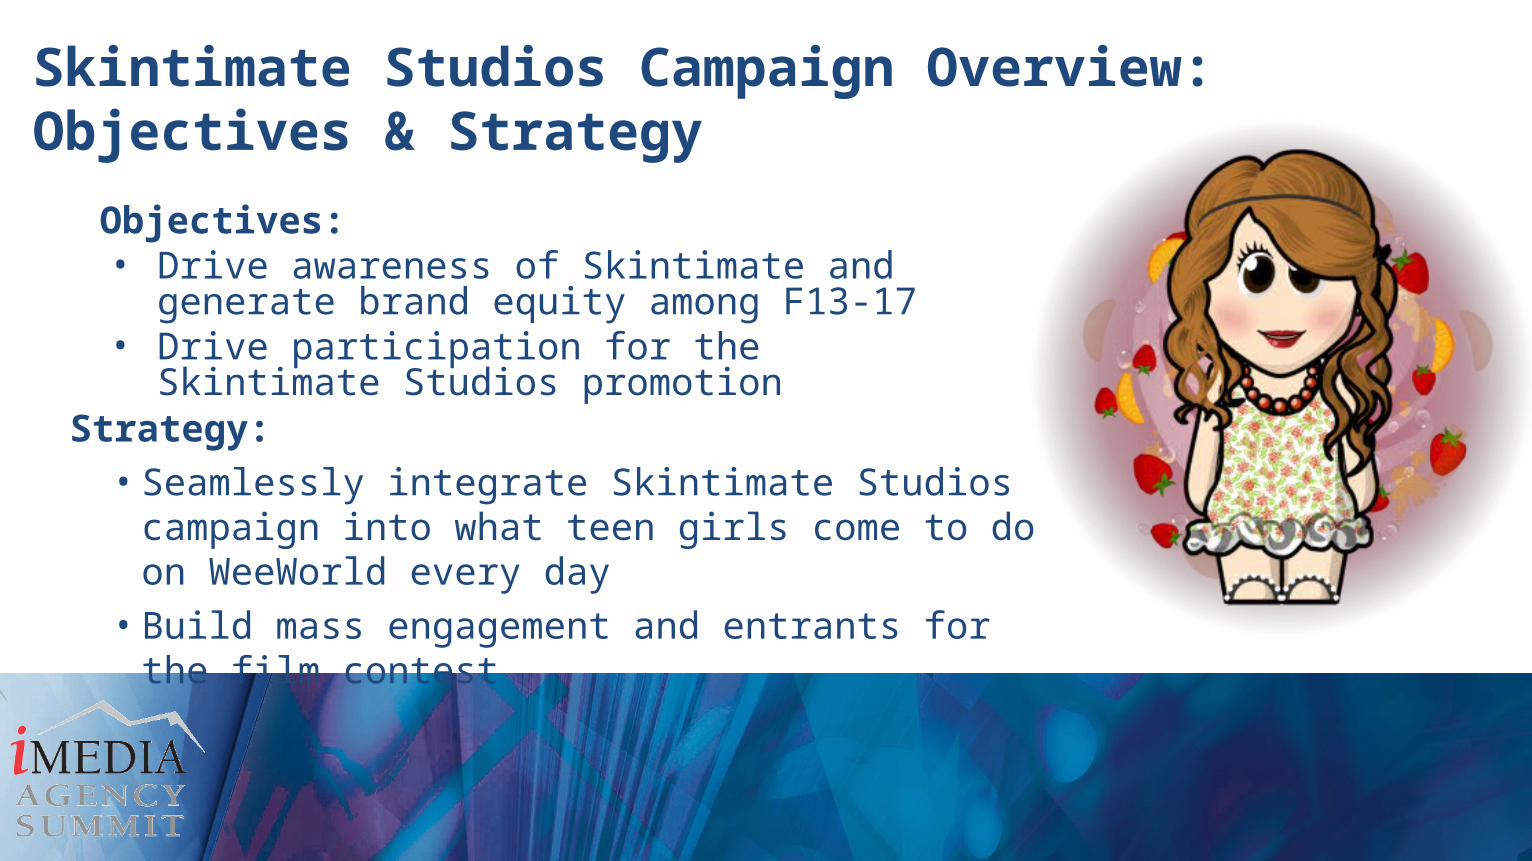
Skintimate Studios Campaign Overview:Objectives & Strategy
Strategy:• Seamlessly integrate Skintimate Studios
campaign into what teen girls come to do on WeeWorld every day
• Build mass engagement and entrants for the film contest
Objectives:• Drive awareness of Skintimate and
generate brand equity among F13-17• Drive participation for the Skintimate
Studios promotion

Why Social Game Integration?

Skintimate Brand Ambassadors
Hundreds of millions ofviral impressions
Hundreds of thousands of asset downloads
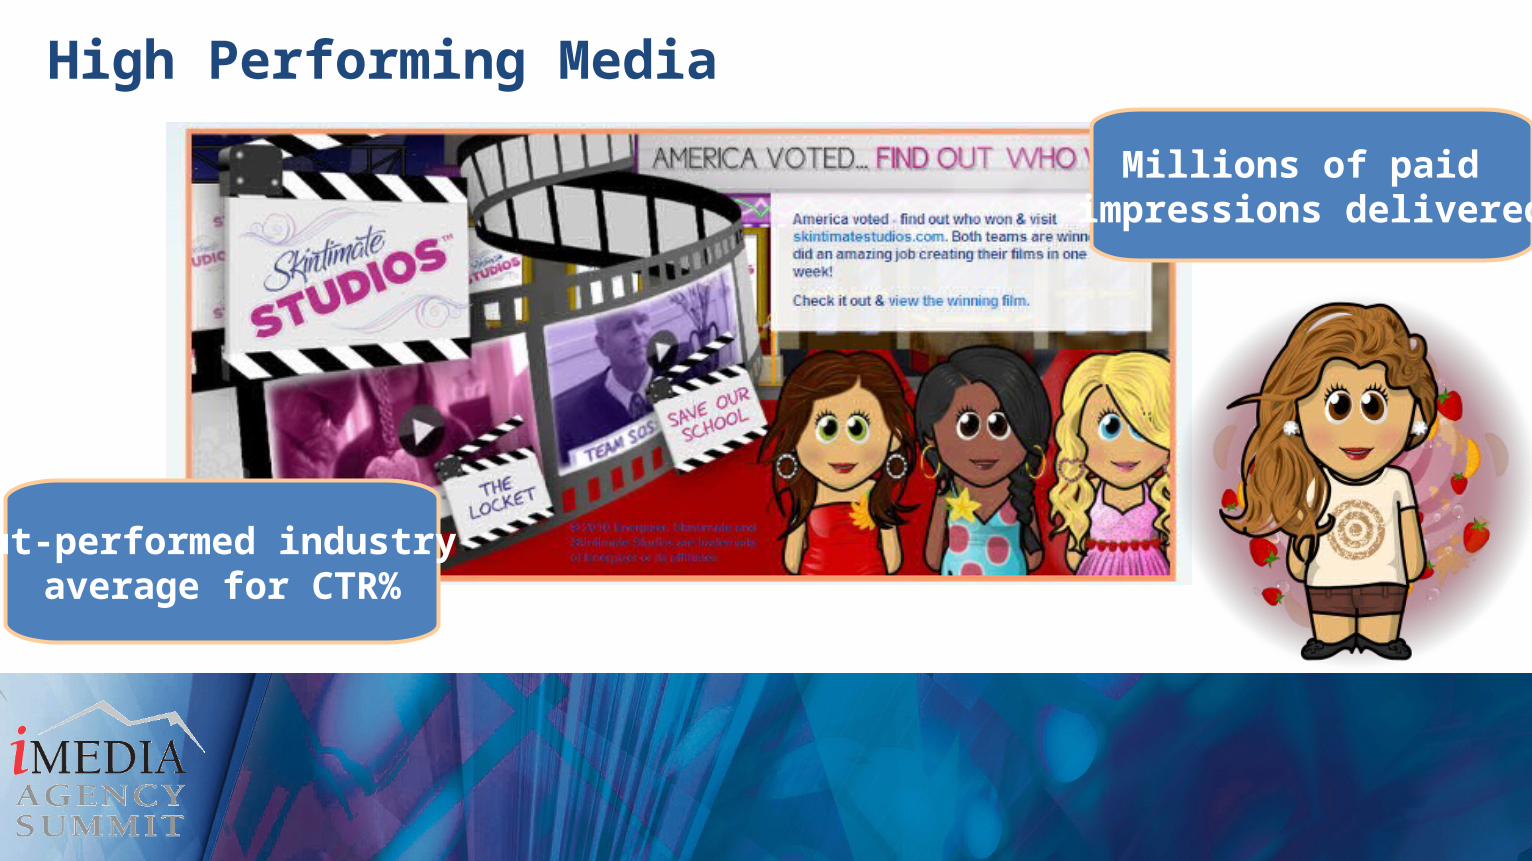
High Performing Media
Millions of paid impressions delivered
Out-performed industry average for CTR%

Socialize with Friends: Skintimate Studios World Takeover
58.9% of post
campaign survey
respondents said they
visited Skintimate
Studios World!
Double digit lift inbrand favorability and
purchase intent
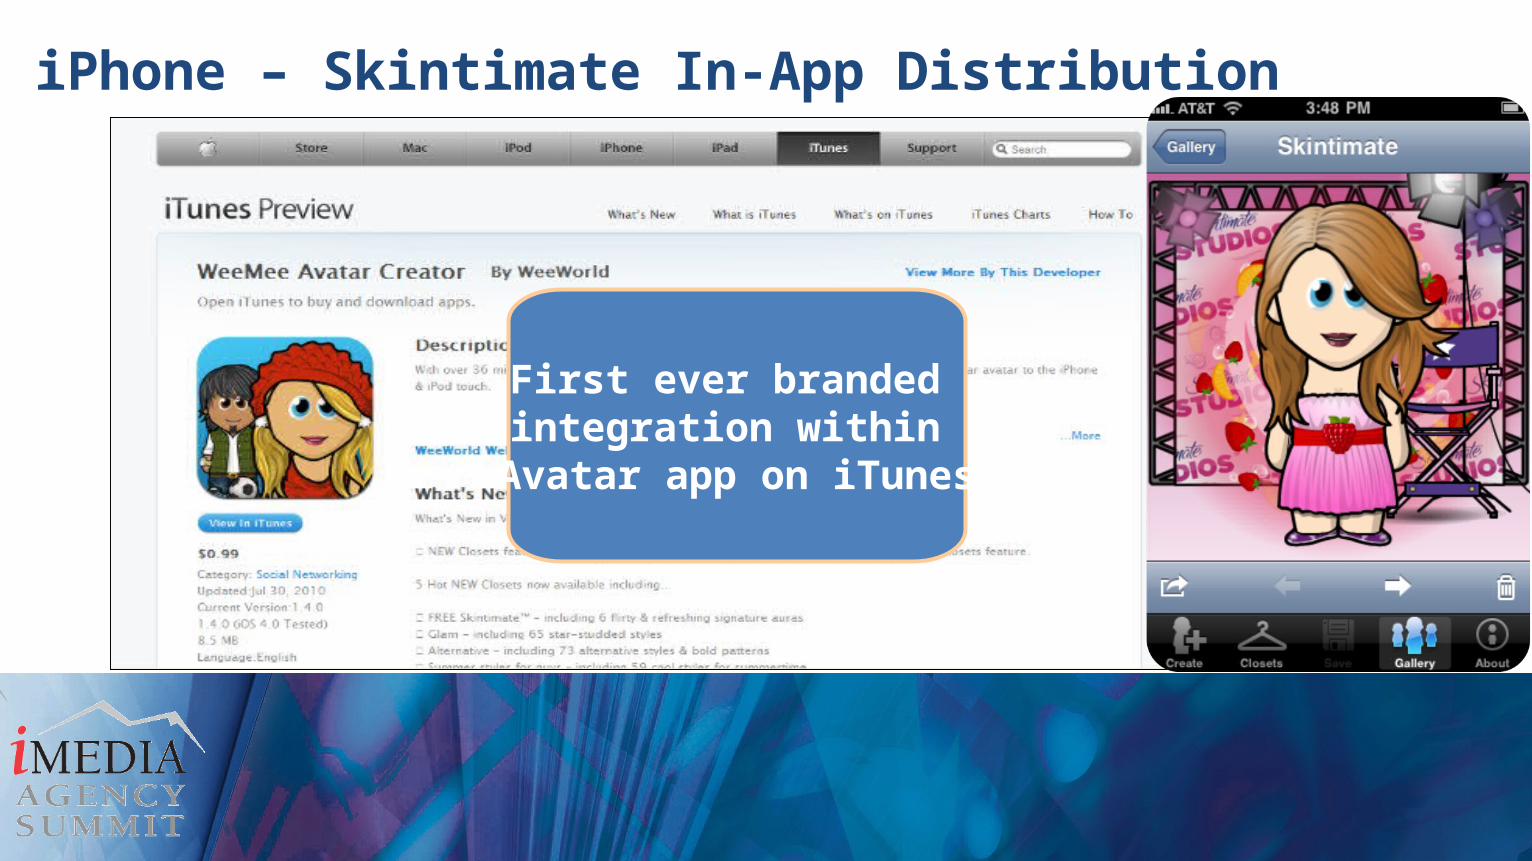
iPhone – Skintimate In-App Distribution
First ever branded integration within
Avatar app on iTunes

Proven Cost Effective Engagement
** Based on EDI formula, Skintimate had 7.3 times more interaction (and higher quality) than an equivalent costing banner-only campaign
Equivalent Display Impressions = 7.3%**
**EDI Formula:(Engagement Events per Impression / CTR (standard media))multiplied by Weighted Impressions cost (banner eCPM/Social eCPM)

Discussion