white certificates as a tool to promote energy efficiency ...€¦ · white certificates as a tool...
TRANSCRIPT

ECEEE INDUSTRIAL SUMMER STUDY PROCEEDINGS 151
White certificates as a tool to promote energy efficiency in industry
Dario Di SantoFIRE – Italian Federation for the Rational Use of EnergyVia Anguillarese 30100123 Roma [email protected]
Enrico BieleFIRE – Italian Federation for the Rational Use of [email protected]
Daniele ForniFIRE – Italian Federation for the Rational Use of [email protected]
Keywordswhite certificates, energy efficiency obligation, industrial ener-gy saving, ESCO market development, cost-effective measures, energy efficiency assessment, additionality
AbstractWhite certificates (WhCs) or, more generally, energy efficiency obligation schemes (EEOs) are used in many EU countries as a policy measure to reach energy efficiency targets. Some of the first schemes (UK, Italy, France, Denmark) have been capable to reach positive results over the years, although with impor-tant differences, as clearly demonstrated by the IEE ENSPOL project. Only the Danish and the Italian schemes show a pre-dominance of industrial projects.
The Italian scheme, in particular, in the last three years has produced 80 % of the white certificates from the industrial sec-tor. The energy savings are transformed in certificates keeping into account the additionality, with respect to the market and regulatory baseline, and the technical lifetime of the project (through the so called tau coefficient). The presence of a trad-able market ensures an important involvement of voluntary parties and supported the development of a dedicated energy service market.
This EEO scheme, which started effectively in 2004, provides a target of 7.6 Mtoe1 of annual savings in 2016 and showed a progressive shift from the tertiary and household sectors and a prevalent use of simplified procedures for the assessment of en-ergy savings, to the industrial sector and a predominant use of
1. Toe: primary ton of oil equivalent. In the Italian scheme it corresponds roughly to 5.3 MWhe and 11.6 MWht.
metered savings procedures. The scheme is thus an interesting example of a policy measure capable of achieving significant results in the industrial sector and it could be useful to analyse the main design rules that influenced this result.
Based on FIRE2 activities and experience, with a focus on the industrial sector, the paper will illustrate the main facts and results and how additionality, non energy benefits at system level, certificates trading, scheme costs, and measurement and verification procedures have been dealt with. The paper will also address the issues that will lead to a major redesign of the Italian scheme in 2016.
IntroductionThe 2012/27/EU directive on energy efficiency (EED) dedicates article 7 to the energy savings targets and support schemes. In particular Member States are required to save 1.5 % annu-ally with respect to the total energy sold to final costumers by distributors or by all retail energy sales companies, averaged over the most recent three-year period prior to 1 January 2013. Member States have the possibility to exclude transport and companies under the emission trading scheme. In order to reach this target Member States shall either impose an obliga-tion to some parties (e.g. distributors, traders, final users, etc.)
2. The Italian Federation for energy efficiency – FIRE – is an independent non-profit organization founded in 1987, whose purpose is to promote the efficient use of energy. FIRE has around 450 members, which cover all the energy sector (e.g. energy efficiency technologies producers, power producers, distributors, ESCOs, large and medium enterprises, universities and research centers, energy manag-ers and energy professionals). Since 1992 FIRE manages the Italian energy man-ager network on behalf of the Ministry of Economic Development. For information: www.fire-italia.org/fire-in-english.

1-141-16 DI SANTO ET AL
152 INDUSTRIAL EFFICIENCY 2016
1. POLICIES AND PROGRAMMES
through an EEO scheme, or adopt alternative measures (e.g. financial schemes, loans, carbon taxes, voluntary agreements, etc.), or a mix of both.
The ENSPOL project (www.enspol.eu)3, which lasted from 2014 to 2016, was dedicated to the analysis of all the EU sup-port schemes covered by EED art. 7, both existing and planned. Reports and guidelines covering all the aspects of EEO schemes and alternative measures (e.g. obliged parties, measurement of energy savings, baseline and additionality, controls, costs, etc.) are available in the project website [13,19]. Besides a web platform (www.article7eed.eu) is available to confront the dif-ferent schemes or go into details of a single measure. Both the ENSPOL website and platform are useful resources for experts and practitioners interested in EE support schemes and people interested in these topics, but not already familiar with them, are strongly encouraged to access the ENSPOL resources prior to read this paper.
This paper is based on the activities implemented by the au-thors in FIRE about energy efficiency policies and in particular white certificates4. Besides being partner of the ENSPOL pro-ject, FIRE is also involved in the EU-MERCI project (www.eu-merci.eu), aimed at analysing the industrial case studies collected through some of art. 7 EED schemes and disseminating and promoting the best practices. The paper will briefly summarise the basis of the Italian WhC scheme, illustrate the main results obtained since its creation in 2001 and effective launch in 2004 – with a focus on the role of the industrial sector –, and go into details about how the scheme deals with the main issues related to EEO schemes. Afterwards, the paper will explain some of the problems the scheme incurred during the last three years and in-troduce the new guidelines that will be released in 2016 in order to proceed towards the 2020 target. The conclusions will show the importance of a continuous improvement approach to reach the best results with complex schemes such as the Italian WhCs.
3. FIRE was the Italian partner of the ENSPOL project, financed under the Intel-ligent energy for Europe programme.
4. The activities performed by FIRE about WhC: participation in institutional work-ing groups and auditions, management of the national WhC observatory in coop-eration with GSE, surveys, researches and advanced training, also in cooperation with ENEA, information campaigns, also in cooperation with the Ministry of Envi-ronment, and national annual conferences.
More information on how EEO schemes work and useful comparisons among them can be found in [1, 2, 3, 5, 6, 9, 12, 13, 14, 15, 18, 19].
Basics about the Italian WhC schemeThe Italian WhC scheme [4, 7, 8, 10, 11, 13, 21, 22] is an EEO in which the electricity and gas distributors with more than 50,000 clients are obliged to reach increasing annual energy efficiency targets (Figure 1)5. It is a flexible mechanism, since the EE savings can be obtained through interventions from market operators (i.e. non obliged distributors, ESCOs, com-panies with energy manager or energy management system), managed by GSE6.
White certificates are used to certify the savings and obliged distributors can buy them from voluntary parties besides ob-taining them directly. All energy efficiency projects in all sec-tors are allowed. The exchange of white certificates between obliged and voluntary parties takes place on a dedicated plat-form managed by the GME7, either as a spot market exchange, or as a bilateral agreement over the counter. The WhC scheme can thus work as an incentive for the voluntary parties, consid-ering that the WhC price can vary over the time and that there are no assurances that the certificates can be sold every year8.
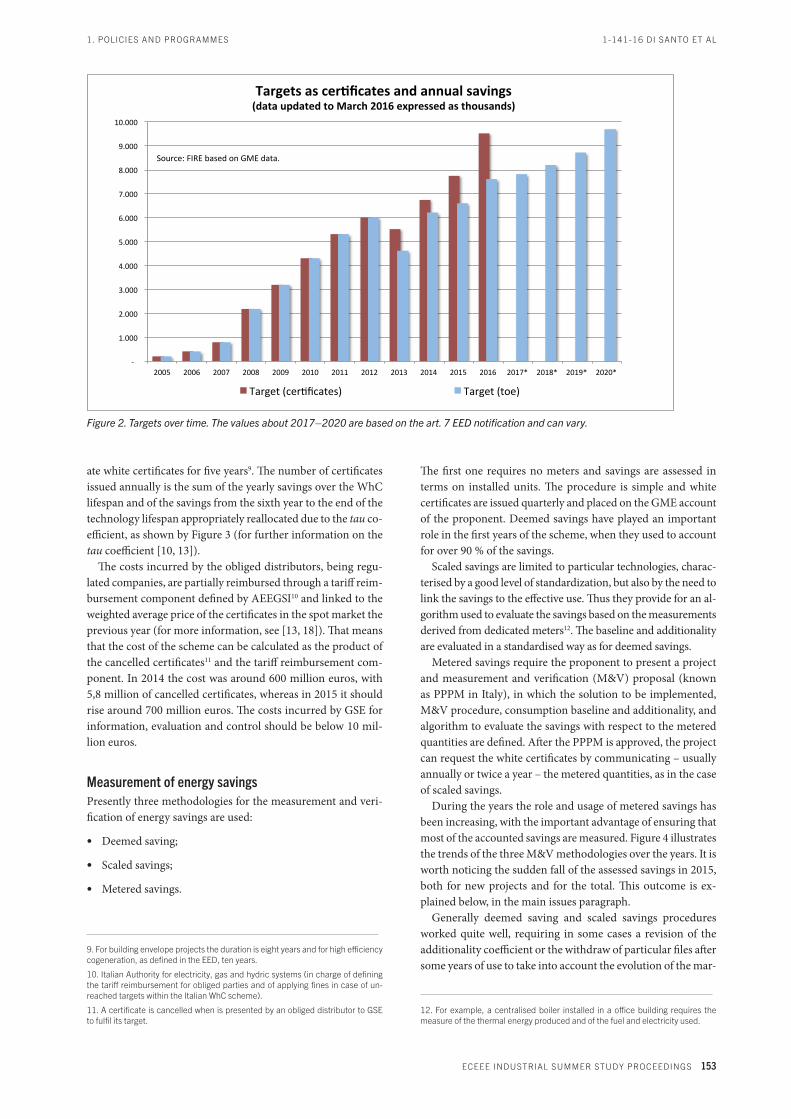
Each certificate corresponds to one toe of annual savings. Fig-ure 2 shows the annual target expressed both as number of cer-tificates and as toe. The difference between the two values is due both to the tau coefficient and to an increasing amount of savings that will come from projects that don’t receive white certificates (e.g. interventions on the electricity and gas grids, savings related to mandatory energy audits for non SMEs and ISO 50001, etc.).
The savings are additional, meaning that only savings over a regulatory and market baseline are accounted for, and gener-
5. Global targets are split among the obliged distributors considering the energy delivered in the previous year by each of them.
6. Italian Energy systems manager (public company in charge of operating the Italian scheme).
7. Italian Energy market manager (public company owned by GSE in charge of the Italian power exchange IPEX and of environmental and energy efficiency markets, that is emission trading, green and white certificates).
8. In case of oversupply the price of the certificates drops and it can become dif-ficult to sell the owned certificates.
Figure 1. Basics of the Italian WhC scheme.
1. POLICIES AND PROGRAMMES
ECEEE INDUSTRIAL SUMMER STUDY PROCEEDINGS 153
1-141-16 DI SANTO ET AL
ate white certificates for five years9. The number of certificates issued annually is the sum of the yearly savings over the WhC lifespan and of the savings from the sixth year to the end of the technology lifespan appropriately reallocated due to the tau co-efficient, as shown by Figure 3 (for further information on the tau coefficient [10, 13]).
The costs incurred by the obliged distributors, being regu-lated companies, are partially reimbursed through a tariff reim-bursement component defined by AEEGSI10 and linked to the weighted average price of the certificates in the spot market the previous year (for more information, see [13, 18]). That means that the cost of the scheme can be calculated as the product of the cancelled certificates11 and the tariff reimbursement com-ponent. In 2014 the cost was around 600 million euros, with 5,8 million of cancelled certificates, whereas in 2015 it should rise around 700 million euros. The costs incurred by GSE for information, evaluation and control should be below 10 mil-lion euros.
Measurement of energy savingsPresently three methodologies for the measurement and veri-fication of energy savings are used:
• Deemed saving;
• Scaled savings;
• Metered savings.
9. For building envelope projects the duration is eight years and for high efficiency cogeneration, as defined in the EED, ten years.
10. Italian Authority for electricity, gas and hydric systems (in charge of defining the tariff reimbursement for obliged parties and of applying fines in case of un-reached targets within the Italian WhC scheme).
11. A certificate is cancelled when is presented by an obliged distributor to GSE to fulfil its target.
The first one requires no meters and savings are assessed in terms on installed units. The procedure is simple and white certificates are issued quarterly and placed on the GME account of the proponent. Deemed savings have played an important role in the first years of the scheme, when they used to account for over 90 % of the savings.
Scaled savings are limited to particular technologies, charac-terised by a good level of standardization, but also by the need to link the savings to the effective use. Thus they provide for an al-gorithm used to evaluate the savings based on the measurements derived from dedicated meters12. The baseline and additionality are evaluated in a standardised way as for deemed savings.
Metered savings require the proponent to present a project and measurement and verification (M&V) proposal (known as PPPM in Italy), in which the solution to be implemented, M&V procedure, consumption baseline and additionality, and algorithm to evaluate the savings with respect to the metered quantities are defined. After the PPPM is approved, the project can request the white certificates by communicating – usually annually or twice a year – the metered quantities, as in the case of scaled savings.
During the years the role and usage of metered savings has been increasing, with the important advantage of ensuring that most of the accounted savings are measured. Figure 4 illustrates the trends of the three M&V methodologies over the years. It is worth noticing the sudden fall of the assessed savings in 2015, both for new projects and for the total. This outcome is ex-plained below, in the main issues paragraph.
Generally deemed saving and scaled savings procedures worked quite well, requiring in some cases a revision of the additionality coefficient or the withdraw of particular files after some years of use to take into account the evolution of the mar-
12. For example, a centralised boiler installed in a office building requires the measure of the thermal energy produced and of the fuel and electricity used.
-
1.000
2.000
3.000
4.000
5.000
6.000
7.000
8.000
9.000
10.000
2005 2006 2007 2008 2009 2010 2011 2012 2013 2014 2015 2016 2017* 2018* 2019* 2020*
Targetsascer*ficatesandannualsavings(dataupdatedtoMarch2016expressedasthousands)
Target(cer7ficates) Target(toe)
Source:FIREbasedonGMEdata.
Figure 2. Targets over time. The values about 2017–2020 are based on the art. 7 EED notification and can vary.

1-141-16 DI SANTO ET AL
154 INDUSTRIAL EFFICIENCY 2016
1. POLICIES AND PROGRAMMES
ket and the diffusion of the related technologies (e.g. compact fluorescent lamps, aerators, etc.) [4, 13, 16]. Nevertheless some particular technologies procedures were characterised by im-portant issues. Some of them, such as heat pumps for the resi-dential sector or natural gas cars, showed little use due to the cost of the requested documents with respect to the expected value of the white certificates. Others, on the contrary, had a large success due to some defects in the requirements, which translated in undesired effects13.
Metered savings worked quite well, increasing their share of the total savings over 80 %. The main issues that are under investigation are related to the energy consumption baseline14 (the new guidelines will introduce stricter requirements on its calculation) and to the reliability of the installed meters.
ResultsThe Italian WhC scheme in over ten years has been capable of producing impressive results in terms of total savings, data collection, qualification of market operators. The main figures [16, 20]:
• targets from 200 ktoe in 2005 to 7,600 ktoe in 2016;
• over 22 millions cumulated savings and 36 millions issued white certificates till 2015;
13. For example, due to a flaw in the UPS file, some rogue traders started giving low quality UPS for free to end users, aiming at the good margin granted by WhC to such low cost devices. The file was then withdrawn by the Ministry.
14. Please notice that with “baseline” we refer to the threshold that makes sav-ings additional (additionality baseline), whereas with “consumption baseline” we refer to the energy consumption before the energy efficiency intervention. The two baselines can coincide in particular cases, but usually the additionality baseline is higher as the consumption baseline due to minimum requirements, technology evolution and market trends.
• ≈85 % of savings are metered and ≈82 % are metered saving projects (in 2007 ≈90 % were deemed savings);
• ≈62 % of the savings assessed in 2015 are related to the in-dustrial sector;
• average dimension of each proposal between 300 and 550 toe in the last three years;
• 4,693 operators registered in 2015 to the GSE platform, of which 1,233 presented projects;
• ESCOs have been the main actor in presenting projects both in terms of registered subjects (3,693), proposals (96 %) and toe (70 %, whereas 25 % come from companies with energy manager);
• flexible managing agencies needed to deal with the growing proposals (13,717 requests for certificates presented in 2014 and 1,034 PPPMs VS ≈150 in 2007 and ≈550 in 2012);
• cost effectiveness is high (0.017 euro/kWh according to ENEA15 annual report on energy efficiency).
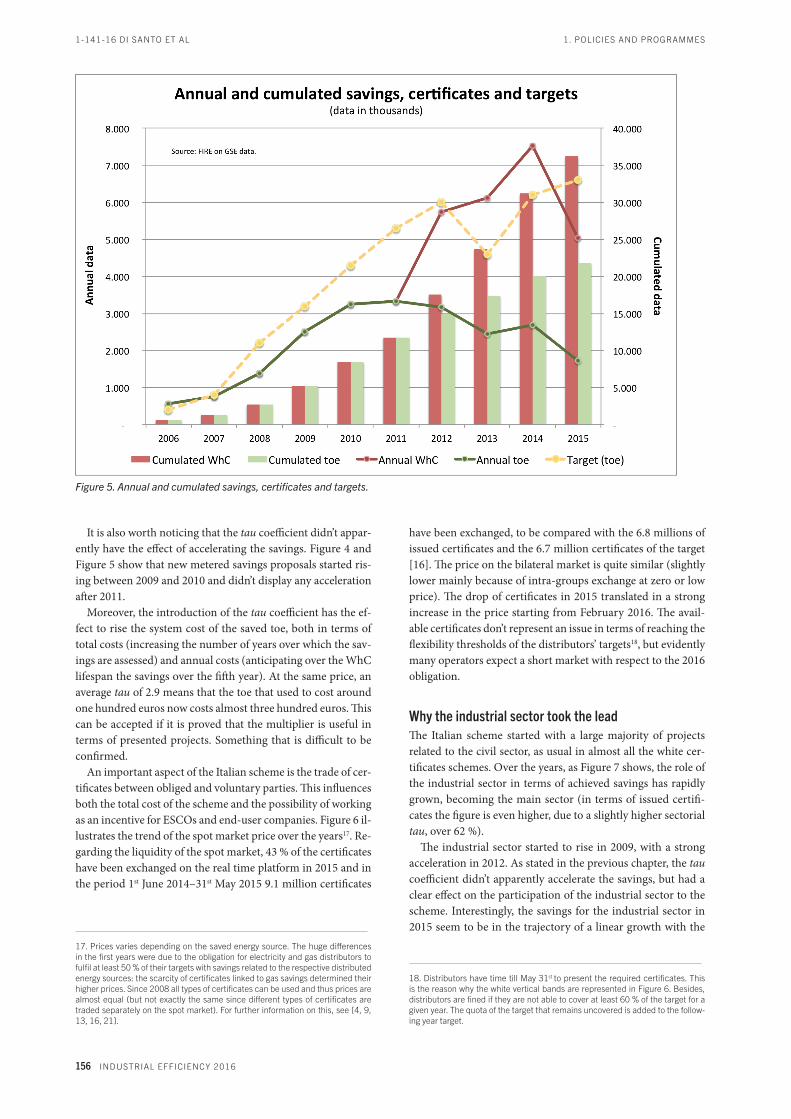
Figure 5 illustrates the trend of the issued certificates and sav-ings, compared with the annual targets. In 2015 the average tau coefficient has been equal to 2.9 (calculated as total annual certificates divided by total annual toe). Since the introduction of this coefficient in 2011 the value of annual issued certificates is no more equal to the value of the savings, due to the anticipa-tion of future savings.
15. Italian Agency for new technologies, energy and environment (in charge of information campaigns for WhC and supporting GSE in verifications, audits and controls).
Figure 3. The tau coefficient explained.

1. POLICIES AND PROGRAMMES
ECEEE INDUSTRIAL SUMMER STUDY PROCEEDINGS 155
1-141-16 DI SANTO ET AL
Two effects emerge from Figure 5: the drop of certificates in 2015, after years of continuous improvements, and the reduc-tion trend of annual savings starting from 2012. The first is a consequence of the 2012 guidelines that allowed the presenta-tion of PPPMs only before the start of the EE project begin-ning with 201316. The second is most probably due to a mix
16. Previously there was no particular limit: it was for example possible to present a project implemented even 3–4 years before. The reason of this choice is related to the long time it took to launch the scheme (2005 instead of 2002 as provided by the first ministerial decrees) and to the need to allow project implemented in the meantime to access the mechanism.
of factors: completion of the five years lifespan for many large projects, less low hanging fruits remain to be collected in the industrial sector, the evolution of the market reduced the addi-tionality of some solutions (e.g. heat recovery), the new guide-lines increased the period of time from the submission of the PPPM to the request of certificates, the introduction of stricter rules in the verification and control activities. This decline of the annual savings is unlikely to be reversed considering the evolution of these factors. It will be interesting to see if the sav-ings’ trend will be a continuous decline or a stabilisation in the next years.
Figure 4. Contribution of the different M&V procedures to the total savings.
Table 1. Comparison among the different M&V methods.
Deemed savings Scaled savings Metered savings
The method is easy to use and facilitates the evaluation.
Savings are not measured and monitoring can be complex if multiple solutions are considered.
Required documentation: choice to go easy or bureaucratic, which usually implies a failure, unless the incentive is very high.
On field controls are expensive.
Effort required to evaluate baselines, additionality, and other needed information.
High cost-effectiveness.
Possibility to pre-evaluate EE products in order to ensure the required performance.
The method is easy to use and facilitates the evaluation.
Savings are measured.
Required documentation: choice to go easy or bureaucratic, which usually implies a failure, unless the incentive is very high.
On field controls are usually a viable option.
Effort required to evaluate baselines, additionality, algorithms and meters to be used, and the other needed information.
High cost-effectiveness.
Simplified monitoring plans?
The method is usually complex, especially if additionality or detailed adjustments are present.
Savings are measured.
Required documentation: is usually substantial, but the size of the project allows it.
On field controls are usually a viable option.
Effort required to evaluate baselines, additionality, algorithms and meters to be used, and the other needed information for both the proponents and the evaluators. Shall data be available for everybody?
Very flexible, but potentially costly and complicated (viable for high targets).
1-141-16 DI SANTO ET AL
156 INDUSTRIAL EFFICIENCY 2016
1. POLICIES AND PROGRAMMES
It is also worth noticing that the tau coefficient didn’t appar-ently have the effect of accelerating the savings. Figure 4 and Figure 5 show that new metered savings proposals started ris-ing between 2009 and 2010 and didn’t display any acceleration after 2011.
Moreover, the introduction of the tau coefficient has the ef-fect to rise the system cost of the saved toe, both in terms of total costs (increasing the number of years over which the sav-ings are assessed) and annual costs (anticipating over the WhC lifespan the savings over the fifth year). At the same price, an average tau of 2.9 means that the toe that used to cost around one hundred euros now costs almost three hundred euros. This can be accepted if it is proved that the multiplier is useful in terms of presented projects. Something that is difficult to be confirmed.
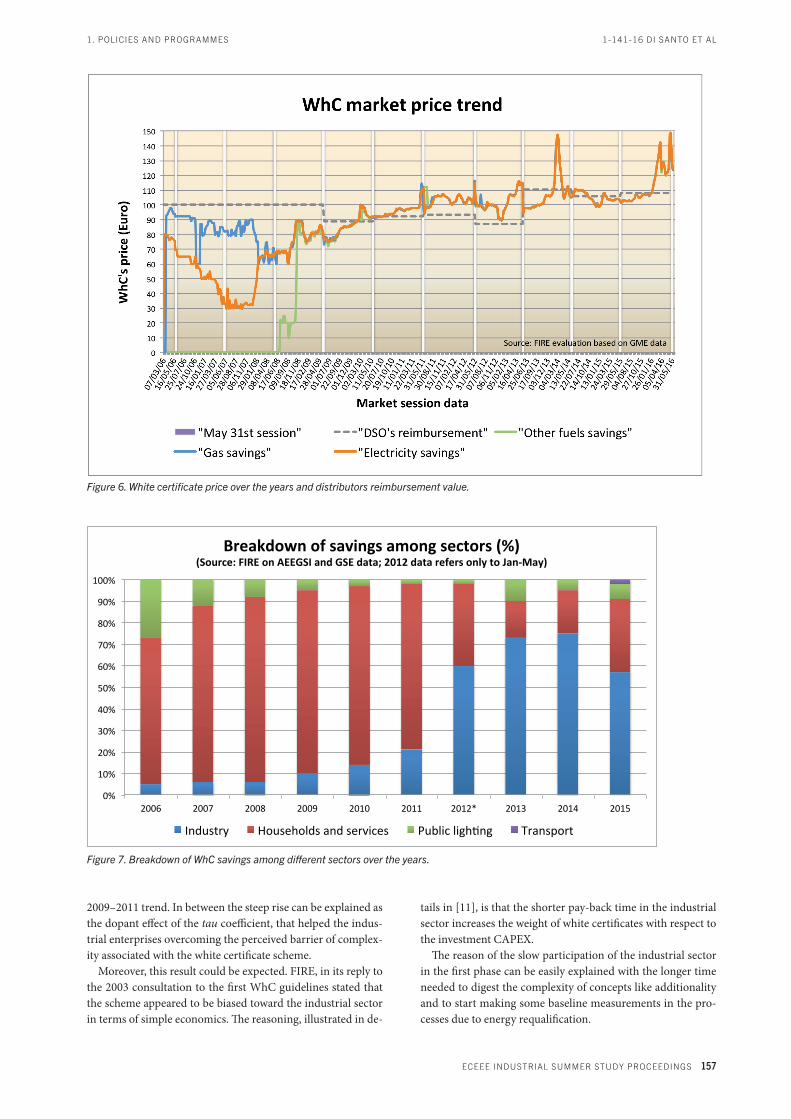
An important aspect of the Italian scheme is the trade of cer-tificates between obliged and voluntary parties. This influences both the total cost of the scheme and the possibility of working as an incentive for ESCOs and end-user companies. Figure 6 il-lustrates the trend of the spot market price over the years17. Re-garding the liquidity of the spot market, 43 % of the certificates have been exchanged on the real time platform in 2015 and in the period 1st June 2014–31st May 2015 9.1 million certificates
17. Prices varies depending on the saved energy source. The huge differences in the first years were due to the obligation for electricity and gas distributors to fulfil at least 50 % of their targets with savings related to the respective distributed energy sources: the scarcity of certificates linked to gas savings determined their higher prices. Since 2008 all types of certificates can be used and thus prices are almost equal (but not exactly the same since different types of certificates are traded separately on the spot market). For further information on this, see [4, 9, 13, 16, 21].
have been exchanged, to be compared with the 6.8 millions of issued certificates and the 6.7 million certificates of the target [16]. The price on the bilateral market is quite similar (slightly lower mainly because of intra-groups exchange at zero or low price). The drop of certificates in 2015 translated in a strong increase in the price starting from February 2016. The avail-able certificates don’t represent an issue in terms of reaching the flexibility thresholds of the distributors’ targets18, but evidently many operators expect a short market with respect to the 2016 obligation.
Why the industrial sector took the leadThe Italian scheme started with a large majority of projects related to the civil sector, as usual in almost all the white cer-tificates schemes. Over the years, as Figure 7 shows, the role of the industrial sector in terms of achieved savings has rapidly grown, becoming the main sector (in terms of issued certifi-cates the figure is even higher, due to a slightly higher sectorial tau, over 62 %).
The industrial sector started to rise in 2009, with a strong acceleration in 2012. As stated in the previous chapter, the tau coefficient didn’t apparently accelerate the savings, but had a clear effect on the participation of the industrial sector to the scheme. Interestingly, the savings for the industrial sector in 2015 seem to be in the trajectory of a linear growth with the
18. Distributors have time till May 31st to present the required certificates. This is the reason why the white vertical bands are represented in Figure 6. Besides, distributors are fined if they are not able to cover at least 60 % of the target for a given year. The quota of the target that remains uncovered is added to the follow-ing year target.
Figure 5. Annual and cumulated savings, certificates and targets.
1. POLICIES AND PROGRAMMES
ECEEE INDUSTRIAL SUMMER STUDY PROCEEDINGS 157
1-141-16 DI SANTO ET AL
2009–2011 trend. In between the steep rise can be explained as the dopant effect of the tau coefficient, that helped the indus-trial enterprises overcoming the perceived barrier of complex-ity associated with the white certificate scheme.
Moreover, this result could be expected. FIRE, in its reply to the 2003 consultation to the first WhC guidelines stated that the scheme appeared to be biased toward the industrial sector in terms of simple economics. The reasoning, illustrated in de-
tails in [11], is that the shorter pay-back time in the industrial sector increases the weight of white certificates with respect to the investment CAPEX.
The reason of the slow participation of the industrial sector in the first phase can be easily explained with the longer time needed to digest the complexity of concepts like additionality and to start making some baseline measurements in the pro-cesses due to energy requalification.
Figure 6. White certificate price over the years and distributors reimbursement value.
0%
10%
20%
30%
40%
50%
60%
70%
80%
90%
100%
2006 2007 2008 2009 2010 2011 2012* 2013 2014 2015
Breakdownofsavingsamongsectors(%)(Source:FIREonAEEGSIandGSEdata;2012datarefersonlytoJan-May)
Industry Householdsandservices PubliclighBng Transport
Figure 7. Breakdown of WhC savings among different sectors over the years.

1-141-16 DI SANTO ET AL
158 INDUSTRIAL EFFICIENCY 2016
1. POLICIES AND PROGRAMMES
Main issuesAn incentive scheme running over a long-time obviously has to deal with various challenges during the years. The revisions of the guidelines over the years – in 2004, 2007, 2011, and 2012 – have been essential to overcome such problems in the past, ensuring the evolution and growth of the scheme. The introduction of the new guidelines, expected since 2014, has been delayed for many reasons. The effect is that presently the scheme is facing some important challenges in the last decade. The main ones are:
• the reduction of the annual savings;
• the rise of the total cost of the scheme;
• the shared responsibilities between ESCOs and clients;
• the difficulties in evaluating the consumption baseline and the additionality in the industrial sector;
• the uncertainty related to the introduction of the new guide-lines and targets;
• the materiality of the scheme for certain projects.
The first point has been discussed in the previous chapter. The rise of the cost of the scheme is not per se a negative effect, since it can be justified by the rising targets and by more complex projects. But of course it means that the tariff component that every end-user pays to reimburse part of the costs incurred by the distributors increase over time. The drop of certificates in the last year has apparently reduced the cost of the system, but of course this can be offset by the increase in the white certificates price. Figure 6 shows the increase of the WhC price in the first five months of 2016 due to a number of available certificates lower than expected by market operators. The effect has been an increase of the weighted average price from 105 to 116 euro/toe.
In case of non conformities or other problems concerning a proposal, with a request to return the money to GSE, problems can arise if the proponent is an ESCO. The issue can be looked at from two sides. On the one hand, if an end-user changes something of the project with respect to the proposal – or, worse, the plant is being shut down – the ESCO can be harmed without having the possibility to avoid the issue. On the other hand, in such cases GSE will request the ESCO to return the money; money that almost entirely have been forwarded to the end-user19. This can translate in serious financial problems for the ESCO, especially in case of large projects. To reduce such problems it is fundamental to have adequate contracts in place between the parties, an obvious consideration that unfor-tunately many small ESCOs have not taken into account. The new guidelines will try to overcome this issue, possibly asking for financial guarantees (e.g. sureties) for large projects.
The measurement of the energy savings is a complex activ-ity. Not surprisingly protocols such as the IPMVP20 have been created over the years. In the case of an EEO and metered sav-ings, the issue is magnified since a common approach is needed and it is impossible to opt for different level of complexity and
19. ESCOs usually keep a small percentage of the issued certificates, in the order of some percentage point.
20. For information about the IPMVP protocol: www.evo-world.org.
precision on a case by case method. Besides there is the need to evaluate the additionality of the single projects, an activity that can appear relatively easy in the household and service sec-tors, but that can be quite difficult in the industrial one. Both these aspects are under discussion: the consumption baseline since in the last decade sometimes baselines established on an insufficient set of data have been accepted21, the additionality because there are a lot of variables to be considered and it is of-ten complex to compare different production processes even in the same industrial sector22. Apart from the choices of MiSE23 in the new guidelines in terms of more precise requirements, it is fundamental to dedicate time to meetings with the industrial stakeholder, an approach that GSE has started to adopt in 2016.
The uncertainties about the new targets and guidelines is an important factor, especially since the more rigorous approach in terms of verification and control adopted by GSE has disori-ented many operators. This will be discussed in the next chap-ter.
Finally, the materiality of the scheme has never been evalu-ated in details. In the first phase, with extremely convenient deemed saving files, the decision to invest in those technologies was totally driven by the scheme and thus the materiality was really high. In the last year, with many convenient industrial projects, there is the possibility that some projects are carried out just as they are attractive on their own, even without the additional benefit of the white certificates. It is impossible to evaluate the materiality on the basis of some interviews or eco-nomic evaluation; nevertheless it is an issue that should deserve more attention.
Verification and controlAs discussed in the previous chapter, verification and control (V&C) is an important and delicate activity within any EEO scheme. Most of the measures analysed under the ENSPOL project don’t have in place strong procedures on this respect, and most of the schemes consider mainly documental controls and no or very limited on-site controls. This can be explained in many cases since most of the admitted solutions are related to deemed savings in the building sector, something difficult and costly to approach with on-site controls due to the diffuse nature of the interventions. Nevertheless, this represent an is-sue since no controls means higher risk of non conformities or non adequate installations.
For almost ten years in Italy the situation has been similar to other EEO schemes: all the proposals were subjected to a docu-mental analysis, but then no on-site controls. The guidelines in-troduced in 201224 stressed the importance of V&C, requiring a relevant action both on documental analysis (verification) and on detailed documental and on-site control. Figure 8 represents the present procedure.
21. That is based on a limited month of ex-ante measurements and on insufficient or questionable adjustment factors.
22. Also the reference to the best available technologies of the industrial emis-sion directive (IED, formerly IPPC) sometimes is not easy, especially for small and medium enterprises.
23. Italian Ministry for Economic Development (in charge of defining the Italian scheme targets and guidelines).
24. Ministerial decree 28 December 2012.

1. POLICIES AND PROGRAMMES
ECEEE INDUSTRIAL SUMMER STUDY PROCEEDINGS 159
1-141-16 DI SANTO ET AL
counter informing on the situation in terms of presented, veri-fied and approved projects is updated on the main GSE website every week (Table 2 shows some data extracted in April 2016).
The main issues incurred in the verification and control pro-cess are:
• requests for additional information and/or documentation not listed in the deemed saving and scaled saving files or in the PPPMs;
• request for proof of CAPEX of the implemented project and the cost of energy for PPPMs;
• issues linked to the shared responsibilities;
• issues related to the closure or modification of plants prior the end of the technical life.
Verifications before the release of 2012 guidelines were mainly related to the information and documentation indicated in the files or PPPMs. After the introduction of the new guide-lines, GSE – which assumed the management of the scheme in 2013 – started a more rigorous approach. In particular, many
All the proposals are investigated prior to recognize the re-quested white certificates. This ensures that the requested doc-umentation has been presented and that the project is sound and compliant with the deemed saving or scaled saving files or with the approved PPPM. GSE can then subject the project to a documental and/or on-site control. The projects to be con-trolled are indicated in a plan submitted annually to MiSE.
In 2014 GSE started with 56 controls (11 on-site), includ-ing high efficiency cogeneration. In 2015 the controls raised to 146 (23 on-site), of which 95 were completed and 59 had a negative outcome, resulting in an administrative procedure to recover the money received by the proponents25. In an ef-fort to increase transparency, GSE created a website to monitor the results of all the controls, including the ones referred to re-newable energy sources, CHP, and other support schemes26. A
25. It should be noted that GSE chose categories of projects that were expected to show issues. So this figure should not be considered a picture of the general situation.
26. The website is http://bancadativerifiche.gse.it. To give some figure, in 2014 GSE made overall 3,792 controls (3,008 on-site).
Figure 8. Control and verification process activities. Source: FIRE.
Table 2. Status of the proposals presented since 2015 at the end of April 2016.
Proposals PPPMRequests of certificates Total
Verification completed
Approved
Rejected
Other (suspended, retired or not receivable)
752
467
261
24
10,037
9,622
251
164
10,789
10,089
512
188
Under verification 247 728 975
Total 999 10,765 11,764

1-141-16 DI SANTO ET AL
160 INDUSTRIAL EFFICIENCY 2016
1. POLICIES AND PROGRAMMES
On the issue of the revision of the tau coefficient, the con-sultation document proposes two options: reduction of the technical life up to 15 years, with recognition of white certifi-cates for the same period of time, or certificates life of 5 years with the introduction of a rewarding factor between 1.5 and 2.0 for complex projects with long pay-back time. The first option – which appears to be the chosen one – has the advantage of avoiding issues in case of anticipated shut down of the incen-tivised plant (simply no more requests for certificates will be issued), while guaranteeing more certificates for complex and long time projects. The disadvantage with respect to the present situation is that is even more difficult to rely on the certificates as an incentive, since on longer periods of time the uncertain-ties on the WhC price trends are higher.
In relation to additionality and consumption baseline, MiSE anticipated that more defined criteria will be introduced in or-der to reduce uncertainty and litigation. In the consultation was also proposed to consider the incurred investment cost as an element to define the market baseline on, in order to avoid the over-compensation of some investments. As illustrated in the previous chapter, GSE opted to put in place this rule on its own.
With regard to the eligibility of technological solutions, MiSE proposed to exclude the civil sector technologies already covered by alternative measures (for rationality purposes, since it is already forbidden to access more than one support scheme for the same project) and to introduce or expand the possibil-ity to present interventions linked to electricity and water net-works, mobility and transport, and behavioural changes, with methods to be defined in the new guidelines. Finally, for renew-able sources it is expected to take into account only the energy efficiency improvement, and not the replacement of fossil fuels (thus decisively reducing the impact of these sources, especially in the industrial sector).
In terms of ownership of the project, MiSE proposed that only end-users may submit proposals, unless ESCOs play an active role in the implementation and management of the pro-ject (e.g. with an energy performance contract, EPC), and only in presence of adequate economic and financial capacity com-pared with the size of the project. The alternative is to continue to accept ESCOs proposal by requiring adequate securities, but the result will be similar to the first option, considering the cost of securities. So in the end the result should be a limitation of the role of ESCO as proponents, leaving nevertheless the possi-bility to act as consultants. The idea is to leave open the support for certified ESCOs to propose and use EPC contracts.
Finally, the document proposes the introduction of a new methodology for the assessment of savings (PPPMS, or stand-ardised PPPM, designed for widespread homogeneous projects with possibility of metering on a sample of interventions), more stringent criteria for the measurement of the savings for me-tered projects, the possibility of having discounts on the fee to pay to submit a proposal for projects linked to the energy audits carried out under EED art. 8, and strengthened verification and control activities.
The measures proposed in the consultation document ap-pear to solve many of the existing problems and to increase the cost effectiveness and materiality of the scheme. Nevertheless, the effects on the trend of proposals and certified savings are all to be seen, depending on the actual guidelines and on the capability of involving new projects and solutions.
small ESCOs found it difficult to provide the additional infor-mation requested by GSE, due to a too simplistic approach to the scheme27. This is the reason of the high percentage of non conformities cited above. Nevertheless, the new approach, after this initial traumatic phase, will traduce in an improved quality of the projects and of the proposals, and will also favour the qualification of small ESCOs.
Among the additional information, especially for requests of white certificates linked to industrial PPPMs, GSE started asking for economic information, such as the CAPEX of the implemented project and the cost of energy. The resulting pay-back time was used28, together with the regulatory and market baseline, to determine the additionality. This request has been largely contested by ESCOs and large companies, since previ-ously it was an optional data and the 2012 guidelines didn’t re-quire it29. GSE in practice anticipated one of the proposal con-tained in the consultation document about the new guidelines, aimed at excluding from the scheme projects characterised by a short pay-back time. Nevertheless, many legal disputes start-ed on this aspect. It is worth noticing that the possible issue of over-incentivised projects was presented by us both in an ECEEE and in an IEPPEC papers in 2014 [10, 11].
As mentioned in the previous chapter, when a project is pre-sented by an ESCO some issue may arise in case of non con-formities or of modification to the project. This created some problems in terms of controls and potentially it can be a serious flaw of the system if not resolved with the new guidelines.
The last point is due to the tau coefficient. Since it anticipates the savings from the sixth year to the technical lifetime of the project, if this is stopped before reaching the expected dura-tion (usually 15 or 20 years) GSE will require the return of the money received and linked to the tau coefficient. This is one of reasons why MiSE will eliminate the tau coefficient in the new guidelines.
The new scheme guidelines consultationIn Summer 2015 MiSE opened a consultation on the directions to follow for the new WhC scheme guidelines. The reasons be-hind the introduction of new guidelines are summarized in the document in consultation [16]. The main ones are: the need to increase the effectiveness of the scheme, the uncertain defini-tion of additionality in the industrial sector, the need to review the technical life under which white certificates are generated, the responsibilities on project management when the proposals are not presented by the end user, the contrast of speculative behaviour. While writing this paper the new guidelines are yet to come, so the main points under consultation are discussed with some news gathered at MiSE public presentation during FIRE annual conference [22].
27. As an example, some ESCOs had to withdraw their proposals since they were not capable to provide documents such as the certification of performance of the installed windows or insulation materials, only because the document were not mentioned in the deemed saving file.
28. There is no public available information on the projects’ pay-back time, apart from what illustrated in [11].
29. For example in a workshop on April 6th AICEP, an association of energy inten-sive industries, declared that of 59 projects presented in 2015 by its members – with a potential of 275,000 tep/year – 50 % of the new PPPMs and 30 % of the request of certificates related to accepted PPPMs have not been approved by GSE.

1. POLICIES AND PROGRAMMES
ECEEE INDUSTRIAL SUMMER STUDY PROCEEDINGS 161
1-141-16 DI SANTO ET AL
with the reports on the socio-economical frameworks in the examined countries [13]. An interesting outcome of the ENS-POL project has been the increased sharing of information and experiences among Member States policy makers, even beyond the initiatives provided by the project (such as the EU observa-tory, the multi-national workshops and the webinars).
Usually EEO schemes are complex and need some years of fine tuning to work in the desired way (they can also fail, ob-viously, as some cases demonstrate [13]. Besides, alternative measures (such as grants, loans, tax deductions, etc.) can be preferable to reach results in a short time, i.e. 3–4 years. So the pros and cons of an EEO should be adequately investigated. If the objective is to create a support scheme capable of in-volving all the sectors and the technologies, then white certifi-cates can prove effective and flexible. One of the experiences derived from the ENSPOL project is that there is no scheme that is intrinsically more cost-effective than others, since much depends on how, where, and when it is implemented. What makes the difference is the care and the commitment that policy makers and managing agencies put into the action (see also [13,14,19]).
Thus many issues will have to be faced over the years in such schemes, but they can be overcome, provided timely interven-tions from policy makers and a large involvement of the stake-holder community are ensured. As shown also by the other schemes analysed under the ENSPOL project, a continuous improvement approach is fundamental to reach the targets and ensure the higher cost effectiveness.
References and useful links
REFERENCES[1] P. Bertoldi, S. Rezessy, “Tradable certificates for energy
savings (white certificates) – theory and practice”, 2006, European Commission Joint Research Centre, Institute for Environment and Sustainability, June 2006.
[2] R. Haas, N. Sagbauer, G. Resch, “What can we learn from tradable green certificate markets for trading white certificates?”, eceee 2009 Summer Study – Act! Innovate! Deliver! Reducing energy demand sustainably, June 2009.
[3] N. Eyre, M. Pavan, L. Bodineau, “Energy company obligations to save energy in Italy, the UK and France: what have we learnt?”, eceee 2009 Summer Study – Act! Innovate! Deliver! Reducing energy demand sustainably, June 2009.
[4] D. Di Santo, D. Forni, V. Venturini, E. Biele, “The White Certificate scheme: the Italian experience and proposals for improvement”, eceee 2011 Summer Study – Energy efficiency first: The foundation of a low-carbon society, June 2011.
[5] “European Workshop on Experiences and Policies on Energy Saving Obligations and White Certificates” proceedings, http://re.jrc.ec.europa.eu/energyefficiency/events/WhC_Workshop.htm, 27–28 January 2011.
[6] RAP (The Regulatory Assistance Project), “Best Practices in Designing and Implementing Energy Efficiency Obligation Schemes. Research Report Task XXII of the International Energy Agency Demand Side Management Programme”, June 2012.
ConclusionsThe Italian experience with white certificates is a positive one and shows that such a scheme can have many pluses:
• flexibility, in terms of eligible technologies, sectors and mar-ket operators, etc.;
• capacity, being capable of covering a good percentage of the national targets30;
• market support, since voluntary parties can play a leading role and use such a scheme both to increase their know-how in complex sectors like the industry and to capitalize and start offering advanced energy services, such as EPC;
• policy making support, due to the huge number of valuable data collected through PPPMs;
• statistics, in terms of assessment of metered energy savings.
On the other hand some points should be considered:
• the complexity is high, especially involving the industrial and transport sectors, and worthy the effort only in case of ambitious targets;
• appreciable results will require time to , so the scheme should be designed with a medium or long time vision;
• as in other schemes, there is the need of an enlarging man-agement structure and care should be taken in writing the rules as to reduce the risk to have all the proposals submit-ted in the same period of time to avoid unmanageable peaks in the verification activities;
• information and support activities31 are vital to ensure the success of the scheme.
The idea to make comparisons with other EEO schemes is in-triguing, and many attempts have been made in this direction by many organizations (e.g. [1, 5, 6, 9, 12, 14, 20]) and projects (like the already mentioned ENSPOL [13, 14, 19]). The wide range of different parameters to be taken into account, however, makes such comparison quite difficult and usually not effective, unless related to specific aspects of particular schemes. Targets, obliged and voluntary parties, M&V procedures, controls, ad-mitted sectors and technologies, etc. are indeed defined in dif-ferent ways. It is not a surprise then that ambitious programs like the idea of defining the rules of a common EEO scheme cherished by a CEN/CLC JWG2 was abandoned in front of too many differences and options and transformed in a report on the existing EEOs [9].
Even assessing the cost effectiveness of a scheme is a difficult task, considering the aspects to consider (costs, sectors and technologies involved, targets, additionality and materiality, non energy benefits, etc.) and the lack of reliable information in many cases [12]. Nevertheless the analysis of so many schemes provides a lot of useful information for policy makers both on positive and negative factors, especially if evaluated together
30. MiSE stated in the notifications of art. 7 EED that WhC shall cover 60 % of the Italian 2020 targets.
31. Besides information and training activities, which are crucial, it is important to put in place workgroups to discuss complex issues such as baseline and additionality with the stakeholders. This will simplify and improve both the proposals submission and the verification activities.

1-141-16 DI SANTO ET AL
162 INDUSTRIAL EFFICIENCY 2016
1. POLICIES AND PROGRAMMES
[17] MiSE, “Proposte per il potenziamento e la qualifica del meccanismo dei Certificati Bianchi”, www.sviluppoeco-nomico.gov.it/images/stories/documenti/Proposte_ag-giornamento_meccanismo_CB.pdf, July 2015.
[18] Workshop “Workshop on G7 Energy Ministerial Conclu-sions”, Berlin, 11 November 2015.
[19] ENSPOL webinars on measurement and verification of energy efficiency savings, additionality and materiality, lessons learnt from EEOs and alternative approaches, obliged parties, costs and financing of EEOs, http://ens-pol.eu/events/webinars, 2015–2016.
[20] N. Labanca, P. Bertoldi, “Energy Savings Calculation Methods under Article 7 of the Energy Efficiency Di-rective”, http://publications.jrc.ec.europa.eu/repository/bitstream/JRC99698/report%20on%20eed%20art%207%20-%20publishable.pdf, January 2016.
[21] GSE, “Rapporto Annuale sul meccanismo dei Certificati Bianchi”, www.gse.it//it/CertificatiBianchi, March 2016.
[22] FIRE conference “Certificati bianchi: titoli di efficienza a portata di mano”, Roma, www.certificati-bianchi.com, 12 April 2016 (previous editions of the conference proceed-ings are also available on www.fire-italia.org).
LINKS OF INSTITUTIONS RELATED TO WHITE CERTIFICATES IN ITALY MiSE, Ministry of Economic Development, www.sviluppo-
economico.gov.itAEEGSI, Italian Authority for electricity, gas and hydric sys-
tems, www.autorita.energia.itGSE, Italian energy services operator, www.gse.itENEA, Italian Agency for new technologies, energy and envi-
ronment, www.enea.itGME, Italian energy market operator, www.mercatoelettrico.
orgRSE, Energy System Research center, www.rse-web.it
[7] “White certificate for the industrial sector”, D. Di Santo, D. Forni, E. Biele, ECEEE 2012 Industrial Summer Study – Industry: A third of Europe’s energy use, September 2012.
[8] E. Biele, S. D’Ambrosio, D. Di Santo, G. Tomassetti, “Metodo a consuntivo: analisi delle proposte di progetto e di programma di misura 2005–2012”, www.fire-italia.org/analisi-delle-proposte-progetto-programma-misura-pppm-dei-certificati-bianchi-2005-2012, 2013.
[9] CEN/CLC/TR 16567 “White certificates”, CEN-CLC, 2013.[10] D. Di Santo, G. Tomassetti, D. Forni, E. Biele, S.
D’Ambrosio, “Italian white certificate: the shift towards industry”, eceee 2014 Industrial Summer Study – Retool for a competitive and sustainable industry, June 2014.
[11] D. Di Santo, G. Tomassetti, E. Biele, S. D’Ambrosio, “White certificates in industry: the Italian experience”, IEPPEC conference in Berlin, September 2014.
[12] Ricardo-AEA, “Study evaluating the national policy measures and methodologies to implement Article 7 of the Energy Efficiency Directive”, http://rekk.hu/downlo-ads/projects/Final%20Report%20on%20Article%207%20EED.pdf, February 2015.
[13] ENSPOL, reports on EEOs and alternative measures under art. 7 EED and on Member States context profiles, http://enspol.eu/results, 2015.
[14] P. Bertoldi et al, “How is article 7 of the Energy Efficiency Directive being implemented? An analysis of national en-ergy efficiency obligation schemes”, eceee 2015 Summer Study – First Fuel Now, June 2015.
[15] Workshop “Applying common methods and principles for calculating the impact of energy efficiency obligations schemes or other policy measures under Article 7 of the Energy Efficiency Directive”, Bruxelles, 10 June 2015.
[16] AEEGSI, “Stato e prospettive del meccanismo dei titoli di efficienza energetica”, www.autorita.energia.it/allegati/docs/15/309-15.pdf, June 2015.