white paper 8-17-09
TRANSCRIPT

8/6/2019 White Paper 8-17-09
http://slidepdf.com/reader/full/white-paper-8-17-09 1/87
1
A White Paper on
Performance, Cost Per Use, and Environmental Impactof Single-Use and Reusable Surgical Gowns & Drapes
McIlvaine CompanyCopyright© 2009 McIlvaine Company
8/6/2019 White Paper 8-17-09
http://slidepdf.com/reader/full/white-paper-8-17-09 2/87
2
TABLE OF CONTENTS
Subject Page Number
Cover Page
Table of Contents
Executive Summary
1
2
3
Scope 4
Business Environment 5
Performance Issues 6-14
Cost Per Use
Life Cycle Analysis
15-17
18-22
Laws and Regulations 23- 32
Sustainability
Green Opportunities
33
34 -38
Conclusions & Recommendations 39 -42
Appendix
i. List of Key Assumptions in Study
ii. List of Factors Not Included in Study
iii. Sensitivity of Results to Key Variablesiv. Nonwoven Suppliers
v. List of Laundries
vi. Municipal and Medical Waste Data
vii. Carbon Credits Overview
viii. Environmental Burden Worksheets
ix. Waste Handling References
x. Sustainability Overview
xi. Bio-Polymers
xii. Universal Burden Index
43 -87

8/6/2019 White Paper 8-17-09
http://slidepdf.com/reader/full/white-paper-8-17-09 3/87
3
EXECUTIVE SUMMARY
Findings presented in this White Paper include the following:
Performance: Performance is a strong suit for the single-use products. Performance includes
such attributes as barrier effectiveness, consistency, linting, flammability, comfort, and safety.
Cost per Use: The Study has determined that the cost-per-use for single-use products can be
competitive with reusable products. Key variables in cost-per-use are the quoted price for both
product types, and the laundering cycles and laundering costs reported by the healthcare provider
for reusable products. In recognition of these variables, this is reported as a conditional finding.
Environmental Burden: Environmental burden has been found by this Study to actually be
lower for single-use products than for reusable products. Environmental burden takes into
account inputs and outputs over the complete life cycle including the manufacture, utilization,
and disposal phases for both product types. Laundering is a substantial environmental burden for
reusable textiles that tips the balance in favor of single-use products.
Safety: Safety includes consideration of the increased exposure of healthcare workers and the
public to contaminated reusable garments from the additional processing required for laundering.
This is an area of potential advantage for single-use products.
Green Opportunities: The Study has determined that there are numerous long-term strategic
opportunities in the area of Sustainability and Green Initiatives for both single-use and reusable
products. These opportunities are in the following three areas:
Waste-to-energy use of disposed garments as a high btu pelletized fuel for kilns, dryers,
and coal-fired power plants
Bio-based (non-petroleum) polymers to address green issues in the supply chain, and
Carbon credits for offsetting the environmental impact (burden) for disposal of garments.
8/6/2019 White Paper 8-17-09
http://slidepdf.com/reader/full/white-paper-8-17-09 4/87
4
SCOPE
This Study was undertaken to establish a factual framework for the evaluation of single-use and
reusable surgical gowns and drapes. The scope of this study addresses the following key aspects
of single-use and reusable medical garments.
Functional efficacy (safety, barrier qualities, infection prevention)
Cost-per-use
Eco-efficiency and sustainability
Physiological (e.g. comfort) issues for doctors and nurses
Legal and regulatory issues
Other issues

8/6/2019 White Paper 8-17-09
http://slidepdf.com/reader/full/white-paper-8-17-09 5/87
5
BUSINESS ENVIRONMENT FOR MEDICAL TEXTILES
Nearly all aspects of the healthcare industry are being impacted by three major factors:
performance standards; cost containment mandates; and environmental regulations. These factors
will likely have considerable impact on the future of medical textiles including surgical gowns,drapes, and isolation gowns.
Performance Standards: The entire purpose for surgical gowns and drapes is to protect the
healthcare provider and the patient from infection. This must necessarily remain the number one
priority in surgical gown and drape selection.
Cost Containment: In the near term, it is likely that cost containment will be a powerful driver in
the purchasing habits of major healthcare institutions. The most important element in cost
containment is cost-per-use. Therefore, it is imperative that suppliers of medical garments
position themselves favorably in terms of cost-per-use to remain viable suppliers to the market.
Environmental Concerns: Environmental concerns present a long-term driver in this market, and
can be depended upon to tip the balance in favor of the supplier that can provide the
demonstrably more eco-efficient product. There are growing opportunities for eco-friendly
processes in the area of garment production, utilization, and disposal. Environmental legislation
represents a powerful force in market dynamics because it can alter customer purchasing habits
with the force of law.

8/6/2019 White Paper 8-17-09
http://slidepdf.com/reader/full/white-paper-8-17-09 6/87
6
PERFORMANCE ISSUES
Performance issues relating to single-use and reusable medical garments can be generally
summarized within the following six groups: barrier performance; reliability and consistency;
linting; flammability; comfort; and safety.
Barrier Performance
Reducing the risk of acquiring or transmitting
infection is the primary reason for the use of
protective medical garments in surgery and other
provider/patient interactions. A keyconsideration in the protective function of the
garment is barrier integrity. Barrier integrity
describes the ability of the garment to prevent
transmission of infectious material from the
healthcare provider to the patient, or vice-versa.
With the adoption of AAMI PB70:2003, critical zones in garments as well as quantitative tests
were established for evaluating barrier effectiveness. The standard defines four levels of protection ranging from Level 1 which provides basic dust or debris protection but no significant
moisture or liquid barrier, to Level 4 which provides an impervious barrier. The appropriate
level of protection depends on the medical procedure being undertaken.
Barrier Protection in Single-Use and Reusable
Medical Textiles
Single-use and reusable medical garments are rated
for barrier performance in accordance with AAMI
PB70 guidelines. Unlike single-use products,
reusable medical textiles undergo multiple wash
cycles that affect textile performance characteristics
over time. The effect of laundering operations is
Summary of Salient Points
Barrier performance for reusable
medical textiles is a function of the
number of laundering operations
“For reusable products, one must consider not only the characteristics
of the purchased items but also the
characteristics of the laundered
products.” [A Review of Single-Use
and Reusable Gowns and Drapes in
Health Care]
Figure 1. Performance vs. wash cycles for
reusable garments. Source: European Textile White
Paper “Mehr Wege fur die Zukunft”

8/6/2019 White Paper 8-17-09
http://slidepdf.com/reader/full/white-paper-8-17-09 7/87
7
illustrated in Figure 1. As shown, if the textile is laundered enough times, an end-of-compliance
state is reached that requires retirement or disposal of the garment. The actual end-of-
compliance state is not precisely definable in terms of wash cycles, and depends on such
variables as the degree of soiling, the nature of the contaminants, the nature of the laundering
operation (temperature of wash water, type of detergents and sterilizing agents) and whether rips
or tears are present in the garment. In an article titled ―A Review of Single-Use and Reusable
Gowns and Drapes in Health Care‖ by William A. Ritala, PhD/MPH, and David J. Weber,
MD/MPH it is stated that ―For reusable products, one must consider not only the characteristics
of the purchased items but also the characteristics of the laundered products. Maintaining
manufacturers‘ specifications is easier for single-use items compared with reusable products.‖
In a separate article titled ―Medical Fabrics Gain New Attention in Era of SARS‖ it is stated that
―When you compare reusables and disposables, single-use comes out on top….it is well
documented that the barrier properties of multiple-use product degrade with time. The data we
have shows single-use products as having very effective barriers against not only fluids, but
microbial transmission.‖
A 2007 research dissertation authored by Wei Cao at the Florida State University College of
Human Sciences contains the following quotation: ―Leonas (1998) evaluated the barrier efficacy
of five commercially available reusable surgical gowns and found that laundering reduced the
ability of the fabric to prevent the transmission of bacteria through the fabrics. Smith and Nichols
(1991) pointed out that reusable gowns eventually lose their barrier properties as a result of
abrasion and damage during wearing and the breakdown of the fabric during laundering and
sterilization.‖

8/6/2019 White Paper 8-17-09
http://slidepdf.com/reader/full/white-paper-8-17-09 8/87
8
Reliability & Consistency
The reliability and consistency of medical
garments used in healthcare is a prime concern.
The rise in hospital-borne infections in theUnited States and throughout the world has
heightened this concern. It has been estimated
that 1 in 20 patients in the United States contract
a hospital borne infection.
The quality control of the textile manufacturer defines product consistency, and modern
production techniques are in place to ensure extremely high first-use product quality for both
single-use and reusable garments.
However, findings show that single-use garments have advantages relative to reusable garments
in terms of consistency. Reusable garments are subject to a loss in barrier performance as a
function of wash cycles, as described in the previous section of this Study. This has an effect on
consistency, such that reusable garments must be inspected prior to each use to ensure that
performance has not been materially compromised in laundering. Single-use products are not
laundered and do not experience loss in barrier performance over time.
Summary of Salient Points
Reusable surgical gowns and drapesrequire inspection after each
laundering operation to ensure
continued fitness-for-purpose.
8/6/2019 White Paper 8-17-09
http://slidepdf.com/reader/full/white-paper-8-17-09 9/87
9
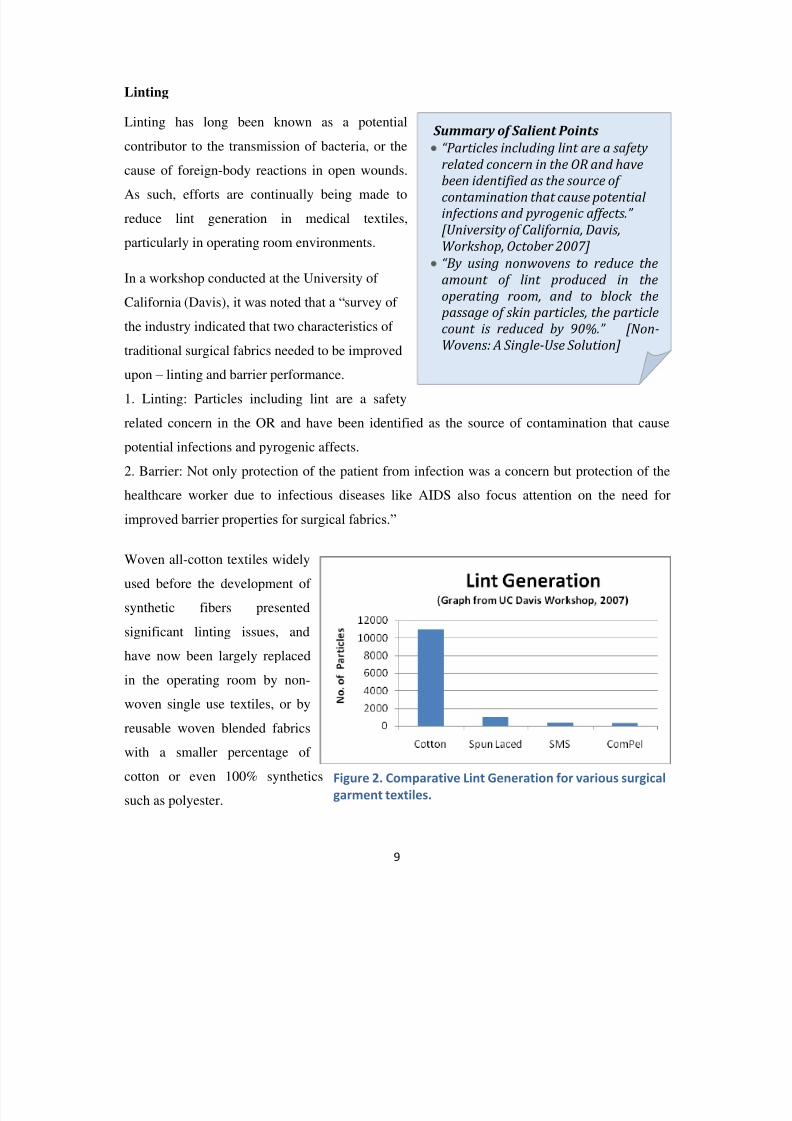
Linting
Linting has long been known as a potential
contributor to the transmission of bacteria, or the
cause of foreign-body reactions in open wounds.As such, efforts are continually being made to
reduce lint generation in medical textiles,
particularly in operating room environments.
In a workshop conducted at the University of
California (Davis), it was noted that a ―survey of
the industry indicated that two characteristics of
traditional surgical fabrics needed to be improvedupon – linting and barrier performance.
1. Linting: Particles including lint are a safety
related concern in the OR and have been identified as the source of contamination that cause
potential infections and pyrogenic affects.
2. Barrier: Not only protection of the patient from infection was a concern but protection of the
healthcare worker due to infectious diseases like AIDS also focus attention on the need for
improved barrier properties for surgical fabrics.‖
Woven all-cotton textiles widely
used before the development of
synthetic fibers presented
significant linting issues, and
have now been largely replaced
in the operating room by non-
woven single use textiles, or byreusable woven blended fabrics
with a smaller percentage of
cotton or even 100% synthetics
such as polyester.
Summary of Salient Points
“Particles including lint are a safety
related concern in the OR and have
been identified as the source of contamination that cause potential
infections and pyrogenic affects.”
[University of California, Davis,
Workshop, October 2007]
“ By using nonwovens to reduce the
amount of lint produced in the
operating room, and to block the
passage of skin particles, the particle
count is reduced by 90%.” [Non-
Wovens: A Single-Use Solution]
Figure 2. Comparative Lint Generation for various surgical
garment textiles.
8/6/2019 White Paper 8-17-09
http://slidepdf.com/reader/full/white-paper-8-17-09 10/87
10
The Gelbo Lint Test is a commonly used procedure for measuring the number of lint particles
removed from a fabric during repeated flexing. A low number is superior. Spunbond-
meltblown-spunbond (SMS) composite non-woven fabrics exhibit superior linting characteristics
(i.e., low lint generation), as illustrated in Figure 2.
In a March 2007 article titled ―Nonwovens: A Single-Use Solution‖ it was stated that ―…by
using nonwovens to reduce the amount of lint produced in the operating room, and to block the
passage of skin particles, the particle count is reduced by 90%.‖
It should be noted that 100% continuous filament polyester fiber construction for woven textiles
also provides low linting performance, and the superior performance of SMS construction is
relative to blended fabrics with some percentage of cotton.
8/6/2019 White Paper 8-17-09
http://slidepdf.com/reader/full/white-paper-8-17-09 11/87
11
Flammability
According to the AORN 2004 Standards,
Recommended Practices and Guidelines, ―gowns
and drapes should resist combustion. The O.R.
environment contains the necessary fuel, heat
source, and oxygen to cause a potential fire.‖
Oxygen-enriched OR environments, plus the use
of electrosurgical and electrocautery tools, and
laser surgical equipment may tend to heighten the
likelihood of operating room fires. It has been
estimated that there are between 50 to 100
operating room fires each year in the United
States.
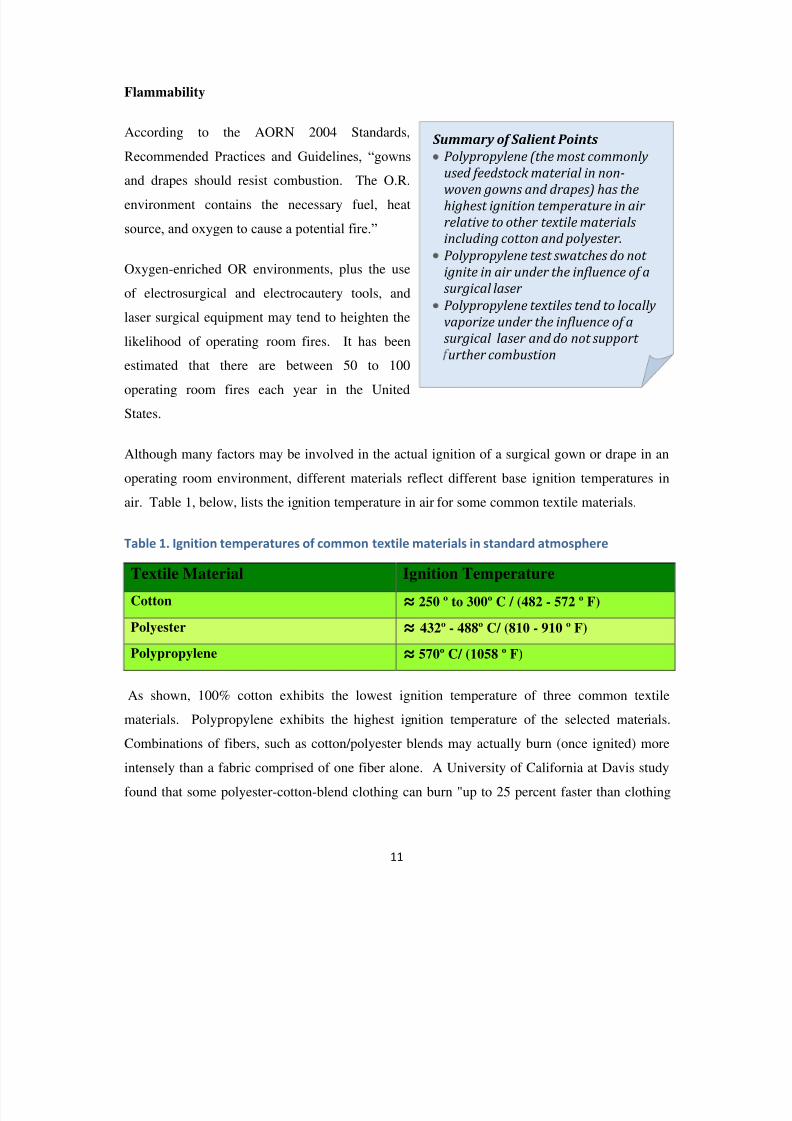
Although many factors may be involved in the actual ignition of a surgical gown or drape in an
operating room environment, different materials reflect different base ignition temperatures in
air. Table 1, below, lists the ignition temperature in air for some common textile materials.
Table 1. Ignition temperatures of common textile materials in standard atmosphere
Textile Material Ignition Temperature
Cotton ≈ 250 º to 300º C / (482 - 572 º F)
Polyester ≈ 432º - 488º C/ (810 - 910 º F)
Polypropylene ≈ 570º C/ (1058 º F)
As shown, 100% cotton exhibits the lowest ignition temperature of three common textile
materials. Polypropylene exhibits the highest ignition temperature of the selected materials.
Combinations of fibers, such as cotton/polyester blends may actually burn (once ignited) more
intensely than a fabric comprised of one fiber alone. A University of California at Davis study
found that some polyester-cotton-blend clothing can burn "up to 25 percent faster than clothing
Summary of Salient Points
Polypropylene (the most commonly
used feedstock material in non-woven gowns and drapes) has the
highest ignition temperature in air
relative to other textile materials
including cotton and polyester.
Polypropylene test swatches do not
ignite in air under the influence of a
surgical laser
Polypropylene textiles tend to locally
vaporize under the influence of a
surgical laser and do not support
urther combustion

8/6/2019 White Paper 8-17-09
http://slidepdf.com/reader/full/white-paper-8-17-09 12/87
12
made either from pure synthetics such as polyester or from pure ‗cellulosic' fibers such as cotton
or rayon‖.
The following data table shows the approximate time to ignition (TTI), in seconds, for test
swatches of materials that may be found in operating room environments. Three different
environments are presented: standard atmospheric (21% O2), enriched (50% O2), and highly
enriched (95% O2). The ignition source was a 15W carbon-dioxide surgical laser.
As shown, polypropylene and phenol polymer do not ignite in air under the influence of the
laser. For polypropylene and phenol polymer, the laser instantly vaporized a hole, and therefore
interaction between the laser and material ceased, not supporting further combustion.
Test methods for evaluating flammability of textiles are included in NFPA 702-1980 Standard
Classification of the Flammability of Wearing Apparel, and CPSC Standard for the Flammability
of Clothing Textiles.
Material
Tested
21% O2 50% O2 95% O2
No. Ignited/ No. Tested
TTI, sec(Mean+/-SD)
No. Ignited/ No. Tested
TTI, sec(Mean+/-SD)
No. Ignited/ No. Tested
TTI, sec(Mean+/-SD)
Phenolpolymer
0/10 Does notignite
10/10 4.9+/- 0.88 10/10 0.68 +/- 1.3
Polypropylene 0/10 Does notignite
9/10 0.14 +/- 0.13 10/10 0.18 +/- 0.17
Huck towel 8/10 11.9 +/- 5.0 10/10 2.3 +/- 1.0 10/10 <0.1 +/- 0.0Cotton-polyester
10/10 4.0 +/- 0.94 10/10 1.1 +/- 0.32 10/10 0.65 +/- 0.24
Nonwovencellulose-polyester
10/10 2.7 +/- 2.2 10/10 <0.1 +/- 0.0 10/10 <0.1 +/- 0.0
Table 2. Time-to-ignition (TTI) for materials under varied conditions of oxygen concentration.Ref: Laser Ignition of Surgical Drape Materials (Wolf, Gerald L. M.D.; Sidebotham, George W. Ph.D;Lasard, Jackson L.P. M.D.; Charchaflieh, Jean G. M.D.)

8/6/2019 White Paper 8-17-09
http://slidepdf.com/reader/full/white-paper-8-17-09 13/87
13
Comfort
Barrier effectiveness and comfort have been key
selection criteria for surgical gowns for many
years. Historically, it was believed by manyclinicians that these two performance criteria
were mutually exclusive. That is, as one moved
higher on the comfort scale, it was believed that
there was usually a dramatic trade-off in terms of
protection. That kind of dramatic trade-off is no
longer the case for a number of reasons.
First, not all medical procedures require an AAMILevel 4 impervious barrier, which means that intrinsically breathable gowns are appropriate for
many procedures.
Secondly, industry standards such as AAMI PB70:2003 provide some definition of ―critical
zones‖ in gowns and drapes that may require Level 4 impervious barrier protection, with non-
critical areas free to use more breathable fabric constructions without the impervious barrier.
And thirdly, advances in material technology have been made that provide breathable fabrics
with outstanding barrier protection. As an example, spunbond-meltblown-spunbond (SMS)
composite fabrics are available that offer AAMI Level 3 protection that are suitable for a
majority of surgical procedures. For Level 4 protection, proprietary breathable film layers are
available to provide Level 4 performance. These impervious fabrics feature a reactive membrane
that allows water vapor to escape from inside the gown, while maintaining complete impervious
protection. The result is a gown that is both comfortable for the wearer, and suitable for Level 4
surgical procedures.
The comfort vs. safety tradeoff has been largely eliminated by current fabric constructions, gown
designs, and OR environmental controls. Both nonwoven and woven medical textiles address
the key factors of comfort, including drapeability, air permeability, water vapor transmission rate
(WVTR), and the ability to maintain the wearer‘s desired body temperature.
Summary of Salient Points
Although comfort remains an
important consideration in surgical
gown selection, it no longer is the
defining issue between woven and
nonwoven textiles.
Proprietary material developments
by leading suppliers of nonwoven
textiles have virtually eliminated the
breathability and temperature issues
formerly associated with synthetic
fabrics.

8/6/2019 White Paper 8-17-09
http://slidepdf.com/reader/full/white-paper-8-17-09 14/87
14
Overview of Performance Issues
The following table provides a summary of performance issues for single-use and reusable
medical textiles. A simple rating method has been adopted that uses a ―+1‖ for a positive
implementation of a performance metric, and a number between ―0‖ and ―1‖ for a performancemetric not equally addressed by single-use and reusable products. This numbering system allows
for a quantifiable comparison of the two product types in terms of performance issues. It should
be noted that no attempt has been made to provide a relative weighting of the importance of one
performance metric relative to another metric. For the purposes of this study, each attribute is
weighted equally.
Table 3. Overview of performance metrics for surgical gowns
Performance
Metric
Single-Use
Disposable
Multi-Use
Reusable
Comments
Barrier Performance +1 +1 Both single-use and reusable products areavailable with AAMI PB70 level 4 ratings
Comfort +1 +1 Material advancements in synthetic fabricsand gown constructions have addressed earlycomfort issues associated with syntheticgowns
Linting +1 +1 Modern polypropylene nonwoven fabricshave lower linting based on Gelbo Lint Testthan cotton or cotton blends. Woven 100%continuous filament polyester products alsoexhibit low linting performance
Flammability +1 0.9 Flammability of 100% polypropylene fabricis lower than all-cotton or cotton-polyesterblends based on ignition temperatures andtime-to-ignition (TTI) tests
Consistency +1 0.5 Consistency is more reliably assured forsingle-use products than for launderablereusable products over the life of the product
Safety +1 0.5 Single-use products provide fewer exposureopportunities for personnel outside theoperating room relative to launderedproducts
Total Score +6 +4.9

8/6/2019 White Paper 8-17-09
http://slidepdf.com/reader/full/white-paper-8-17-09 15/87
15
COST-PER-USE
Cost-per-use is a key factor in the buying
decision that is in sharp focus at healthcare
facilities engaged in cost reduction programs.
The cost-per-use for a single-use surgical gown is
taken in this Study to be the purchase price, per
gown. This cost will vary from hospital to
hospital with quantity discounting, the type of
gown and other aspects of the transaction.
The cost-per-use for a reusable gown is the
purchase price per gown divided by the average number of launderings in the life-cycle of the
gown, plus the laundering cost per gown, per use. Alternatively, if a rental service is retained the
price per gown would be the ―rental‖ price which includes the cost of laundering and sterilizing,
plus the price of the gown amortized over the expected number of launderings, plus the rental
service markup.
Table 4. Cost-Per-Use (Example)
NOTES1. Reusable garments are assumed to be usable over a life of 50 launderings. Number of laundering cycles is
from an article by Howard M. Zims ―Environmental, Cost, and Product Issues Related to ReusableHealthcare Textiles (2006)‖.
2. Laundry cost of $0.90 per garment is from an article by Howard M. Zims ―Environmental, Cost, andProduct Issues Related to Reusable Healthcare Textiles (2006)‖. Total laundering cost is broken down to
reflect $0.50 laundry cost and $0.40 packaging and sterilization cost.3. $60 purchase price per reusable garment is from an article by Howard M. Zims ―Environment al, Cost, andProduct Issues Related to Reusable Healthcare Textiles (2006)‖.
4. $140 purchase price per reusable garment is for GORE garments with prices ranging from $112 to $140based on internet research. One surgical laundry referenced a price of $86 per garment for a GORE gown.
5. Price range for single-use surgical gowns reflects actual transaction pricing.
SurgicalGownType
Number of Launderings PurchasePrice Range Purchase Price Rangeon Per-Use Basis(50 launderings for Reusables)
Laundry Cost,Ea, Cost-Per-Use
Reusable(XL, AAMI 3)
50 $60 to $140 $1.20 to $2.80 $0.90 $2.10 to $3.70
Single-Use(XL, AAMI 3)
n/a $2.03 to $3.49 $2.03 to $3.49 n/a $2.03 to $3.49
Summary of Salient Points
Single-use surgical gowns and drapes
can be price-competitive withreusable products depending on the
particular details of the transaction
and the specific laundering
experience at the customer facility.

8/6/2019 White Paper 8-17-09
http://slidepdf.com/reader/full/white-paper-8-17-09 16/87
16
Overlapping Price Range
$2
Price Range,
AAMI Level 3
$0 $1 $3 $4 $5
Reusable
Cost-Per-Use
Price Range
Per-Unit-Cost to Customer For Surgical Gowns
Per-Unit Price RangeSingle-Use Surgical Gowns vs. Reusable Surgical Gowns
(AAMI Level 3 and 4, XL)
(Actual transaction prices depend on case-by-case circumstances including quantity, type of
gown, customer class, and other variables specific to the transaction)
$3.49
$2.10 $3.70
$2.03
Critical variables in the cost-per-use analysis of a reusable garment are the number of wash
cycles actually realized before retirement of the garment, and the laundering cost per garment,
per use. This data is generally obtainable from the Accounting Departments of most hospitals,
regardless of whether on-site or contract laundering services are used.
Figure 3, below, illustrates the competitive price position of disposable surgical gowns relative to
reusable gowns, assuming 50 wearings for reusables before retirement.
As shown, single-use gowns can compete over the entire range of prices for reusable gowns.Competitiveness in any given situation will depend upon individual circumstances reflecting the
volume of the purchase, the type of gown, the customer class, and other transaction-specific
details.
Figure 3. Competitive Price Positioning of Single-Use vs. Reusable Surgical Gowns

8/6/2019 White Paper 8-17-09
http://slidepdf.com/reader/full/white-paper-8-17-09 17/87
17
With regard to European markets, a research report conducted by Martec for markets in
Germany, France and the UK concluded as follows: ―Film-reinforced re-usable gowns can be
competitive when repeat usage exceeds 50 times. However, these gowns are difficult to process
internally, and it is likely that such high usage rates are seldom achieved. Below a usage rate of
about 50 times, these gowns are not cost-competitive.
Single-use surgical drapes were also found to have a competitive cost position in France and
Germany…..despite the ‗perceived‘ high waste disposal costs of these items…‖,
A Note on Disposal Costs
Disposal costs in the United States for Regulated Medical Waste (RMW) and non-regulated
waste are a small percentage of garment price, and are summarized below.
Regulated Medical Waste Disposal Cost
Range: $350/ton to $1100/ton [$0.17/lb to $0.55/lb]
At 0.32 lbs per garment, the disposal cost would be $0.06 to $0.18 per single-use garment.
Non-Regulated Waste Disposal Cost
Range: $30/ton to $60/ton [$0.015/lb to $0.03/lb], or $0.005 to $0.01 per single-use garment.

8/6/2019 White Paper 8-17-09
http://slidepdf.com/reader/full/white-paper-8-17-09 18/87
18
ENVIRONMENTAL BURDEN (LIFE CYCLE ANALYSIS)
The environmental burden (CO2, NOx, water
pollutants, and solid waste) created in the
manufacture, use, and disposal of either
single-use or reusable medical garments is
small. EPA estimates put medical landfill
waste at less than 1% of the total municipal
waste stream in the United States (see
Appendix VI).
Figure 4. Medical vs. municipal waste
Burden Determination
Manufacturing, use, laundering and disposal are the steps in the product life cycle where burdens
are generated. It has been determined that the CO2 and NOx air emissions, and the
chemical/biological oxygen demand (CBOD) and Total Suspended Solids (TSS) in laundry
water are the biggest environmental burdens in the garment life cycle. Safety is also a potentially
significant burden related to reusable garments. Refer to Appendix VIII and Appendix XII for
development of safety burdens.
Summary of Salient Points
The total environmental burden created by surgical garments is small in the context of
total environmental burden.
The total environmental burden of surgical
gowns can be offset with a purchase of
carbon credits from a carbon exchange.
The environmental burden of single-use
surgical gowns is less than the
environmental burden of reusable gowns,
on a per-use basis.
Reusable gowns are resource intensive in
terms of water consumption in launderingoperations.

8/6/2019 White Paper 8-17-09
http://slidepdf.com/reader/full/white-paper-8-17-09 19/87
19
Discussion of Burden Components
Considerable analysis has been conducted to determine the various air, water, resource-depletion,
and safety burdens associated with single-use and reusable gowns and drapes. This section of the
Study summarizes the burdens associated with various phases of the life cycle, i.e.,
manufacturing, utilization, laundering, and disposal. Detailed derivations of burden values are
presented in Appendix VIII of this Study.
Manufacturing Phase: The environmental burden created by garment manufacture is mostly
determined by the energy source. If solar or wind power is used to generate electricity, there are
no air burdens from manufacturing. If a coal plant supplies the power, there are some air
burdens. Any calculation of manufacturing environmental burden has to take into account either
the specific fuel mix at the plant where the garments are made or the average fuel mix for
electricity in the U.S. or other country of manufacture. The U.S. is presently utilizing coal for 52
percent of electricity generation, and manufacturing burdens reflect this present average.
According to industry convention, approximately 50 single-use garments are required for every
reusable garment. This accounts for the higher manufacturing burden for single-use products
relative to reusable products shown in Figure 5.
Laundry Phase (reusable garments only): The laundry phase introduces significant burdens for
the reusable products. Burdens are associated with the energy required to heat the laundry water,
and then to dry and sterilize the gown or drape. There is also a burden associated with the
consumption of the water resource, itself. This burden is variable, and will depend on the
abundance or scarcity of water in the particular region. The values reflected in Figure 5 are
representative, but subject to considerable adjustment. The number of wash cycles, the amount of
water per garment, and other variables create a range of possibilities. The burden for the laundry
process is included, but not for the lights and heat in the space. The energy for transportation to
and from the laundry is also not included because much of the transportation burden is offset by
a similar burden for delivery and disposal of single-use garments.

8/6/2019 White Paper 8-17-09
http://slidepdf.com/reader/full/white-paper-8-17-09 20/87
20
Disposal Phase: The ultimate disposal of the garments results in many variables. If disposed in
a land fill, there would be no air emissions. The only burden would be landfill resource
depletion. If garments were burned in a waste to energy plant, there would be minor emissions,
which would largely be offset by the high btu value of the garments. Polypropylene and
polyester materials are almost pure fuel with 50% more Btu/lb than coal, and would replace
traditional fuels having higher environmental burdens (see Table 6 later in this Study). In either
case (landfill disposal or burning), the net environmental burden is small for both product types.
The foregoing burden discussion is for garments and does not include the packaging, which is
essentially equivalent for both single-use and reusable products.
As shown in Figure 5, single-use garments have a lower overall burden than reusable garments,
largely because of the laundering burden for reusable garments. For a complete derivation of
burden calculations, refer to Appendix VIII and Appendix XII in this Study.
Figure 5. Environmental Burden Comparison, Single-Use Gowns vs. Reusable Gowns
Mfg. burden for
50 single-usedisposable
garments.

8/6/2019 White Paper 8-17-09
http://slidepdf.com/reader/full/white-paper-8-17-09 21/87
21
Resource Depletion
An analysis of resource depletion shows that there are only two significantly impacted resources:
oil and water. Water resource depletion (from laundering) is a minor consideration in an area of
water surplus. However, it is significant in an area with periodic water shortages and water
restrictions. It becomes an order of magnitude more important in regions of persistent drought.
Water issues are primarily related to laundering operations for reusable medical textiles. Burden
calculations for water resource depletion are provided in Appendix VIII.
Resource Utilization
Resource utilization is another important parameter. A total measure of resources used can be
obtained by adding the weight of material used in the garments, the weight of equivalent coal to
produce the energy to make the garments, and the water used in manufacturing and laundering.
The dominant resource consumption for reusable garments is the water used in laundering. This
is based on 2 gallons of water/lb of washed garments. The weight of energy producing material
was based on coal with a conversion efficiency of 30%.
Table 5. Pounds of resources for 50 garment wearings
Category Manufacturing Laundering Total
Reusable Single-Use Reusable Single-Use Reusable Single- Use
GarmentMaterial(lbs)
0.64 16 xx xx 0.64 16
Water(lbs)
6.6 58 533 xx 539.6 58
Energy(lbs of coalequivalent)
5.3 52.5 22 xx 27.3 52.5
Total (lbs) 12.5 126.5 547 xx 567.5 126.5

8/6/2019 White Paper 8-17-09
http://slidepdf.com/reader/full/white-paper-8-17-09 22/87
22
Delivery and Storage for Single-Use Surgical Gowns and Drapes
Most suppliers of gowns and drapes support
deliveries to hospitals on a high-frequency basis,
in many cases daily. This is done to ensuremanageable inventory levels at the hospital, and
high inventory turns to provide minimum carrying
costs for the customer.
Operating room surgical supplies are provided for
the customer, gamma or EO sterilized and
packaged, and ready for use without further handling besides removal from packaging. Kitted
supplies including gowns, drapes, towels, masks, gloves, basins, and other supplies are similarlysterilized and packaged. The supply chain is shown, below.
The supply chain for reusable surgical gowns and drapes is different than for single-use
garments. In the case of laundered garments, the materials are subjected to a sterilization
procedure at the hospital prior to use in surgery. The supply chain is pictured, below, with
disposal at the end-of-compliance state after a determined number of launderings.
Garment
Supplier
Customer
(short term
storage)
DisposalCustomer
(utilization)
Summary of Salient Points
Single-use sterile surgical gowns and
drapes do not require an additional sterilization at the point of use
(hospital).
Reusable products used in the OR
often require sterilization at the
hospital after return from the
laundr .
Single-Use
Supply Chain
Reusable
Supply Chain
Garment
Supplier(Laundry)
Sort
Wash
Dry
Inspect
Fold
Package
Customer(short term
storage)
Customer
(sterilization) Customer
(utilization)
Customer
(short term
storage)
Disposal
(end of
compliance)
8/6/2019 White Paper 8-17-09
http://slidepdf.com/reader/full/white-paper-8-17-09 23/87
23
LAWS AND REGULATIONS
Garment Production: Raw Materials
Overview: As a general rule, reusable woven gowns and drapes are made of a cotton/polyester
blend or 100% polyester, and single-use non-woven garments are made from materials such as
polypropylene.
Natural fibers such as cotton are generally believed to be more environmentally favorable since
they come from a renewable resource and are biodegradable. However, cotton requires
pesticides and herbicides to ensure quality, healthy growth and efficient harvesting. Man-made
fibers require energy and deplete natural resources because they come from oil. Studies have
generally concluded that natural and man-made fabrics impose similar environmental burdens. Designing for Cleaner Textiles, http://www.co-design.co.uk/jhealey.htm
Environmental damage caused by cotton production has led to a number of alternatives such as
unbleached cotton, 'green' cotton and natural dyes. Organic cotton is grown in relatively small
quantities and the costs of production can be double that of standard cotton. Synthetic fibers can
be made from recycled PET plastic bottles, although not necessarily for medical uses.
Regulations for Cotton Production:
o Pesticides and herbicides are regulated by EPA under the Federal Insecticide, Fungicide
and Rodenticide Act (FIFRA).
o Storm water run off is regulated under the Clean Water Act.
o Water used for irrigation may be regulated under state laws.
Regulations for Polypropylene: Petroleum production and the processing of oil into chemicals
such as polypropylene are regulated by the full panoply of environmental laws at the state and
federal levels.

8/6/2019 White Paper 8-17-09
http://slidepdf.com/reader/full/white-paper-8-17-09 24/87
24
Garment Production: Textile Manufacturing
Clean Air Act
National Ambient Air Quality Standards for Ozone
During the finishing stages, fabrics may be coated with lubricating oils, plasticizers and water
repellent chemicals, primarily hydrocarbon-based compounds such as oils, waxes or solvents.
After the coatings are applied, the coated fabrics are cured by heating in ovens or dryers. A
frequent result is the vaporization of organic compounds into high molecular weight volatile
organic compounds (VOCs).
VOCs react with sunlight and contribute to ground level ozone. The Clean Air Act establishes
National Ambient Air Quality Standards (NAAQS) for ozone. Consequently, a textile mill hasto have an air permit and install Best Achievable Control Technology (BACT) to control VOC
emissions. BACT technologies include electrostatic precipitators, scrubbers and fabric filters.
Opacity
VOCs can also contribute to visible smoke. Smoke is basically made up of particles less than
one micron in size, suspended in the gaseous discharge. A textile mill‘s air permit may have
opacity limits.
New Source Performance Standards
EPA established NSPSs for Synthetic Fiber Production Facilities (40 CFR Part 60 Subpart HHH)
which limit VOC emissions to 20lb/ton of solvent feed. EPA has not established NSPSs for any
other subcategory of textile manufacturing.
Hazardous Air Pollutants
National Emission Standards for Hazardous Air Pollutants (NESHAPS) have been established
for one subcategory of textile manufacturing: Fabric Coating, Printing and Dying (40 CFR Part
60 Subpart OOOO). This regulation controls emissions of hazardous air pollutants (generally
VOCs) such as toluene, xylene and ethylbenzene. The rule requires a thermal or catalytic
oxidizer to achieve 98% removal or an emission limit of 20 ppmv. See: Air Pollution Control in
the Textile Industry: A Technology for the 21st
Century,
www.croll.com/_website/ca/casetextl1.asp

8/6/2019 White Paper 8-17-09
http://slidepdf.com/reader/full/white-paper-8-17-09 25/87
25
Clean Water Act
Overview: High volumes of wastewater are produced in textile manufacturing operations such
as sizing, dyeing, rinsing, printing, bleaching, finishing and cleaning. Wastewater may contain:
o Chlorine, from bleaching
o Heavy metals (such as lead and mercury), ammonia, alkali salts or pigments, from
dyes
o Chromium, from mordants used to fix the dyes
Effluent Standards
In 1982, EPA promulgated effluent guidelines for textile manufacturers. 40 CFR Part 410. The
rule is divided into nine subcategories including wool scouring and finishing, woven fabrics,
nonwoven fabrics and carpets. Each subpart contains effluent limitations, new source
performance standards and pretreatment standards. Effluent limitations represent the degree of
effluent reduction attainable by using either best practicable control technologies (BPT) or best
available technologies (BAT). Limits are established for:
o Biological oxygen demand (BOD)
o Chemical oxygen demand (COD)
o Total suspended solids (TSS)
o Sulfides
o Phenol
o Total chromium
o pH
A textile mill must obtain either:
o an NPDES (National Pollution Discharge Elimination System) permit for a wastewater
discharge into a waterway; oro a pretreatment permit for discharge into a municipal sewer (Publicly Owned Treatment
Works or POTW).
See: EPA Office of Compliance Sector Notebook Project: Profile of the Textile Industry,
September 1997, http://www.p2pays.org/ref/01/00506.pdf

8/6/2019 White Paper 8-17-09
http://slidepdf.com/reader/full/white-paper-8-17-09 26/87
26
Resource Conservation and Recovery Act (RCRA)
Solid Waste
Fabric waste and other scraps left over at the end of production and some packaging materials
may be sent to a municipal landfill along with general trash.
Hazardous Waste
Certain dyes, solvents, bleaches and finishing agents used in textile manufacturing may result in
the generation of hazardous wastes in the form of spent solvents or wastewater treatment
sludges. Hazardous waste must be disposed of in a permitted hazardous waste disposal facility.
See: Environmental Hazards of the Textile Industry, June 2006, http://www.hsrc-
ssw.org/update24.pdf

8/6/2019 White Paper 8-17-09
http://slidepdf.com/reader/full/white-paper-8-17-09 27/87
27
Hospital Use
OSHA’s Bloodborne Pathogen Rule
OSHA imposes certain responsibilities on employers to protect the health and safety of their
workers. OSHA‘s bloodborne pathogen rule requires hospitals to protect their workers from
risks associated with infectious materials in blood. In particular, hospitals must provide personal
protective equipment (PPE) such as gloves, gowns, and masks, and must clean or replace the
equipment as needed. With respect to surgical gowns, this means a hospital must ensure that the
gown provides a barrier to protect the worker from bloodborne pathogens.
This rule tips the balance in favor of single-use garments, since a hospital can provide sufficientbarrier protection with more certainty. Reusable gowns may lose some of their barrier protection
after repeated washings, increasing the risk that the worker is not adequately protected.

8/6/2019 White Paper 8-17-09
http://slidepdf.com/reader/full/white-paper-8-17-09 28/87
28
Reusable Garments: Laundering
OSHA’s Bloodborne Pathogen Rule
OSHA imposes certain responsibilities on employers to protect the health and safety of their
workers. OSHA‘s bloodborne pathogen rule requires laundries to protect their workers from
risks associated with infectious materials in blood. In particular, laundries must provide personal
protective equipment (PPE) such as gloves and work garments and must clean or replace them as
needed. Laundries must also follow specific procedures for collecting and handling soiled
hospital garments.
Wastewater Effluent Standards
Generally, laundries discharge wastewater to the municipal sewer and must obtain a pretreatment
permit from the local POTW (Publically Owned Treatment Works). Organics and metals may
be in the wastewater due to chemicals and detergents used in the laundering process.
Pretreatment permits generally set standards for the following:
o Biological oxygen demand (BOD)
o Chemical oxygen demand (COD)
o Total suspended solids (TSS)
o Sulfides
o Phenol
o Total chromium
o pH
Treatment prior to discharge could include equalization, coagulation/flocculation, dissolved air
flotation, oil/water separation or clarification.
Water Use
Laundries use a large amount of water and many have looked into recycling and reuse processes
to save on the use of fresh water. Some state or local regulations may also limit fresh water use.
See Industrial Laundry Wastewater Treatment, http://www.vsep.com/pdf/IndustrialLaundry.pdf

8/6/2019 White Paper 8-17-09
http://slidepdf.com/reader/full/white-paper-8-17-09 29/87
29
Garment Disposal
Waste Classification: Hospital wastes may fall into one of three categories:
1. Hazardous waste, such as mercury and radioactive wastes, which is regulated by the
federal EPA.
2. Regulated Medical Waste, also referred to as infectious waste, biohazardous waste or
―red bag‖ waste, which is regulated by state environmental or health agencies. Blood
soaked surgical gowns and drapes generally fall into this category.
3. Solid wastes or general trash such as packaging and discarded surgical gowns (which
are not considered infectious or ―red bag‖ wastes) which can be disposed of in a
municipal landfill.
The OSHA Bloodborne Pathogen rule defines regulated medical waste to include gowns or
drapes ―that would release blood or other potentially infectious materials in a liquid or semi-
liquid state if compressed‖ or squeezed. 29 CFR 1910.1030(b). In other words, garments that
are soaked or saturated with blood are Regulated Medical Wastes, whereas stained or tainted
garments are not. The OSHA standard was designed to protect healthcare workers from the risks
of exposure and does not deal with waste disposal per se. However, the definition has been used
by states in establishing waste classification policies. www.practicegreenhealth.org/private/library_resource/142 Specific d efinitions and disposal or
treatment requirements differ from state to state. http://cms.h2e-online.org/ee/rmw/rmw-
regulations/state-rmw-regulations/
See also: www.epa.gov/osw/nonhaz/industrial/medical/mwfaqs.htm
Solid Waste: Reusable Garments
Reusable surgical gowns and drapes that have reached the end of their useful life are considered
solid wastes (unless classified as regulated medical wastes because they are saturated with blood)
and may be disposed of in a municipal landfill. Cotton and other natural materials are
biodegradable.

8/6/2019 White Paper 8-17-09
http://slidepdf.com/reader/full/white-paper-8-17-09 30/87
30
Solid Waste: Single Use Garments
Single use surgical gowns and drapes are considered solid wastes (unless classified as regulated
medical wastes because they are saturated with blood) and may be disposed of in a municipal
landfill. Polypropylene does not react with water, so does not contribute to landfill leachate, and
is stable so avoids settling problems. However, it does not biodegrade.
Regulated Medical Waste: Reusable or Single Use Garments
Either reusable or single use surgical gowns and drapes will be considered regulated medical
wastes if they are saturated or soaked with blood. The garments must then be either 1)
incinerated or 2) disinfected prior to being landfilled.
Disinfect and landfill: Garments must be treated or ―disinfected‖ to destroy or kill infectious
microorganisms prior to landfilling. Disinfecting technologies include:
o Thermal treatment, such as microwaving
o Steam sterilization, such as autoclaving
o Electropyrolysis
o Chemical treatment, using chlorine based products (common bleach) or alkali
products (sodium hydroxide or lye)
Of these, the federal EPA regulates only chemical treatment technologies. Products which claim
to reduce the infectiousness of waste by use of a chemical must be registered with the EPA
Office of Pesticides, Antimicrobial Division, under FIFRA.
Medical waste treatment processes may be regulated under state law and may need to be
certified, licensed or permitted.
Disinfected medical wastes may generally be disposed of in a municipal landfill along with other
general trash. However, many states consider disinfected medical wastes to be ―special wastes‖
requiring disposal at special landfills authorized to accept such wastes.
8/6/2019 White Paper 8-17-09
http://slidepdf.com/reader/full/white-paper-8-17-09 31/87
31
Incinerate:
o Clean Air Act
EPA originally issued performance standards for medical waste incinerators in 1997. The
performance standards set emission limits for dioxins and furans, toxics (such as lead, mercuryand cadmium), acid gases (hydrogen chloride and SO2), CO and NOx.
The rule was challenged in court by the Sierra Club. As part of the settlement agreement, EPA
has until September 2009 to issue a new final rule. On December 1, 2008, EPA issued a
proposed rule pursuant to that mandate, proposing much stricter emissions standards. 73 FR
72961.
As a result of the 1997 rule, incinerators had to install air pollution control devices such as
scrubbers. There were roughly 2,400 hospital and medical waste incinerators in operation at that
time. EPA estimates that there are 57 today. Many of those would close under the newest
proposal. In particular, EPA expects hospitals to close on-site incinerators and use regional
incinerators, or opt to disinfect their regulated medical wastes prior to landfilling.
It is important to note, that incinerator operators value the high energy content of polypropylene
in single use garments since it helps with the combustion of wet wastes. (See Kimberly Clark
flyer promoting polypropylene garments in Australia,
http://www.kca.com.au/healthcare/docs/balanced-view-hospital-wastes.pdf )
o Transportation
The Department of Transportation defines regulated medical wastes as ―hazardous materials‖
which have specific packaging, labeling and handling requirements. 49 CFR 173.197.
Since there are very few on-site incinerators now, and will be even fewer in the future,
transportation becomes a bigger issue. Saturated surgical gowns and drapes being transported to
an incinerator for disposal would have to meet the DOT requirements

8/6/2019 White Paper 8-17-09
http://slidepdf.com/reader/full/white-paper-8-17-09 32/87
32
o Hazardous Waste
Ash remaining at the bottom of an incinerator after burndown often contains heavy metals than
may leach out. Dioxins and furans may also be found in the ash. Often the ash is considered a
hazardous waste pursuant to EPAs toxicity characteristic leachate procedure (TCLP).
Waste Minimization:
Disposing of regulated medical waste is much more expensive than disposing of solid waste and
normal trash. Minimizing the amount of regulated medical waste is, therefore, very important.
Whether dealing with discarded reusable garments or single use garments, regulated medical
wastes should be segregated at the point of generation and kept isolated from other wastes.
Single use items are often falsely implicated for certain costs of waste disposal. Improper waste
segregation, rather than use of single use gowns and drapes, is usually the cause of increased
amounts of regulated medical wastes.
Even so, waste minimization concepts favor reusable surgical gowns and drapes.
See, Non-Incineration Medical Waste Treatment Technologies: A Resource for Hospital
Administrators, Facility managers, Health Care Professionals, Environmental Advocates and
Community Members, August 2001, http://www.noharm.org/library/docs/Non-
Incineration_Medical_Waste_Treatment_Te_2.pdf

8/6/2019 White Paper 8-17-09
http://slidepdf.com/reader/full/white-paper-8-17-09 33/87
33
SUSTAINABILITY
A number of Sustainability Index services are available for companies pursuing Sustainability
Programs. Two such services are the Dow Jones Sustainability Index that has been in operation
since 1999, and the Global Reporting Initiative (GRI). GRI provides sustainability reporting
guidelines for Corporations covering their economic, environmental, and social performance.
These indexes are discussed in further detail in Appendix X of this Study.
Shortcomings of Traditional Sustainability Guidelines
A potential weakness in traditional sustainability guidelines is a limited focus that does not
include consideration of factors such as human health and safety, and resource depletion.
Human health and safety, and resource depletion are significant factors in a comprehensive
burden analysis, particularly in the healthcare industry. The importance of these factors is
highlighted by their inclusion in sustainability software used by the National Institute on
Standards and Technology (NIST). NIST is the most important ―standards‖ group in the United
States. The NIST software which reflects consideration of human health and safety is called
―BEES‖ which is an acronym for ―Building for Environmental and Economic Sustainability‖.
Any comprehensive burden analysis should include consideration of health, safety, and resource
depletion, which are particularly relevant since human health and safety are integral parts of the
healthcare business. It is particularly appropriate for purposes of comparing reusable and single-
use operating room garments from the perspective of hospital purchasers, and even investors.
One of the biggest opportunities resulting from this Study will be to open the door to
consideration of higher performance garments that contribute even more to human health and
safety. The impact of lives saved, hospital days eliminated, and quality enhanced life days
(QELD) is large compared to other burdens. At the present EPA-determined value for a human
life ($7M), hospitals could justify paying an additional $1 for a high-performance garment if the
result were just one life saved….which would help arrest the slide to commodity pricing that is
characterizing the current market.

8/6/2019 White Paper 8-17-09
http://slidepdf.com/reader/full/white-paper-8-17-09 34/87
34
GREEN OPPORTUNITIES
There are Green Opportunities for manufacturers, suppliers, and customers in initiatives that
include waste-to-energy, bio-based polymers, bio-degradable polymers, carbon credits, and
others. This section of the Study elaborates on the most promising of those opportunities.
Carbon-Offset Credits
As discussed earlier in this Study, a low-cost and socially-responsible means to completely offset
the minimal environmental burden represented by surgical gowns and drapes is to purchase
carbon offsets at an existing climate exchange, such as the Chicago Climate Exchange. This
action can be taken in the larger context of a Sustainability Program.
Waste-to-Energy: Single-Use Garments as a High Priced Green Fuel
Kimberly Clark has a video entitled ―Trash to Treasure‖ which establishes the value of single-
use garments as a high btu fuel for incinerators and waste-to- energy plants. Manufacturers have
the opportunity to open up a more attractive opportunity which is the use of pelletized garment
waste as a replacement for coal in power plants and other combustion applications.
Power plants in Europe are paying up to $100/ton for low quality biomass fuels. They are
importing wood pellets from the U.S. and palm leaves from Asia. The waste-utilization of 5,000
tons of garments could have a value of $500,000 as a fuel if similarly priced. Arguably, the price
could be even higher since the average fuel value is 3 to 4 times higher than typical biomass.
In any case, the replacement of coal with plastic waste results in a direct reduction of CO2 for
every pound of garments so disposed. There would also be reductions in SO2, mercury, and HCL
by the coal substitution since polypropylene is a much cleaner fuel than coal. Additionally, since
modern coal-fired plants have very good air pollution control systems any NOx created by the
garment combustion will be greatly reduced. Net reductions in mercury and other pollutants by
the substitution are also enhanced.
8/6/2019 White Paper 8-17-09
http://slidepdf.com/reader/full/white-paper-8-17-09 35/87
35
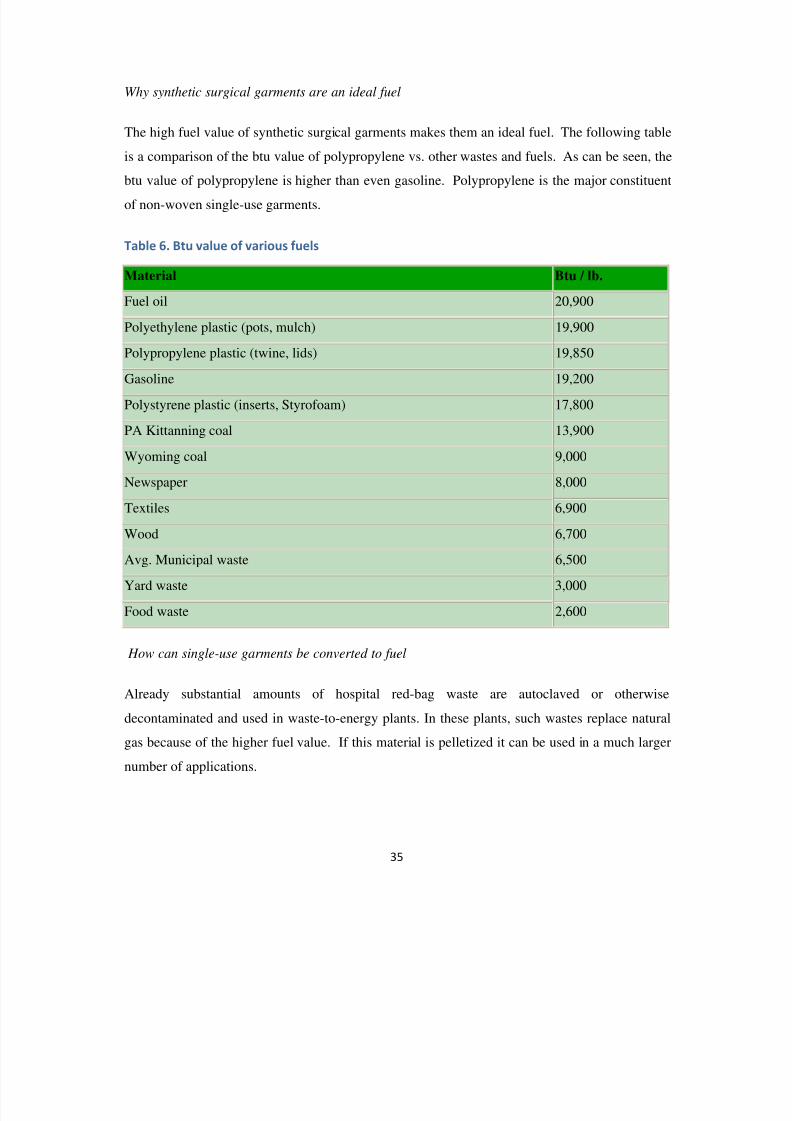
Why synthetic surgical garments are an ideal fuel
The high fuel value of synthetic surgical garments makes them an ideal fuel. The following table
is a comparison of the btu value of polypropylene vs. other wastes and fuels. As can be seen, the
btu value of polypropylene is higher than even gasoline. Polypropylene is the major constituent
of non-woven single-use garments.
Table 6. Btu value of various fuels
Material Btu / lb.
Fuel oil 20,900
Polyethylene plastic (pots, mulch) 19,900
Polypropylene plastic (twine, lids) 19,850
Gasoline 19,200
Polystyrene plastic (inserts, Styrofoam) 17,800
PA Kittanning coal 13,900
Wyoming coal 9,000
Newspaper 8,000
Textiles 6,900
Wood 6,700
Avg. Municipal waste 6,500
Yard waste 3,000
Food waste 2,600
How can single-use garments be converted to fuel
Already substantial amounts of hospital red-bag waste are autoclaved or otherwise
decontaminated and used in waste-to-energy plants. In these plants, such wastes replace natural
gas because of the higher fuel value. If this material is pelletized it can be used in a much larger
number of applications.

8/6/2019 White Paper 8-17-09
http://slidepdf.com/reader/full/white-paper-8-17-09 36/87
36
There are many pelletizing processes to make wastes suitable for use along with coal and other
fuels in power, cement, metal working, and pulp plants. There are a number of initiatives to
improve upon conventional pelletizing. Here is one example.
Plastofuel™ is a densification process for converting dirty plastics into a clean burning fuel. The
process accepts both rigid and film plastics and forces them through a heated die, melting the
outer layer of plastic which locks in dirt, debris and small pieces of plastic. By only melting the
outer one to two millimeters of plastic, energy is conserved, especially when compared with the
standard pelletizing process which requires the entire mass of plastic to be melted. The extruded
material, called extrudate, is then cut to any length desired with a hot knife, sealing the ends to
make the nugget durable. The fuel nuggets can be blended with coal in coal-fired boilers, or used
as a fuel in kilns and driers
This concept has been developed by Pennsylvania State University which has an entire program
on Plasticulture. http://plasticulture.cas.psu.edu/plastofuel.html
Program to promote the use of garments as supplemental fuel
Much hospital waste is now autoclaved or otherwise decontaminated. The pelletizing step as
described with ―Plastofuel‖ above may be able to be fine tuned to provide the 250 F temperature
for 30 minutes required for an autoclaving procedure and thereby eliminate an autoclave step. In
any case waste must be first treated and pelletized. This is all existing technology but there may
be some potential for improvement.
Ameren, a large utility serving middle and southern Illinois is already using waste plastic. There
will be no problem working with the utility industry to provide a market for the pelletized
product. The advantage of coal fired boilers and kilns, as opposed to waste-to-energy plants is
the proximity. There are 900 coal fired power plants spread across the country, and hundreds of
cement and lime kilns. So transportation from the hospital to the combustor will be minimal.
All that is necessary to develop the demand is to alert the key players. This would be the utility
companies. Also DOE and EPA have interests and research funds.

8/6/2019 White Paper 8-17-09
http://slidepdf.com/reader/full/white-paper-8-17-09 37/87
37
Bio-Polymers (a supply-side solution)
The single-use medical garment industry is currently dealing with ongoing concerns regarding
the disposal of surgical gowns and drapes, and other textiles used in health care. Although waste-
industry data demonstrate minimal environmental impact of single-use products in terms of
annual tonnage, there is continued research of eco-friendly opportunities on the supply side in the
area of new feedstock materials, i.e, bio-based polymers.
Bio- polymers, sometimes also referred to as ―green polymers‖ or ―renewable polymers‖,
represent a class of polymer produced by living organisms. This class of polymer is in contrast
with traditional ―petro- polymers‖ derived from essentially non-renewable petroleum products
such as crude oil. Petro-polymers are today the basis of most plastics, including polyethylene
and polypropylene. Biopolymers are being researched that may, in certain applications, one day
replace petro-based polyethylene and polypropylene.
Biopolymers can be derived from numerous plant sources. Sugar cane, switch grass, and other
plants may be used for the source biomass. Drivers for the development of biopolymers include:
sustainability,
domestic sourcing, and
lower greenhouse gas emissions
Biopolymers are renewable, sustainable, and can be carbon neutral. Some biopolymers are
biodegradable, and may be compostable with a 90% breakdown into constituent components
within 6 months. Cost of biopolymers is currently an issue, and an area of continuing
investigation. Refer to Appendix XI for additional information on bio-polymers.

8/6/2019 White Paper 8-17-09
http://slidepdf.com/reader/full/white-paper-8-17-09 38/87
38
Bacterial decomposition of petro-plastics (a disposal side solution)
Conventional petro-based plastics are stable molecular structures with generally long life cycles
in landfills lasting hundreds of years or longer. This is a positive factor in terms of reduced
leachate, but contributes to the total long-term volume of the landfill.
Recent research in bacteria-based bio-degradation of traditional petro-plastics has focused on
two strains of naturally occurring bacteria called Sphingomonas and Pseudomonas. When
presented with a suitable fermenter including a medium, the bacteria microbes, and plastic
material, decomposition of the plastic into water and CO2 proceeds in a period of 6 to 12 weeks.
A heated fermenter assists the decomposition, but most of the heat is supplied by the process so
minimal additional energy is required.
Although this process does release CO2 back to the atmosphere, that drawback may be in part
offset by the reduction in landfill mass. Additional research is required to determine process
efficacy on a range of plastics. Some research has been conducted on polypropylene. It is
important to note that this process relates to traditional petro-plastics and is not restricted to
starch-based bio-plastics.

8/6/2019 White Paper 8-17-09
http://slidepdf.com/reader/full/white-paper-8-17-09 39/87
39
CONCLUSIONS & RECOMMENDATIONS
SITUATION ANALYSIS
EPA estimates have shown that the percentage
of medical waste in the United States as a
percentage of total municipal waste is
relatively small…on the order of just one half
of one percent. Regulated Medical Waste
(RMW) is less than 30% of total medical
waste. Therefore, any discussion of the
environmental impact of medical waste must
be in the context of the complete waste-stream.
The public image of the single-use medical
garment industry has to some degree been formed by ―green‖ campaigns promoted by the
reusable textile industry. This Study has shown that the environmental burden for single-
use textiles is slightly less than for reusables when laundering operations are included.

8/6/2019 White Paper 8-17-09
http://slidepdf.com/reader/full/white-paper-8-17-09 40/87
40
PERFORMANCE
Performance and reliability are strong suits
for single-use surgical gowns and drapes.
Single-use gowns and drapes can be shown to
provide superior performance relative to
reusable gowns and drapes in terms of
consistency, flammability, and other
performance metrics. Moreover, reusable
gowns have end-of-compliance issues which may present potential liability issues.
Performance
Metric
Single-Use
Disposable
Multi-Use
Reusable
Comments
Barrier Performance +1 +1 Both single-use and reusable products areavailable with AAMI PB70 level 4 ratings
Comfort +1 +1 Material advancements in synthetic fibersand gown constructions have addressedearly comfort issues associated withsynthetic gowns
Linting +1 +1 Modern SMS fabrics have lower lintingbased on Gelbo Lint Test than cotton orcotton blends. Woven 100% continuousfilament polyester textiles also provide lowlinting.
Flammability +1 0.9 Flammability of 100% polypropylene fabric
is lower than all-cotton or cotton-polyesterblends based on ignition temperatures andtime-to-ignition (TTI) tests
Consistency +1 0.5 Consistency is more reliably assured forsingle-use products than for launderablereusable products over the life of theproduct.
Safety +1 0.5 Single-use products provide fewer exposureopportunities for personnel outside theoperating room relative to launderedproducts
Total Score +6 +4.9

8/6/2019 White Paper 8-17-09
http://slidepdf.com/reader/full/white-paper-8-17-09 41/87
41
Overlapping Price Range
$2
Price Range,
AAMI Level 3 XL
$0 $1 $3 $4 $5
Reusable
Cost-Per-Use
Price Range
Per-Unit-Cost to Customer For Surgical Gowns
Per-Unit Price RangeSingle-Use Surgical Gowns vs. Reusable Surgical Gowns
(AAMI Level 3, XL)
(Actual transaction prices depend on case-by-case circumstances including quantity, type of
gown, customer class, and other variables specific to the transaction)
$3.49
$2.10
$3.70
$2.03
COST-PER-USE
Based on available evidence, the cost-per-use for single-use gowns can be competitive
with the cost-per-use for reusable gowns and drapes. The cost differential is not absolute,
however, and can be reduced or even reversed one way or the other with changes in net
pricing or changes in the assumed number of launderings before retirement of reusable
gowns or drapes. As such, this is a conditional conclusion.

8/6/2019 White Paper 8-17-09
http://slidepdf.com/reader/full/white-paper-8-17-09 42/87
42
RESOURCE USAGE
Reusable garments consume approximately 4.5 times as many resources as single-use
garments, primarily in terms of water usage in laundering. The table below shows the
resources consumed (in lbs) for single-use and reusable garments. In a water scarce
environment, water usage may become a critical factor in the purchasing decision.
TOTAL ENVIRONMENTAL BURDEN
The overall impact of the medical textiles on the environment is small in terms of burden,
for both single-use products and reusable products.
The environmental burden of single-use medical textiles has been found to be actually
less than for reusable garments, largely due to the impact of laundering required for
reusable garments.
Category Manufacturing Laundering Total
Reusable Single-Use Reusable Single-Use Reusable Single-Use
GarmentMaterial(lbs)
0.64 16 xx xx 0.64 16
Water(lbs) 6.6 58 533 xx 539.6 58
Energy(lbs of coalequivalent)
5.3 52.5 22 xx 27.3 52.5
Total 12.5 126.5 547 xx 567.5 126.5

8/6/2019 White Paper 8-17-09
http://slidepdf.com/reader/full/white-paper-8-17-09 43/87
43
APPENDIX
I. List of Key Assumptions
1. The weight of a reusable garment was assumed to be twice the weight of a single-use
garment based on an analysis conducted by Kimberly Clark of single-use and reusable
gowns. Calculations in this report used a weight of 0.32 lbs for a single-use garment, and
0.64 lbs for a reusable garment. These numbers are conservative based on weights
recorded in the Study of 0.24 lbs (single use) and 0.93 lbs (reusable).
2. A life-cycle of 50 launderings was assumed for reusable garments.
3. Single-use gowns were assumed to be of all polypropylene nonwoven material.
4. Reusable gowns were assumed to be of all polyester woven material.
5. Two-gallons of water per pound of laundry was assumed in all laundry calculations,
based on information available on the internet.
6. The combustion BTU content of polypropylene and polyester was assumed to be 19,000
BTU per pound, based on information available on the internet.
7. The combustion BTU content of bituminous coal was assumed to be 12,000 BTU per
pound based on information available on the internet.
8. The key resources consumed in the product life-cycle were assumed to be water and oil.
9. The key emissions in the product life-cycle were assumed to be NOx, CO2, and water.
10. CO2 was established as the normalized base for the Environmental Burden calculations,
with a Normalized Weighting Factor of 1.0, and a cost of $20 per ton.
11. The value of a human life was taken to be $7,000,000 per a government report, with an
equivalent value in CO2 units of 350,000 tons of CO2.
II. List of factors not included in the Study
1. The cost of fuel in the transportation of single-use and reusable garments was considered
to be approximately similar, and was not factored into this Study.
2. The warehousing cost of single-use and reusable garments was considered to be
approximately similar, and was not factored into this Study.
3. The cost and environmental impact of packaging for single-use and reusable garments
was considered to be approximately similar, and was not factored into this Study.

8/6/2019 White Paper 8-17-09
http://slidepdf.com/reader/full/white-paper-8-17-09 44/87
44
III. Sensitivity of results to key variables
1. The environmental burden for reusable garments is strongly influenced by water
availability. In a water-restricted area, the environmental burden posed by reusable
garments is an order of magnitude higher based on the increased value of the water.
2. The cost-per-use evaluation for reusable garments is sensitive to the assumed number of
launderings to the end-of-compliance state, and to the quoted price for the single-use
garment.
3. Safety of garments adds an environmental burden equal to the total environmental burden
of the garments for reusable products. There is documentation supporting a higher level
of safety for single-use disposable garments relative to reusable garments, when
breakdown in barrier efficacy is considered for laundered products, as well as theincreased exposure to hazards in the laundering process.

8/6/2019 White Paper 8-17-09
http://slidepdf.com/reader/full/white-paper-8-17-09 45/87
45
IV. Nonwoven Suppliers
The Top 40 suppliers of nonwoven roll goods along with annual sales are listed in the Table,
below [Ref: Nonwovens Industry, September 2008 issue].
Ranking Company Name 2007 GlobalNonwovens Sales
1 Freudenberg $1.45 billion
2 DuPont $1.35 billion
3 Kimberly-Clark $1.3 billion
4 Ahlstrom $1.28 billion
5 PGI $1.06 billion
6 Fiberweb $948 million
7 Johns Manville $670 million
8 Fibertex $294 million
9 Buckeye $260 million
10 First Quality $250 million
11 Avgol $237 million
12 Companhia Providencia $225 million13 Hollingsworth & Vose $225 million
14 Concert Industries $212 million
15 TWE Group $211 million
16 Propex $210 million
17 Colbond $195 million
18 Japan Vilene $194 million
19 Vita Nonwovens $190 million
20 Sandler $171 million
21 Asahi Kasei $170 million
22 Pegas $167 million
23 Jacob Holm $160 million
24 Georgia Pacific $150 million
25 Toyobo $143 million
26 Mitsui $136 million
27 Lydall $135 milllion
28 Union $133 million
29 Andrew Industries $130 million
30 Western Nonwovens $125 million31 Toray Saehan $123 million
32 Foss Manufacturing $108 million
33 Suominen $104 million
34 Fitesa $103 million
35 Royal Tencate $102 million
36 Albis $100 million
37 Textilgruppe Hof $98 million38 Unitika $88 million
39 PCC $87 million
40 Rexcell $86 million

8/6/2019 White Paper 8-17-09
http://slidepdf.com/reader/full/white-paper-8-17-09 46/87
46
V. List of Medical Laundry Operations in the US
1. Cintas Corporation
2. Healthcare Services Group Inc
3. Alsco Inc
4. G&K Services, Inc
5. Angelica Corporation
6. Ameripride Services, Inc
7. National Service Industries, Inc
8. Mission Linen Supply
9. Mission Of Nevada, Inc
10. Summit Services Group, Inc
11. Domestic Linen Supply And Laundry Company
12. Admiral Linen Service Inc
13. Palace Laundry, Inc
14. Sri/Surgical Express, Inc
15. Hospital Central Services Cooperative, Inc
16. A & P Coat Apron & Linen Supply Inc
17. Ameritex
18. Sodexho
19. Alsco

8/6/2019 White Paper 8-17-09
http://slidepdf.com/reader/full/white-paper-8-17-09 47/87
47
VI. Municipal and Medical Waste Data
Municipal and Medical Waste Data
1990 Data: In a comprehensive 1990 report entitled ―Finding the Rx for Managing Medical
Wastes,‖ EPA estimated that from 0.3% to 2.0% of municipal solid wastes were medical wastes.
Of that amount, about 15% is regulated medical waste.
http://www.epa.gov/waste/nonhaz/industrial/medical/mwpdfs/rx/toc.pdf
In 1990, Americans generated about 205.2 million tons of municipal waste.
http://www.epa.gov/osw/nonhaz/municipal/pubs/msw07-fs.pdf
Based on 1990 data, then, corresponding waste amounts would be as follows:
Total Municipal Solid Waste: 205.2 million tons per year
Total Medical Wastes: 615,000 to 4.0 million tons per year
Regulated Medical Wastes: 92,000 to 205,000 tons per year
2000 Data: A report published in 2000 suggested that total medical wastes were 600,000 to 1
million tons per year and regulated medical wastes were 90,000 to 150,000 tons per year.
http://www.memagazine.org/backissues/membersonly/sept00/features/rx/rx.html
In 2000, about 239.1 million tons of municipal waste was generated.
http://www.epa.gov/osw/nonhaz/municipal/pubs/msw07-fs.pdf
Therefore, total medical waste was 0.3% to 0.4% of municipal solid waste in 2000.

8/6/2019 White Paper 8-17-09
http://slidepdf.com/reader/full/white-paper-8-17-09 48/87
48
2007 Data: In 2007, Americans generated about 254 million tons of municipal waste.
http://www.epa.gov/osw/nonhaz/municipal/pubs/msw07-fs.pdf
EPA‘s medical waste data and estimates have not been updated since the 1990 report. However,
2007 medical waste data can be extrapolated as follows. All numbers are in tons per year:
Year Municipal SolidWaste
Total MedicalWaste (tons)
Regulated MedicalWaste (tons)
1990 205.2 M 615,000 to 4.0 M(0.3 – 2.0%)
92,000 to 205,000
2000 239.1 M 600,000 to 1.0M(0.3 – 0.4%)
90,000 to 150,000
2007 254.0 M 1.0 M (0.4%) 150,000
Pie chart percentages:
Total Municipal Waste: 254.0 million tons per year
Total Medical Waste: 1.0 million tons per year or 0.4%
Total Medical Waste:
Non-Regulated 850,000 tons per year or 0.34%
Regulated 150,000 tons per year or 0.06%

8/6/2019 White Paper 8-17-09
http://slidepdf.com/reader/full/white-paper-8-17-09 49/87
49
VII. Carbon Credit Overview
Carbon credits are a key component of national and international emissions trading schemes that
have been implemented to mitigate global climate change. They provide a way to reduce
greenhouse gas emissions by capping total annual emissions and letting the market assign amonetary value to any shortfall through trading (―cap and trade‖).
Europe has had an active carbon market since 2005 through the European Union Emissions
Trading Scheme (EU-ETS). In the US, there are currently two operating carbon markets: the
Regional Greenhouse Gas Initiative (RGGI) and the Chicago Climate Exchange (CCX).
RGGI: RGGI is a regional ―cap and trade‖ system established by ten states in the eastern US to
limit greenhouse gas emissions from electric power plants. The states establish a regional
emissions cap, then each state allocates its share of the cap among facilities within the state.
RGGI administers an emissions auction once each quarter beginning in March 2009. Two
preliminary auctions were conducted in 2008 with allowances selling for just over $3.00 per
carbon credit (or ton of carbon dioxide equivalent emission).
The auctions are open to third parties such as environmental groups (who would purchase a
credit and hold it, thereby reducing emissions) or investors (who would purchase a credit,
expecting the price to increase). In order to participate in an auction, an entity needs to qualify
by completing an application form and posting financial security in the form of cash, bond or
letter of credit to cover the anticipated bid amount. http://www.rggi.org/co2-auctions
Chicago Climate Exchange: CCX is a private corporation, not a government initiative, which
created a cap and trade system in 2003. A company (such as an electric utility) can agree to
voluntarily participate in the Exchange by making a legally binding commitment to reduce
greenhouse gas emissions. Participants are assigned annual emission allowances based on the
CCX Emission Reduction Schedule. Those who reduce below the targets have surplus
allowances to sell or bank; those who emit above the targets comply by purchasing CCX Carbon
Financial Instrument (CFI) contracts. Trading by third parties on CCX is most likely to occur
through qualified traders or a brokerage firm. CCX allowances have been selling for around
$2.15 per carbon credit. http://www.chicagoclimatex.com/

8/6/2019 White Paper 8-17-09
http://slidepdf.com/reader/full/white-paper-8-17-09 50/87
50
VIII. Environmental Burden Calculation Worksheet
The following table provides burden estimates for the manufacturing, use, laundering, and
disposal of single-use and reusable surgical gowns and drapes. A research presentation entitled
―Life Cycle Assessment of Healthcare Garments‖ co-sponsored by NC State University and
University of California at Davis and presented by Celia Steward Ponder and Dr. MichaelOvercash in 2007 provides data for manufacturing burdens presented in this table.
Universal Environmental Burden Index: Reusable/Single-Use Gowns for 50 Wearings, Pounds
Segment Pollutant Factor ReusableQuantity
ReusableBurden
Single-UseQuantity
Single-UseBurden
Waste to Energy CO2 1 2.88 2.88 72 72
Waste to Energy NOx 100 0.0019 0.19 .0037 4.75W/E EnergyTotal
3.07 76.75
Fuel Sub. Credit -3.07 -76.75
Net Disposal 0 0Garment Mfr CO2 1 5.3 5.3 59 59Garment Mfr NOx 100 0.0037 0.37 0.035 3.5Garment MfrTotal
5.67 62.5
Laundry CO2 1 48.6 48.6 xx xxLaundry NOx 100 0.03 3.00 xx xx
Laundry TSS/CBOD 100 0.15 15 xx xxLaundry Total 66.6 xx xx
Subtotal 72.27 62.5Garment Useand Laundry
Life 700Million
500 Million 70 xx xx
Grand Total 142.27 62.5*CO2 Offsets CO2 1 -62.5 -62.5OffsetNew Total
142.27 0.00
*These calculations are based on 50 launderings per reusable garment. The calculations are in pounds of burden. Inthe case of CO2, it is actual lbs. In the case of other pollutants, it is the actual lbs x 100 to create the equivalentburden (some burdens such as NOx and mercury are rated by the EPA as more environmentally hazardous thanCO2). In the case of safety, the value of one life ($7,000,000) is equivalent to 700 million lbs (350,000 tons). Referto Appendix XII for additional details.

8/6/2019 White Paper 8-17-09
http://slidepdf.com/reader/full/white-paper-8-17-09 51/87
51
Waste Disposal (Combustion Energy and CO2 and NOx Emissions)
Bituminous coal creates 4931 lbs of CO2 /short ton, and 240 lbs of CO2 / Million-Btu.
http://www.eia.doe.gov/oiaf/1605/coefficients.html
Generation of CO2 per lb is a function of the Btu value. Surgical drapes and gowns have a high
Btu value (approximately 19,000 Btu/lb compared to 12,000 Btu/lb for bituminous coal) and
would generate 4-5 lbs of CO2 per lb of garments.
[240 lbs (CO2)/MBtu]X[0.019MBtu/lb of garment] = 4.5 lbs of CO2 per lb of garments
http://www.kchealthcare.com/docs/KL-950-1%20Incineration%20of%20KC%20Single-
use%20HC%20Products.pdf
Polypropylene generates 19,000 Btu per lb. In waste to energy plants, this provides more
electricity than coal. Even in incinerators without energy recovery, this high fuel value product
would reduce the requirement for natural gas to combust the low fuel value components in thewaste mix.
Combustion of 53 lbs of polypropylene yields 1-million Btu. [1MBtu/19,000 Btu/lb = 53 lbs of
polypropylene/Million-Btu]
NOx Emissions
NOx emissions are typically 0.15 lbs/Million-Btu. Therefore,
NOx = [.15lbs/MBtu]X[MBtu/53 lbs of garments] = 0.0028 = 0.003 lbs of NOx /lb of garment.
At 0.32 lbs/garment, the NOx would be 0.32 x 0.003 = 0.00096 lbs of NOx per disposablegarment. Reusable garments are taken to be twice as heavy and would generate 0.64 x 0.003 =
.00192 lbs of NOx /garment.
CO2 Emissions
CO2 emissions are 240 lbs/Million-Btu. Therefore,
CO2 = [240 lbs/MBtu]X[MBtu/53 lbs of garment] = 4.52 lbs of CO2 /lb of garment.
The CO2 per garment would be 0.32 x 4.52 = 1.44 lbs of CO2 per garment (disposable).
Reusable garments would generate 2 x 1.44 = 2.88 lbs of CO2 per garment.

8/6/2019 White Paper 8-17-09
http://slidepdf.com/reader/full/white-paper-8-17-09 52/87
52
Waste-to-Energy Burden (NOx and CO2 Emissions)
Pollutants From
Waste Combustion
Quantity
(lbs/garment)
Number of
Garments
Total
Quantity
(lbs)
Burden
Factor
Total
Burden
(equiv. lbs)
Single-UseGarments (NOx)
.00095 50 .0475 100 4.75
Single-Use
Garments (CO2)1.44 50 72 1 72
Reusable
Garments (NOx).0019 1 .0019 100 0.19
Reusable
Garments (CO2)2.88 1 2.88 1 2.88
Garment Manufacture (NOx and CO2 Emissions)
Energy required is 5162 MJ for 1000 single-use garments and 27380 MJ for 1000 reusable
garments, as reported in the North Carolina State University analysis. One megajoule is 948 Btu.
Hence, it takes [948Btu/MJ]X[5.162MJ/garment] = 4893 Btu/garment. At 0.15 lbs/MBtu for
NOx, NOx per garment = [0.15lbs/MBtu]X[0.004893MBtu/garment] = 0.0007 lbs per garment.
NOx for reusable garments: [948 Btu/MJ]X[27.380MJ/garment] = 0.0259MBtu/garment
[0.0259MBtu/garment]X[0.15 lbs/MBtu] = 0.0038 lbs of NOx per reusable garments.
At 240 lbs of CO2 /Million-Btu, the CO2 per single-use garment is as follows:
[0.004893MBtu/garment]X[240lbs CO2 /MBtu] = 1.17 lbs CO2 .Reusables are as follows: [0.0259MBtu/garment]X[240 lbs CO2 /MBtu] = 6.2 lbs CO2
PollutantQuantity
(lbs/garment)
Number of
Garments
Total
Quantity
(lbs)
Burden
Factor
Total
Burden
(equiv. lbs)
Single-UseGarment(NOx)
.0007 50 .035 100 3.5
Single-UseGarment(CO2)
1.17 50 59 1 59
ReusableGarment(NOx)
.0038 1 .0038 100 .38
ReusableGarment(CO2)
6.2 1 6.2 1 6.2
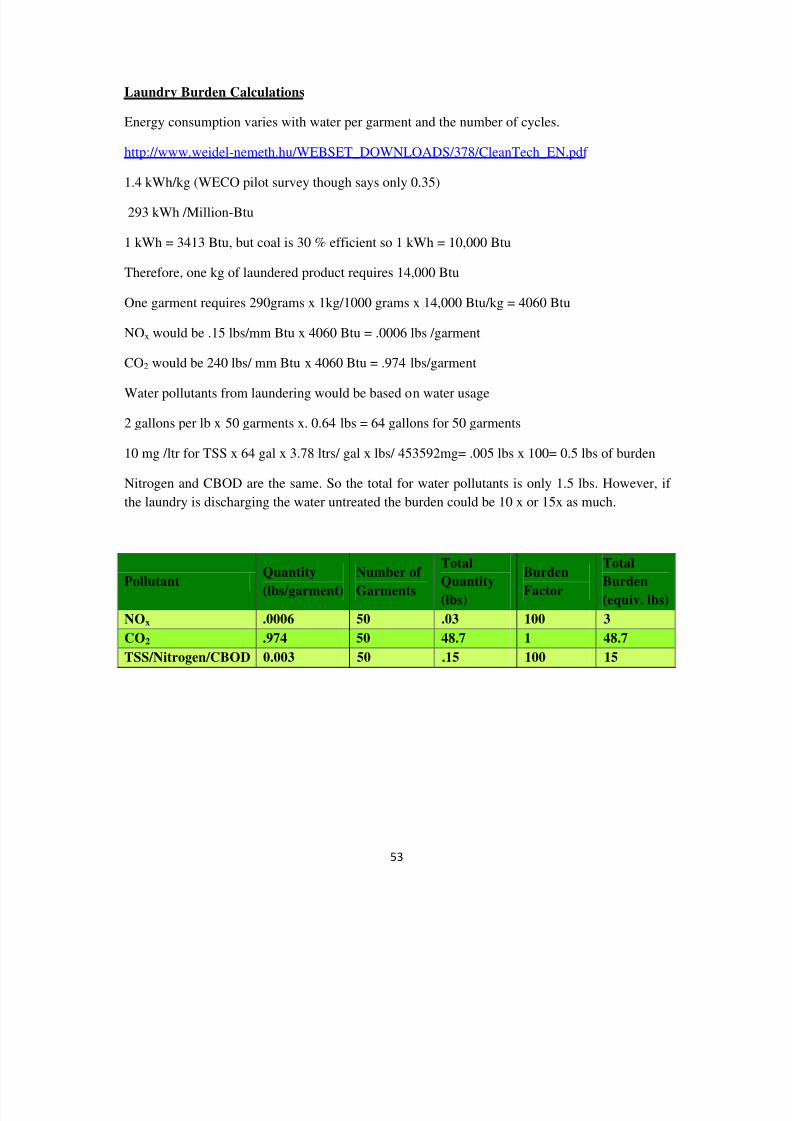
8/6/2019 White Paper 8-17-09
http://slidepdf.com/reader/full/white-paper-8-17-09 53/87
53
Laundry Burden Calculations
Energy consumption varies with water per garment and the number of cycles.
http://www.weidel-nemeth.hu/WEBSET_DOWNLOADS/378/CleanTech_EN.pdf
1.4 kWh/kg (WECO pilot survey though says only 0.35)
293 kWh /Million-Btu
1 kWh = 3413 Btu, but coal is 30 % efficient so 1 kWh = 10,000 Btu
Therefore, one kg of laundered product requires 14,000 Btu
One garment requires 290grams x 1kg/1000 grams x 14,000 Btu/kg = 4060 Btu
NOx would be .15 lbs/mm Btu x 4060 Btu = .0006 lbs /garment
CO2 would be 240 lbs/ mm Btu x 4060 Btu = .974 lbs/garment
Water pollutants from laundering would be based on water usage
2 gallons per lb x 50 garments x. 0.64 lbs = 64 gallons for 50 garments
10 mg /ltr for TSS x 64 gal x 3.78 ltrs/ gal x lbs/ 453592mg= .005 lbs x 100= 0.5 lbs of burden
Nitrogen and CBOD are the same. So the total for water pollutants is only 1.5 lbs. However, if
the laundry is discharging the water untreated the burden could be 10 x or 15x as much.
PollutantQuantity
(lbs/garment)
Number of
Garments
Total
Quantity
(lbs)
Burden
Factor
Total
Burden
(equiv. lbs)
NOx .0006 50 .03 100 3
CO2 .974 50 48.7 1 48.7
TSS/Nitrogen/CBOD 0.003 50 .15 100 15

8/6/2019 White Paper 8-17-09
http://slidepdf.com/reader/full/white-paper-8-17-09 54/87
54
Safety Burden:
As shown on the Universal Environmental burden chart, one life is worth $7 million. With CO2
@ 20/ton, one life is worth 350,000 tons or 700 million lbs. The burden chart is based on 50
wearings. If there were one death saved per 500 million single-use garments sold, the burden
reduction would be 700 million/500 million = 1.4/garment wearings x 50 = 70 lbs burdenreduction for 50 wearings.
Assuming $200/lost day for illness, each day is the equivalent of 10 tons of burden (CO2 @
$20/ton) or 20,000 lbs.
20,000 lbs/lost day x l lost day/14285 garment wearings = 1.4 lbs /garment wearing x 50 = 70 lbs
of burden reduction for 50 wearings.
Resource Depletion
Sustainability requires inclusion of the potential depletion of resources. There is a 40-yearsupply of oil, so potential depletion of this resource is significant. There is a 200-year supply of
coal so the depletion impact of l pound is an order of magnitude less than oil.
Only a fraction of 1% of the world‘s water is both uncontaminated and available. However there
is a big difference in availability between cities such as Phoenix which suffers a large water
deficit and Minneapolis which has a water surplus. Where there is a surplus of water, depletion
would be similar to coal. But where there is a water deficit the loss would be similar to oil.
There are temporary situations where the water deficit turns into a drought.
Water Resource Depletion
The resource depletion for water used in laundries for reusable gowns is shown below.
Item Water surplusburden
Water deficitburden
WaterDroughtburden
Reusable GarmentWeight (lbs)
0.64
Water usage 2 gal/lbWater Usage(gal/garment)
1.3 gal
Water Usage(lbs/garment)
10.8
Lbs/50 wearings 540Water Surplusburden of 0.001
1
Deficit at 0.01 10Drought at 0.l 100

8/6/2019 White Paper 8-17-09
http://slidepdf.com/reader/full/white-paper-8-17-09 55/87
55
In a normal area of water surplus, the burden added by water resource depletion is only a smallamount and would not impact the choice between reusable garments and single-use garments. In
a water deficit region it would be a significant factor. In a drought condition, the burden would
be larger than any other.
Category EnvironmentalBurden
Safety Water ResourceDepletionFactor
TotalEnvironmentalBurden
Single-Use
Garments
62.5 0 0.16 62.66
ReusableGarments(water surplus)
72.27 70 1 143.27
ReusableGarments(water deficit)
72.27 70 10 152.27
ReusableGarments(drought)
72.27 70 100 242.27

8/6/2019 White Paper 8-17-09
http://slidepdf.com/reader/full/white-paper-8-17-09 56/87
56
Oil Resource Depletion
The garments are made almost entirely of oil as the raw product. So the resource depletion is
simply the weight for 50 wearings multiplied by the burden factor.
Burden from resource depletion of oil for 50 wearings
Category Lbs/garment Number of Garments
Total lbs for 50Wearings
Burden ( .01)
ReusableGarments
0.64 1 0.64 0.0064
Single-UseGarments
0.32 50 16 0.16
Oil and Water Resource Depletion
The oil used in the manufacturing and the water used in the laundering are the two resources that
are significantly depleted. So the total resource depletion is the aggregate of these two.
Category Oil Water Total
Single-UseGarments
0.16 0 0.16
ReusableGarments
(water surplus)
0.0064 1 1.0064
ReusableGarments(water deficit)
0.0064 10 10.0064
ReusableGarments(drought)
0.0064 100 100.0064
It is therefore apparent that water resource depletion becomes an important burden in regions
where there is a water deficit and the most important burden in areas of drought.

8/6/2019 White Paper 8-17-09
http://slidepdf.com/reader/full/white-paper-8-17-09 57/87
57
Waste Disposal Landfill Resource Depletion
The basis for the main comparison was based on waste-to-energy or incineration. Either one
would result in a net 0 burden due to the high fuel value. An alternative is disposal in a normal or
hazardous waste landfill.
The environmental burden of a normal landfill would be similar to the depletion of a common
resource such as coal. We will run out of land fill space about the same time we run out of coal
(200 years). So an equivalent burden of 0.001 is appropriate. Hazardous waste landfills are
associated with a higher burden due to risk and availability. Therefore a burden of 0.01 is
appropriate.
If red bags are not decontaminated they would have to be disposed in hazardous waste landfills.
But there are many ways to de-contaminate the waste so that it would be disposed in normal
waste landfills. In either case the environmental impact for 50 wearings is less than 0.2 for
single-use garments. Therefore waste disposal is a non-issue. More than 254 million tons of waste is generated in the U.S. The 18,600 tons generated by 30 million garments is insignificant
and thus the low numerical environmental burden.
Environmental Burden (lbs) due to garment disposal and based on 50 wearings.
Category Lbs/garment Number of garments
Total lbs for50 wearings
Burden forhazardouswaste at 0.01
Burden fornormalwaste @.00l
Reusable
Garments
0.64 1 0.64 0.0064 0.00064
Single-UseGarments
0.32 50 16 0.16 0.016
Resource Usage Calculations
Resource utilization is another important parameter. A quantitative total can be obtained by
adding the weight of material used in the garments, the weight of equivalent coal to produce the
energy to make the garments, and the water used both in manufacture and in laundering.
Laundering
One reusable garment requires water at the rate of 2 gallons per pound of material laundered.
2 gal/lb x .64 lbs/garment x 50 = 64 gallons for 50 garments.
So reusables use 64 gallons x 8.33 lbs/gal or 533 lbs for 50 reusable garments.

8/6/2019 White Paper 8-17-09
http://slidepdf.com/reader/full/white-paper-8-17-09 58/87
58
Laundering requires 2030 btu/garment. So the total lbs of equivalent coal would be 1 lb of coal
/14,000 btu/lb x 2030 btu/garment wearing x 3 inefficiency x 50 garments = 22
Manufacturing
The quantity of material in 50 wearings of garment for reusables is
.64 lbs/garment x l garment = 0.64 lbs
The single-use garment weight is .32 lbs/ garment x 50 = 16
Coal is 1lb/ 14,000 btu x 4930 /btu/garment x 3 inefficiency= 1.05 lbs x 50 garments = 52.5 lbs
if it were all coal at very low efficiency
Reusables would be 27380/ 5162 x 1.05= 5.30 for 50 wearings
Water used in manufacture disposal is 531 kg/1000 garments for disposable. So 531kg x 2.2
/1000 x 50 = 58 lbs for 50 wearings
For reusable it is 3000 kg/ 1000 garments x 2.2 x1=6.6 lbs for one garment to be worn 50 times
The following chart shows the resource totals for the two alternatives
Lbs of resources for 50 wearings of garments
The reusable garments require 567/126 or 4.5 times the weight of resources consumed by single-
use garments.
Category Manufacturing Laundering Total
Reusable Single-
Use
Reusable Single-
Use
Reusable Single-
UseGarmentmaterial(lbs)
0.64 16 0.64 16
Water(lbs)
6.6 58 533 539.6 58
Energy(lbs of coalequivalent)
5.3 52.5 22 27.3 52.5
Total 12.53 126.5 547 567.5 126.5

8/6/2019 White Paper 8-17-09
http://slidepdf.com/reader/full/white-paper-8-17-09 59/87
59
IX. Waste Handling References
BioMedical Technology Solutions, Inc
http://www.bmtscorp.com/index.htm
The Demolizer® II
The system for low to medium volume medical waste generators, is approved, or meets
regulatory requirements in 47 states, for treatment and disposal of both sharps and red bag waste.
About the size of a desktop printer, the Demolizer® II ensures complete disposal of medical
waste, automatically documents state-required records, and eliminates the generator's cradle-to-
grave liability. The patented treatment process, using dry heat technology, renders waste sterile
and sharps unrecognizable. The treated waste is properly labeled and simply thrown away as
common trash.
ECodas
ECODAS has developed a closed, and fully automated system that sterilizes Regulated Medical
Waste (RMW), reduces its volume by 80 %, and renders its components unrecognizable.
The process combines shredding and direct pressurized heated steam all in one enclosed system
achieving complete sterilization of infectious materials. The final treated waste is harmless,
unrecognizable, and safe for disposal, just like ordinary municipal waste.
The solution consists first of shredding, which permits steam penetration and ensures that all
waste is in direct contact with the sterilizing steam. Then superheated steam (138°C/280°F)
under high pressure (3.8 bars/55 psi) destroys all forms of microbial life. This is a simple,
efficient and cost effective operation to convert contaminated medical materials into harmless
municipal waste.
The ECODAS SYSTEMS were designed to handle a large variety of regulated medical waste,
including hospital and laboratory waste, liquid and solid medical waste, human and animal blood
specimens, sharps and pathological waste, cultures and stocks, as well as any other waste listed
in local, state and federal regulations as medical waste.

8/6/2019 White Paper 8-17-09
http://slidepdf.com/reader/full/white-paper-8-17-09 60/87
60
The French Ministries of Health and the Environment have approved several non-incineration
processes to treat potentially infectious wastes, including a steam system developed by Ecodas,
headquartered in Roubaix. According to Oliva, this company is the leading provider of
alternative biomedical waste treatments.
Ecodas drew upon its 20 years of experience manufacturing steam pressure autoclaves for the
textile industry to design a medical waste treatment system. "The innovation lies in combining a
high-strength grinder with a particularly powerful sterilizer," said Jaafar Squali, managing
director of Ecodas.
The first stage of the Ecodas treatment involves loading contaminated waste into a hermetically
sealed chamber that feeds a grinder with 20 rotating blades. These blades are fashioned from an
alloy strong enough to shred stainless steel surgical instruments that are sometimes mistakenly
disposed of with other clinical wastes. The grinder reverses its rotation at regular intervals to
prevent jamming.
Loads of waste are emptied into a loading chamber that feeds the autoclave. Inside the autoclave,
the waste is subjected to steam heated to 280[degrees]F and pressurized to 55 pounds per square
inch for 10 minutes, which sterilizes the waste. A temperature probe in the center of the
autoclave embedded in the waste sends signals to the computer control system to regulate
temperature.
When disinfection is complete, operators open the lower lid of the autoclave to release the
processed waste into a container. The entire process takes about one hour to treat a single load.
Ecodas designed three different versions of its waste treatment machines to accommodate a
range of waste volumes and space available for installation. The TDS 300 is 10 feet tall and
treats 35 to 55 pounds of waste per hour; the TDS 1000 treats 110 pounds per hour, and the TDS
2000 treats up to 132 pounds per hour.
In France, public hospitals in Ajaccio, Aurillac, Nevers, and Roubaix disinfect their wastes with
Ecodas autoclaves. So do hospitals in Odense, Denmark; Majorca, Spain, and Budapest,
Hungary. Among the waste processing companies that use the Ecodas system are Cosmolys and
Tecmed in France, Tecsan in Argentina, Matmed in Brazil, and Tremesa in Mexico.

8/6/2019 White Paper 8-17-09
http://slidepdf.com/reader/full/white-paper-8-17-09 61/87
61
Honua Technologies (Advanced Biowaste Solutions)
http://www.honuatech.com/index.html
The waste stream that the Pyrolytic Destructor™ is specifically designed to destroy includes
pathological wastes from surgery and autopsy (e.g., body parts, human and animal tissue samples
and cultures, placentas, whole blood and blood products); chemotherapy wastes (e.g., all
materials that come into contact with chemotherapy agents, including polyvinyl chloride
("PVC") plastics); laboratory wastes (e.g., blood cultures, serums, blood samples); and
pharmaceutical wastes (e.g., expired drugs, confiscated narcotics, and related drug
paraphernalia).
Honua also employs autoclaving, a time-tested high heat medical waste treatment technology, to
efficiently and cost-effectively render large volumes of medical "red bag" waste (e.g.,
contaminated bandages, dressings, cotton, gauze, paper, gowns, bedding, latex gloves, masks,
suction canisters and sponges) and "sharps" (e.g. contaminated needles, syringes, syringes
containing fluids, scalpels, and glass test tubes, pipettes and petri dishes) non-infectious and safe
for disposal.
Honua also uses its proprietary heat recovery systems, heat recovery boilers and thermal energy
cogeneration control equipment to ensure that medical waste treatment facilities utilizing the
Pyrolytic Destructor and autoclave systems together can effectively treat 100% of the
components of the medical waste stream with only the energy used in and produced from
treating 20% of that same waste stream.
Finally, Honua employs proprietary sharps containment and washing systems to enable medical
waste facilities and hospitals to safely handle and reuse its reusable sharps containers, which
amounts to a dramatic cost savings when compared to conventional disposable sharps containers.
Pyrolysis is the endothermic (heat absorbing reaction) gasification of waste using external energy
(heat) in the absence of oxygen. In practice, it involves the controlled breakdown of the waste's
molecular structures by elevating their temperatures in the absence of oxygen. High heat must be
applied from an external source. Because the flame never touches the waste, and no outside air is
added to the chamber, pyrolysis does not allow the waste to combust (an exothermic or heat

8/6/2019 White Paper 8-17-09
http://slidepdf.com/reader/full/white-paper-8-17-09 62/87
62
releasing reaction) within the pyrolysis chamber as it would in a traditional, starved air, rotary
kiln, or plasma arc incinerator. There is no turbulence or flame in the pyrolysis chamber to cause
currents that carry away air emissions and particulate.
There are no visible particulate emissions from a properly operated Pyrolytic Destructor and iteasily meets the most stringent emissions laws in the world - the United States Environmental
Protection Agency's regulations pertaining to regulated medical waste incinerators.
The United States Environmental Protection Agency (U.S. EPA) has excluded equipment
achieving true pyrolysis from the hospital and medical waste incinerator regulations because
pyrolysis is not considered incineration. The U.S. EPA has even provided a specific exemption
for pyrolysis in its most current air pollution regulations (40 CFR 60.50.c(f)). The U.S. EPA has
set very rigid standards for pyrolysis. In order to qualify, Honua submitted detailed test results to
the U.S. EPA, which have been accepted. Honua' claims that its Pyrolytic Destructors are the
only such units that meet the U.S. EPA exemption.
Honua's proprietary Pyrolytic Destructor systems have sealed pyrolysis chambers with small
ducts to allow the transfer of volatile organic compounds ("VOCs" or hydrocarbons). No
external air (oxygen) can enter the chamber once it has been sealed. As the pyrolysis cycle
begins, heat is transferred through the pyrolytic chamber hearth (floor) from the hot gases
produced by a standard industrial burner. Temperature in the pyrolysis chamber is gradually
increased until the chamber reaches operating temperature.
As the temperature in the pyrolysis chamber increases, air trapped in the chamber expands and is
transferred through the small venting duct. Pyrolysis begins at approximately 232°C (450°F),
when the more volatile components of the waste begin to gasify. Heat continues to be applied at
a controlled rate until the internal temperature of the pyrolysis chamber has reached the set point
of 760°C (1,400°F). Heat transfer is controlled to maintain the set temperature for a sufficient
period of time, in order to completely gasify all organic components of the waste. When gasified
in the absence of oxygen, the VOCs are not combusted as they would be in an incinerator -
where the violence and agitation of the combustion process yields particulate and chemical air
pollution. Instead, they are gently transferred in their gaseous state to the oxidization chambers,

8/6/2019 White Paper 8-17-09
http://slidepdf.com/reader/full/white-paper-8-17-09 63/87
63
where the controlled application of heat and air completely oxidizes them - virtually eliminating
any toxic or hazardous by-products.
After contributing significant energy content to the continuous heating of the pyrolysis
chambers, hot gases from the oxidation chambers are then discharged through the exhaust ductsor captured by the heat recovery system for use in heating the Heat Recovery Boiler. All that is
left of the waste is a totally inert, non-toxic carbon residue that is virtually undisturbed.
Honua offers three (3) Models of Pyrolytic Destructors as the optimum technology for
destruction of pathological and chemotherapy waste stream components. They are the Model 550
(500 kg per day), Model 1200 (1000 kg per day) and Model 2500 (2000 kg per day). Honua‘s
Pyrolytic Destructors will literally serve as the heart of a centralized medical waste treatment
facility.
Autoclaving (steam sterilization), heats medical waste to approximately 135°C (275°F) until the
waste is rendered non-infectious. The treated waste can then be shredded and compacted for safe
and efficient handling to a landfill site. In a typical Honua installation, autoclaves will be used to
treat approximately 80% of the waste (the muscle) using supplemental energy from the Pyrolytic
Destructor (the heart).
Honua specifies industrial autoclaves for use in centralized medical waste facilities because of
their low acquisition cost, ease of use, reliability, and low maintenance requirements. Honua's
autoclave manufacturer has been in the autoclave and pressure vessel manufacturing business for
over thirty years. They have a full staff of engineers and produce autoclaves and other pressure
vessels for many different applications and industries. All of Honua's autoclaves are
manufactured in strict accordance with the exacting ASME Boiler and Pressure Vessel Code
standards and regulations. Honua's autoclave products are custom built to meet the individual
needs of each project and will be supplied as a part of Honua's total system to work in seamlessly
with the Pyrolytic Destructor and matched heat recovery and auxiliary fired boiler systems.
Honua specified autoclaves have completely automated control systems allowing for unattended
operation. After pushing the "Cycle Start" pushbutton, the sterilizer will proceed through a purge
cycle, that is, both the steam inlet and vent valves will be open, allowing the steam to completely
fill the chamber and force all air out. This ensures better penetration and sterilization

8/6/2019 White Paper 8-17-09
http://slidepdf.com/reader/full/white-paper-8-17-09 64/87
64
effectiveness. An adjustable timer controls the purge cycle. At the completion of the purge time,
the exhaust valve will close and allow pressurization of the unit. An alarm switch starts the main
cycle timer, which begins only upon reaching sterilization temperature. At the completion of the
timed period an exhaust vent valve will open to de-pressurize the sterilizer. A safety relief valve
is provided to prevent over-pressurization of the sterilizer vessel. The controls include an
"Emergency Stop" button should there be requirements for an emergency shutdown.
Autoclaves require high temperature stainless steel carts. An autoclave may be operated with as
few as five (5) carts, however, Honua recommends ten (10) carts to ensure that the facility
operates in an efficient manner between autoclave cycles. While the autoclaves are cycling, a
second and third load can be prepared for loading. Once the autoclaves have cycled, they can
quickly be discharged, unloaded and reloaded in a short time to allow for the maximum number
of autoclave cycles per day.
Sanitec
The entire Sanitec disinfection system is enclosed in a all-weather steel housing, and is
connected to the hospital's electrical and water systems. Hospital workers bring collected waste
in carts to the automated lift and load system, which raises the cart and empties it into the in-feed
hopper. The hopper is sealed and the shredder is activated. Shredding reduces the waste's volume
by 80 percent and, just as important, creates a more even waste stream that can be effectively
treated at lower temperatures, minimizing the system's overall energy consumption as well as the
potential for releasing potentially harmful air emissions.
The Shredding Challenge
Designing a shredding mechanism for medical waste is more challenging than a mechanism that
shreds tires or tree stumps, because medical waste is, by definition, a heterogeneous mixture.
"The Sanitec system has to shred soft fabric drapes, gowns and bandages, brittle glass, plasticsyringes, and hard steel needles, knives, and clamps. "A proprietary shredder consists of two
rotating shafts with teeth that grind all types of regulated hospital wastes to the proper size, so
that it falls through a close tolerance screen to the next stage."

8/6/2019 White Paper 8-17-09
http://slidepdf.com/reader/full/white-paper-8-17-09 65/87
65
A fan draws air from the in feed hopper through a series of filters. A high-efficiency particulate
air, or HEPA, filter and a carbon filter control odors and prevent harmful emissions from
escaping during processing.
A stainless steel screw conveyor moves the shredded waste through the output of an electricsteam generator that uses about 8 gallons of water per hour to add moisture to the waste. The
moistened waste then passes through a series of a half-dozen 1,400-watt microwave units made
by Alter of Reggio Emilia, Italy. The microwaves excite the water molecules on the waste
particles, creating friction and raising the temperature of the waste to 205 to 212[degrees]F for
25 minutes.
The combination of high temperature and residence time is sufficient to ensure the destruction of
pathogens, a process that is validated by regular spot checks.
A secondary screw conveyor removes the treated waste from the Sanitec unit to a standard waste
compactor or dumpster prior to its final disposal into a municipal solid waste program. An
optional granulator enables the hospital to further reduce waste volume.
The entire Sanitec process is overseen by an Allen Bradley microprocessor equipped with a
computer program that monitors the residence time and temperature parameters to ensure that
disinfection is complete before the waste is discharged.
A group of four hospitals in Madison, Wis.--the University of Wisconsin Hospital and Clinics,
Meriter Hospital, Methodist Hospital, and St. Mary's Medical Center--joined forces in 1986 to
create a shared medical waste processing facility to reduce costs. The hospitals formed a
nonprofit corporation called Madison Energy Recovery Inc., or MERI, to operate the plant,
which was originally equipped with a state-of-the art incinerator.
By 1994, tighter environmental regulations meant that the incinerator would have to be
retrofitted with new pollution control equipment at a cost likely to exceed $500,000. After
reviewing options, the MERI board selected the Sanitec disinfection system.
"We find the Sanitec system to be quiet, clean, and very efficient in disinfecting waste," said
John Crha, general manager of MERI. Many health care facilities agree, and today the MERI

8/6/2019 White Paper 8-17-09
http://slidepdf.com/reader/full/white-paper-8-17-09 66/87
66
Sanitec system processes more than 1.5 million pounds of regulated medical waste per year
generated from 12 additional hospitals and clinics throughout the state, including Mercy Health
Systems in Janesville and St. Agnes Hospital in Fond du Lac.
Each day, a specially designated MERI truck picks up plastic carts filled with waste packaged inred bag or plastic sharps containers from 250 locations. After the carts are emptied into the
Sanitec system, they are washed, cleaned, and disinfected before being trucked back to their
hospitals. Each cart is tracked by signed manifests, which are also used to bill the participating
hospitals. Treated wastes are sent to municipal solid waste landfills.
Mobile Microwave disinfection
Rather than transporting waste to a disinfection site, SafeWaste Inc. of Charlotte, N.C., brings
the Sanitec process to hospitals in its home state and Virginia on four truck-mounted, mobile
units. SafeWaste's Sanitec trucks pick up the waste from almost 40 hospitals, including Carolina
Medical Center in Charlotte, and Fairfax Hospital in Fairfax, Va., and treat it on-site, using each
hospital's water and power connections. The company uses smaller vans to treat waste from more
than 400 smaller medical facilities, including doctor's offices, rural clinics, laboratories, and
veterinary establishments. In all, SafeWaste processes nearly 10 million pounds of potentially
hazardous material annually.
Sanitec has set its sights beyond its traditional practice of selling its microwave disinfection
systems to hospitals and waste treatment companies. "We are now concentrating on creating our
own service companies by forming joint ventures such as Sanitec of Kentucky, in Florence, Ky.,
and Sanitec of Hawaii in Honolulu," Taitz said. "We supply the equipment to the joint venture
and participate in the revenues, thus making our sterilization equipment more accessible to the
end user. Hopefully, we can eventually create a nationwide treatment for all medical waste
generators."
Taitz sees bright prospects for the Sanitec system outside the United States as well. "Our biggest
sales growth is in offshore markets, including Brazil, Japan, Korea, Saudi Arabia, the United
Kingdom, the Philippines, and Kuwait," Taitz noted.

8/6/2019 White Paper 8-17-09
http://slidepdf.com/reader/full/white-paper-8-17-09 67/87

8/6/2019 White Paper 8-17-09
http://slidepdf.com/reader/full/white-paper-8-17-09 68/87
68
"The greatest challenge in designing the first MediWaste system was making waste hot enough
to sterilize it, but cool enough to prevent volatile organic compounds from being released from
the plastic waste," said Sue Herbert, a mechanical engineer and project engineer for the Laredo
installation. "We collected samples of everything that ends up in a hospital waste stream, and
worked with plastic companies to study the flash points of the different plastic compounds in
order to find the optimum heating temperature."
Mercy Health System workers use covered carts to deliver their waste materials to the
MediWaste unit. A hydraulic lifting system empties each cart into the system's feed hopper.
Internal exhaust fans create negative pressure within the MediWaste system to control odors.
Inside the unit is a shredder consisting of four shafts covered with closely interlocking teeth,
made of a heat-treated stainless steel. The shredder grinds the waste before it is sent to a
processor. Air heated to about 320[degrees]F by electrical resistance heaters is injected into the
processor at high velocity through a fixed blade ring. The blades are angled to direct the air in a
manner that optimizes turbulence within the processor. As the ground waste enters the processor,
the turbulent air creates a fluidized bed that provides cyclonic mixing action, and high rates of
heat and mass transfer.
The waste remains in the fluidized bed for five minutes before a dump door opens so that the
material is propelled into a compactor unit that reduces its volume by 80 percent. The Laredo
hospital sends its treated waste to a conventional municipal waste landfill.
The processed air that exits the MediWaste system passes through three stages of filtration
before entering the atmosphere. First, two fabric prefilters remove gross particulates before the
high-efficiency particulate air filter--a membrane contained in a metal frame--removes smaller
particulates. Charcoal filters eliminate odors from the airstream.
The MediWaste system at Laredo is designed to treat up to 200 pounds of material per hour,which is more than sufficient to treat the 700 to 800 pounds of waste generated per day. "We are
currently developing a unit capable of disinfecting up to 1,000 pounds of material per hour," said
Herbert.

8/6/2019 White Paper 8-17-09
http://slidepdf.com/reader/full/white-paper-8-17-09 69/87

8/6/2019 White Paper 8-17-09
http://slidepdf.com/reader/full/white-paper-8-17-09 70/87
70
In addition to reducing the volume of medical waste by more than 90 percent of its original bulk,
the Crawford incinerators reduce its weight by 95 to 97 percent, something that microwave and
steam autoclave systems cannot do, noted Llorens.
The incineration chambers' walls consist of brick, insulation, a steel shell, and a second steelouter shell. "We run air through the sidewalls by fan to keep the outer wall of the incinerator cool
to prevent injuries," said Llorens. In addition, Crawford mounted a fan to induce a draft into the
incinerators' refractory-lined stack. This helps the incinerator run cleaner, and keeps the gases in
the secondary chamber at a lower flow, increasing their retention times to ensure that they will
burn.
"There are other good medical waste treatment technologies, such as microwave, but incineration
is still the best option under the right conditions," Llorens said. "Hospitals' choice depends on
their communities and their needs."
For example, the Department of Veterans Affairs' Medical Center in West Palm Beach, Fla., has
been using a Crawford incinerator since 1995 to process its wastes, as well as occasional loads of
illicit drugs and weapons seized by local and federal law enforcers.
"We selected the Crawford incinerator because it quietly and efficiently destroys all materials,
producing an ash that weighs 5 to 10 percent of the pretreated waste, and can be landfilled," said
Wally Thompson, a mechanical engineer and chief of facilities management at the V.A. Medical
Center in West Palm Beach.
The key to the success of the Crawford unit hinges on its scrubber. V.A. representatives in West
Palm Beach worked with Emcotek of Visalia, Calif., to design a scrubber for the incinerator that
processes 500 pounds of waste per hour. Hot gases, leaving the incinerator at 1,900 to
2,100[degrees]F, enter the Emcotek scrubber's primary quench tank. Spray nozzles apply water
and sodium hydroxide to cool the gases to approximately 200[degrees]F and neutralize thehydrochloric acid generated during incineration. The gas then enters a secondary quench tank
where the spray process is repeated, cooling the gases to 120 to 140[degrees]F and buffering
acids with more sodium hydroxide.

8/6/2019 White Paper 8-17-09
http://slidepdf.com/reader/full/white-paper-8-17-09 71/87
71
The piping system contains pH probes connected to a programmable logic controller. The PLC
controls two positive displacement pumps that inject the amount of sodium hydroxide needed to
neutralize the acid waste.
The quenched gases enter a rotary atomizer chamber where a gearbox pumps water into thecenter of a rotating disc that creates a radial curtain of water. This curtain provides a high-energy
wet scrubbing action that reduces particulates to approximately 0.015 gram per dry standard
cubic foot of air or better.
A bank of demister filters removes excess water droplets, which can carry various heavy metals
and particulate matter, before the gas stream is exhausted through the stack. The Emcotek
scrubber removes 95 to 99 percent of acids, heavy metals, dioxin, and various organic
compounds from the gas stream. The scrubber's performance is monitored by various sampling
probes installed in the discharge stack.
Because of the emissions standards for Palm Beach County, the V.A. requested that Emcotek
add a titanium heat exchanger to lower the temperature of the water that feeds the rotary
atomizer to 80 or 85[degrees]F to optimize the removal of heavy metals.
As is the case with many incinerators that meet environmental specifications, the West Palm
Beach facility gave consideration to aesthetics. "We also had Emcotek add a titanium steam coil
in the scrubber stack to reheat the cool gas stream, which is saturated, to remove an unsightly,
but otherwise harmless, plume cloud," Thompson said.
AUTOCLAVING
Several years ago, Maine hospitals found themselves subject to rising prices as the sole medical
waste vendor in the state switched from charging customers by the pound to charging them by
the container. This transition meant hospitals in the state went from paying anywhere from
$0.24-0.26 cents per lb to upwards of $0.40 to $0.50 cents per lb. In addition, there was concern
on the part of hospitals and the community that waste treated by the vendor was disinfected and
then incinerated in a waste-to-energy plant which contributed to both mercury and dioxin
emissions.

8/6/2019 White Paper 8-17-09
http://slidepdf.com/reader/full/white-paper-8-17-09 72/87
72
The Maine Hospital Association (MHA), in collaboration with its members, the Maine
Department of Environmental Protection and Synernet, a local consulting company, began
looking for an alternative way of handling medical waste in the state. MHA, through its
subsidiary, Associated Health Resources, decided upon purchasing and siting a ‗hydroclave‘
unit, in Pittsfield, ME. The hydroclave is similar to an autoclave and works by steam sterilizing
medical waste in an internal chamber which has internal paddle-like devices that both break
down and move the waste around for maximum disinfection. Waste is then shredded and
landfilled. The MHA contracted with Hydroclave to build the unit and Hydroclave subcontracts
with Sterilogic to manage the day-to day operations of the plant. Only pathological and trace
chemotherapy waste are still incinerated, and only because state law still requires it. Thirty-two
of Maine‘s 39 hospitals have currently switched to the new technology, as of 2005 and MHA
expects all 39 to be on board in the next few years as former contracts expire. In addition, the
Maine program is rolling out the use of reusable medical waste toters that are washed and
disinfected, back-hauled to the hospitals and reused — potentially eliminating anywhere from 40-
60,000 cardboard containers per year. Reusable sharps container program is under discussion as
well.
An article in the Maine Telegram discusses the program in its early stages:
www.noharm.org/details.cfm?type=news&ID=51.

8/6/2019 White Paper 8-17-09
http://slidepdf.com/reader/full/white-paper-8-17-09 73/87

8/6/2019 White Paper 8-17-09
http://slidepdf.com/reader/full/white-paper-8-17-09 74/87
74
The following graphics and text are exerpted from the Dow Jones Sustainability Index Website.
OVERVIEW
Launched in 1999, the Dow Jones Sustainability Indexes track the financial performance of the leading
sustainability-driven companies worldwide. Based on the cooperation of Dow Jones Indexes, STOXX Limited
and SAM Group the indexes provide asset managers with reliable and objective benchmarks to manage
sustainability portfolios. The DJSI family currently comprises global, European, Eurozone, North American
and US benchmarks.
Dow Jones Sustainability World Index
The Dow Jones Sustainability World Index (DJSI World) covers the top 10% of the biggest 2,500 companiesin the Dow Jones World Index in terms of economic, environmental and social criteria. This index was first
published on 8 September, 1999.
Dow Jones STOXX Sustainability Index and Dow Jones EURO STOXX Sustainability Index
As a benchmark for European sustainability investments, the Dow Jones STOXX Sustainability Index (DJSI
STOXX) covers the leading 20% in terms of sustainability of the companies in the Dow Jones STOXX SM 600
Index. The Dow Jones EURO STOXX Sustainability Index (DJSI EURO STOXX) is the Eurozone subset of the
DJSI STOXX and, thus, tracks the financial performance of sustainability leaders in this particular region.
This set of indexes was launched on 15 October, 2001.
Dow Jones Sustainability North America Index and Dow Jones Sustainability United States Index
The Dow Jones Sustainability North America Index (DJSI North America) cover the leading 20% in terms of
sustainability of the 600 biggest North American companies in the Dow Jones World Index. The Dow Jones
Sustainability United States Index (DJSI United States) is the US subset of the DJSI North America. This set
of indexes was introduced on 23 September, 2005.
Customized Indexes
In addition, the DJSI methodology facilitates the design, development and delivery of customized
sustainability indexes; e.g. indexes covering different regions, indexes covering different segments of the
leading sustainability companies, indexes covering additional exclusion criteria and indexes denominated in
different currencies.

8/6/2019 White Paper 8-17-09
http://slidepdf.com/reader/full/white-paper-8-17-09 75/87
75
The following graphics and text are exerpted from the Dow Jones Sustainability Index Website.
CORPORATE SUSTAINABILITY
Corporate Sustainability is a business approach that creates long-term shareholder value by embracing
opportunities and managing risks deriving from economic, environmental and social developments.
Corporate sustainability leaders achieve long-term shareholder value by gearing their strategies and
management to harness the market's potential for sustainability products and services while at the same
time successfully reducing and avoiding sustainability costs and risks.
The quality of a company's strategy and management and its performance in dealing with opportunities and
risks deriving from economic, environmental and social developments can be quantified and used to identify
and select leading companies for investment purposes.
Leading sustainability companies display high levels of competence in addressing global and industry
challenges in a variety of areas:
Strategy: Integrating long-term economic, environmental and social aspects in their business strategies
while maintaining global competitiveness and brand reputation.
Financial: Meeting shareholders' demands for sound financial returns, long-term economic growth, open
communication and transparent financial accounting.
Customer & Product: Fostering loyalty by investing in customer relationship management and product and
service innovation that focuses on technologies and systems, which use financial, natural and social
resources in an efficient, effective and economic manner over the long-term.
Governance and Stakeholder: Setting the highest standards of corporate governance and stakeholder
engagement, including corporate codes of conduct and public reporting.
Human: Managing human resources to maintain workforce capabilities and employee satisfaction through
best-in-class organizational learning and knowledge management practices and remuneration and benefit
programs.
Corporate sustainability performance is an investable concept. This is crucial in driving interest and
investments in sustainability to the mutual benefit of companies and investors. As this benefit circle
strengthens, it will have a positive effect on the societies and economies of both the developed and
developing world.

8/6/2019 White Paper 8-17-09
http://slidepdf.com/reader/full/white-paper-8-17-09 76/87
76
The following graphics and text are exerpted from the Dow Jones Sustainability Index Website.
CRITERIA AND WEIGHTINGS
Corporate Sustainability Assessment Criteria
Dimension Criteria Weighting (%)
Economic Codes of Conduct / Compliance / Corruption & Bribery 5.5
Corporate Governance 6.0
Risk & Crisis Management 6.0
Industry Specific Criteria Depends onIndustry
Environment Environmental Performance (Eco-Efficiency) 7.0
Environmental Reporting* 3.0
Industry Specific Criteria Depends onIndustry
Social Corporate Citizenship/ Philanthropy 3.5
Labor Practice Indicators 5.0
Human Capital Development 5.5
Social Reporting* 3.0
Talent Attraction & Retention 5.5
Industry Specific Criteria Depends onIndustry
*Criteria assessed based on publicly available information only
For more details about each individual criteria, please have a look at the SAM Questionnaire.

8/6/2019 White Paper 8-17-09
http://slidepdf.com/reader/full/white-paper-8-17-09 77/87
77
XI. Bio-Polymers
Following is a Press Release by Cereplast, Inc, a manufacturer of bio-based sustainable plastics.
“Cereplast, Inc., manufacturer of proprietary bio-based, sustainable plastics, today announced that it has received confirmation of the low carbon footprint of its bioplastics-based
Biopropylene(R) resin. In conjunction with Ramani Narayan University Distinguished Professor
of Michigan State University, and after several months of research by an independent testing
laboratory, it is demonstrated that the intrinsic carbon dioxide emissions reduction in using
Biopropylene(R) in place off regular polypropylene is 42%.
The study found that approximately 1.82 kilograms of carbon dioxide are produced for each
kilogram of Biopropylene(R) used, compared to 3.14 kilograms of carbon dioxide emitted for the
same amount of polypropylene.
"By using Biopropylene(R) instead of polypropylene, converters generate 1.32 kilos less carbon
dioxide for each kilo of product they manufacture," said Frederic Scheer, Cereplast's Chairman
and CEO. "This is a very significant reduction in carbon dioxide emissions, especially when
considering that worldwide market for polypropylene is about 45 billion kilograms, or
approximately 100 billion pounds."
"This recent development offered by Cereplast is quite interesting. I see this family of resins
providing an intrinsic reduced carbon footprint value," said Professor Narayan.
"Besides dramatically reducing carbon dioxide emissions during conversion, Biopropylene(R)
also delivers the environmental advantage of replacing up to one-half of the petroleum content in
traditional plastic with renewable, bio-based materials," continued Scheer. "Furthermore,
Biopropylene(R) can be used in a variety of applications which so far were satisfied only with
traditional polypropylene."
Biopropylene(R) is a patented compound manufactured by Cereplast using traditional
polypropylene and up to 50% starch content, making it the first real "hybrid" bioplastic. Since its
introduction at the end of 2007, Biopropylene(R) has been tested by more than 90 major
corporations, with particular attention from companies in the automotive, consumer products
and cosmetics industries. While the drivers vary by industry, significant interest in
Biopropylene(R) has been motivated by some of the new properties that it offers, such as better
printability, softer touch, and other attributes.”

8/6/2019 White Paper 8-17-09
http://slidepdf.com/reader/full/white-paper-8-17-09 78/87
78
The following additional quotation is from a Press Release by DSM Venturing, a company
involved with Novomer, Inc. in producing bio-polymers from CO2 and CO.
“DSM Invests in ‘green’ Polymers from CO2
DSM Venturing, the corporate venturing unit of Royal DSM N.V., announced that it has made an
investment in Novomer Inc. The companies also plan to sign a cooperation agreement. Financial
details of the investment will not be disclosed.
Novomer is developing a technology platform to use carbon dioxide and other renewable
materials to produce performance polymers, plastics and other chemicals. The company's
products combine environmental benefits with improved materials performance and can be used
in a range of applications, from injection molded parts for electronics to paper coatings and
medical implants…..
DSM Venturing joins Flagship Ventures and Physic Ventures in this financing round. In addition
to the investment DSM and Novomer also intend to sign a cooperation agreement. Both the
investment and cooperation agreement will support DSM's ambitions to develop bio-based
performance polymers to meet customers' growing needs for improved materials performance
and environmental benefits at competitive costs…..
Novomer's catalyst technology enables the production of polymeric materials from renewable
feedstocks with decreased reliance on fossil fuels. Their use of feedstocks such as carbon dioxide
and carbon monoxide combined with the precision and reliability of synthetic manufacturing
processes is expected to enable the cost-effective manufacture of bio-based building blocks,
polymers, compounds and formulations…..
This press release contains forward-looking statements. These statements are based on current
expectations, estimates and projections of DSM management and information currently
available to the company. The statements involve certain risks and uncertainties that are difficult
to predict and therefore DSM does not guarantee that its expectations will be realized.
Furthermore, DSM has no obligation to update the statements contained in this press release.”

8/6/2019 White Paper 8-17-09
http://slidepdf.com/reader/full/white-paper-8-17-09 79/87
79
XII. THE UNIVERSAL ENVIRONMENTAL BURDEN INDEX
Since many choices involve varying quantities of pollution from several sources it is necessary to create a
common metric. If reusable garments result in water pollution while single use garment manufacture
results in air pollution it is necessary to make a decision on which is worse.
For the last 20 years Mcilvaine has been developing metrics to make this type of comparison. The original
metric was called a harm index. With the concern about greenhouse gases, the concept was expanded and
the Universal Environmental Burden Index was created. This is based on equivalent tons of CO2.
This metric is very useful but it is second order logic. There is a first order logic that rates the life quality
enhancement or reduction. Mcilvaine has created a metric ―Quality Enhanced Life Days‖ (QELD) to
measure the impacts of not only environmental but political and social decisions as well.
Quality Enhanced life Days (QELD) can be used to measure the impact of any environmental
burden. Some burdens directly impact health and life span. Others affect the quality of life. Allcan be converted to QELD. There are already a number of indices determining the relative
burden of specific pollutants. By determining QELD for one pollutant we can quickly ascertain
the QELD for the others.
Air Pollutants
McIlvaine began working on an index to rank toxic air pollutants soon after the 1990 Clean Air
Act mandated the reduction of hazardous air pollutants. The regulations identified hundreds of
air toxics and mandated the reduction of these toxics based on their health impacts. Congress told
EPA that even with the least toxic on the list that any source emitting 10 tons per year or 25 tons
of a combination of toxics should be subject to installing best available control technology
(BACT). Some substances are thousands of times more toxic than others. Therefore EPA
prepared a lesser quantity emission rate (LQER) for 47 pollutants. These have been integrated
with priority pollutants into the following abbreviated index.
Chemical LQER
2,3,7,8 TCDD Dioxin 0.0001
Mercury 0.001
Chromium Compounds 0.01
Lead Compounds 0.01
Arsenic 0.01
Nickel Compounds 0.10
Selenium Compounds 0.10
Barium Compounds 1.00

8/6/2019 White Paper 8-17-09
http://slidepdf.com/reader/full/white-paper-8-17-09 80/87
80
Zinc Compounds 1.00
Vanadium Compounds 1.00
Hydrochloric Acid 10.00
Sulfuric Acid 10.00
Hydrogen Fluoride
10.00
Ammonia 10.00
PM2.5 10.00
SO2 100.00
NOx 100.00
While the threshold to trigger BACT would be on 10 tons of HCl the threshold for chromium
would be 0.0l tons.
The LQER was drafted by EPA but became politically sensitive and never incorporated into
standards. However it is a good base for determining the environmental burden. However, it is
necessary to add values for other pollutants. Since NOx and SOx emitters are considered major
emitters when their emissions exceed 100 tons/year it is logical to assess an environmental
burden which is 10 times that of the most benign toxic pollutant.
PM2.5 is identified as the cause of 50,000 premature deaths in the U.S. each year. So setting an
index factor equal to the most benign toxic is justifiable.
VOCs can be air toxics and qualify for high numerical rating (e.g. dioxins). Non-toxic VOCsreact with NOx to form ozone. So setting a numerical equivalent to NOx is logical.
Greenhouse Gases
Some greenhouse gases are more potent factors in global warming than others.
CO2 can be indexed based on potential trading values. NOx trades for $2000/ton in some areas of
the United States. CO2 is trading for $3/ton in the North East U.S. There is talk of generating an
allowance system based on trading values of $20/ton. At this value a ton of CO2 would be worth
one percent of the value of a ton of NOx. If a ton of CO2 is indexed at one, NOx would be
indexed at 100.
Life Values
In order to determine the cost benefit of environmental regulations, the U.S. EPA has calculated
the value of a human life. It is now $6.9 million, down from $7.8 million some years ago. A
value of $7 million/life has been incorporated into the environmental burden index. If CO 2 is

8/6/2019 White Paper 8-17-09
http://slidepdf.com/reader/full/white-paper-8-17-09 81/87
81
valued at $20/ton then a human life is valued at 350,000 tons of CO2. There are 35,000 days
(QELD) in an average enhanced life (QELY). So 1 QELD= 0.1 tons of CO2.
The following Environmental Burden Index table displays both the relative burden and the
QELD value.
Wastewater Burdens
U.S. municipal wastewater plants experienced CBOD5 loadings of 11 million tons per year in
2004 while discharges were 1.3 million tons. This compares to SO 2 in air where 20 million tons
were generated by power plants, but emissions were 9 million tons. There is a program to reduce
this to 2 million tons, so the two would be comparable objectives.
As of 2004 EPA estimates the capital cost needed for wastewater plants is $70 billion. At an
average of $500/kW it would take $140 billion for U.S. coal-fired power plants to install best
available control technology. Since half the control technology is in place, the power plant air
needs are close to the $70 billion required for municipal wastewater plants.
Total suspended solids fit the same parameters.
Ammonia is an order of magnitude more strictly limited. The environmental burden for a ton of
ammonia released to the air is the same as one released to the water. This makes sense in that one
can convert to the other. The same is true of toxic metals such as mercury, arsenic, etc. In fact,
the main concern about airborne mercury is its entry into water and eventually into fish.
Chlorine is pegged at 10,000 in water vs. 1,000 for hydrochloric acid in air. But in terms of
weight of chlorine the burden is more equal.
Environmental Burden Index(relative)
Tons of CO2
equivalentQELD
(lost per ton generated)
2,3,7,8 TCDD Dioxin 100,000,000 10,000,000
Mercury (air or water) 10,000,000 1,000,000
Chromium Compounds 1,000,000 100,000
Lead Compounds 1,000,000 100,000
Arsenic 1,000,000 100,000

8/6/2019 White Paper 8-17-09
http://slidepdf.com/reader/full/white-paper-8-17-09 82/87
82
One life lost 350,000 35,000
Nickel Compounds 100,000 10,000
Selenium Compounds 100,000 10,000
Barium Compounds 10,000 1,000
Zinc Compounds 10,000 1,000
Vanadium Compounds 10,000 1,000
Chlorine ( water ) 10,000 1,000
Hydrochloric Acid (air) 1,000 100
Sulfuric Acid 1,000 100
Hydrogen Fluoride 1,000 100
Ammonia (air) 1,000 100
Ammonia (water) 1,000 100
PM2.5 (air) 1,000 100
SO2 100 10
CBOD5 (water) 100 10
TSS (water) 100 10
Nitrogen ( water) 100 10
VOC 100 10
NOx 100 10
Methane
23 2.3
CO2 1 0.1
Water resource depletion (drought
area) 0.1 0.01
Water resource depletion (deficit area) 0.01 0.001

8/6/2019 White Paper 8-17-09
http://slidepdf.com/reader/full/white-paper-8-17-09 83/87
83
Oil resource depletion 0.01 0.001
Landfill depletion (Europe) 0.01 0.001
Coal resource depletion 0.001 0.0001
Water resource depletion (surplus area) 0.001 0.0001
Landfill depletion (U.S.) 0.001 0.0001
The first column represents the relative burden with CO2 at 1. The second column represents the
QELD in terms of equivalent quality enhanced days lost per ton generated. These values could
change. If the burden of CO2 were to change the value of methane would also change but it
would not affect the burden of toxic air pollutants. This is because the basis of burden is
greenhouse gases for both CO2 and methane but it is health for toxic air pollutants.
Sustainability and specifically life quality enhancement requires inclusion of the potential
depletion of resources. There is a 40 year supply of oil and so potential depletion of this
resource is significant. There is a 200 year supply of coal so the depletion impact of one ton is an
order of magnitude less than oil.
Only a fraction of one percent of the world‘s water is both uncontaminated and available.
However there is a big difference in availability between cities such as Phoenix, which suffers a
big water deficit, and Minneapolis, which has a water surplus. Where there is a surplus of waterdepletion would be similar to coal. But where there is a water deficit the loss would be similar to
oil. There are temporary situations where the water deficit turns into a drought.
The following QELD burden factors have been assigned for water resource depletion.
Water Surplus Location 0.0001
Water Deficit Location 0.001
Water Drought Location 0.01
Landfill depletion is another factor. No one wants to live next to a garbage dump. On the other
hand, how objectionable is a land fill which is 30 miles away? In the U.S. there is space for
landfills to be farther from communities than in Europe. Likewise, there is a lot more land to fill
in the U.S. Europe prohibits combustible material from being land-filled and insists that this

8/6/2019 White Paper 8-17-09
http://slidepdf.com/reader/full/white-paper-8-17-09 84/87
84
material be utilized in waste to energy plants. The U.S. has taken the opposite position but is
slowly changing.
The McIlvaine offices are only a 3 minute drive from a renovated landfill. It is now a golf
course. The restaurant which is adjacent is the favorite choice for company parties. Hence, the
lost QELD can differ greatly depending on the condition and location of a specific landfill.
There is no shortage of landfill space in the U.S. therefore the deposit of one ton of waste in a
landfill will generate losses of only 0.0001 QELD. In Europe the loss would be 10x greater or
0.001 QELD.
QELD Measurement
There are two challenges. One is to measure the QELD value an individual attaches to an
activity. The other is to aggregate this information for a group or nation of people.
Individual QELD Measurement
Measurement of individual QELD is not straight forward. There will be no precise measurement.
But with iteration of three different approaches a good approximation can be made initially. Over
time a body of work will make the task more simple and routine. There at least three approaches
to measuring individual QELD. They are ―willingness to sacrifice uneventful life days‖,―monetary value‖, and ―comparable options‖.
Willingness to sacrifice uneventful life days
Individuals are applying the QELD principle continuously but without labeling it. Driving on a
2.4 hour round trip to work rather than work close to home demonstrates a willingness to
sacrifice 10 percent of an uneventful day (QALD) for a quality enhanced day (QELD). Since
statistically every hour spent driving reduces statistical life by an hour, a 2.4 hour trip divided by
24 hours results in a reduction in life of 0.1 days. In fact the gamble in the mind of the worker is
probably not even. He anticipates something more than a 1.1 QELD if he is sacrificing 0.1
QALD.
In general people live 80 years by taking risks rather than live non active lives for 96 years.
Hence, there is a 20 percent life enhancement factor inherent in normal life choices. This is an
average. There are many life enhancement activities which involve little or no risk to life. There
are other activities such as sky diving, extreme skiing, battle, rescue, and care giving for

8/6/2019 White Paper 8-17-09
http://slidepdf.com/reader/full/white-paper-8-17-09 85/87
85
contagious relatives where the statistical life reduction is more than 0.2 days per day engaged in
that activity.
The most valuable QELD determination is the number of QALD one would sacrifice for a
QELD in the activity under evaluation. The question to be posed is: Instead of living 95 years
and 356 days, how many days would your trade in order to e.g. see the finals of the NCAA
basketball tournament, see your daughter graduate from college, own an expensive sports car,
prevent the elimination of the snail darter species, keep your house at the ideal comfort
temperature year round, normalize relations with Cuba.
If people are presented with their present patterns and choices, they will have the perspective to
answer the QELD questions.
Monetary value
QELD is the principle goal of individuals. Money is a major factor in determining the ability to
achieve some of these goals. Since individual resources are limited the individual is rating the
value of his enhancement options based on how much he is willing to pay for them. How much
would he pay for the expensive sports car or the trip to the NCAA finals as opposed to visiting
an art museum or walking in the park?
Since EPA evaluates a human life at $7 million, a QELD can be valued at $200. Therefore any
payment activity or willingness to pay can be measured in QELD. The problem with this
approach is that the income of the individual becomes a large variable. A wealthy person would
be generally willing to pay much more than a poor person for the same enhancement.Nevertheless questions framed in monetary terms are very useful as alternate way to determine
the QELD enhancement factor. How much would an individual be willing to donate to save the
snail darter or the polar bear or a parasitic mosquito species? How much would an individual pay
to eliminate a view of a distant wind turbine in Cape Cod?
Comparable options
Another way to determine the enhancement for a specific activity is to compare it to others. How
many regular season basketball games would an individual trade for a seat at the NCAA finals?
How many Florida vacation days would an individual trade for a ride in the space shuttle? How
many Florida vacation days would an individual sacrifice to save the snail darter? How many
Florida vacation days would an individual sacrifice to save 100 people from starvation in Sudan?
Much of the enhancement of daily life is emotional rather than physical. The feeling of making a
positive contribution to preventing starvation in Sudan may be more of an enhancement than the
physical experience of sun and ocean in a warm climate.

8/6/2019 White Paper 8-17-09
http://slidepdf.com/reader/full/white-paper-8-17-09 86/87
86
The comparable option approach is only useful if QELD enhancement is already established by
one or a combination of the other two methods. On the o ther hand the ―comparable option‖
approach is a basis for the monetary approach and can help the individual better determine what
sacrifice in life quantity he would be willing to make for quality.
All of this analysis is based on the assumption of rational choice. However, many QELD
decisions are based on inadequate information or lack of a means to make a rational decision.
Education is a key to making the QELD approach most valuable.
Assessment of Group QELD
The quality assessment for a group depends first on defining or limiting the group. This is
because of the ―tribal factor‖ which is discussed separately. If the group is the nation then theenhancement factor for foreign aid is different than if the group is defined as the world. But
within the group there are three ways to determine the aggregated individual enhancement
factors.
Academic assessment
The employment of QELD in decision making is on one hand just an organized approach to
assessments we are already making. But to the extent that we can improve these assessments we
need insights from every segment of academia. Philosophy, science, sociology, politics,
economics and religion are all significant in proper assessment of enhancement factors.
Peter Singer of Princeton University makes a persuasive argument that we will have to ration
healthcare because the potential cost exceeds the funding ability. His observation has caused
much consternation. Deep rooted religious and political beliefs are confronted with reality. The
application of the QELD concept to this issue would be a valuable academic pursuit.
Analysis of life style patterns of groups
Since QELD is just quantifying life style decisions already being made it is highly desirable to
analyze these in general ways. How far are people traveling to achieve various enhancements?
They may travel only one hour to attend a high school basketball game but 16 hours to attend an
NCAA final.
There are certain bellwether decisions. The increase of the speed limit from 55 mph to 65 mph
has resulted in thousands of increased deaths. However, the majority of Americans are willing to
take this increased risk and are strong advocates of the higher speed limit.

8/6/2019 White Paper 8-17-09
http://slidepdf.com/reader/full/white-paper-8-17-09 87/87
High risk sports are another indicator. How many people participate in each? How many are
fully aware of the risks? Substantial insights can be gained from study of this subject. Obesity,
smoking, and nearly every other activity can be analyzed from the QELD perspective.
These analyses supported by ―Important Event Odds‖ and ―Personal Risk Odds‖.
Polling
Proactive polling would make a considerable contribution to the enhancement ratings people
employ. The results of this polling would be of considerable value to politicians who hope to be
re-elected to agencies providing health care and to businesses which need to understand
purchasing motivations.
Interactive electronic communication
New interactive tools such as Twitter and blogs can be a very economic way to ascertain thegroup enhancement ratings. The instant polls conducted by CNN and other television networks
are another example of effective ways to ascertain the views of the individuals and aggregate
them. Questions can be posed in such ways as to elicit thoughtful responses.