white paper how to benchmark code execution - intel · how to benchmark code execution times ®on...
TRANSCRIPT

324264-001
How to Benchmark Code Execution Times on Intel® IA-32 and IA-64 Instruction Set Architectures
September 2010
White Paper
Gabriele Paoloni Linux Kernel/Embedded Software Engineer
Intel Corporation

How to Benchmark Code Execution Times on Intel® IA-32 and IA-64 Instruction Set Architectures
2
Abstract
This paper provides precise methods to measure the clock cycles spent
when executing a certain C code on a Linux* environment with a generic
Intel architecture processor (either 32 bits or 64 bits).

How to Benchmark Code Execution Times on Intel® IA-32 and IA-64 Instruction Set Architectures
3
Contents 1 0BIntroduction .................................................................................................. 5
1.1 Purpose/Scope ..................................................................................... 5 1.2 Assumptions......................................................................................... 5 1.3 Terminology ......................................................................................... 5
2 Problem Description ...................................................................................... 7 2.1 Introduction ......................................................................................... 7 2.2 Problems with RDTSC Instruction in C Inline Assembly ............................... 7
3 Variance Introduced by CPUID and Improvements with RTDSCP Instruction11 3.1 Problems with the CPUID Instruction ...................................................... 11
3.1.1 Code Analysis ......................................................................... 11 3.1.2 Evaluation of the First Benchmarking Method .............................. 12
3.2 Improvements Using RDTSCP Instruction ............................................... 15 3.2.1 The Improved Benchmarking Method ......................................... 16 3.2.2 Evaluation of the Improved Benchmarking Method ...................... 17 3.2.3 An Alternative Method for Architecture Not Supporting RDTSCP ..... 20 3.2.4 Evaluation of the Alternative Method ......................................... 22
3.3 Resolution of the Benchmarking Methodologies ....................................... 24 3.3.1 Resolution with RDTSCP ........................................................... 24 3.3.2 Resolution with the Alternative Method ...................................... 27
4 5BSummary ..................................................................................................... 30
5 Appendix ..................................................................................................... 31
6 Reference List .............................................................................................. 35
Figures
Figure 1. Minimum Value Behavior Graph 1 .................................................................. 14
Figure 2. Variance Behavior Graph 2 ............................................................................ 15
Figure 3. Minimum Value Behavior Graph 3 .................................................................. 19
Figure 4. Variance Behavior Graph 4 ............................................................................ 20
Figure 5. Minimum Value Behavior Graph 5 .................................................................. 23
Figure 6. Variance Behavior Graph 6 ............................................................................ 23
Figure 7. Minimum Value Behavior Graph 7 .................................................................. 26
Figure 8. Variance Behavior Graph 8 ............................................................................ 27
Figure 9. Variance Behavior Graph 9 ............................................................................ 28
How to Benchmark Code Execution Times on Intel® IA-32 and IA-64 Instruction Set Architectures
4
Figure 10. Variance Behavior Graph 10 ........................................................................ 29
Tables
Table 1. List of Terms .................................................................................................. 5
How to Benchmark Code Execution Times on Intel® IA-32 and IA-64 Instruction Set Architectures
5
1 0BIntroduction
1.1 Purpose/Scope The purpose of this document is to provide software developers with precise methods to measure the clock cycles required to execute specific C code in a Linux environment running on a generic Intel architecture processor. These methods can be very useful in a CPU-benchmarking context, in a code-optimization context, and also in an OS-tuning context. In all these cases, the developer is interested in knowing exactly how many clock cycles are elapsed while executing code.
At the time of this writing, the best description of how to benchmark code execution can be found in [1]. Unfortunately, many problems were encountered while using this method. This paper describes the problems and proposes two separate solutions.
1.2 Assumptions In this paper, all the results shown were obtained by running tests on a platform whose BIOS was optimized by removing every factor that could cause indeterminism. All power optimization, Intel Hyper-Threading technology, frequency scaling and turbo mode functionalities were turned off.
The OS used was openSUSE* 11.2 (linux-2.6.31.5-0.1).
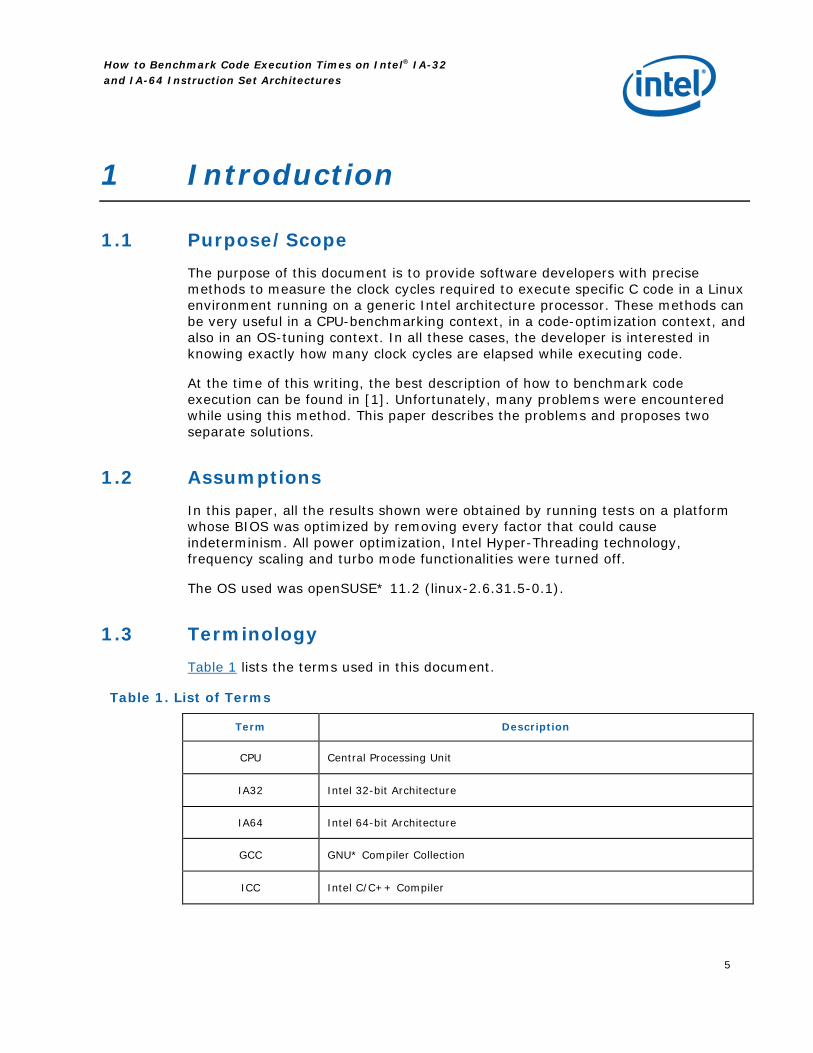
1.3 Terminology Table 1 lists the terms used in this document.
Table 1. List of Terms
Term Description
CPU Central Processing Unit
IA32 Intel 32-bit Architecture
IA64 Intel 64-bit Architecture
GCC GNU* Compiler Collection
ICC Intel C/C++ Compiler

How to Benchmark Code Execution Times on Intel® IA-32 and IA-64 Instruction Set Architectures
6
Term Description
RDTSCP Read Time-Stamp Counter and Processor ID IA assembly instruction
RTDSC Read Time-Stamp Counter and Processor ID IA assembly instruction

How to Benchmark Code Execution Times on Intel® IA-32 and IA-64 Instruction Set Architectures
7
2 Problem Description This section explains the issues involved in reading the timestamp register and discusses the correct methodology to return precise and reliable clock cycles measurements. It is expected that readers have knowledge of basic GCC and ICC compiling techniques, basic Intel assembly syntax, and AT&T* assembly syntax. Those not interested in the problem description and method justification can skip this section and go to Section 3.2.1 (if their platform supports the RDTSCP instruction) or Section 3.2.3 (if not) to acquire the code.
2.1 Introduction Intel CPUs have a timestamp counter to keep track of every cycle that occurs on the CPU. Starting with the Intel Pentium® processor, the devices have included a per-core timestamp register that stores the value of the timestamp counter and that can be accessed by the RDTSC and RDTSCP assembly instructions.
When running a Linux OS, the developer can check if his CPU supports the RDTSCP instruction by looking at the flags field of “/proc/cpuinfo”; if rdtscp is one of the flags, then it is supported.
2.2 Problems with RDTSC Instruction in C Inline Assembly Assume that you are working in a Linux environment, and are compiling by using GCC. You have C code and want to know how many clock cycles are spent to execute the code itself or just a part of it. To make sure that our measurements are not tainted by any kind of interrupt (including scheduling preemption), we are going to write a kernel module where we guarantee the exclusive ownership of the CPU when executing the code that we want to benchmark.
To understand the practical implementation, let’s consider the following dummy kernel module; it simply calls a function that is taking a pointer as input and is setting the pointed value to “1”. We want to measure how many clock cycles it takes to call such a function: #include <linux/module.h> #include <linux/kernel.h> #include <linux/init.h> #include <linux/hardirq.h> #include <linux/preempt.h> #include <linux/sched.h> void inline measured_function(volatile int *var) { (*var) = 1;

How to Benchmark Code Execution Times on Intel® IA-32 and IA-64 Instruction Set Architectures
8
} static int __init hello_start(void) { unsigned long flags; uint64_t start, end; int variable = 0;
unsigned cycles_low, cycles_high, cycles_low1, cycles_high1; printk(KERN_INFO "Loading test module...\n"); preempt_disable(); /*we disable preemption on our CPU*/ raw_local_irq_save(flags); /*we disable hard interrupts on our CPU*/ /*at this stage we exclusively own the CPU*/ asm volatile ( "RDTSC\n\t" "mov %%edx, %0\n\t" "mov %%eax, %1\n\t": "=r" (cycles_high), "=r" (cycles_low)); measured_function(&variable); asm volatile ( "RDTSC\n\t" "mov %%edx, %0\n\t" "mov %%eax, %1\n\t": "=r" (cycles_high1), "=r" (cycles_low1)); raw_local_irq_restore(flags);
/*we enable hard interrupts on our CPU*/ preempt_enable();/*we enable preemption*/ start = ( ((uint64_t)cycles_high << 32) | cycles_low ); end = ( ((uint64_t)cycles_high1 << 32) | cycles_low1 ); printk(KERN_INFO "\n function execution time is %llu clock cycles", (end-start)); return 0; } static void __exit hello_end(void) { printk(KERN_INFO "Goodbye Mr.\n"); } module_init(hello_start);
module_exit(hello_end);
The RDTSC instruction loads the high-order 32 bits of the timestamp register into EDX, and the low-order 32 bits into EAX. A bitwise OR is performed to reconstruct and store the register value into a local variable.
In the code above, to guarantee the exclusive ownership of the CPU before performing the measure, we disable the preemption (preempt_disable()) and we disable the hard interrupts (raw_local_irq_save()). Then we call the “RDTSC” assembly instruction to read the timestamp register. We call our function (measured_function()), and we read the timestamp register again (RDTSC) to see how many clock cycles have been elapsed since the first read. The two variables

How to Benchmark Code Execution Times on Intel® IA-32 and IA-64 Instruction Set Architectures
9
start and end store the timestamp register values at the respective times of the RDTSC calls. Finally, we print the measurement on the screen.
Logically the code above makes sense, but if we try to compile it, we could get segmentation faults or some weird results. This is because we didn’t consider a few issues that are related to the “RDTSC” instruction itself and to the Intel Architecture:
Register Overwriting
RDTSC instruction, once called, overwrites the EAX and EDX registers. In the inline assembly that we presented above, we didn’t declare any clobbered register. Basically we have to push those register statuses onto the stack before calling RDTSC and popping them afterwards. The practical solution for that is to write the inline assembly as follows (note bold items): asm volatile ("RDTSC\n\t" "mov %%edx, %0\n\t" "mov %%eax, %1\n\t": "=r" (cycles_high), "=r" (cycles_low):: “%eax”, “%edx”);
In case we are using an IA64 platform rather than an IA32, in the list of clobbered registers we have to replace “%eax”, “%edx” with “%rax”, “%rdx”. In fact, in the Intel® 64 and IA-32 Architectures Software Developer’s Manual Volume 2B ([3]), it states that “On processors that support the Intel 64 architecture, the high-order 32 bits of each of RAX and RDX are cleared”.
Out of Order Execution
Starting with the Intel Pentium processor, most Intel CPUs support out-of-order execution of the code. The purpose is to optimize the penalties due to the different instruction latencies. Unfortunately this feature does not guarantee that the temporal sequence of the single compiled C instructions will respect the sequence of the instruction themselves as written in the source C file. When we call the RDTSC instruction, we pretend that that instruction will be executed exactly at the beginning and at the end of code being measured (i.e., we don’t want to measure compiled code executed outside of the RDTSC calls or executed in between the calls themselves).
The solution is to call a serializing instruction before calling the RDTSC one. A serializing instruction is an instruction that forces the CPU to complete every preceding instruction of the C code before continuing the program execution. By doing so we guarantee that only the code that is under measurement will be executed in between the RDTSC calls and that no part of that code will be executed outside the calls.
The complete list of available serializing instructions on IA64 and IA32 can be found in the Intel® 64 and IA-32 Architectures Software Developer’s Manual Volume 3A [4]. Reading this manual, we find that “CPUID can be executed at any privilege level to serialize instruction execution with no effect on program flow, except that the EAX, EBX, ECX and EDX registers are modified”. Accordingly, the
How to Benchmark Code Execution Times on Intel® IA-32 and IA-64 Instruction Set Architectures
10
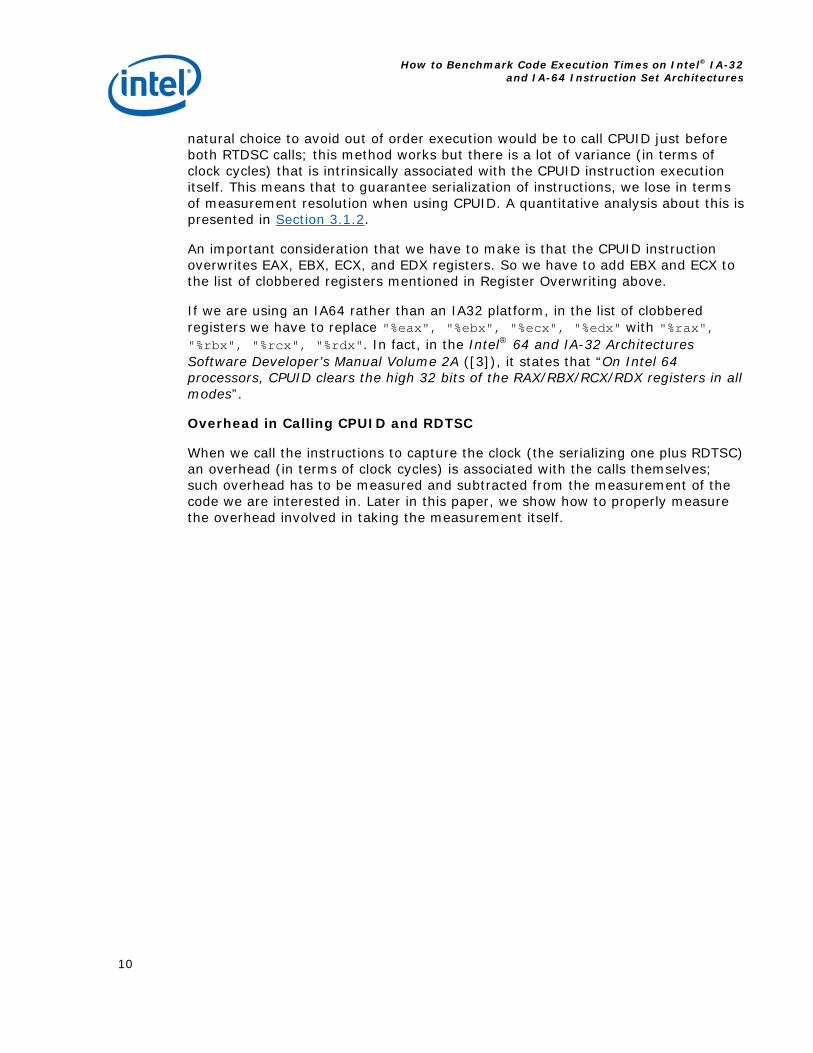
natural choice to avoid out of order execution would be to call CPUID just before both RTDSC calls; this method works but there is a lot of variance (in terms of clock cycles) that is intrinsically associated with the CPUID instruction execution itself. This means that to guarantee serialization of instructions, we lose in terms of measurement resolution when using CPUID. A quantitative analysis about this is presented in Section 3.1.2.
An important consideration that we have to make is that the CPUID instruction overwrites EAX, EBX, ECX, and EDX registers. So we have to add EBX and ECX to the list of clobbered registers mentioned in Register Overwriting above.
If we are using an IA64 rather than an IA32 platform, in the list of clobbered registers we have to replace "%eax", "%ebx", "%ecx", "%edx" with "%rax", "%rbx", "%rcx", "%rdx". In fact, in the Intel® 64 and IA-32 Architectures Software Developer’s Manual Volume 2A ([3]), it states that “On Intel 64 processors, CPUID clears the high 32 bits of the RAX/RBX/RCX/RDX registers in all modes”.
Overhead in Calling CPUID and RDTSC
When we call the instructions to capture the clock (the serializing one plus RDTSC) an overhead (in terms of clock cycles) is associated with the calls themselves; such overhead has to be measured and subtracted from the measurement of the code we are interested in. Later in this paper, we show how to properly measure the overhead involved in taking the measurement itself.
How to Benchmark Code Execution Times on Intel® IA-32 and IA-64 Instruction Set Architectures
11
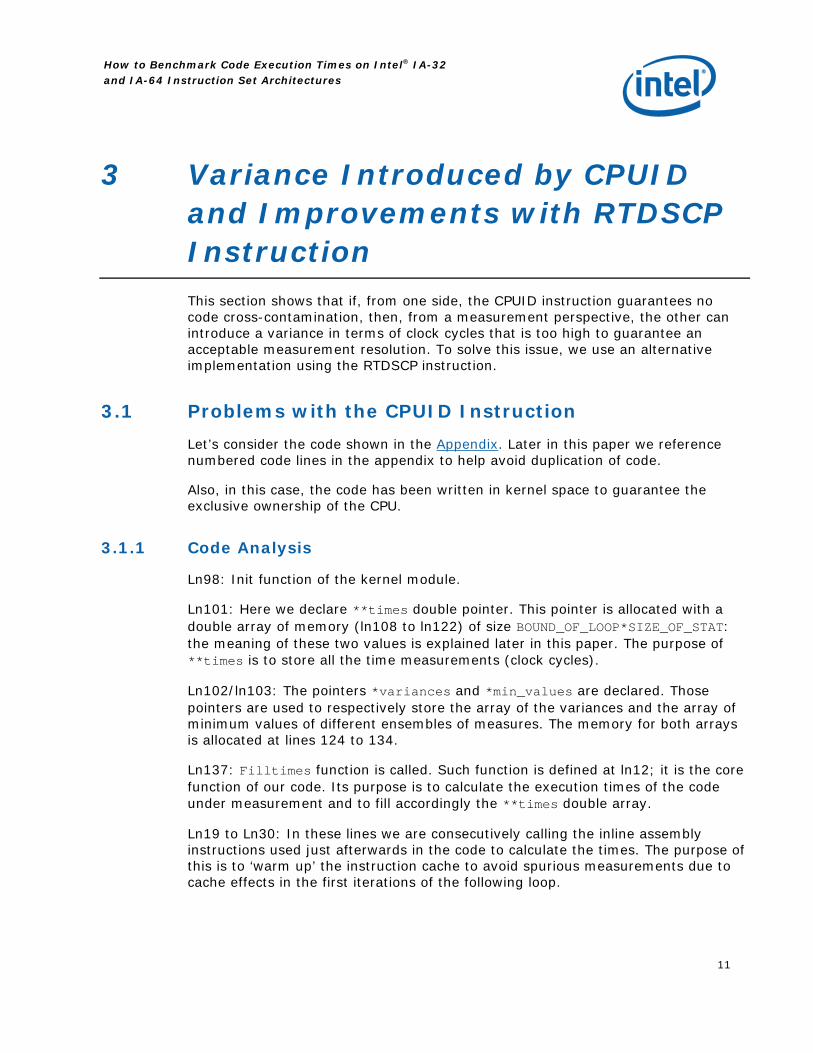
3 Variance Introduced by CPUID and Improvements with RTDSCP Instruction This section shows that if, from one side, the CPUID instruction guarantees no code cross-contamination, then, from a measurement perspective, the other can introduce a variance in terms of clock cycles that is too high to guarantee an acceptable measurement resolution. To solve this issue, we use an alternative implementation using the RTDSCP instruction.
3.1 Problems with the CPUID Instruction Let’s consider the code shown in the Appendix. Later in this paper we reference numbered code lines in the appendix to help avoid duplication of code.
Also, in this case, the code has been written in kernel space to guarantee the exclusive ownership of the CPU.
3.1.1 Code Analysis
Ln98: Init function of the kernel module.
Ln101: Here we declare **times double pointer. This pointer is allocated with a double array of memory (ln108 to ln122) of size BOUND_OF_LOOP*SIZE_OF_STAT: the meaning of these two values is explained later in this paper. The purpose of **times is to store all the time measurements (clock cycles).
Ln102/ln103: The pointers *variances and *min_values are declared. Those pointers are used to respectively store the array of the variances and the array of minimum values of different ensembles of measures. The memory for both arrays is allocated at lines 124 to 134.
Ln137: Filltimes function is called. Such function is defined at ln12; it is the core function of our code. Its purpose is to calculate the execution times of the code under measurement and to fill accordingly the **times double array.
Ln19 to Ln30: In these lines we are consecutively calling the inline assembly instructions used just afterwards in the code to calculate the times. The purpose of this is to ‘warm up’ the instruction cache to avoid spurious measurements due to cache effects in the first iterations of the following loop.
How to Benchmark Code Execution Times on Intel® IA-32 and IA-64 Instruction Set Architectures
12
Ln33/34: Here we have two nested loops inside which the measurements take place. There are two reasons for having two loops for the following scenarios:
· When there is no function to be measured - in this case we are evaluating the statistical nature of the offset associated with the process of taking the measure itself. The inner loop is used to calculate statistic values such as minimum, maximum deviation from the minimum, variance; the outer loop is used to evaluate the ergodicity of the method taking the measures.
· When evaluating a function duration - the outer loop is used to increase step by step the complexity of the function itself in such a way to evaluate the goodness of the measuring method itself (in terms of clock cycles resolution).
Ln38/39: Here we get the exclusive ownership of the CPU (see Section 2.2).
Ln41 to Ln51: Here we implement the inline assembly code used to take the measurement. This is the part that ¾ along with this paper ¾ can change evaluation techniques and introduce improvements in the method.
Ln53/54: We release the ownership of the CPU (see Section 2.2).
Ln68: We fill the times array with the measured time.
Ln139: At this stage the **times array is entirely filled with the calculated values. Following the array there are two nested loops: the inner one (ln145 to ln150) goes from zero to (SIZE_OF_STAT-1) and is used to calculate the minimum value and the maximum deviation from the minimum (max - min) for a certain ensemble of measures; the external one (ln139) is used to go across different ensembles. On the same ensemble the variance is calculated (ln160) and is stored in the array of variances. An accumulator (tot_var) is used to calculate the total variance (calculated also on the outer loop) of all the measurements. spurious (ln156) is a counter that is increased whenever between contiguous ensembles the minimum value of the previous is bigger than the one that follows. It is a useful index in case we are evaluating a function whose complexity is increasing along the external loop: a more complex function has to take more cycles to be executed; if the minimum measured value is smaller than the one measured on the ensemble for the less complex function, there is something wrong (we will see later how this index is useful). Finally, at ln168/169, the variance of the variances is calculated, and the variance of the minimum values. Both are needed to evaluate the ergodicity of the measurement process (if the process is ergodic the variance of variances tends to zero and, in this specific case, also the variance of the minimum value).
3.1.2 Evaluation of the First Benchmarking Method
Having built the kernel module using the code in the Appendix, we load this module and look at the kernel log (“dmesg”). The output is as follows:
Loading hello module...
loop_size:0 >>>> variance(cycles): 85; max_deviation: 80 ;min time: 452
How to Benchmark Code Execution Times on Intel® IA-32 and IA-64 Instruction Set Architectures
13
loop_size:1 >>>> variance(cycles): 85; max_deviation: 56 ;min time: 456
loop_size:2 >>>> variance(cycles): 85; max_deviation: 96 ;min time: 456
…………………………………
…………………………………
loop_size:997 >>>> variance(cycles): 85; max_deviation: 92 ;min time: 456
loop_size:998 >>>> variance(cycles): 85; max_deviation: 100 ;min time: 452
loop_size:999 >>>> variance(cycles): 85; max_deviation: 60 ;min time: 452
total number of spurious min values = 262
total variance = 48
absolute max deviation = 636
variance of variances = 2306
variance of minimum values = 118
The “loop_size” index refers to the external loop (ln33); accordingly each row of the log shows, for a certain ensemble of measures, the variance, the maximum deviation and the minimum measured time (all of them in clock cycles).
At the end of the log there are: the number of “spurious” minimum values (that in this case is meaningless and can be neglected): the total variance (the average of the variances in each row); the absolute maximum deviation (the maximum value amongst the max deviations of all the rows); the variance of variances and the variance of the minimum values.
Looking at the results, it is clear that this method is not reliable for benchmarking. There are different reasons for this:
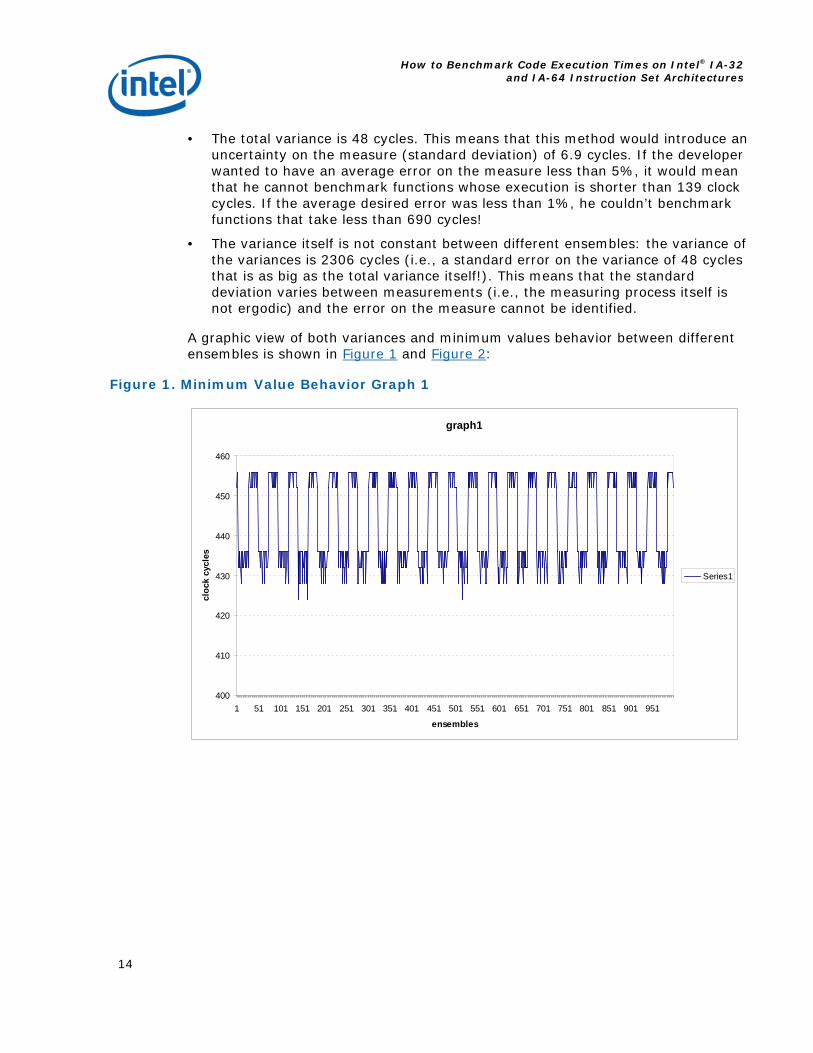
· The minimum value is not constant between different ensembles (the variance of the minimum values is 118 cycles). This means that we cannot evaluate the cost of calling the benchmarking function itself. When we are benchmarking a function we want to be able to subtract the cost of calling the benchmarking function itself from the measurement of the function to be benchmarked. This cost is the minimum possible number of cycles that it takes to call the benchmarking function (i.e., the min times in the rows of the kernel log above). Basically, in this case, each statistic is performed over 100,000 samples. The fact that over 100,000 samples an absolute minimum cannot be determined means that we cannot calculate the cost to be subtracted when benchmarking any function. A solution could be to increase the number of samples till we always get the same minimum value, but this is practically too costly since the developer would have to wait quite a lot for orders of magnitude greater than 10^5 samples.
How to Benchmark Code Execution Times on Intel® IA-32 and IA-64 Instruction Set Architectures
14
· The total variance is 48 cycles. This means that this method would introduce an uncertainty on the measure (standard deviation) of 6.9 cycles. If the developer wanted to have an average error on the measure less than 5%, it would mean that he cannot benchmark functions whose execution is shorter than 139 clock cycles. If the average desired error was less than 1%, he couldn’t benchmark functions that take less than 690 cycles!
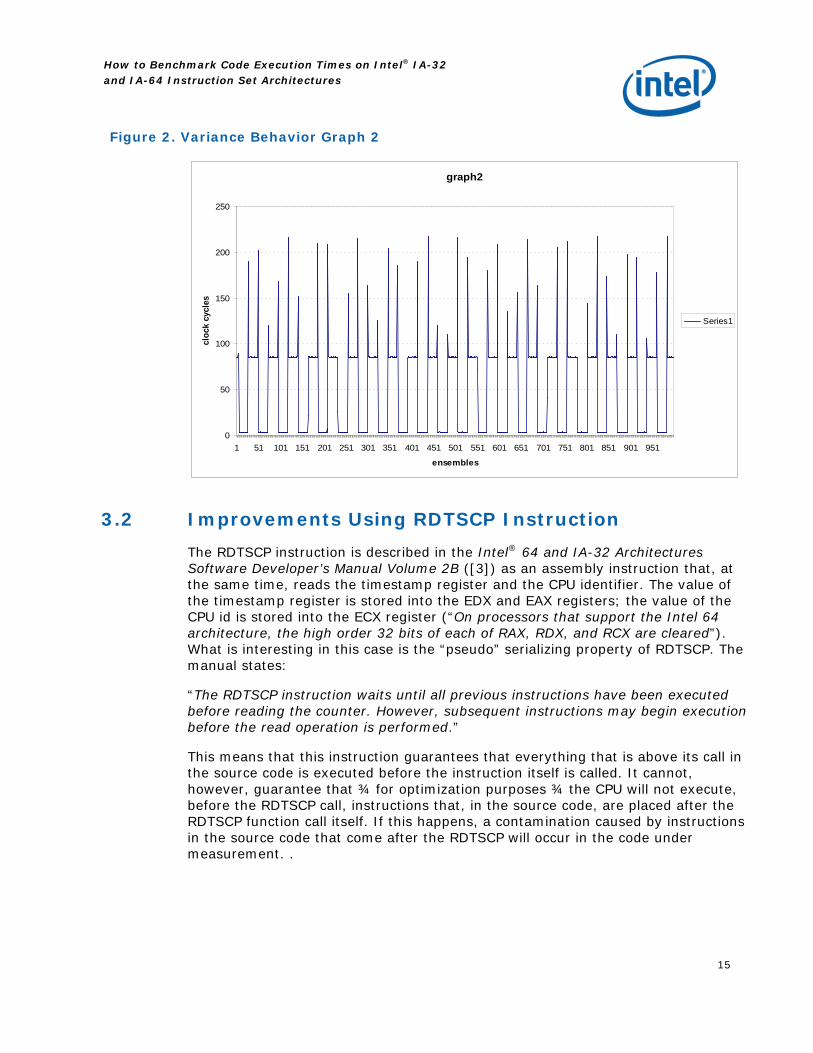
· The variance itself is not constant between different ensembles: the variance of the variances is 2306 cycles (i.e., a standard error on the variance of 48 cycles that is as big as the total variance itself!). This means that the standard deviation varies between measurements (i.e., the measuring process itself is not ergodic) and the error on the measure cannot be identified.
A graphic view of both variances and minimum values behavior between different ensembles is shown in Figure 1 and Figure 2:
Figure 1. Minimum Value Behavior Graph 1
graph1
400
410
420
430
440
450
460
1 51 101 151 201 251 301 351 401 451 501 551 601 651 701 751 801 851 901 951
ensembles
clo
ck c
ycle
s
Series1
How to Benchmark Code Execution Times on Intel® IA-32 and IA-64 Instruction Set Architectures
15
Figure 2. Variance Behavior Graph 2
3.2 Improvements Using RDTSCP Instruction The RDTSCP instruction is described in the Intel® 64 and IA-32 Architectures Software Developer’s Manual Volume 2B ([3]) as an assembly instruction that, at the same time, reads the timestamp register and the CPU identifier. The value of the timestamp register is stored into the EDX and EAX registers; the value of the CPU id is stored into the ECX register (“On processors that support the Intel 64 architecture, the high order 32 bits of each of RAX, RDX, and RCX are cleared”). What is interesting in this case is the “pseudo” serializing property of RDTSCP. The manual states:
“The RDTSCP instruction waits until all previous instructions have been executed before reading the counter. However, subsequent instructions may begin execution before the read operation is performed.”
This means that this instruction guarantees that everything that is above its call in the source code is executed before the instruction itself is called. It cannot, however, guarantee that ¾ for optimization purposes ¾ the CPU will not execute, before the RDTSCP call, instructions that, in the source code, are placed after the RDTSCP function call itself. If this happens, a contamination caused by instructions in the source code that come after the RDTSCP will occur in the code under measurement. .
graph2
0
50
100
150
200
250
1 51 101 151 201 251 301 351 401 451 501 551 601 651 701 751 801 851 901 951
ensembles
cloc
k cy
cles
Series1

How to Benchmark Code Execution Times on Intel® IA-32 and IA-64 Instruction Set Architectures
16
The problem is graphically described as follows:
asm volatile ( "CPUID\n\t"/*serialize*/ "RDTSC\n\t"/*read the clock*/ "mov %%edx, %0\n\t" "mov %%eax, %1\n\t": "=r" (cycles_high), "=r" (cycles_low):: "%rax", "%rbx", "%rcx", "%rdx"); /* Call the function to benchmark */ asm volatile( "RDTSCP\n\t"/*read the clock*/ "mov %%edx, %0\n\t" "mov %%eax, %1\n\t": "=r" (cycles_high1), "=r" (cycles_low1):: "%rax", "%rcx", "%rdx"); /*do other things*/
If we find a way to avoid the undesired behavior described above we can avoid calling the serializing CPUID instruction between the two timestamp register reads.
3.2.1 The Improved Benchmarking Method
The solution to the problem presented in Section 0 is to add a CPUID instruction just after the RDTPSCP and the two mov instructions (to store in memory the value of edx and eax). The implementation is as follows: asm volatile ("CPUID\n\t" "RDTSC\n\t" "mov %%edx, %0\n\t" "mov %%eax, %1\n\t": "=r" (cycles_high), "=r" (cycles_low):: "%rax", "%rbx", "%rcx", "%rdx"); /***********************************/ /*call the function to measure here*/ /***********************************/ asm volatile("RDTSCP\n\t" "mov %%edx, %0\n\t" "mov %%eax, %1\n\t"
"CPUID\n\t": "=r" (cycles_high1), "=r" (cycles_low1):: "%rax", "%rbx", "%rcx", "%rdx");
In the code above, the first CPUID call implements a barrier to avoid out-of-order execution of the instructions above and below the RDTSC instruction. Nevertheless, this call does not affect the measurement since it comes before the RDTSC (i.e., before the timestamp register is read).
The first RDTSC then reads the timestamp register and the value is stored in memory.
Then the code that we want to measure is executed. If the code is a call to a function, it is recommended to declare such function as “inline” so that from an assembly perspective there is no overhead in calling the function itself.
This out of order execution corrupts the***

How to Benchmark Code Execution Times on Intel® IA-32 and IA-64 Instruction Set Architectures
17
The RDTSCP instruction reads the timestamp register for the second time and guarantees that the execution of all the code we wanted to measure is completed.
The two “mov” instructions coming afterwards store the edx and eax registers values into memory. Both instructions are guaranteed to be executed after RDTSC (i.e., they don’t corrupt the measure) since there is a logical dependency between RDTSCP and the register edx and eax (RDTSCP is writing those registers and the CPU is obliged to wait for RDTSCP to be finished before executing the two “mov”).
Finally a CPUID call guarantees that a barrier is implemented again so that it is impossible that any instruction coming afterwards is executed before CPUID itself (and logically also before RDTSCP).
With this method we avoid to call a CPUID instruction in between the reads of the real-time registers (avoiding all the problems described in Section 3.1).
3.2.2 Evaluation of the Improved Benchmarking Method
In reference to the code presented in Section 3.1, we replace the previous benchmarking method with the new one, i.e., we replace ln19 to ln54 in the Appendix with the following code: asm volatile ("CPUID\n\t" "RDTSC\n\t" "mov %%edx, %0\n\t" "mov %%eax, %1\n\t": "=r" (cycles_high), "=r" (cycles_low):: "%rax", "%rbx", "%rcx", "%rdx"); asm volatile("RDTSCP\n\t" "mov %%edx, %0\n\t" "mov %%eax, %1\n\t" "CPUID\n\t": "=r" (cycles_high1), "=r" (cycles_low1):: "%rax", "%rbx", "%rcx", "%rdx"); asm volatile ("CPUID\n\t" "RDTSC\n\t" "mov %%edx, %0\n\t" "mov %%eax, %1\n\t": "=r" (cycles_high), "=r" (cycles_low):: "%rax", "%rbx", "%rcx", "%rdx"); asm volatile("RDTSCP\n\t" "mov %%edx, %0\n\t" "mov %%eax, %1\n\t" "CPUID\n\t": "=r" (cycles_high1), "=r" (cycles_low1):: "%rax", "%rbx", "%rcx", "%rdx"); for (j=0; j<BOUND_OF_LOOP; j++) { for (i =0; i<SIZE_OF_STAT; i++) { variable = 0; preempt_disable(); raw_local_irq_save(flags);
asm volatile ("CPUID\n\t" "RDTSC\n\t" "mov %%edx, %0\n\t"

How to Benchmark Code Execution Times on Intel® IA-32 and IA-64 Instruction Set Architectures
18
"mov %%eax, %1\n\t": "=r" (cycles_high), "=r" (cycles_low):: "%rax", "%rbx", "%rcx", "%rdx"); /***********************************/ /*call the function to measure here*/ /***********************************/
asm volatile("RDTSCP\n\t" "mov %%edx, %0\n\t" "mov %%eax, %1\n\t" "CPUID\n\t": "=r" (cycles_high1), "=r" (cycles_low1):: "%rax", "%rbx", "%rcx", "%rdx"); raw_local_irq_restore(flags); preempt_enable();
If we perform the same analysis as in Section 3.2.1, we obtain a kernel log as follows:
Loading hello module...
loop_size:0 >>>> variance(cycles): 2; max_deviation: 4 ;min time: 44
loop_size:1 >>>> variance(cycles): 3; max_deviation: 4 ;min time: 44
loop_size:2 >>>> variance(cycles): 3; max_deviation: 4 ;min time: 44
……………………………
……………………………
loop_size:997 >>>> variance(cycles): 2; max_deviation: 4 ;min time: 44
loop_size:998 >>>> variance(cycles): 3; max_deviation: 4 ;min time: 44
loop_size:999 >>>> variance(cycles): 3; max_deviation: 4 ;min time: 44
total number of spurious min values = 0
total variance = 2
absolute max deviation = 104
variance of variances = 0
variance of minimum values = 0
In this case, the minimum time does not change between different ensembles (it is always the same along all the 1000 repetitions of each ensemble); this means that the overhead of calling the benchmarking function itself can be exactly determined.
The total variance is 2 cycles, i.e., the standard error on the measure is 1,414 cycles (before it was 6,9 cycles).
How to Benchmark Code Execution Times on Intel® IA-32 and IA-64 Instruction Set Architectures
19
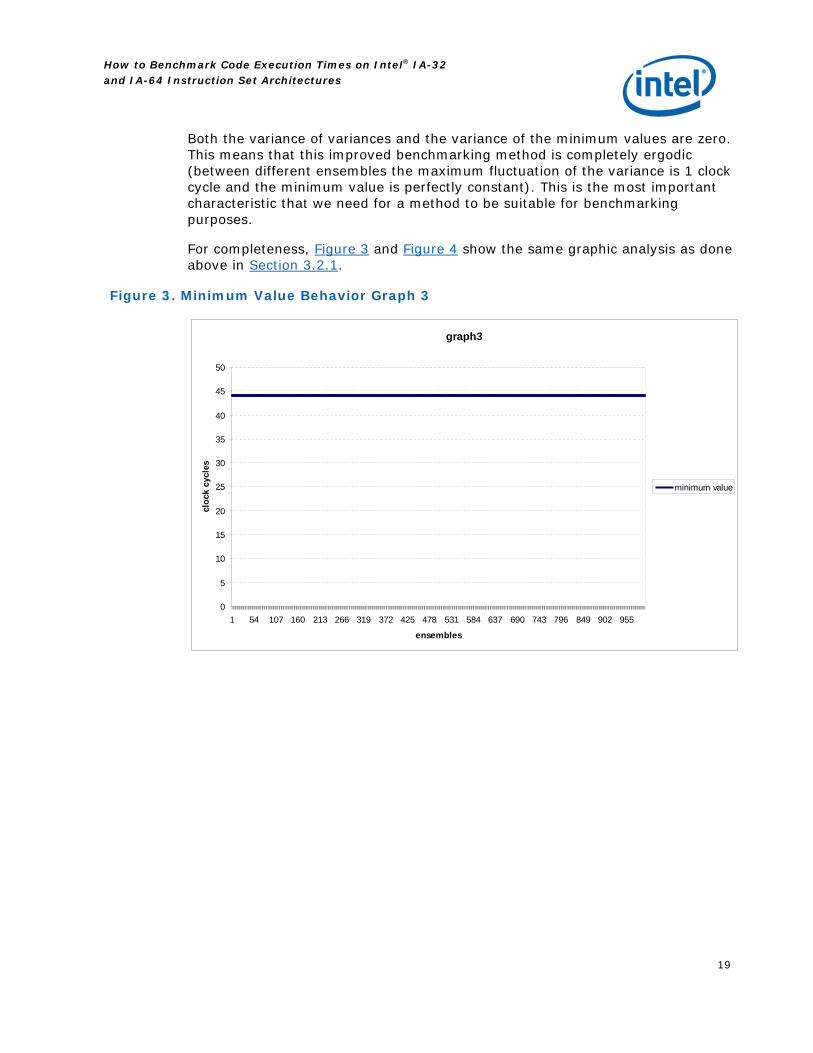
Both the variance of variances and the variance of the minimum values are zero. This means that this improved benchmarking method is completely ergodic (between different ensembles the maximum fluctuation of the variance is 1 clock cycle and the minimum value is perfectly constant). This is the most important characteristic that we need for a method to be suitable for benchmarking purposes.
For completeness, Figure 3 and Figure 4 show the same graphic analysis as done above in Section 3.2.1.
Figure 3. Minimum Value Behavior Graph 3
graph3
0
5
10
15
20
25
30
35
40
45
50
1 54 107 160 213 266 319 372 425 478 531 584 637 690 743 796 849 902 955
ensembles
clo
ck c
ycle
s
minimum value

How to Benchmark Code Execution Times on Intel® IA-32 and IA-64 Instruction Set Architectures
20
Figure 4. Variance Behavior Graph 4
In Figure 3 we can see that the minimum value is perfectly constant between ensembles; in Figure 4 the variance is either equal to 2 or 3 clock cycles.
3.2.3 An Alternative Method for Architecture Not Supporting RDTSCP
This section presents an alternative method to benchmark code execution cycles for architectures that do not support the RDTSCP instruction. Such a method is not as good as the one presented in Section 3.2.1, but it is still much better than the one using CPUID to serialize code execution. In this method between the two timestamp register reads we serialize the code execution by writing the control register CR0.
Regarding the code in the Appendix, the developer should replace ln19 to ln54 with the following: asm volatile( "CPUID\n\t" "RDTSC\n\t" "mov %%edx, %0\n\t"
"mov %%eax, %1\n\t": "=r" (cycles_high), "=r" (cycles_low):: "%rax", "%rbx", "%rcx", "%rdx");
asm volatile( "mov %%cr0, %%rax\n\t" "mov %%rax, %%cr0\n\t" "RDTSC\n\t" "mov %%edx, %0\n\t" "mov %%eax, %1\n\t": "=r" (cycles_high1), "=r" (cycles_low1):: "%rax", "%rdx");
graph4
0
2
4
6
8
10
12
14
16
18
20
22
24
1 51 101 151 201 251 301 351 401 451 501 551 601 651 701 751 801 851 901 951
ensembles
clo
ck c
ycle
s
Variance

How to Benchmark Code Execution Times on Intel® IA-32 and IA-64 Instruction Set Architectures
21
asm volatile( "CPUID\n\t" "RDTSC\n\t" "mov %%edx, %0\n\t" "mov %%eax, %1\n\t": "=r" (cycles_high), "=r" (cycles_low):: "%rax", "%rbx", "%rcx", "%rdx"); asm volatile( "mov %%cr0, %%rax\n\t" "mov %%rax, %%cr0\n\t" "RDTSC\n\t" "mov %%edx, %0\n\t" "mov %%eax, %1\n\t": "=r" (cycles_high1), "=r" (cycles_low1):: "%rax", "%rdx"); asm volatile( "CPUID\n\t" "RDTSC\n\t" "mov %%edx, %0\n\t" "mov %%eax, %1\n\t": "=r" (cycles_high), "=r" (cycles_low):: "%rax", "%rbx", "%rcx", "%rdx"); asm volatile( "mov %%cr0, %%rax\n\t" "mov %%rax, %%cr0\n\t" "RDTSC\n\t" "mov %%edx, %0\n\t" "mov %%eax, %1\n\t": "=r" (cycles_high1), "=r" (cycles_low1):: "%rax", "%rdx"); for (j=0; j<BOUND_OF_LOOP; j++) { for (i =0; i<SIZE_OF_STAT; i++) { variable = 0; preempt_disable(); raw_local_irq_save(flags); asm volatile ("CPUID\n\t"::: "%rax", "%rbx", "%rcx", "%rdx"); asm volatile ("RDTSC\n\t" "mov %%edx, %0\n\t" "mov %%eax, %1\n\t": "=r" (cycles_high), "=r" (cycles_low):: "%rax", "%rdx"); /*call the function to measure here*/ asm volatile("mov %%cr0, %%rax\n\t" "mov %%rax, %%cr0\n\t" "RDTSC\n\t" "mov %%edx, %0\n\t" "mov %%eax, %1\n\t": "=r" (cycles_high1), "=r" (cycles_low1):: "%rax", "%rdx"); raw_local_irq_restore(flags); preempt_enable();
In the code above, first we have the repetition (three times) of the instructions called in the body of the following nested loops; this is just to warm up the instructions cache. Then the body of the loop is executed. We:
· First take the exclusive ownership of the CPU (preempt_disable(), raw_local_irq_save())
· Call CPUID to serialize

How to Benchmark Code Execution Times on Intel® IA-32 and IA-64 Instruction Set Architectures
22
· Read the timestamp register the first time by RDTSC and store the value in memory
· Read the value of the control register CR0 into RAX register
· Write the value of RAX back to CR0 (this instruction serializes)
· Read the timestamp register the second time by RDTSC and store the value in memory
· Release the CPU ownership (raw_local_irq_restore, preempt_enable)
3.2.4 Evaluation of the Alternative Method
As done in Section 3.1.2 and Section 3.2.2, hereafter we present the statistical analysis of the method. The resulting kernel log is as follows:
loop_size:2 >>>> variance(cycles): 3; max_deviation: 4 ;min time: 208
loop_size:3 >>>> variance(cycles): 3; max_deviation: 4 ;min time: 208
loop_size:4 >>>> variance(cycles): 3; max_deviation: 4 ;min time: 208
…………………
…………………
loop_size:998 >>>> variance(cycles): 4; max_deviation: 4 ;min time: 208
loop_size:999 >>>> variance(cycles): 3; max_deviation: 4 ;min time: 208
total number of spurious min values = 0
total variance = 3
absolute max deviation = 176
variance of variances = 0
variance of minimum values = 0
In the log we see that the total variance of this method is 3 cycles rather than 2 and the absolute max deviation is 176 cycles rather than 104 cycles. This means that the standard error on the measure is 1,73 rather than 1,414 and the maximum error is increased as well. Nevertheless, we still have met the ergodicity requirements since the variance does not change between different ensembles (the maximum fluctuation is 1 clock cycle) as well as the minimum value; both the variance of the variances and the variance of the minimum values are zero. Such a method may be suitable for benchmarking whenever the RDTSCP instruction is not available on the CPU.
As done previously, the following graphs show the behavior of the minimum values and of the variances between different ensembles.

How to Benchmark Code Execution Times on Intel® IA-32 and IA-64 Instruction Set Architectures
23
Figure 5. Minimum Value Behavior Graph 5
Figure 6. Variance Behavior Graph 6
In Figure 5, we can see how the minimum value is perfectly constant between ensembles. In Figure 6, we have the variance being either equal to 3 or 4 clock cycles.
graph5
0
50
100
150
200
250
1 53 105 157 209 261 313 365 417 469 521 573 625 677 729 781 833 885 937 989
ensembles
clo
ck c
ycle
s
minimum value
graph6
0
24
68
10
1214
1618
2022
24
2628
3032
34
1 59 117 175 233 291 349 407 465 523 581 639 697 755 813 871 929 987
ensembles
cloc
k cy
cles
variance

How to Benchmark Code Execution Times on Intel® IA-32 and IA-64 Instruction Set Architectures
24
3.3 Resolution of the Benchmarking Methodologies In this section we analyze the resolution of our benchmarking methods, focusing on an Intel Core™ i7 processor-based platform, which is representative of a high-end server solution and supports the RDTSCP instruction and out of order execution.
For resolution, we mean the minimum number of sequential assembly instructions that a method is able to benchmark (appreciate). The purpose of this evaluation is mostly intended to define the methodology to calculate the resolution rather than to analyze the resolutions themselves. The resolution itself is, in fact, strictly dependant on the target machine and the developer is advised to run the following test before starting to benchmark to evaluate the benchmarking limits of the platform.
With reference to the code presented in the Appendix, the developer should make the proper replacements according to the benchmarking method he intends to use (Section 3.1.2 if RDTSCP is supported, Section 3.2.2 otherwise). Also, the following code should be added at ln11: void inline measured_loop(unsigned int n, volatile int *var) { int k; for (k=0; k<n; k++) (*var)= 1;
}
and the following in place of “/*call the function to measure here*/”:
measured_loop(j, &variable);
By doing so, the external loop of the two nested ones (j index) is intended to increase step by step the complexity of the function to benchmark; more in details between two consecutive ensembles it increases the parameter that determines the size of the measured loop, thus adding exactly one assembly instruction to the code under benchmark.
3.3.1 Resolution with RDTSCP
According to the guidelines in Section 3.3, we effect the recommended replacements in the code for the method using RDTSCP instruction, we build the kernel module, and we call insmod from the shell. The resulting kernel log is as follows:
loop_size:0 >>>> variance(cycles): 3; max_deviation: 16 ;min time: 44
loop_size:1 >>>> variance(cycles): 3; max_deviation: 16 ;min time: 44
loop_size:2 >>>> variance(cycles): 3; max_deviation: 48 ;min time: 44
loop_size:3 >>>> variance(cycles): 4; max_deviation: 16 ;min time: 44

How to Benchmark Code Execution Times on Intel® IA-32 and IA-64 Instruction Set Architectures
25
loop_size:4 >>>> variance(cycles): 3; max_deviation: 32 ;min time: 44
loop_size:5 >>>> variance(cycles): 0; max_deviation: 36 ;min time: 44
loop_size:6 >>>> variance(cycles): 3; max_deviation: 28 ;min time: 48
loop_size:7 >>>> variance(cycles): 4; max_deviation: 32 ;min time: 48
loop_size:8 >>>> variance(cycles): 3; max_deviation: 16 ;min time: 48
loop_size:9 >>>> variance(cycles): 2; max_deviation: 48 ;min time: 48
loop_size:10 >>>> variance(cycles): 0; max_deviation: 28 ;min time: 48
loop_size:11 >>>> variance(cycles): 3; max_deviation: 64 ;min time: 52
……………
……………
loop_size:994 >>>> variance(cycles): 3; max_deviation: 4 ;min time: 2036
loop_size:995 >>>> variance(cycles): 0; max_deviation: 4 ;min time: 2036
loop_size:996 >>>> variance(cycles): 3; max_deviation: 4 ;min time: 2040
loop_size:997 >>>> variance(cycles): 21; max_deviation: 4 ;min time: 2044
loop_size:998 >>>> variance(cycles): 22; max_deviation: 112 ;min time: 2048
loop_size:999 >>>> variance(cycles): 23; max_deviation: 160 ;min time: 2048
total number of spurious min values = 0
total variance = 1
absolute max deviation = 176
variance of variances = 2
variance of minimum values = 335926
As seen, each row is an ensemble of measures for a specific size of “measured_loop”; going down row by row, the complexity of the “measured_loop” function is increased exactly by one assembly instruction. Accordingly we see that “min time” increases as we scroll down the rows. Now let’s look at the final part of the log:
· the total number of spurious min values is zero: this means that as we increase the complexity of the measured loop, the minimum measured time monotonically increases (if we perform enough measures we can exactly determine the minimum number of clock cycles that it takes to run a certain function)
· the total variance is 1 cycle: that means that the overall standard error is 1 cycle (that is very good)

How to Benchmark Code Execution Times on Intel® IA-32 and IA-64 Instruction Set Architectures
26
· the absolute max deviation is 176 cycles: from a benchmarking perspective it is not very important; instead this parameter is fundamental to evaluate the capabilities of the system to meet real-time constraints (we will not pursue this further since it is out of the scope of this paper).
· The variance of the variances is 2 cycles: this index is very representative of how reliable our benchmarking method is (i.e., the variance of the measures does not vary according to the complexity of the function under benchmark).
· Finally the variance of the minimum values is completely meaningless and useless in this context and can be neglected (this index was crucial for Section 0)
From a resolution perspective we can see that we have the min value that is constant (44 cycles) between 0 and 5 measured assembly instructions and between 6 and 10 assembly instructions (48 clock cycles). Then it increases very regularly by four cycles every two assembly instructions. So unless the function under benchmark is very small, in this case the resolution of this benchmarking method is two assembly instructions (that is the minimum variation in the code complexity that can be revealed).
For completeness, the following graph (Graph 7) shows the minimum values, and the next graph (Graph 8) shows the variances.
Figure 7. Minimum Value Behavior Graph 7
graph7
0
500
1000
1500
2000
2500
1 52 103 154 205 256 307 358 409 460 511 562 613 664 715 766 817 868 919 970
ensembles
clo
ck c
ycle
s
min value
How to Benchmark Code Execution Times on Intel® IA-32 and IA-64 Instruction Set Architectures
27
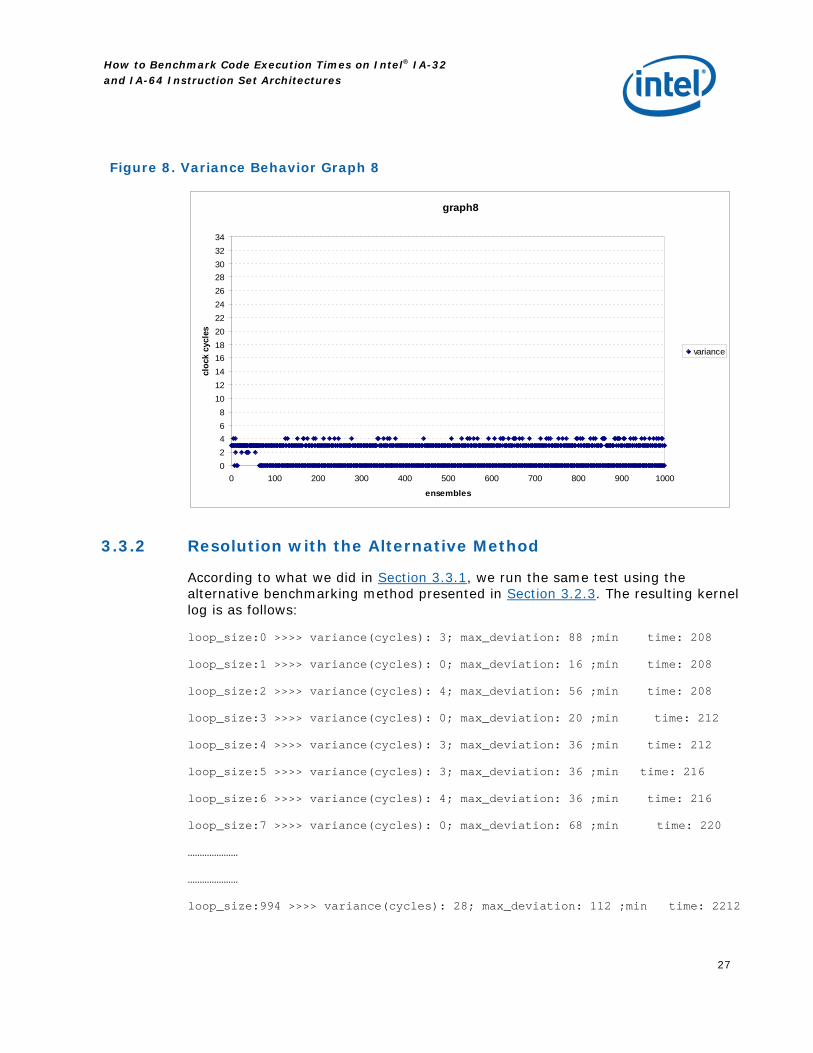
Figure 8. Variance Behavior Graph 8
3.3.2 Resolution with the Alternative Method
According to what we did in Section 3.3.1, we run the same test using the alternative benchmarking method presented in Section 3.2.3. The resulting kernel log is as follows:
loop_size:0 >>>> variance(cycles): 3; max_deviation: 88 ;min time: 208
loop_size:1 >>>> variance(cycles): 0; max_deviation: 16 ;min time: 208
loop_size:2 >>>> variance(cycles): 4; max_deviation: 56 ;min time: 208
loop_size:3 >>>> variance(cycles): 0; max_deviation: 20 ;min time: 212
loop_size:4 >>>> variance(cycles): 3; max_deviation: 36 ;min time: 212
loop_size:5 >>>> variance(cycles): 3; max_deviation: 36 ;min time: 216
loop_size:6 >>>> variance(cycles): 4; max_deviation: 36 ;min time: 216
loop_size:7 >>>> variance(cycles): 0; max_deviation: 68 ;min time: 220
…………………
…………………
loop_size:994 >>>> variance(cycles): 28; max_deviation: 112 ;min time: 2212
graph8
0
2
4
6
8
10
12
14
16
18
20
22
24
26
28
30
32
34
0 100 200 300 400 500 600 700 800 900 1000
ensembles
clo
ck c
ycle
s
variance
How to Benchmark Code Execution Times on Intel® IA-32 and IA-64 Instruction Set Architectures
28
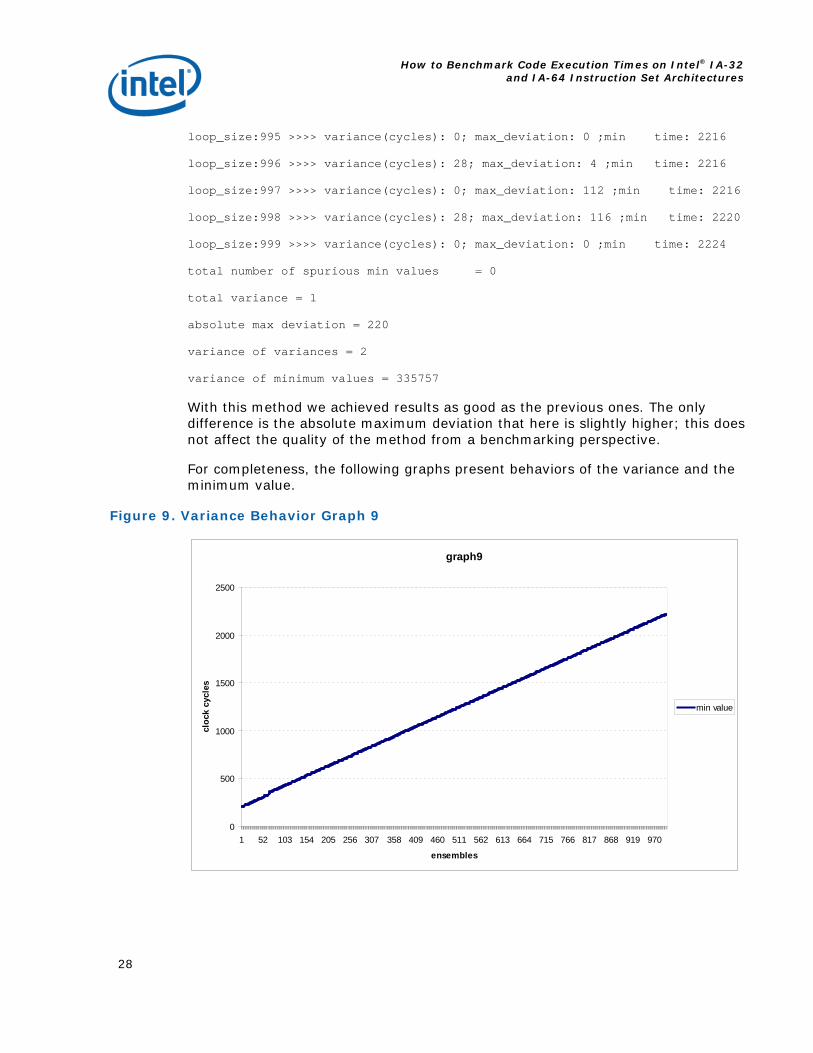
loop_size:995 >>>> variance(cycles): 0; max_deviation: 0 ;min time: 2216
loop_size:996 >>>> variance(cycles): 28; max_deviation: 4 ;min time: 2216
loop_size:997 >>>> variance(cycles): 0; max_deviation: 112 ;min time: 2216
loop_size:998 >>>> variance(cycles): 28; max_deviation: 116 ;min time: 2220
loop_size:999 >>>> variance(cycles): 0; max_deviation: 0 ;min time: 2224
total number of spurious min values = 0
total variance = 1
absolute max deviation = 220
variance of variances = 2
variance of minimum values = 335757
With this method we achieved results as good as the previous ones. The only difference is the absolute maximum deviation that here is slightly higher; this does not affect the quality of the method from a benchmarking perspective.
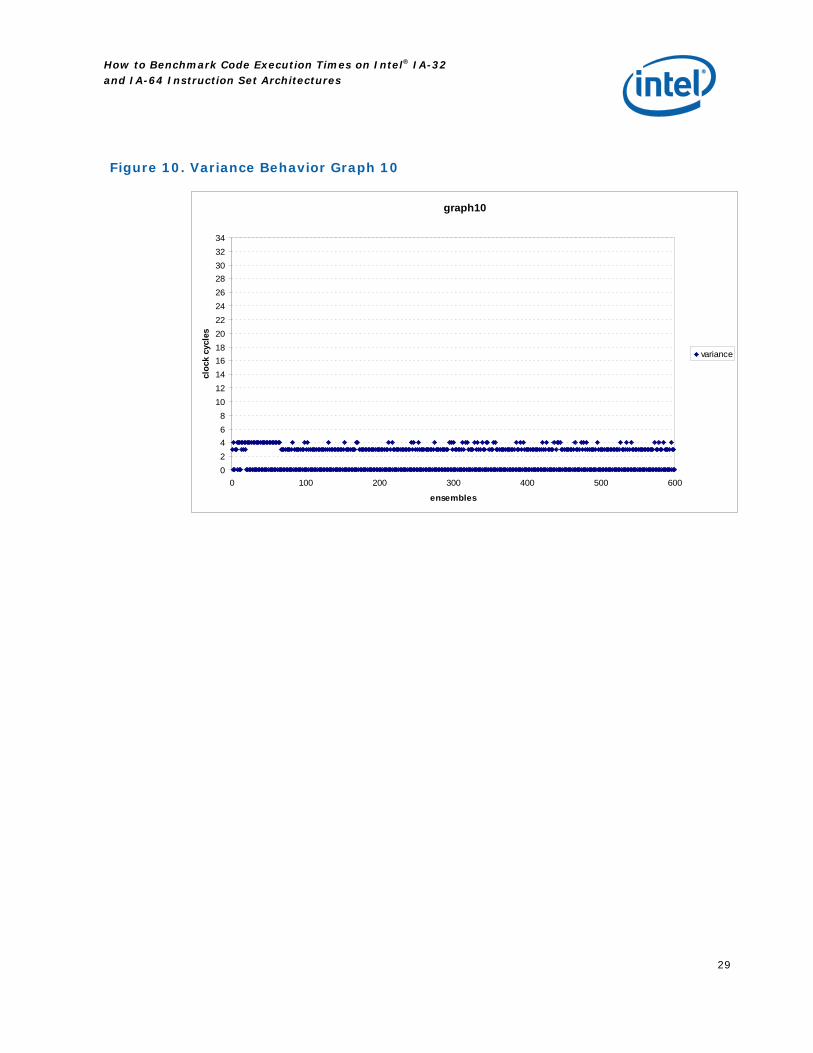
For completeness, the following graphs present behaviors of the variance and the minimum value.
Figure 9. Variance Behavior Graph 9
graph9
0
500
1000
1500
2000
2500
1 52 103 154 205 256 307 358 409 460 511 562 613 664 715 766 817 868 919 970
ensembles
clo
ck c
ycle
s
min value
How to Benchmark Code Execution Times on Intel® IA-32 and IA-64 Instruction Set Architectures
29
Figure 10. Variance Behavior Graph 10
graph10
0
2
4
6
8
10
12
14
16
18
20
22
24
26
28
30
32
34
0 100 200 300 400 500 600
ensembles
clo
ck c
ycle
s
variance

How to Benchmark Code Execution Times on Intel® IA-32 and IA-64 Instruction Set Architectures
30
4 5BSummary In Section 3.2.1 and Section 3.2.3 we showed two suitable methods for benchmarking the execution time of a generic C/C++ function running on an IA32/IA64 platform. The former should be chosen if the RDTSCP instruction is available; if not, the other one can be used.
Whenever taking a measurement, the developer should perform the following steps:
1. Run the tests in Section 3.2.2 or Section 3.2.4 (according to the platform).
2. Analyze the variance of the variances and the variance of the minimum values to validate the method on his platform. If the values that the user obtains are not satisfactory, he may have to change the BIOS settings or the BIOS itself.
3. Calculate the resolution that the method is able to guarantee.
4. Make the measurement and subtract the offset (additional cost of calling the measuring function itself) that the user will have calculated before (minimum value from Section 3.2.2 or Section 3.2.4).
A couple final considerations should be made:
Counter Overflow: The timestamp register is 64 bit. On a single overflow, we encounter no problems since we are making a difference between unsigned int and the results would be still correct. The problem arises if the duration of the code under measurement takes longer than 2^64 cycles. For a 1-GHz CPU, that would mean that your code should take longer than
(2^64)/(10^9) = 18446744073 seconds ~ 585 years
So it shouldn’t be a problem or, if it is, the developer won’t still be alive to see it!
32- vs. 64-Bit Architectures: Particular attention must be paid to the 64-bit registers used in the code presented in this paper. Whenever working with a 32b platform, the code presented is still valid, but whatever occurrence of rax, rbx, rcx, rdx has to be replaced respectively with eax, ebx, ecx, edx.
The Intel® Embedded Design Center provides qualified developers with web-based access to technical resources. Access Intel Confidential design materials, step-by-step guidance, application reference solutions, training, Intel’s tool loaner program, and connect with an e-help desk and the embedded community. Design Fast. Design Smart. Get started today. 43Hhttp://intel.com/embedded/edc.
How to Benchmark Code Execution Times on Intel® IA-32 and IA-64 Instruction Set Architectures
31
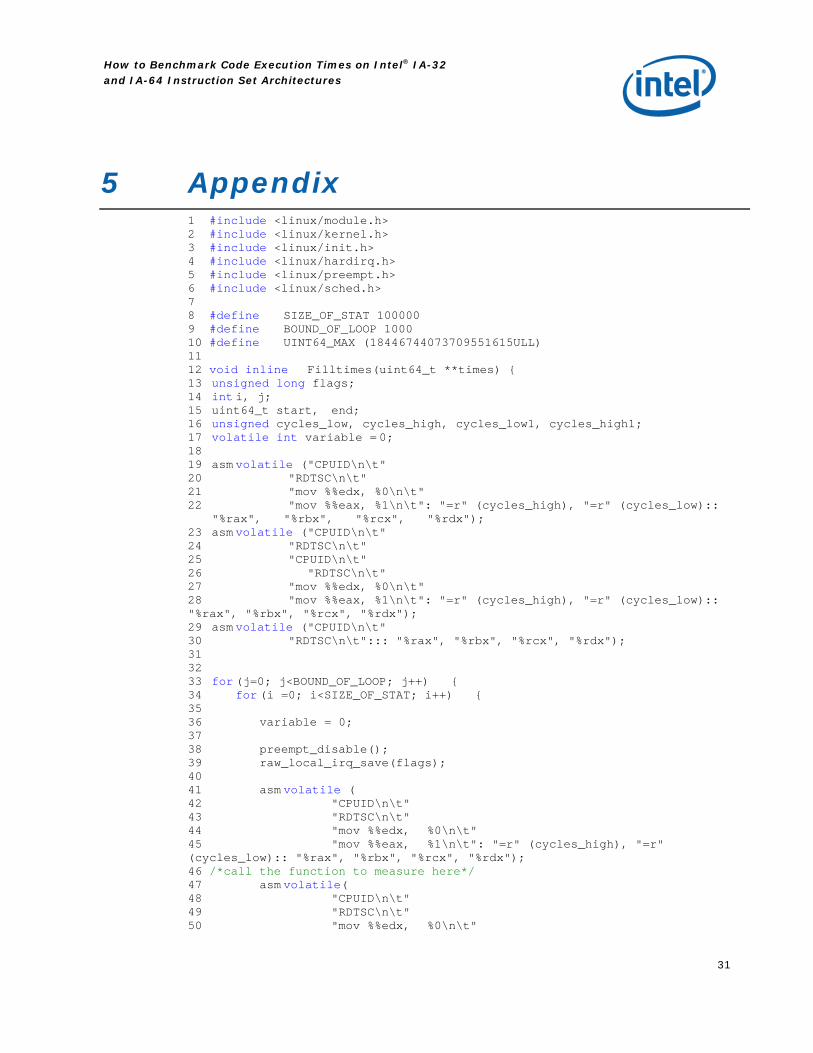
5 Appendix 1 #include <linux/module.h> 2 #include <linux/kernel.h> 3 #include <linux/init.h> 4 #include <linux/hardirq.h> 5 #include <linux/preempt.h> 6 #include <linux/sched.h> 7 8 #define SIZE_OF_STAT 100000 9 #define BOUND_OF_LOOP 1000 10 #define UINT64_MAX (18446744073709551615ULL) 11 12 void inline Filltimes(uint64_t **times) { 13 unsigned long flags; 14 int i, j; 15 uint64_t start, end; 16 unsigned cycles_low, cycles_high, cycles_low1, cycles_high1; 17 volatile int variable = 0; 18 19 asm volatile ("CPUID\n\t" 20 "RDTSC\n\t" 21 "mov %%edx, %0\n\t" 22 "mov %%eax, %1\n\t": "=r" (cycles_high), "=r" (cycles_low):: "%rax", "%rbx", "%rcx", "%rdx"); 23 asm volatile ("CPUID\n\t" 24 "RDTSC\n\t" 25 "CPUID\n\t" 26 "RDTSC\n\t" 27 "mov %%edx, %0\n\t" 28 "mov %%eax, %1\n\t": "=r" (cycles_high), "=r" (cycles_low):: "%rax", "%rbx", "%rcx", "%rdx"); 29 asm volatile ("CPUID\n\t" 30 "RDTSC\n\t"::: "%rax", "%rbx", "%rcx", "%rdx"); 31 32 33 for (j=0; j<BOUND_OF_LOOP; j++) { 34 for (i =0; i<SIZE_OF_STAT; i++) { 35 36 variable = 0; 37 38 preempt_disable(); 39 raw_local_irq_save(flags); 40 41 asm volatile ( 42 "CPUID\n\t" 43 "RDTSC\n\t" 44 "mov %%edx, %0\n\t" 45 "mov %%eax, %1\n\t": "=r" (cycles_high), "=r" (cycles_low):: "%rax", "%rbx", "%rcx", "%rdx"); 46 /*call the function to measure here*/ 47 asm volatile( 48 "CPUID\n\t" 49 "RDTSC\n\t" 50 "mov %%edx, %0\n\t"

How to Benchmark Code Execution Times on Intel® IA-32 and IA-64 Instruction Set Architectures
32
51 "mov %%eax, %1\n\t": "=r" (cycles_high1), "=r" (cycles_low1):: "%rax", "%rbx", "%rcx", "%rdx"); 52 53 raw_local_irq_restore(flags); 54 preempt_enable(); 55 56 57 start = ( ((uint64_t)cycles_high << 32) | cycles_low ); 58 59 end = ( ((uint64_t)cycles_high1 << 32) | cycles_low1 ); 60 61 if ( (end - start) < 0) { 62 printk(KERN_ERR "\n\n>>>>>>>>>>>>>> CRITICAL ERROR IN TAKING THE TIME!!!!!!\n loop(%d) stat(%d) start = %llu, end = %llu, variable = %u\n", j, i, start, end, variable); 63 times[j][i] = 0; 64 } 65 else 66 { 67 times[j][i] = end - start; 68 } 69 } 70 } 71 return; 72} 73uint64_t var_calc(uint64_t *inputs, int size) 74{ 75 int i; 76 uint64_t acc = 0, previous = 0, temp_var = 0; 77 for (i=0; i< size; i++) { 78 if (acc < previous) goto overflow; 79 previous = acc; 80 acc += inputs[i]; 81 } 82 acc = acc * acc; 83 if (acc < previous) goto overflow; 84 previous = 0; 85 for (i=0; i< size; i++){ 86 if (temp_var < previous) goto overflow; 87 previous = temp_var; 88 temp_var+= (inputs[i]*inputs[i]); 89 } 90 temp_var = temp_var * size; 91 if (temp_var < previous) goto overflow; 92 temp_var =(temp_var - acc)/(((uint64_t)(size))*((uint64_t)(size))); 93 return (temp_var); 94overflow: 95 printk(KERN_ERR "\n\n>>>>>>>>>>>>>> CRITICAL OVERFLOW ERROR IN var_calc!!!!!!\n\n"); 96 return -EINVAL; 97} 98static int __init hello_start(void) 99{ 100 int i = 0, j = 0, spurious = 0, k =0; 101 uint64_t **times; 102 uint64_t *variances;
How to Benchmark Code Execution Times on Intel® IA-32 and IA-64 Instruction Set Architectures
33
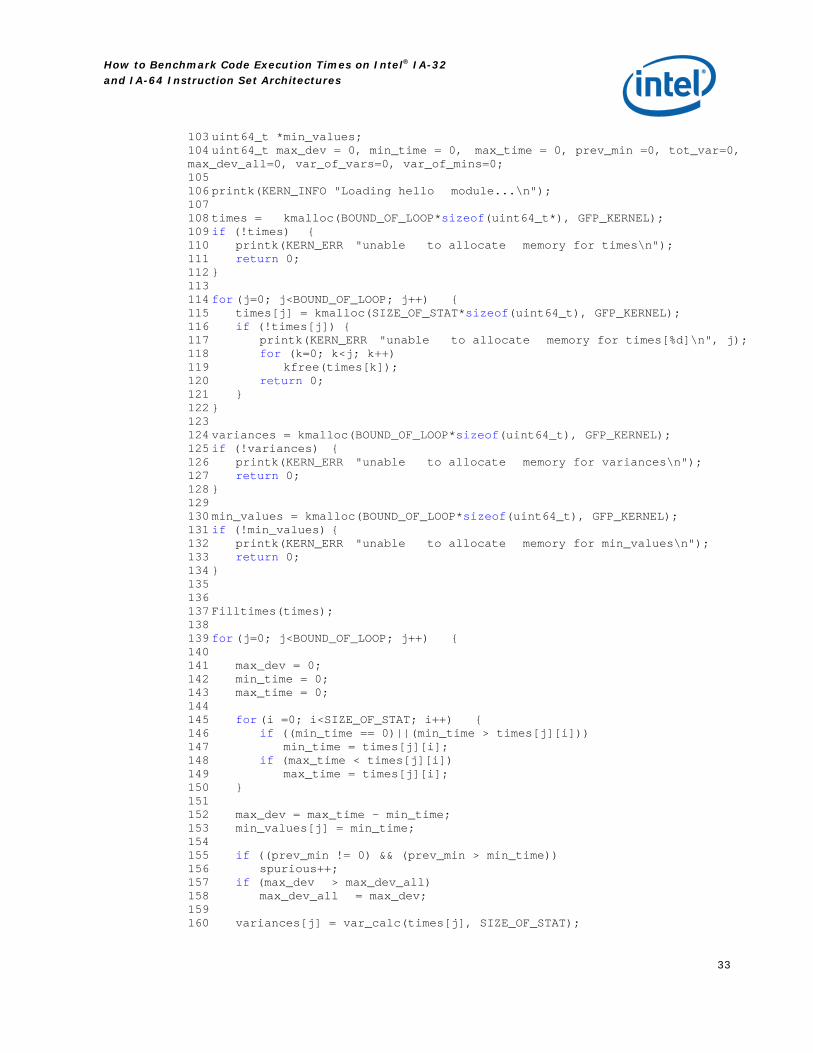
103 uint64_t *min_values; 104 uint64_t max_dev = 0, min_time = 0, max_time = 0, prev_min =0, tot_var=0, max_dev_all=0, var_of_vars=0, var_of_mins=0; 105 106 printk(KERN_INFO "Loading hello module...\n"); 107 108 times = kmalloc(BOUND_OF_LOOP*sizeof(uint64_t*), GFP_KERNEL); 109 if (!times) { 110 printk(KERN_ERR "unable to allocate memory for times\n"); 111 return 0; 112 } 113 114 for (j=0; j<BOUND_OF_LOOP; j++) { 115 times[j] = kmalloc(SIZE_OF_STAT*sizeof(uint64_t), GFP_KERNEL); 116 if (!times[j]) { 117 printk(KERN_ERR "unable to allocate memory for times[%d]\n", j); 118 for (k=0; k<j; k++) 119 kfree(times[k]); 120 return 0; 121 } 122 } 123 124 variances = kmalloc(BOUND_OF_LOOP*sizeof(uint64_t), GFP_KERNEL); 125 if (!variances) { 126 printk(KERN_ERR "unable to allocate memory for variances\n"); 127 return 0; 128 } 129 130 min_values = kmalloc(BOUND_OF_LOOP*sizeof(uint64_t), GFP_KERNEL); 131 if (!min_values) { 132 printk(KERN_ERR "unable to allocate memory for min_values\n"); 133 return 0; 134 } 135 136 137 Filltimes(times); 138 139 for (j=0; j<BOUND_OF_LOOP; j++) { 140 141 max_dev = 0; 142 min_time = 0; 143 max_time = 0; 144 145 for (i =0; i<SIZE_OF_STAT; i++) { 146 if ((min_time == 0)||(min_time > times[j][i])) 147 min_time = times[j][i]; 148 if (max_time < times[j][i]) 149 max_time = times[j][i]; 150 } 151 152 max_dev = max_time - min_time; 153 min_values[j] = min_time; 154 155 if ((prev_min != 0) && (prev_min > min_time)) 156 spurious++; 157 if (max_dev > max_dev_all) 158 max_dev_all = max_dev; 159 160 variances[j] = var_calc(times[j], SIZE_OF_STAT);

How to Benchmark Code Execution Times on Intel® IA-32 and IA-64 Instruction Set Architectures
34
161 tot_var += variances[j]; 162 163 printk(KERN_ERR "loop_size:%d >>>> variance(cycles): %llu; max_deviation: %llu ;min time: %llu", j, variances[j], max_dev, min_time); 164 165 prev_min = min_time; 166 } 167 168 var_of_vars = var_calc(variances, BOUND_OF_LOOP); 169 var_of_mins = var_calc(min_values, BOUND_OF_LOOP); 170 171 printk(KERN_ERR "\n total number of spurious min values = %d", spurious); 172 printk(KERN_ERR "\n total variance = %llu", (tot_var/BOUND_OF_LOOP)); 173 printk(KERN_ERR "\n absolute max deviation = %llu", max_dev_all); 174 printk(KERN_ERR "\n variance of variances = %llu", var_of_vars); 175 printk(KERN_ERR "\n variance of minimum values = %llu", var_of_mins); 176 177 for (j=0; j<BOUND_OF_LOOP; j++) { 178 kfree(times[j]); 179 } 180 kfree(times); 181 kfree(variances); 182 kfree(min_values); 183 return 0; 184} 185 186static void __exit hello_end(void) 187{ 188 printk(KERN_INFO "Goodbye Mr.\n"); 189} 190 191module_init(hello_start); 192module_exit(hello_end);
How to Benchmark Code Execution Times on Intel® IA-32 and IA-64 Instruction Set Architectures
35
6 Reference List [1] Using the RDTSC Instruction for Performance Monitoring
http://www.ccsl.carleton.ca/~jamuir/rdtscpm1.pdf
[2] GCC Inline Assembly HowTo
http://www.ibiblio.org/gferg/ldp/GCC-Inline-Assembly-HOWTO.html#ss5.4
[3] Intel® 64 and IA-32 Architectures Software Developer’s Manual Volume 2B
http://www.intel.com/Assets/PDF/manual/253667.pdf
[4] Intel® 64 and IA-32 Architectures Software Developer’s Manual Volume 2A
http://www.intel.com/Assets/PDF/manual/253666.pdf
[5] The Linux Kernel Module Programming Guide
http://tldp.org/LDP/lkmpg/2.6/html/lkmpg.html

How to Benchmark Code Execution Times on Intel® IA-32 and IA-64 Instruction Set Architectures
36
Author Gabriele Paoloni is an Embedded/Linux software engineer in the Intel Architecture Group.

How to Benchmark Code Execution Times on Intel® IA-32 and IA-64 Instruction Set Architectures
37
INFORMATION IN THIS DOCUMENT IS PROVIDED IN CONNECTION WITH INTEL PRODUCTS. NO LICENSE, EXPRESS OR IMPLIED, BY ESTOPPEL OR OTHERWISE, TO ANY INTELLECTUAL PROPERTY RIGHTS IS GRANTED BY THIS DOCUMENT. EXCEPT AS PROVIDED IN INTEL’S TERMS AND CONDITIONS OF SALE FOR SUCH PRODUCTS, INTEL ASSUMES NO LIABILITY WHATSOEVER, AND INTEL DISCLAIMS ANY EXPRESS OR IMPLIED WARRANTY, RELATING TO SALE AND/OR USE OF INTEL PRODUCTS INCLUDING LIABILITY OR WARRANTIES RELATING TO FITNESS FOR A PARTICULAR PURPOSE, MERCHANTABILITY, OR INFRINGEMENT OF ANY PATENT, COPYRIGHT OR OTHER INTELLECTUAL PROPERTY RIGHT. UNLESS OTHERWISE AGREED IN WRITING BY INTEL, THE INTEL PRODUCTS ARE NOT DESIGNED NOR INTENDED FOR ANY APPLICATION IN WHICH THE FAILURE OF THE INTEL PRODUCT COULD CREATE A SITUATION WHERE PERSONAL INJURY OR DEATH MAY OCCUR.
Intel may make changes to specifications and product descriptions at any time, without notice.
This paper is for informational purposes only. THIS DOCUMENT IS PROVIDED "AS IS" WITH NO WARRANTIES WHATSOEVER, INCLUDING ANY WARRANTY OF MERCHANTABILITY, NONINFRINGEMENT, FITNESS FOR ANY PARTICULAR PURPOSE, OR ANY WARRANTY OTHERWISE ARISING OUT OF ANY PROPOSAL, SPECIFICATION OR SAMPLE. Intel disclaims all liability, including liability for infringement of any proprietary rights, relating to use of information in this specification. No license, express or implied, by estoppel or otherwise, to any intellectual property rights is granted herein.
Performance tests and ratings are measured using specific computer systems and/or components and reflect the approximate performance of Intel products as measured by those tests. Any difference in system hardware or software design or configuration may affect actual performance. Buyers should consult other sources of information to evaluate the performance of systems or components they are considering purchasing. For more information on performance tests and on the performance of Intel products, Go to: 44Hhttp://www.intel.com/performance/resources/benchmark_limitations.htm
BunnyPeople, Celeron, Celeron Inside, Centrino, Centrino Inside, Core Inside, i960, Intel, the Intel logo, Intel AppUp, Intel Atom, Intel Atom Inside, Intel Core, Intel Inside, the Intel Inside logo, Intel NetBurst, Intel NetMerge, Intel NetStructure, Intel SingleDriver, Intel SpeedStep, Intel Sponsors of Tomorrow., the Intel Sponsors of Tomorrow. logo, Intel StrataFlash, Intel Viiv, Intel vPro, Intel XScale, InTru, the InTru logo, InTru soundmark, Itanium, Itanium Inside, MCS, MMX, Moblin, Pentium, Pentium Inside, skoool, the skoool logo, Sound Mark, The Journey Inside, vPro Inside, VTune, Xeon, and Xeon Inside are trademarks of Intel Corporation in the U.S. and other countries.
*Other names and brands may be claimed as the property of others.
Copyright © 2010 Intel Corporation. All rights reserved.
§