who computes? cs110 lecture adapted from the slides of j. mcgrath cohoon
TRANSCRIPT

Who Computes?CS110 LectureAdapted from the slides of J. McGrath Cohoon

Overview
Amount & type of computer use Different use shaped by
Education Social networks Cultural beliefs, practices, &
stereotypes Discuss whether and why it matters

Take away
Men dominate the creation of ICT
Computing could be gender balanced

Who has a computer?
Majority of U.S. homes 64% of White 45% of Black 73% of Asian 44% of Hispanic
Rich
Educated
Current Population Survey data
Computer in Household, 2003
NO38% YES
62%
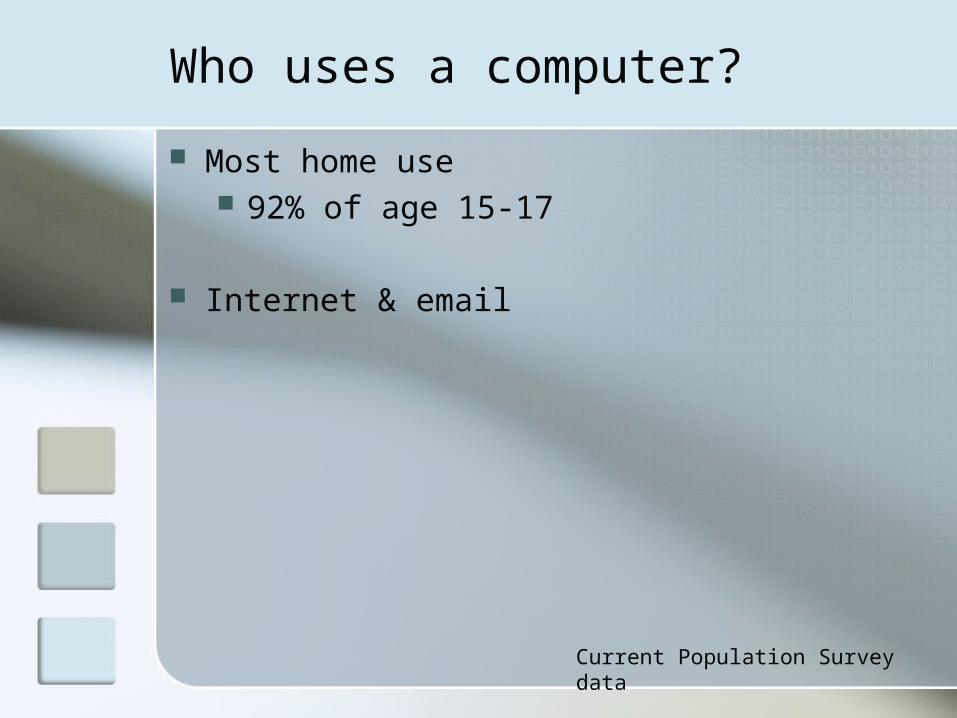
Who uses a computer?
Most home use 92% of age 15-17
Internet & email
Current Population Survey data

No difference in amount by sex
Use Computer at Home, School, or Work, Age 18+, 2003
64% 63%
0%
100%
Women Men
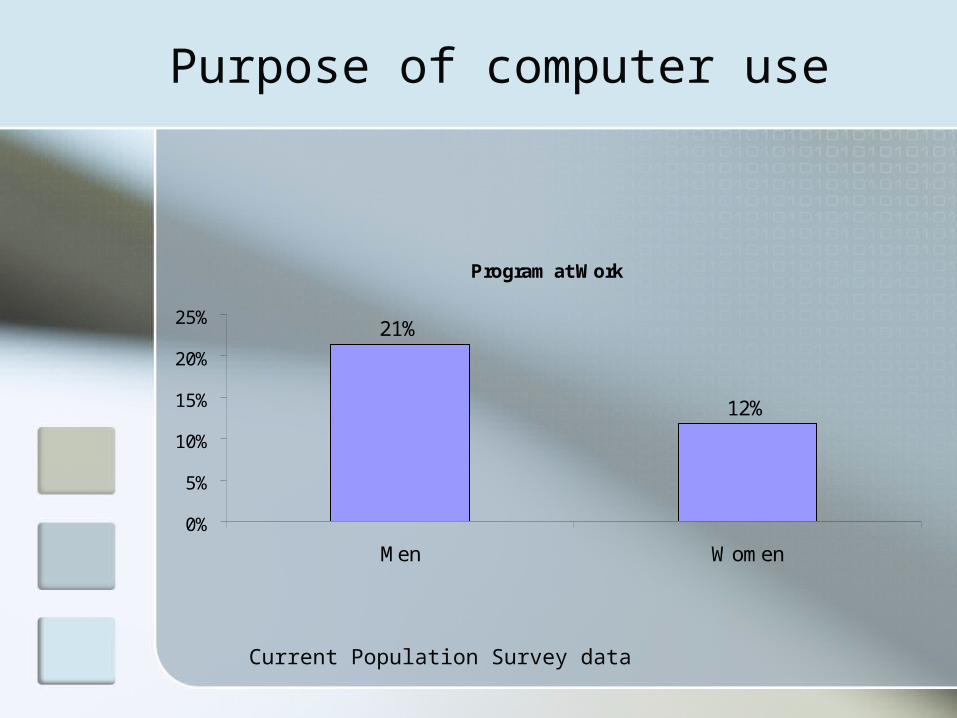
Purpose of computer use
Current Population Survey data
Program at Work
21%
12%
0%
5%
10%
15%
20%
25%
Men Women

Professional creators of ICT
Work in every industry Entertainment – animated movie
images Finance – simulate the economy Health care – real time displays for
telemedicine Defense – unmanned drones Education – educational software
Shape the way we live

Monetary rewards
Starting Salary for Computer Science BS Degree Recipients, 2005
$50,820$55,324
0
10000
20000
30000
40000
50000
60000
National Ave UVA Ave

Show Me the Money
2004 Undergraduate SalariesAccounting $43,050 up 2.4%
Economics/finance $40,719 up 0.4%
Business $38,254 up 6.2% (mostly attributed to sales @$40,395 and marketing @$37,519)
CS $51,042 up 4.9%
Information Systems / Systems
$43,471 up 3.9%
Chemical Eng $53,659 up 2.1%
Elect Eng $51,113 up 2.4%
Civil Eng $43,159 up 5.1%
Pharmacist $84,000
Liberal Arts $29,060 down 3.6%http://www.naceweb.org/press/display.asp?year=2005&prid=208

Who creates computing technology?

Who is prepared?
Women's Percent of Baccalaureates, 1985-2002
0%
10%
20%
30%
40%
50%
60%
1984-85
1985-86
1986-87
1987-88
1988-89
1989-90
1990-91
1991-92
1992-93
1993-94
1994-95
1995-96
1996-97
1997-98
1998-99
1999-00
2000-01
2001-02
Engineering Mathematics Biological / Life Sciences Physical Sciences Computer Science
Data source: National Center for Education Statistics, IPEDS data

Total numbers in Undergrad
Year 2004 Data From: www.cra.org 20,971 BS degrees in CS/CPE
produced 17% women, 3.4% African
American, 3.9% Hispanic
http://www.cra.org/CRN/articles/may05/taulbee.html

Total numbers in Masters
9,141 MS degrees produced 25% women, 1.5% African American,
1.1% Hispanic
New master’s students decreased 17% after having dropped 8% the previous year

Total numbers in PhD
877 PhDs produced in US New enrollments down 8% last year and down
5% the year before Total PhD enrollment is going up by 20% each
year (they’re not graduating)! 18% were women Only 13 were African
American (1.5%) Only 10 were
Hispanic (1.1%) 48% were
international students (May drop fast)
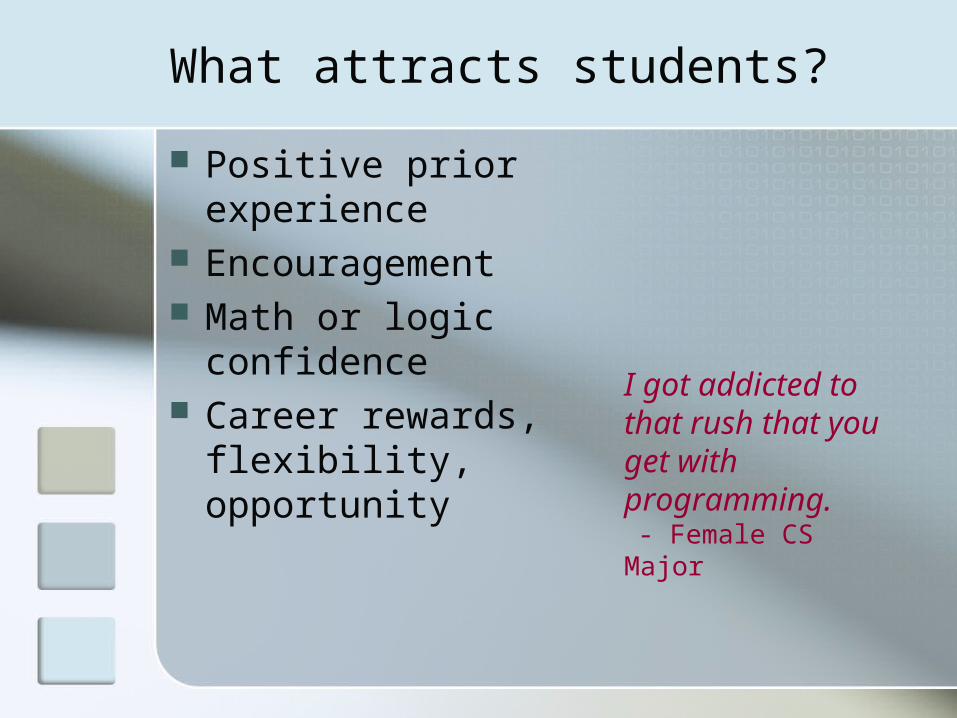
What attracts students?
Positive prior experience Encouragement Math or logic confidence Career rewards,
flexibility, opportunity I got addicted to that rush that you get with programming. - Female CS Major

Attractions for women
Creative self-expression
Communication Helping occupation Recruited by peers Defy gender stereotypes
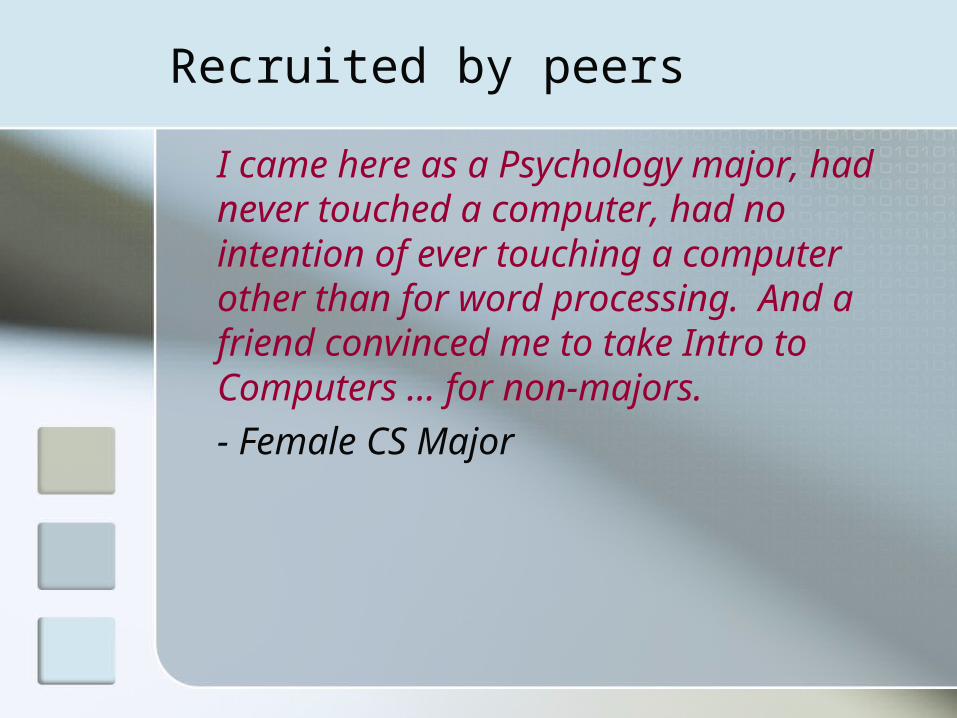
Recruited by peers
I came here as a Psychology major, had never touched a computer, had no intention of ever touching a computer other than for word processing. And a friend convinced me to take Intro to Computers … for non-majors. - Female CS Major

Defy gender stereotypes
Everyone said, "Oh, my God, don't do it. You'll regret it. No, you can't do it. It's going to be too hard for you. You won't be able to do it." I was kind of, like. "You think so, huh? Well, in that case, screw you. I'm going to do it."
- Female CS Major

Is CS becoming gender balanced?
Data source: National Center for Education Statistics, IPEDS data
Female Portion of Intended CS Majors
37% 36% 35%37% 37% 37% 37%
35%33%
29% 28%25% 24% 24% 23% 22%
20%18%
16%14%
0%
10%
20%
30%
40%
50%
1985
1986
1987
1988
1989
1990
1991
1992
1993
1994
1995
1996
1997
1998
1999
2000
2001
2002
2003
2004
fem
% in
ten
din
g C
S m
ajo
r

Why are women underrepresented? Not the math or tech avoidance
Social networks
Cultural beliefs, practices, & stereotypes

Differences in math foundation?
Honors Math Course 2004 SAT-Takers
46%54%
FEMALE MALE
Calculated with data from the College Board
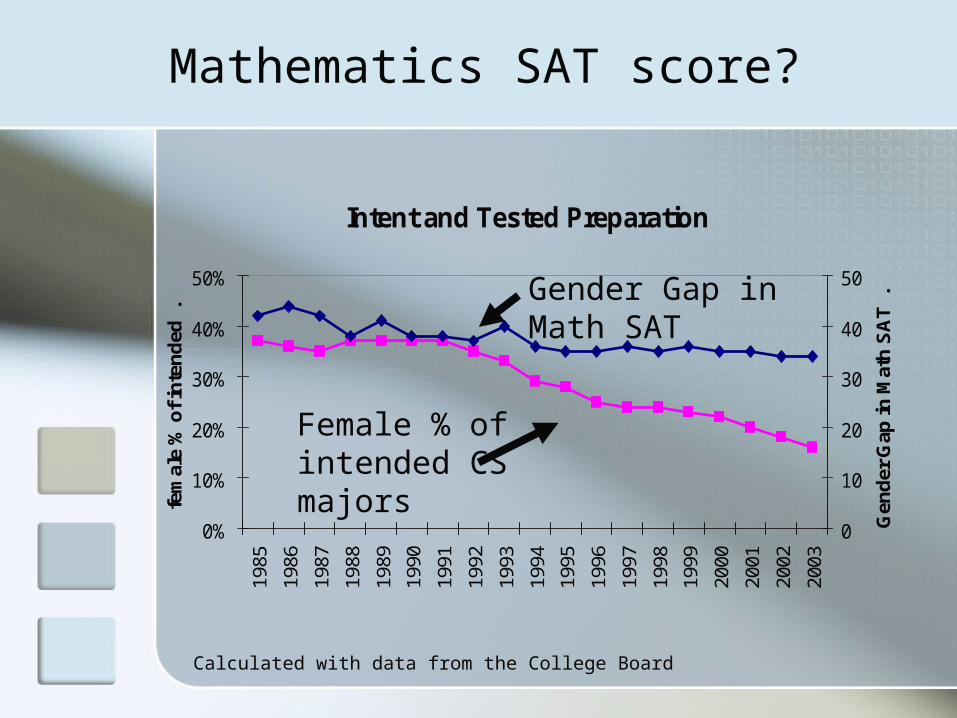
Mathematics SAT score?
Intent and Tested Preparation
0%
10%
20%
30%
40%
50%19
85
1986
1987
1988
1989
1990
1991
1992
1993
1994
1995
1996
1997
1998
1999
2000
2001
2002
2003
fem
ale
% o
f in
ten
ded
.
0
10
20
30
40
50
Gen
der
Gap
in M
ath
SA
T .
Calculated with data from the College Board
Female % of intended CS majors
Gender Gap in Math SAT
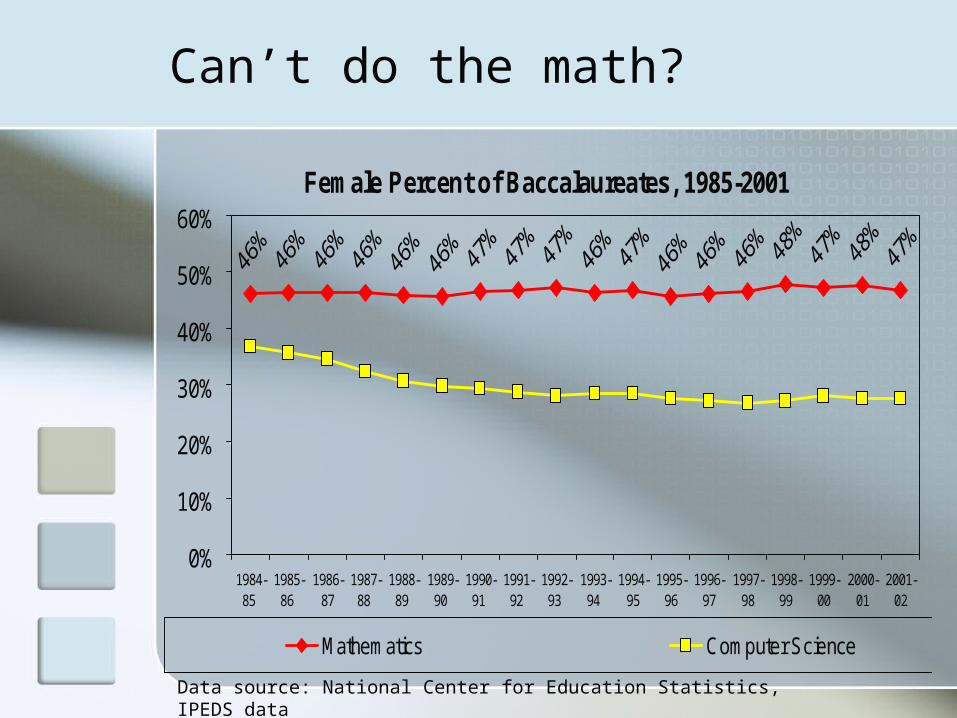
Can’t do the math?
Female Percent of Baccalaureates, 1985-2001
0%
10%
20%
30%
40%
50%
60%
1984-85
1985-86
1986-87
1987-88
1988-89
1989-90
1990-91
1991-92
1992-93
1993-94
1994-95
1995-96
1996-97
1997-98
1998-99
1999-00
2000-01
2001-02
Mathematics Computer Science
Data source: National Center for Education Statistics, IPEDS data

International pattern
No link between math achievement & CS
Mathematices Literacy of 15-year-old Students, 2003, in Countries where CS
Is More Gender-Balanced
551.7
430.2
510.2
515.2
485.9
528.3
415.1
495.4
506.4
479.7
0 100 200 300 400 500 600
S. Korea
Turkey
Ireland
Sweden
U.S.A.
Source: OECD, Program for Internation Student Assessment
Fem. Ave
Male Ave.

Don’t like technical fields?
Women's Share of Bachelor Degrees, 2001
42%35%
28%
0%
10%
20%
30%
40%
50%
Bioengr &BME
ChemE CS
Data Source: IPEDS Completions Survey

Social networks
How many computer scientists do you know?
Academic Alliance
Industry Alliance
Leadership Team Social Science Net
MO'Rourke, J.
FHumphreys, S.
MKamin, S.
OKelly J.
FKurz, S.
FLucas, S.
MMoore, J.
FMorrell, C.
FHorwitz, S.
MNotkin, D.
FLawrence, A.
ORoberts E.
FSieber, D.
MSmith, M.
MWalz, D.
MWhitley or Elaine Regenso, D.
OWilson J. O
Amato N.
FMuller, C.
FDavis, R.
OBennett J.
OBlum L.
OBradley L.
FMariga, J.
FCamp, T.
FHood, C.
MDean, T.
FDíaz-Herrera, Eydie Lawso, J.
MDunn, M.
FFerrante, J.
OFinkelstein A.
MGuzdial, M.
MFisher, A.
FFrieze, C.
FGates, A.
OGiguette M.
OEllis C.
OBurnett K.
OAgyei Y.
OJohnson. W.
OHelander K.
OHaynes J.
OGenshirt D.
OFlagerman C.
FDriscoll, A.
FDang, V.
OBailey S.
MLittlepage, J.
OKopper J.
FBegandy, C.
OMacKenzie H.
OSitcoske M.
OSterling R.
MTolopka, S.
FTopp, J.
FWaugh, B.
OWu L.
FZielke, L.
MKelly, S.
FWhitney, T.
OOlszonowicz D.
ORamsey N.
FRoberts, J.
MSchnabel, B.
FShah, M.
OSlade J.
OMedina L.
MWhite, J.
FRichardson, D.
OSuitt H.
FBarker, L.
FSanders, L.
FLou Soffa, M.
OAggogino A.
FAllen, F.
MBernat, A.
OBugg S.
FCohoon, J.
FGoral, C.
OHussey S.
FJean Harrold, M.
FKeyek-Franssen, D.
FAlexander, B.
FBabco, E.
OStockard J.
FFrank Fox, M.
MSonnert, G.
FMargolis, J.
OJohnson D.
FJesse, J.
OFreeman P.
FEisenhart, M.
FEckert, P.
OCuny J.
FCassell, J.
OBynum M.
OBell G.
OAspray B.
OWardle C.
FBeyer, S.

Beliefs and stereotypes
Men and women are essentially different I guess life just isn't fair until women
grow chest hair, spit, chew, bench press 250 pounds, and write a computer program … - Male Computer Consultant on ZDNN, 1998
Who belongs in CS? Somebody told me…that it wasn’t the
way that a girl thinks – Female CS Major Everyone looks at you strangely because
you are the girl in CS – Female CS Major

Practices
Practical considerations are few Freedom to “choose poorly-paid
female-labeled career paths if they so desire” (Charles and Bradley, 2006)
Effective strategies favor men Mentor assertive students Recruit students who fit the
stereotype

Promoting gender balance
Choice restricted and merit-based Educational requirements
Supportive environment Action to equalize support
Effort to attract women Counteract prevailing stereotypes Reach beyond established networks

Summary
Most creators of ICT are men Reasons for gender imbalance
Not math or tech avoidance Social networks Beliefs, practices, stereotypes

So what?
Breakout for discussion of whether the gender balance in computing matters
Present main points
Discuss as a class