who creates new firms when local opportunities arise?tmcquade/marginal.pdf · shai bernstein,...
TRANSCRIPT

Who Creates New Firms when Local Opportunities Arise?
Shai Bernstein, Emanuele Colonnelli, Davide Malacrino, and Tim McQuade
⇤
June 18, 2018
ABSTRACT
New firm formation is a critical driver of job creation, and an important contributorto the responsiveness of the economy to aggregate shocks. In this paper we examine thecharacteristics of the individuals who become entrepreneurs when local opportunitiesarise due to an increase in local demand. We identify local demand shocks by linkingfluctuations in global commodity prices to municipality level agricultural endowments inBrazil. We find that firm creation response is almost entirely driven by young individualswith generalist and managerial skills. In contrast, we find no such response within thesame municipalities among skilled, yet older individuals. Those individuals who respondto local demand shocks are younger and more skilled than the average entrepreneur inthe population. Entrepreneurial response of young individuals is larger in municipalitieswith better access to finance, more skilled human capital, and with overall youngerdemographics. These results highlight how the characteristics of the local populationcan have a significant impact on the entrepreneurial responsiveness of the economy.
⇤This is the substantially revised version of a paper previously titled “Marginal Entrepreneurs”. Shai Bernstein iswith Stanford University, Graduate School of Business, and NBER; Emanuele Colonnelli is with Stanford University,Department of Economics; Davide Malacrino is with the IMF, and Tim McQuade is with Stanford Graduate School ofBusiness. The views expressed in this article/presentation are those of the authors and do not necessarily represent theviews of the IMF, its Executive Board or IMF management. We are grateful to Nick Bloom, Rebecca Diamond, CallumJones, Arvind Krishnamurthy, Luigi Pistaferri, as well as seminar participants at Alabama, Brigham Young, Duke,Statistics Norway, and Stanford University. We are grateful to the Stanford Institute for Innovation in DevelopingEconomies (SEED), the Private Enterprise Development in Low-Income Countries (PEDL) Initiative by the Centrefor Economic Policy Research (CEPR), the Stanford Center for International Development (SCID), and the AbdulLatif Jameel Poverty Action Lab (J-PAL) Governance Initiative for financial support.

I. Introduction
Entrepreneurship plays a critical role in aggregate job creation, with new businesses responsible for
the majority of new employment in the economy (Decker et al. (2014); Haltiwanger et al. (2013b)).
Of course, entrepreneurship and the creation of new firms is a multi-faceted phenomenon. Some
types of entrepreneurship can be described as Schumpeterian, in which talented individuals person-
ally create new technologies or products that facilitate a creative destruction process in the econ-
omy disrupting existing organizations. Other types of entrepreneurship would better be described
as Kirznerian, in which alert individuals identify the existence of new and exogenous investment
opportunities created by changing market conditions, and take advantage of them by forming new
businesses (Kirzner (1973, 1985)).
This latter form of entrepreneurship is increasingly recognized as an important driver of economic
dynamics. A growing theoretical and empirical literature shows that new business formation is key to
understanding how economies respond to aggregate shocks. For example, a variety of macroeconomic
studies have emphasized the role new firm creation plays in the amplification and propagation of
exogenous economic shocks (e.g., Bilbiie et al. (2012); Clementi and Palazzo (2016); Sedláček and
Sterk (2017)). At the micro level, Adelino et al. (2017) show that new firms are responsible for the
majority of jobs created in response to changes in investment opportunities driven by local demand,
and Decker et al. (2017) find that new firms account for most of the employment growth in regions
that experienced a significant economic expansion due to the discovery of shale oil and gas.
While recognizing the importance of firm entry response to local economic shocks, little is known
about the characteristics of the individual entrepreneurs who identify and act upon such opportu-
nities when they arise. This issue is particularly salient. If these entrepreneurs are concentrated in
a particular segment of the population, then characteristics of the local population and long-term
demographic trends may have significant implications for the entrepreneurial responsiveness of the
economy. Moreover, understanding the key traits of such individuals could be useful to policymak-
ers in thinking how to foster vibrant, dynamic local economies. In this paper, we fill this gap and
1
explore the personal and career characteristics of the individuals who create new firms in response
to changes in local economic opportunities.
Tackling this question empirically poses two challenges. First, exploring this question requires
employer-employee matched data that follows individuals over time and allows identifying the timing
in which individuals choose to become entrepreneurs.1 Second, in order to study the entrepreneurial
response of individuals to opportunities, we need a source of plausibly exogenous variation in local
economic opportunities. For both these reasons, we choose to study the Brazilian economy.
First, our study relies on access to the administrative employer-employee matched data from
the Brazilian Ministry of Labor that captures all the employees in the formal sector, and includes
information on their work history, wages, education, gender and occupation. This data allows us
to not only identify the founders of new firms, but also provides a rich set of information regarding
their personal characteristics before the creation of the new firm. Second, the large agribusiness
sector in the Brazilian economy allows us to identify exogenous local income and demand shocks
arising from global commodity price fluctuations, and to study the firm creation response.2
Specifically, we interact municipality level historical production endowments of agricultural crops
with contemporaneous changes in global commodity prices, a strategy similar in nature to Allcott
and Keniston (2017) in the context of US oil and gas booms and Benguria et al. (2018) in the context
of Brazil’s commodity cycles. These historical concentrations of agricultural crops are persistent due
to the accumulation of expertise and economic activity over long time periods, as well as physical
characteristics of the regions such as climate and soil. Similar to methods employed by Bartik (1991)
1Studying the question in the U.S. is challenging due to limited information on individual level behavior. Forexample, the US Census Bureau’s Longitudinal Employer-Household Dynamics (LEHD) is an employer-employeematched data but its coverage is limited to few states only and excludes key states such as California, New Yorkand Massachusetts (Babina (2015)). Alternatively, survey data in the U.S. such as the PSID (used by Hurst andLusardi (2004) for example), is constrained to a sample of less than 5000 observations. The Survey of Small BusinessFinances compiles data on small businesses and offers information on their characteristics but does not follow firmsover time. Moreover, while the survey provides a good description of the existing small businesses, it is not designedto specifically study the characteristics of new businesses - an important distinction noted by Haltiwanger et al.(2013a).
2Brazil is among the largest producers in the world of coffee, sugarcane, orange juice, soybean, corn and ethanol,among others. These crops provide the basis for the large agribusiness industry in Brazil, which represents 22%of Brazil’s GDP, a third of its employment, and almost 40% of its export (PwC, 2013). The agribusiness industryincludes not only farming production, but also the supply of farming inputs such as machinery, the selling, exportingand marketing the products, warehousing facilities, wholesalers, processors, and retailers, among others.
2

and Blanchard and Katz (1992), this strategy overcomes the reserve causality problems inherent in
a simple regression of firm creation on changes in local income. In our case, the concern is that
unobserved shocks to the investment opportunities of a particular segment in the population could
mechanically impact local income.
We find that, in affected municipalities, increases in commodity prices lead to a significant in-
crease in local income and local employment. Our estimated effects are economically meaningful.
At the top 10% of commodity price increases, municipalities experience a 2.9% increase in local
aggregate income and a 4.1% increase in local employment. This increase in local aggregate income
arguably creates new investment opportunities in the non-tradable sector, which is heavily depen-
dent on local demand (Mian and Sufi (2012b); Basker and Miranda (2016); Mian and Sufi (2012b);
Stroebel and Vavra (2014)). Consistent with this idea, and similarly to Benguria et al. (2018) and
Allcott and Keniston (2017), we find that the local demand shock triggers significant firm entry
driven entirely by increases in the non-tradable sector, with the number of local firms increasing by
3.7%.
We then turn to our main question, and explore the characteristics of those entrepreneurs who
respond to local demand shocks by forming new firms in the non-tradable sector. We find that such
entrepreneurs are almost exclusively young individuals. Specifically we find that within munici-
palities that experience a commodity price shock in endowed crops, entrepreneurship increases by
almost 10 percent among individuals below the age of 30, while there is essentially a zero response
for older individuals. These results are robust to the inclusion of industry fixed effects and a variety
of covariates controlling for other demographic characteristics which may be correlated with age.
These results are consistent with the idea that lifecycle considerations strongly influence indi-
vidual entrepreneurial responses to local economic opportunities. In particular, younger individuals
have been shown to have higher degrees of risk tolerance than older individuals, and thus may be
better able to tolerate the risk associated with fast transition to entrepreneurial activity (Kihlstrom
and Laffont (1979b); Miller (1984b); Levesque and Minniti (2006)). Likewise, young individuals
may have less constraints in the form of family or looming retirement needs, and may therefore
3

have sufficient flexibility to quickly respond to changes in economic opportunities. Finally, younger
individuals, being at the early stage of their career, may have less attractive outside options, which
may enhance their flexibility to respond to local economic opportunities when they arise.
Interestingly, we find that entrepreneurs who respond to local economic shock are significantly
younger than the average entrepreneurs in the economy. Specifically, while roughly 40% of the new
entrepreneurs in Brazil are less than 30 years old, we find this to be the case for more than 60% of
the entrepreneurs responding to the demand shock. This is again consistent with the notion that
the ability to rapidly respond to new local opportunities requires a degree of flexibility and risk
tolerance that is uniquely possessed by the young.
While the results so far suggest that lifecycle considerations are important, it turns out that
being young in itself is insufficient to explain entrepreneurial response. We find that among the
young, those who have acquired certain skills through previous employment and education are more
responsive to local opportunities. For example, it is those individuals who have the most industry
experience, those that are more educated, and those that have worked in managerial occupations
who are most responsive to these new economic opportunities.
Specifically, following Muendler et al. (2004), we classify individuals into generalists and spe-
cialists according to their previous occupation, where the formers are those working in occupations
that require multiple abilities and involve leadership, monitoring, and supervisory tasks. We find
that within the young population, individuals in the generalist category are highly responsive to
aggregate shocks, relative to specialists. In contrast, older individuals with generalist skills do not
respond to these local opportunities. In addition, we follow Autor et al. (2003) and use the occupa-
tional data to identify occupations that are non-routine and require cognitive skills, which involve
tasks that demand creativity, generalized problem-solving, and complex communications, such as
selling, managing, and legal writing, among others. We find that young individuals who worked on
cognitive non-routine tasks are significantly more responsive. Again, we find that older individuals
who work in occupations that require high cognitive skills do not respond to the local shock. Finally,
we also find that among the young, more educated individuals are more responsive to local shocks
4

by forming new firms.
Next, we compare the skills of the entrepreneurs who respond to local demand shocks with
the skills of the average entrepreneur in the population. Focusing on young individuals, we find
that the average young entrepreneur has relatively similar levels of skills when compared to the
average in the population, measured by the generalist measure, cognitive non-routine occupations
and past experience. However, these skill traits are much more pronounced among the responsive
entrepreneurs who form businesses when local opportunities arise.
In sum, we find that entrepreneurial responsiveness to local economic opportunities is concen-
trated among the young and the skilled. These findings are consistent with various theories that
argue that entrepreneurship requires a variety of general business and managerial skills (Evans and
Leighton (1989); Lazear (2005)).
Our finding that both age and skill matter for the individual-level decision whether to become
an entrepreneur when local opportunities arise, suggest that several characteristics of the local
economy may affect its entrepreneurial responsiveness. First, since the ability to create new firms
hinges on access to finance (Evans and Jovanovic (1989); Hurst and Lusardi (2004)), and since young
individuals have less time to accumulate wealth, we posit that in municipalities with better access
to finance, we are likely to find an even stronger entrepreneurial response of the young. Moreover,
Lucas (1988) and Gennaioli et al. (2012) argue that the presence of other skilled individuals generates
human capital externalities making it easier for potential entrepreneurs to learn how to start a
business, suggesting that given the importance of skill, the overall stock of entrepreneurial knowledge
might impact the firm creation response. Finally, given the importance of life-cycle considerations,
younger demographics may lead to a stronger entrepreneurial responsiveness. In fact, younger age
demographics may also lead to a potential indirect effects, as suggested by Liang et al. (2014).
Specifically, older populations may make it more difficult for younger individuals to move up the
job ladder and thereby acquire the requisite skills for entrepreneurship. This suggests that younger
individuals would generally be less responsive in economies with older populations.
We find suggestive support for all of these three hypotheses using cross-municipality regressions.
5

Younger individuals are indeed more responsive in municipalities with better access to finance, as
proxied for by the number of banks or total value of credit to small businesses measured at the
beginning of the sample. Moreover, younger individuals are also more responsive in municipalities
where the population is endowed with more generalist and managerial skills and more entrepreneurs,
consistent with human capital externalities. Finally, we find that individuals do take longer to
acquire generalist and managerial skills in municipalities with older demographics. In line with
this finding, we document that young individuals are more responsive to local opportunities in
municipalities with younger demographics.
Our work relates to several strands of literature. First, as mentioned above, a variety of macroe-
conomic studies have emphasized the crucial role that new firm creation plays in the amplification
and propagation of aggregate economic shocks.3 We contribute to these studies by investigating the
characteristics of the entrepreneurs who respond to local demand shocks by creating new firms. Our
micro-level evidence highlights the importance of individual level heterogeneity, suggesting that the
demographic characteristics of the local population, may affect the entrepreneurial responsiveness
of economy to economic fluctuations.
Second, our paper contributes to a long-lasting literature on the nature and characteristics
of entrepreneurs.4 In particular, little is known about the specific individuals who select into
entrepreneurship in response to changes in local opportunities. Using rich individual-level data,
we illustrate that these entrepreneurs are substantively different when compared to the average
new entrepreneur in the population. Our evidence also highlights the importance of both life-cycle
3General equilibrium models of monopolistic competition linking firm entry and exit to aggregate fluctuationsindicate the presence of various channels. Devereux et al. (1996), Chatterjee and Cooper (2014), and Bilbiie et al.(2012) are examples of models where entry of new firms generates greater product variety, while in Jaimovich andFloetotto (2008) entry works through increased competition and lower markups. In related recent work, Clementiand Palazzo (2016) argue that increases in firm entry in response to aggregate shocks lead to large and persistentexpansions because of lifecycle considerations. Sedlácek (2014) suggest the lack of startups during a downturn canlead to persistent employment declines in the economy, and Sedlacek et al. (2017) show that firm heterogeneity,and particularly the presence of high-growth startups, are key for aggregate gains. Several empirical studies furtherhighlight how new and young firms act as important sources of job creation and employment (Haltiwanger et al.(2013b); Pugsley and Sahin (2015)). In particular, Adelino et al. (2017) use US Census micro-data and regionalvariation in investment opportunities through Bartik shocks to show that it is the young and new firms that createthe most jobs in response to positive local demand shocks.
4See, for example, Kihlstrom and Laffont 1979b; Blanchflower and Oswald 1998; Hamilton 2000; Moskowitz andVissing-Jorgensen 2002; Hurst and Lusardi 2004; Hombert, Schoar, Sraer and Thesmar 2014, and Humphries, 2016.
6

considerations and skill as important drivers of entrepreneurial dynamics.
Finally, our paper relates to a growing strand of literature that seeks to understand how de-
mographic changes affect macroeconomic patterns and labor market dynamics.5 One of the most
profound demographic transitions of the past 50 years has been towards aging populations. This
trend is widespread, stemming from both declines in fertility rates and increased longevity. Our
findings that young individuals are more responsive to local opportunities when they arise suggest
that this trend may impact the entrepreneurial responsiveness of the economy. In that regard, our
paper is also related to Kopecky (2017), who explore the relationship between aging populations
and entrepreneurship across and within countries.
The remainder of the paper proceeds as follows. Section 2 describes the various data sources
used in the analysis, while Section 3 describes the empirical strategy that combines local histori-
cal endowment of agricultural production with current movements of global crops prices. Section
4 presents municipality-level aggregate results, and Section 5 describes the individual-level anal-
ysis and reports the key results of the paper. Finally, section 6 builds on our main findings and
tests several theories that suggest that characteristics of local economies may affect entrepreneurial
responsiveness. We test these theories using cross-municipality differences. Section 7 concludes.
II. Data
In this section we discuss the main datasets used in our analysis. We start by describing the RAIS
dataset, which provides matched employer-employee information on all employees in the formal
sector in Brazil. We supplement this data with aggregate municipality-level data on loans and firm
credit. We further employ data on municipal agricultural crop endowments in Brazil, as well as
data on global commodity prices.
5For example, see Jaimovich and Siu (2009); Jones (2010); Backus et al. (2014); Gagnon et al. (2016); Engbom(2017).
7

A. Employer-Employee Data
The RAIS database (Relacao Anual de Informacoes Sociais) is an administrative database from the
Brazilian Ministry of Labor (MTE) which provides individual level data on the universe of formal
sector employees in Brazil. RAIS is widely considered a high quality Census of the Brazilian formal
labor market (Dix-Carneiro (2014)). The database, created in 1976, is used by several Brazilian
government agencies (such as the Brazilian Central Bank) to generate statistics for the Brazilian
economy. The RAIS database also forms the basis for national unemployment insurance payments
and other worker benefits programs. As a result, ensuring the accuracy of the information is in
the interest of both firms (who would otherwise be subject to monetary fines) and individuals (who
want to be eligible to receive government benefits), as well as the central government.
RAIS contains information on the firm and the establishment of each employee, including tax
identifiers, locations, industry, and legal status. At the individual level, RAIS includes employee-
specific identifiers, called PIS, which allow individuals to be tracked over time and across firms
(as well as across establishments of the same firm).6 Similar to other employer-employee matched
data, for each employee we observe payroll, tenure in the firm, and hiring and firing dates. RAIS
additionally has rich personal data on gender, nationality, age and education, as well as a few
less commonly available variables such as hours worked, reasons for hiring and firing, and contract
details. Finally, each employee is assigned to an occupational category specific to her current job.
There are more than 2,000 such categories, which follow the detailed Brazilian’s classification of
jobs (Classificacao Brasileira de Ocupacoes - CBO) that is similar to the International Standard
Classification of Occupations (ISCO-88).
Using data on occupations, we are able to identify individuals that are managers or CEOs of a
firm, as well as lower ranked workers, both blue collar and white collar. Following standard practice
in the entrepreneurship literature (e.g. Kerr et al. (2015); Babina (2015)), we define an entrepreneur
as the CEO or the top paid manager of a new firm in the year of birth. Specifically, if no worker is
6Individuals with multiple jobs in a given year therefore appear multiple times. Following standard practice inthe literature (Menezes-Filho, Muendler and Ramey, 2008), we keep only the highest paying job of the individual ina given year. If there are two or more such “highest paying” jobs, we break ties by keeping the earlier job.
8

classified as CEO or manager, we use the highest paid worker in the firm.7
Furthermore, the detailed data on occupations allow us to classify workers based on skills.
Following Muendler et al. (2004), we classify individuals into generalists, i.e. those working in oc-
cupations that require multiple abilities and that involve leadership, monitoring, and supervisory
tasks, and specialists, i.e. those working on specialized tasks and occupations. Additionally, follow-
ing Autor et al. (2003) and Gathmann and Schönberg (2010), we distinguish between workers who
perform different types of tasks. Non-routine cognitive tasks require creativity and problem-solving
ability, as well as negotiation and coordination skills. Non-routine manual tasks require physical
work together with the ability to adapt to different situations. Finally, routine tasks are all other
tasks based on well-specified processes and activities.
We focus on individuals that are within the ages of 18 and 65 and who have wage data for
at least 3 years, during the 1998-2014 period. We restrict our focus to this time period due to
the availability of information on agricultural resources at the municipality level. Under these
restrictions, the sample includes roughly 69 million individuals.8
In Panel A of Table 1, we provide summary information on the relative importance of Brazilian
industries. The two largest industries in the economy are the non-tradable and services sectors,
which capture 54% and 20% of the annual number of firms, and 27% and 20% of annual employment
respectively. Panel A also documents the annual creation of new firms across industries, with most
new firms being created in the non-tradable and services sectors.
In the empirical analysis, we focus on municipalities as the local economic unit and explore
how municipalities respond to plausibly exogenous economic shocks triggered by fluctuations in
global commodity prices. Panel B of Table 1 provides municipality level summary statistics. The
average municipality in the sample has a population of 24,122 and the GDP per capita is 3,093
(USD 2000).9 In our sample period, there is an average (median) of 237 (47) firms and an average7Our results are robust to various definitions of “entrepreneur.”8In the municipality-level analysis, we aggregate data using all individuals in this sample. When we move to the
individual-level analysis, for computational reasons, we extract a random sample of 5% of all individuals on whichwe perform the analysis.
9All summary statistics on the municipalities are computed using the full aggregate municipality-level panel datafrom 1998 to 2014.
9

(median) total number of formal private sector employees of 3,143 (342) per municipality, with
significant dispersion in size across regions. The average (median) number of new businesses created
in a given municipality in a given year is 32 (7). Once again, there is significant heterogeneity across
municipalities. The RAIS data allow us to explore the characteristics of the newly created firms in
the economy. In Panel C of Table 1 we find that on average, a newly created firm survives 6.8 years
(median is 5) and, conditional on survivorship, employs 14 workers two years after its birth and 18
workers after five years.
Panel D of Table 1 provides summary statistics for all individual formal sector employees in
our sample, excluding the set of entrepreneurs. On average, 61% percent of the workers are male.
Workers have an average of 11.45 years of education and the median level of education is high
school (12 years). Based on the occupational status of the workers, we find that most workers can
be characterized as either Blue Collar (48%) or White Collar (41.6%), while only a small fraction
consists of Managers and CEOs (3.6%).1011 Finally, when we classify individuals according to their
previous occupation into generalists and specialists, we find that 19.3% of the workers are in a job
which entails a generalist skill set.
In Panel E of Table 1, we provide summary statistics on the the population of entrepreneurs
in our sample. We find that, compared to the overall population, entrepreneurs are relatively
more likely to be female and to have a higher educational level, with 12.11 years of education on
average.The distribution is also skewed towards higher hierarchical jobs in their place of employment
immediately preceding the founding a new firm, with 40.2% in Blue Collar positions, 50% in White
Collar position , and 4.5% serving as Managers or CEOs.
10We do not observe occupational status for the remaining workers in the data.11We match the CBO classification to the International Standard Classification of Occupations (ISCO-88) using
the procedure outlined in Muendler et al. (2004). This correspondence allows us to categorize workers into fourorganizational layers, following a framework close to Caliendo and Rossi-Hansberg (2012). From bottom to top layersthey are: Blue Collar, White Collar, Managers, CEOs. Please see Colonnelli and Prem (2017) for more details onthe data construction.
10

B. Loans and Banking Sector
We supplement the RAIS data with municipal level data on the number and dollar amount of all
loans to local businesses, as well as information on the location of bank branches in Brazil. These
data are obtained from the Brazilian Central Bank datasets (Banco Central do Brasil, BCB). We also
obtain confidential loan-level data from the BNDES, which represents the second largest national
development bank in the world (after the Chinese Development Bank), and is a major lender of
Brazilian companies. BNDES provides a significant share of long-term bank lending in Brazil and
is amongst the largest sources of investment in industry and infrastructure (Colby, 2012). For each
loan, we have information on the loan amount, the interest rate (and type), and tax identifier of
the firm receiving the loan.
Panel B of Table 1 reports summary statistics on the financial characteristics of municipalities.
We report information on both total volume of credit from private banks and the BNDES, expressed
in millions of USD 2000, and total number of BNDES government loans. The data shows significant
variation across municipalities, with an average of 20.794 millions USD going to local business from
private financial institutions (median is 4.129), and an average of additional 2.75 millions USD
coming from the BNDES (median is 0.228).
C. Agricultural Crops in Brazil
The Brazilian economy relies heavily on agriculture. For example, Brazil is among the largest pro-
ducers in the world of coffee, sugarcanes, orange juice, soybean, corn and ethanol. These crops,
and others, provide the basis for the large agribusiness industry in Brazil, which represents 22% of
Brazil’s GDP, a third of its employment, and almost 40% of its export (PwC (2013)). The agribusi-
ness industry captures not only farming production, but also the supply of farming inputs such as
machinery and seeds, as well as the selling and marketing of farm products, such as warehouses,
wholesalers, processors, and retailers.
The empirical strategy in this paper relies on local demand shocks caused by fluctuations in
11

the profitability of the local agricultural sector driven by global commodity prices. We obtain
information on agricultural crops from the Brazilian Institute of Geography and Statistics (IBGE),
which is responsible for the Brazilian census as well as most of the statistical analyses of the Brazilian
economy. The data provides the annual production of all 66 different agricultural crops, at the
municipality level, for the period 1993-2014. We standardize the different crops to the same unit
measure (i.e., tons) to construct a panel dataset of the universe of agricultural crops production by
Brazilian municipalities.
Panel B of Table 1 illustrates that the average aggregate dollar value of local crops in a mu-
nicipality is equal to approximately 89% of local GDP, with the median equal to 12.6% of local
GDP. Similarly, the value of local crops per capita is on average $2,926. Figure 1 illustrates the
wide spatial distribution of agricultural resources across municipalities. Municipalities are divided
into quintiles based on the production value of natural resources relative to GDP in 2000. The
bottom quintile have production values of roughly 1% to 5% of municipality GDP. In contrast, in
the top quintile, municipalities have production values worth more than 45% of local GDP. The
figure illustrates significant heterogeneity across municipalities. In fact, the heterogeneity across
municipalities is even wider, given that different municipalities specialize in different portfolios of
agricultural products, but this is not reflected in the figure.
International commodity prices are obtained from the Global Economic Monitor (GEM) Com-
modities database of the World Bank. We focus on the period 1998-2014. For each crop, we create
a yearly measure of commodity prices starting in 1998 by taking the average price within the year.
In some cases, there may be a single price that matches to multiple crops. For example, the price
of tea is assigned to both “indian tea” and “yerba mate.” Hence, we consolidate several agricultural
crops to match prices. We standardize all units of measure to US dollars per ton. In the final
dataset, we have 17 different commodities present in Brazil which are traded on the international
commodity markets. The detailed distribution of these agricultural crops across municipalities is
provided in Table A.1 of the Appendix.
12

III. Empirical Strategy
Given our focus on the entrepreneurial response to new local opportunities generated by fluctuations
in local income, we will focus specifically on new firm creation in the non-tradable sector, which is
especially dependent on local demand. This approach is similar to Adelino et al. (2017), who show
that job creation by new firms accounts for the bulk of new non-tradable employment in response to
local demand shocks.12 In this paper, we seek to understand the defining characteristics of the actual
individuals who are responsible for the creation of these new firms when such local opportunities
arise. Simply running regressions of new firm creation on local income, however, is confounded
by reverse causality concerns. In particular, unobserved shocks to the investment opportunities of
particular sets of individuals could mechanically impact local income. For example, the introduction
of local government programs providing start-up incentives to the young would likely increase both
the firm creation rate of the young as well as local income. To the extent that such programs are
unobserved by the econometrician, regressions of firm creation on local income would reflect this
reverse causality.
To address this issue, we create a measure that isolates plausibly exogenous changes in munici-
pality level local income over time. To do so, we identify fluctuations in the value of locally produced
agricultural commodity crops, and thus also in the profitability of the local agricultural sector, by
interacting the local agricultural endowment with movements in global commodity prices. Such com-
modity price fluctuations are an important source of economic variability for emerging economies,
as well as for developed economies rich with natural resources (Fernandez et al. (2017), Allcott and
Keniston (2017)). Moreover, as shown by Allcott and Keniston (2017) in the context of US oil and
gas booms and by Benguria et al. (2018) in the context of Brazil, such shocks do appear to increase
local demand due to higher levels of local income, leading to an increased employment in the local
non-tradable sector.
The agribusiness sector in Brazil is large, highly developed, and highly diversified. Different12Adelino et al. (2017) do not measure local demand shocks in the same way as we do, but instead identifying
fluctuations in local income using the shift-share approach of Bartik (1991) and Blanchard and Katz (1992), whichinteracts local manufacturing shares with national trends in manufacturing.
13

municipalities are endowed with different types of agricultural crops that they can grow locally.
We calculate the local value of a crop in a given year as the product of the local crop quantity
(Q) with its unit price (P) in international commodity markets. While international prices are
exogenous to current municipality-specific economic conditions, quantities are less likely to be so.
We therefore hold endowments fixed at their 1998 level, prior to the start of our sample period, so
as to remove the endogenous component in the fluctuations of commodity values. We construct a
proxy for the 1998 local endowment by averaging production quantities in the five years preceding
the beginning of our analysis sample, i.e. between 1993-1997. Using this approach circumvents
potential endogeneity concerns because historical production is likely to capture the (exogenous)
spatial endowments of agricultural crops, rather than potentially endogenous production activity,
which may correlate with unobserved local shocks. This approach is standard in the literature
(see, for example, Dube and Vargas (2013)). These historical endowments of agricultural crops are
persistent due to the accumulation of local expertise and economic activity over long periods of
time, and because of the physical characteristics of the regions such as climate and soil.
Specifically, let Qkj,98 be our proxy for the regional endowment of crop k in municipality j in
1998, measured by the average production in the past 5 years. Let Pkt be the international price
of crop k in year t. Thus, the annual Crops Index (CI) for municipality j in year t is the sum over
all crops of local agricultural endowments, multiplied by the respective time-varying international
prices:
CIjt =X
k
Qkj,98 ⇤ Pkt
Variations in this municipality-level measure allow us to approximate the ideal natural experiment
where we randomly shock local income over time. The endowment part of the formula generates
cross-sectional variation in the pre-existing exposure of different municipalities to different agri-
cultural resources. International commodity price fluctuations generate time-series variation that
is plausibly independent of shocks to local investment opportunities. Together, they provide a
municipality-year varying series of exogenous demand shocks generated by the differential exposure
14

of different Brazilian municipalities to the changing global value of agricultural commodities.
Our empirical strategy is inspired by the shift-share approach of Bartik (1991) and Blanchard
and Katz (1992), which interacts local manufacturing shares with national trends in manufacturing
employment to identify local income and demand shocks.13 The primary identification concern with
this approach is that unobserved municipality level shocks in Brazil could impact global commod-
ity prices, biasing the results. For example, one such concern is that local government programs
designed to incentivize new firm creation might also lead to increased local agricultural output,
driving down international prices. We address this and other concerns later in the text.
Figure 2 illustrates the variation we observe in the value of municipal endowments of crops, as
captured by the annual Crops Index. Specifically, in Figure 2 we plot the residual value of crops in
a municipality after removing municipality and year fixed effects. The thin grey lines provide the
time series of these residuals for a 10% random sample of municipalities in our sample. The lines are
median (solid line), 10th and 90th percentiles (dashed lines) of the distribution of residuals in each
year. As the figure illustrates, there is both significant cross-sectional variation within a given year
and considerable time variation within a given municipality in the value of agriculture commodities.
In what follows, we examine the impact of local endowment largest shocks in the 10th percentile
relative to the municipality mean. Specifically, let Zjt be equal to one if the local agricultural
endowment in municipality j is in the top 10th percentile change in the price distribution in year
t relative to the municipality mean, and equal to zero otherwise. We consider municipality j
to be “treated” in year t if Zjt = 1. As we discuss below, the choice of a binary shock allows
us to transparently estimate the characteristics of the individuals who create new (non-tradable)
businesses in response to local demand shocks. This choice does not affect the interpretation of our
findings, as the results hold when using the binary or the continuous measure of the shock. We
further discuss this and other robustness checks below.
13This strategy has been widely adopted by the economics literature. See, for instance, Gallin (2004), Saks andWozniak (2011), Charles et al. (2013), Diamond (2016), and Adelino et al. (2017).
15

IV. Municipality-Level Analysis
We start by estimating the impact of global commodity price fluctuations on municipality level
economic activity. As discussed above, our strategy interacts this time-series variation with cross-
sectional differences in municipal endowments of agricultural crops; that is, we use municipality-year
level variation in the Crops Index as a source of plausibly exogenous fluctuations in local income and
demand. Our main specifications use the binary version of the shock, described earlier. Specifically
we estimate the following model:
Yjt = ↵j + �Zjt + �Xjt + ujt
where Yjt is the outcome of interest, ↵j are municipality fixed effects, Zjt is the binary shock of
largest 10th percentile change in Crops Index, and Xjt is a set of controls that includes year dummies
and the log-population. In the Appendix we illustrate that our results hold for continuous and other
definitions of the shock.
A. Local Employment and Firm Creation
The main results are presented in Table 2. We find that positive shocks to the value of local
crops generate both higher income and higher employment in the treated municipalities. Treated
municipalities experience a highly significant increase of 4.1% in the level of formal employment
(column 1) and a highly significant increase of 2.9% in total local income, as measured across all
local firms. This increase in total local income is driven primarily by higher employment levels
rather than higher wages.
Higher levels of local income suggest new profit opportunities available to be exploited by po-
tential entrepreneurs, particularly in those sectors which are highly dependent on local demand
conditions. We see that the commodity price shock does indeed lead to an increase in the total
number of local firms. As reported in column 3 of Table 2, there is a statistically significant increase
of 3.7% in the number of local firms following the shock. Importantly for our purposes, this increase
16

is primarily driven by the creation of new firms (column 4), which increases by 2.6%, rather than a
higher likelihood of survival of existing firms, which instead seems unaffected given the small and
statistically insignificant -0.004 effect on firm closures (column 5).
Table 3 illustrates the impact of the shock by economic sector, which we categorize using the
Brazilian CNAE industry codes into Agriculture and Mining (columns 1), Manufacturing (columns
2), Non-tradable (columns 3), and Services (columns 4). Panel A focuses on employment, and
shows a statistically significant increase in employment levels in all but the Services sector. As
illustrated in column 1, this finding is consistent with rising commodity prices having a positive
direct effect (8.4%) on the sectors responsible for the production of these commodities (Agriculture
and Mining). Moreover, there seem to be a positive spillover effects on other industries that are
potentially connected through various linkages or tied to local demand, as illustrated in columns
2 and 3. When studying the aggregate sectoral impact on number of firms, in Panel B, we find
that the vast majority of new firm creation is accounted for by firms in the non-tradable sector
(column 3), where we observe a highly statistically significant increase of 5.5%, compared to small
and statistically insignificant effects on other sectors.
Our aggregate results emphasize the importance of entrepreneurship for the dynamics of local
economic activity. Our findings that local income shock lead to a significant entrepreneurial response
in the non-tradable sector is consistent with Adelino et al. (2017) who study the US. These results
provide a preliminary step towards our main analysis in which we study the entrepreneurs who
account for the firm creation response to the local demand shock.
We next ask whether the creation of economic activity we observe in the non-tradable is econom-
ically relevant. A potential concern is that new firms created in the non-tradable sector in response
to the local demand shock may be short-lived or may not contribute to significant employment
creation in the long-run, relative to the average firms created. We explore these concerns in Table
4. Using firm-level data, and focusing only on firm entry, we estimate specifications where we use as
dependent variables indicators for whether a new firm survives for at least 3 and 5 years (columns 1
and 2, respectively), and indicators for whether a new firm has at least 3 or 5 employees five years
17

after creation (columns 3 and 4, respectively).
We find that, if anything, firms created in response to the positive local demand shocks are
significantly more likely to survive both after 3 and 5 years and that, conditional on survival after
5 years, these firms are likely to be larger when compared to the lifecycle of the average new firm.
While survivorship and size are just proxies for firm success, these results suggest that new firms
who respond to local demand shocks are an important and persistent propagation mechanism. We
further corroborate these results in column 5 of Table 4, where we find that newly created firms
are also more likely to be incorporated, which can be viewed as an ex-ante proxy for future growth
plans of the businesses created (Levine and Rubinstein (2017)). These findings are consistent with
Sedláček and Sterk (2017) who find that the success of firms is strongly influenced by aggregate
conditions at the time of their entry.
B. Robustness and Additional Results
In this subsection, we further describe additional tests to probe the robustness of our results and
provide further characterization of the main aggregate effects. All the results are reported in the
Appendix.
Alternative Treatment Definitions
First, Table A.2 reports the main estimation results when we vary our designation of what constitutes
a treated municipality, as one may be worried that the choice of a top 10% binary shock is arbitrary.
We find that all of the main findings continue to hold, when we focus on more moderate local
endowment shocks defined as being in the top 25th percentile relative to the municipality mean
(second row).
As further robustness, we also find statistically significant negative effects on local economic
outcomes when we instead look at negative endowment shocks. In particular, as reported in the
third row of Table A.2, when defining a negative endowment shock to be in the bottom 10% relative
to the municipality mean, we find a 5.9% decline in local employment and 4.9% decline in local
18

total income. The number of firms falls by 4.0%, driven again by a decline in firm entry instead of
increased closures of existing firms. We find very similar findings if we define a negative endowment
shock to be in the bottom 25% relative to the municipality mean. These results are reported in row
4 of Table A.2.
Finally, all of our results are robust to using a continuous log version of the shock (fifth row),
which estimates the the elasticity of new firm creation and other outcomes to the value of the local
agriculture endowment. For example, 10% increase in the value of the local endowment is associated
with a 1.54% increase in employment and a 0.68% increase in the inflow of new firms. All estimated
effects are highly significant, except for the small and insignificant effects on firm closures.
Influencing Global Commodity Prices
The key endogeneity concern with our approach is that the local agricultural sector is sufficiently
large relative to global production so as to potentially influence international prices. If this were
true, then unobserved municipality level shocks impacting local firm creation, such as government
incentive schemes, might also impact global commodity prices and thus bias the results. Indeed,
Brazil is a leading global player in the production of crops, accounting for more than 10% of world’s
exports for some of them (e.g., sugar cane, coffee, soybeans, yerba mate, tobacco).
Of course, it is important to note that our empirical strategy relies on within-country variation
in the value of agricultural endowments, and therefore the concern is only be valid to the extent that
single municipalities can influence global prices. Regardless, to test the robustness of our results, we
re-estimate the main specifications dropping those municipalities with high levels of production of
specific crops.In particular, we complement our municipality-level data with data from the United
Nations Food and Agriculture Organization (FAO) to compute the share of world production of
each specific crop accounted for by Brazilian municipalities. Panel A of Table A.3 reports the
results after dropping 42 municipalities that have ever produced, in any given year, 1% or more of
the world production of any commodity in the period 1996-2015, while Panel B reports even more
conservative results, obtained after dropping the 145 municipalities with at least a 0.5% share. The
19
results remain unaffected in both cases.
Persistence of Treatment Effects
Finally, we explore the persistence of the effects generated by the local endowment shocks. As we
may expect, new firm creation, and economic activity more generally, respond gradually to changes
in local opportunities. Table A.4 reports our main results for different lagged definitions of the
binary treatment variable. While the response is strongest in the year of the shock (especially for
new firms), we find that local economic activity continues to positively respond one to four years
after the commodity endowment shocks, and gradually decreasing.
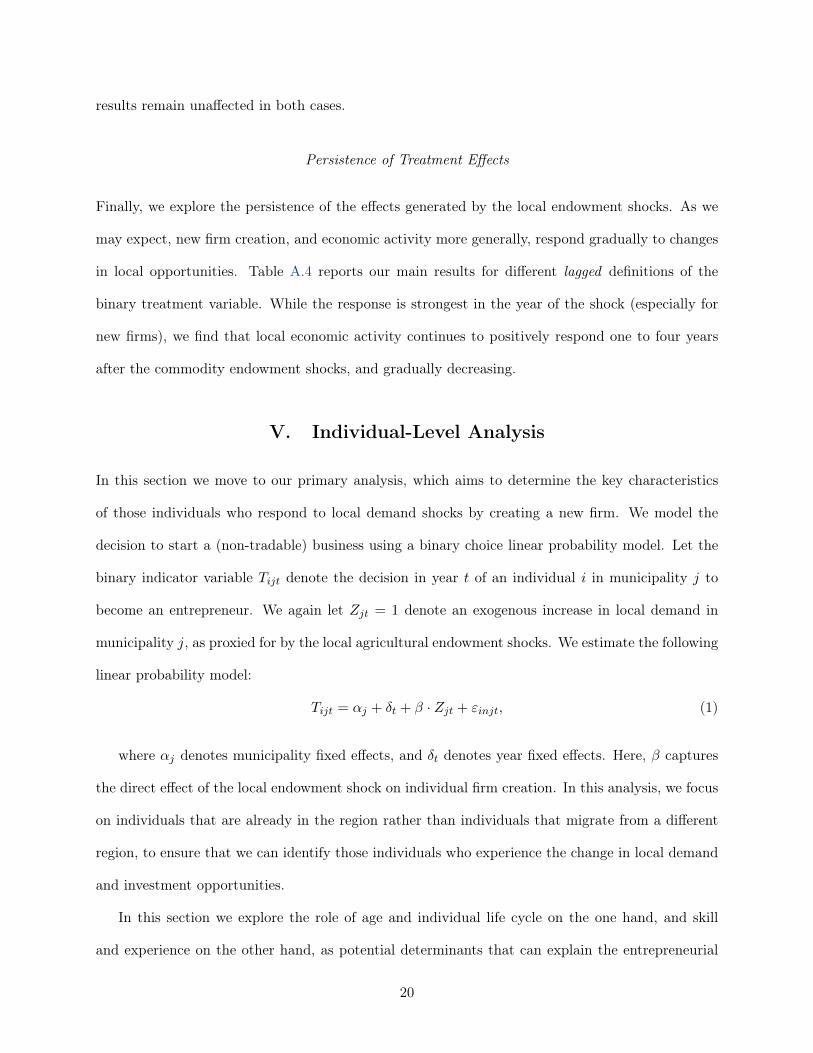
V. Individual-Level Analysis
In this section we move to our primary analysis, which aims to determine the key characteristics
of those individuals who respond to local demand shocks by creating a new firm. We model the
decision to start a (non-tradable) business using a binary choice linear probability model. Let the
binary indicator variable Tijt denote the decision in year t of an individual i in municipality j to
become an entrepreneur. We again let Zjt = 1 denote an exogenous increase in local demand in
municipality j, as proxied for by the local agricultural endowment shocks. We estimate the following
linear probability model:
Tijt = ↵j + �t + � · Zjt + "injt, (1)
where ↵j denotes municipality fixed effects, and �t denotes year fixed effects. Here, � captures
the direct effect of the local endowment shock on individual firm creation. In this analysis, we focus
on individuals that are already in the region rather than individuals that migrate from a different
region, to ensure that we can identify those individuals who experience the change in local demand
and investment opportunities.
In this section we explore the role of age and individual life cycle on the one hand, and skill
and experience on the other hand, as potential determinants that can explain the entrepreneurial
20

responsiveness of individuals to local opportunities.
A. The Importance of Lifecycle Considerations
What determines the entrepreneurial response to aggregate shocks? According to standard models
such as Lucas (1978), ability is the relevant dimension along which individuals sort into entrepreneur-
ship. In this type of model, to the extent that ability is an innate characteristics, the age profile of
the population does not matter per se. Other theories, however, would predict that age does play
a prominent role in the decision to start a business in response to changes in local opportunities.14
On the one hand, if ability reflects skills accumulated over time as individuals move up in
their career, and such skills are necessary to take advantage of changes in local opportunities, it
is reasonable to expect that individual responsiveness to aggregate shocks would increase with age
(Lazear, 2005; Evans and Leighton, 1989). Similarly, to the extent that downpayment and financing
constraints affect the ability to start a new business, older individuals again may be more responsive
to new opportunities, having had more time to develop the necessary personal wealth (Quadrini,
1999). On the other hand, young individuals may be the most responsive if, for example, they have
a greater tolerance for risk, limited outside options, or an overall higher degree of flexibility in their
personal circumstances.15 Ultimately, the extent to which any of these forces matter, and their
relatives magnitudes, is an empirical question.
Relying on the econometric framework outlined in the previous section, we take this question to
the data by investigating the heterogeneous response of different types of individuals to our specific
local demand shocks. We center our analysis in this sub-section squarely around the role of age.
Figure 3 reports the increase in entrepreneurial rates in response to the shock, estimated according
to model (1) for different age quartiles. The results clearly illustrate that it is young individuals,
those in the bottom quartile of the age distribution, who significantly respond to the shock. The
likelihood of becoming an entrepreneur increases by 0.45 (out of 1000) under a positive shock. The14See Parker (2018) for a comprehensive review.15See, for example, Miller 1984a; Reynolds and White 1997; Levesque and Minniti 2006; Delmar and Davidsson
2000; Arenius and Minniti 2005; Rotefoss and Kolvereid 2005; Wagner 2006; Bergmann and Sternberg 2007; Uusitalo2001.
21

increase becomes statistically insignificant and close to zero for individuals in the remaining quartiles
of the age distribution. These findings are consistent with lifecycle considerations playing a key role
in the individual entrepreneurial response.
We refine this analysis in Table 5, in which we show that the impact of age on the firm creation
response is robust to the inclusion of a variety of other demographic characteristics. Column (1)
shows the simple entrepreneurial responsiveness to the shock, controlling only for year and munici-
pality fixed effects. As the table reports, the shock leads to an increase of 0.179 (out of a 1000) in the
probability of becoming an entrepreneur. This reflects a 6.2% increase in entrepreneurial activity
in response to the shock when compared to the average flow of entrepreneurs in the economy (2.89
out of a 1000). In column (2), we interact municipality fixed effects with dummies for whether indi-
viduals are at the bottom quartile of the age distribution. This specification therefore accounts for
municipality level heterogeneity in the age composition, and yet the main effect remains unchanged.
In column (3), we add an interaction term between the treatment variable and the young dummy.
This column relays the same message as Figure 3. This group exhibit a striking 5.7 times larger
responsiveness when compared to the rest of the population.16 Relative to the average flow to en-
trepreneurship in the economy, the shock leads to an increase of 12.5% in the probability to become
an entrepreneur for the young, when compared to the rest of the of the population (0.3632.89 ⇡ 12.5%).
We next show that this result is extremely robust in sign and magnitude to the inclusion of several
other controls, such as sector fixed effects in column 4 (defined as the sector of the newly created
firm), education dummies in column 5, and indicators for whether the individual had a generalist
occupation (column 6) or a white collar one (column 7), in the year before founding the new firm.
We next compare the distributional characteristics of the responsive entrepreneurs to the average
new entrepreneurs in the population. The procedure for doing this is described in the Appendix.
We find that the average individual who starts a business tends to be younger relative to the overall
population, but that this feature is significantly more pronounced among responsive entrepreneurs.
As Figure 4 illustrates, roughly 40 percent of individuals who start a new business are at the
16Specifically, the magnitude is obtained as: 0.0773+0.3630.0773 ⇡ 5.69
22

bottom quartile of the age distribution, younger than 29 years old. However, more than 60 percent
of entrepreneurs who respond to the demand shocks are at the bottom quartile of age. As Figure
4 illustrates, the entire age distribution of those responsive entrepreneurs is tilted towards younger
demographics, when compared to the average new entrepreneurs in the economy. These results
are consistent with the notion that the ability to respond quickly to new economic opportunities
depends crucially on flexibility and the willingness to take risks, traits that younger individuals are
significantly more likely to possess.
B. Do Skill and Experience Matter?
So far we have illustrated that young individuals are disproportionally more likely to start a busi-
ness in response to local economic shocks. Lifecycle considerations therefore seem important in
understanding entrepreneurial dynamics and shock propagation mechanisms. Do skills also affect
individuals’ entrepreneurial responsiveness to local economic opportunities, as suggested by Evans
and Leighton (1989), Lazear (2004) and many others? We evaluate this question by exploring het-
erogeneity in firm creation within the population of young individuals, focusing on a battery of
proxies for an individual’s skill set.
Table 6, Panel A reports the estimates of the treatment effect for individuals in the bottom
quartile of the age distribution, split according to these observable characteristics. The analysis
shows that skills and wealth are significant determinants of individual responsiveness within the
young (and responsive) entrepreneurs. First, we find that within the young group, individuals who
were previously employed in non-routine and cognitive occupations are significantly more responsive
than others to the rise of local opportunities. The magnitude of the coefficients suggest that the
former group is a staggering 52 times more responsive than the latter (Panel A, columns (1) and
(2)). Similarly, individuals employed in generalist occupations are almost three times as responsive
as those who do not have this type of experience (Panel A, columns (3) and (4)). Furthermore,
columns (5) and (6) of Panel A show that within the young population, responsive entrepreneurs
are also more likely to have at least a high school diploma. All these results are consistent with
23

Lazear (2004) and other empirical studies emphasizing the importance of ability and skills for
entrepreneurial responsiveness.17
Table 7 Panel A reports a similar analysis for other proxies of ability, such as high pay growth
relative to the other workers in the same municipality (Panel A, columns (1) and (2)). Again,
among individuals with above median pay growth, the shock increases the probability of starting a
business by 0.731 in 1000, while it is only 0.202 in 1000 for those with lower relative pay growth.
Similarly, columns (3) to (6) of panel A show that, within the group of young individuals, both
more experienced and wealthier individuals are more likely to respond to shock and create a new
firm. Young individuals with higher than median experience are 2.8 times more responsive than
individuals with lower experience. In terms of accumulated earnings, those in the upper half of the
distribution are 66% more responsive than those in the bottom half.
Strikingly, but conceptually in line with our previous results, the two panels B in Table 6 and
Table 7 show that there is no statistically significant heterogeneous response when we perform the
analogous analysis for the old individuals, i.e. exploring the entrepreneurial responsiveness of skilled
individuals in the top three quartiles of the age distribution.
Finally, as we did with age, we compare the skill characteristics of those (young) individuals who
start a firm in response to the local demand shock with the skill characteristics of the average young
entrepreneur. The results are shown in Figure 5. We first note that the average young entrepreneur
is, in fact, quite similar to the average young individual in the population in terms of skill. While
the average young entrepreneur is slightly better educated, she has similar levels of generalist and
non-routine cognitive skills to the average population, as well as similar levels of recent experience
and pay growth.
In contract, all of these traits are significantly more pronounced among those entrepreneurs who
specifically create new firms in response to the local demand shocks. For example, while only 18% of
the entrepreneurs in the population worked previously in occupations that we classify as non-routine
cognitive, it is the case for almost 50% of the responsive entrepreneurs. Similarly, while roughly
17Examples include Wagner (2006); Djankov et al. (2005); Lazear (2005).
24

20% of entrepreneurs are defined as generalist, responsive entrepreneurs are defined as generalists
in 40% of the cases. Similar findings apply to individuals experience and pay growth. We find
that 85% of the responsive entrepreneurs experience a pay growth above the median, and 70% of
them have more experience than the median. In contrast, among the overall entrepreneurs in the
population these categories apply in only 45% and 50% of the cases, respectively.
In summary, within the young population, responsive entrepreneurs are more likely to be expe-
rienced, wealthy, educated, on a positive pay growth path, and to have generalist and non-routine
cognitive skills. That is, after conditioning on age, skill, and experience all affect entrepreneurial
responsiveness to local opportunities within the young.
C. Robustness and Additional Results
Negative Treatment Effects
As previously discussed for the municipality-level analysis in Table A.2, our results hold also when
we explore alternative treatment definitions, and we also find a decrease in economic activity in
response to declines in global commodity prices. In Table A.5, we further explore the individual
responsiveness to shocks when economic opportunities exogenously decrease. In columns 1 to 3, we
show that the likelihood of becoming an entrepreneur is lower (though not statistically significant)
when the treatment is defined as a shock in the bottom 10th percentile change in the price distri-
bution in year t relative to the municipality mean. Furthermore, in columns 4 to 7 and consistent
with the presence of various constraints limiting the entrepreneurial activity of the young popula-
tion, we find that the young are significantly less responsive to negative economic shocks, as seen in
the coefficients on the interaction term Treatment X Y oung and independently of the addition of
multiple sets of controls. These results illustrate that young individuals are particularly responsive
to changes in local opportunities, both when such opportunities arise and when they disappear.
25

Attrition due to Early Formation of Businesses
An important concern may arise that the results are mechanically driven by compositional changes in
the set of entrepreneurs over time. In particular, one may be worried of attrition. Young individuals
start businesses at a young age, and therefore may not respond to local opportunities by forming a
new businesses as they are already business owner. In the Appendix we provide a robustness test
to address this concern.
We re-define the dependent variable Founder as PreFounder, to be equal to 1 in a given
year if the individual has founded a firm prior to that year and that firm is still operating (and 0
otherwise). In that case we consider individuals who already started businesses as if they respond as
well to changes in local opportunities when they arise, to explore whether such an assumption can
reverse our findings. The results with this modified definition of dependent variable are reported
in Table A.6, and show that both the baseline findings on individual firm creation and the strong
responsiveness of young individuals remain unchanged.
VI. Local Economy Characteristics and Entrepreneurial Response
Our individual level results indicate that within a municipality, the individuals driving firm creation
response are both young and skilled. The concentration of responsive entrepreneurs within this
segment of the population suggests that the characteristics of local economies may have important
implications for their entrepreneurial responsiveness. In this section we discuss three different
theories that may affect the responsiveness of young individuals in the economy. Specifically, we
explore the importance of local financing constraints, local stock of (entrepreneurial) human capital,
and the overall age demographics of the local population. In each case, we provide suggestive
evidence consistent with these theories using cross-municipality regressions, exploiting differences
across localities and exploring the entrepreneurial responsiveness of local young individuals.
We estimate cross-municipality differences in entrepreneurial responsiveness of young individuals
in the following manner. For each municipality we focus on young individuals, those at the bottom
26

quartile of the age distribution in the population. These are the most responsive individuals as
illustrated in Figure 3. We then estimate the entrepreneurial responsiveness of the young for each
municipality j by estimating a municipality level response �j by exploiting the panel aspect of the
data, and estimating the following specification at the individual level:
Tijt = ↵j + �t + �j · Zjt + "ijt, (2)
where i, j, and t stand for individual, municipality and year, respectively. Zjt is the top 10th
percentile shock defined earlier, and Tijt reflects the choice of individual i in municipality j and year
t to become an entrepreneur. Hence �j measures the average new firm creation of young individuals
in response to increases in local economic opportunities for each specific municipality, and ↵j capture
the average entrepreneurial tendency in municipality j. We then regress our estimated municipality
entrepreneurial response, �̂j , on various local characteristics of interest, measured at the beginning
of the sample period, to avoid concerns about reverse causality. We denote these as local factors by
Fj . This yields the following equation:
�̂j = ↵̂j + ✓Fj + �Xj + µj , (3)
where ↵̂j denotes the estimated fixed effects from equation (2), Xj is a set of controls that includes
population and local GDP of municipality j, and µj is the error term. This simple setting allows us to
explore various factors such as financing constraints, local human capital and age demographics, that
may explain cross-municipality differences in the entrepreneurial responsiveness to local economic
shocks.
A. Local Financing Constraints
The ability to create new firms in response to new economic opportunities may hinge on access
to finance (Evans and Jovanovic (1989); Hurst and Lusardi (2004)). Wealth required to satisfy
27

downpayment or collateral demands would likely be needed to form a new business. Given that
young individuals had less time to accumulate wealth, they may be more financially constrained,
and we therefore posit that in municipalities with better access to finance the young should be even
more responsive to local demand shocks when they arise.
To test whether financing constraints increases the entrepreneurial responsiveness of young in-
dividuals across municipalities, we define several proxies Fj for local access to finance. Specifically,
we consider municipalities with higher access to finance as those with a higher number of local
banks, more local bank branches, more government loans, higher total credit to small businesses,
and higher total deposits. Note that all of these proxies are measured at the beginning of our sample
period to mitigate concerns about reverse causality.
The results are reported in Table 8. Across all measures we find that in regions with better
access to finance, there was a stronger entrepreneurial responsiveness to local opportunities among
the young. These results are consistent with the interpretation that local availability to finance
enhances the ability of young individuals, who are more responsive, to start new business and take
advantage of local opportunities.
B. Local Human Capital
While we find that within a municipality the entrepreneurial responsiveness to economic shocks is
driven almost exclusively by the young, age itself is insufficient to account for the firm creation
response. Those most responsive to the shock also tend to be more educated and to have acquired
managerial and generalist skills from previous employment. Given that skill and experience appear
to matter, it is reasonable to think that, due to local knowledge spillovers, the local stock of human
capital and entrepreneurial knowledge might impact the ability of individual entrepreneurs to start
new companies. Such human capital externalities have been documented in a number of different
settings (Acemoglu and Angrist (2000); Iranzo and Peri (2009); Moretti (2004); Rauch (1993)).
Gennaioli et al. (2012) formalize this logic in the context of entrepreneurship using what they call a
Lucas-Lucas model, combining the Lucas (1978) model of entrepreneurship with the Lucas (1988)
28

model of human capital externalities. Using regional data from 100 countries , they provide evidence
that human capital externalities are essential in accounting for regional differences in development.
In our setting, given the presence of local knowledge spillovers and associated human capital
externalities, we would expect young individuals to be more responsive in municipalities with a
greater stock of entrepreneurial knowledge. We proxy for this local stock with a number of different
measures, including the share of individuals in the municipality with generalist skills, the share
of individuals working in white collar, the share of entrepreneurs, and the share of employees in
new firms. All these proxies are based on the first year in our sample to avoid reverse causality
concerns. The results of this analysis are reported in columns (1) to (4) of Table 9. Consistent with
these theories we find that indeed, young individuals exhibit stronger entrepreneurial responsiveness
to economic opportunities, when reside in a local economy with greater stock of entrepreneurial
knowledge and human capital.
C. Local Age Demographics
We finally consider how the overall age structure of the municipality might impact the entrepreneurial
response. This question is particularly salient given that one of the most profound demographic
transitions of the past 50 years has been towards aging populations. This trend is widespread,
stemming from both declines in fertility rates and increased longevity. In Europe, the fertility rate
has been declining since the 1950s and has fallen to an average of 1.6 children per household. At
this rate, each successive generation is expected to be 20% smaller than the previous generation. At
the same time, decreases in mortality have led to increased longevity, leading towards a population
skewed much more towards older individuals. Of all developed countries, the only one with a re-
placement level fertility rate is the United States. Japan has the lowest fertility rate of all developed
countries at 1.3 children per household.
It is clear that, given our previous findings that the entrepreneurial response is concentrated
among the young, an older municipal population would likely directly lead to less new firm creation.
Given the importance of skill in addition to age, however, an older municipal population might also
29

generate additional indirect, equilibrium effects on the entrepreneurial response beyond the direct
effect. As suggested by Liang et al. (2014), in older populations young individuals might have a
more difficult time moving up the job ladder into more generalist and managerial positions. That
is, moving into senior positions takes longer in older populations. To the extent that on-the-job
training and the skills acquired in such high-level positions are important for the ability to take
advantage of new entrepreneurial opportunities, it is possible that individuals would acquire such
necessary skills too late in the lifecycle to take advantage of them by starting a new business in
response to new opportunities. Liang et al. (2014) provide empirical support for this theory using
cross-country data.
We can also test this theory in our setting. Both the direct and indirect effects would suggest that
the entrepreneurial response should be smaller in older populations. The indirect effect, however,
would additionally suggest that even controlling for age, individuals should be less responsive in
older populations. We test this in the data, letting Fj denote the average age of municipality j.
Our results are reported in column (5) of Table 9. Interestingly, we find that young individuals are
more responsive to local economic opportunities when the average age in the population is younger,
consistent with the implications of both the direct and indirect effects.
VII. Conclusion
In this paper we examine the characteristics of the individuals who become entrepreneurs when
local opportunities arise due to an increase in local demand. We use Brazil as our setting, which
allows us to analyze rich individual-level longitudinal data for the entire formal sector. We identify
plausibly exogenous shocks to local demand by interacting municipality level historical production
endowments of agricultural crops with contemporaneous changes in global commodity prices. These
shocks lead to higher local employment and local income, and increased firm entry in the non-
tradable sector.
In our main analysis, we explore the demographic and career characteristics of the individuals
30

leading to the local entrepreneurial response and the creation of new firms. At the individual
level, we find that the entrepreneurial response is almost entirely concentrated among the young,
consistent with the idea that early in the lifecycle individuals experience greater flexibility or risk
tolerance that allows them to to engage in entrepreneurship in response to changes in local economic
opportunities. However, age alone is insufficient to account for the firm creation response. The most
responsive individuals are not only young, but those who also have prior industry experience and
who have acquired relevant managerial and generalist skills from previous employment.
We finally explore heterogeneity in the entrepreneurial response across municipalities. The
entrepreneurial response of the young is larger in municipalities with better access to finance, more
skilled human capital, and with overall younger demographics. These results are consistent with the
predictions of theories highlighting the role of local financing constraints, local knowledge spillovers,
and the endogenous acquisition of skills via on-the-job training. These results further emphasize
how the characteristics of the local population can have a significant impact on the entrepreneurial
responsiveness of the economy.
31

REFERENCES
Acemoglu, Daron and Joshua Angrist, “How large are human-capital externalities? Evidence
from compulsory schooling laws,” NBER macroeconomics annual, 2000, 15, 9–59.
, Song Ma, and David Robinson, “Firm Age, Investment Opportunities, and Job Creation,”
The Journal of Finance, 2017, 72 (3), 999–1038.
Allcott, Hunt and Daniel Keniston, “Dutch disease or agglomeration? The local economic
effects of natural resource booms in modern America,” The Review of Economic Studies, 2017,
85 (2), 695–731.
Arenius, Pia and Maria Minniti, “Perceptual variables and nascent entrepreneurship,” Small
business economics, 2005, 24 (3), 233–247.
Autor, David H, Frank Levy, and Richard J Murnane, “The skill content of recent tech-
nological change: An empirical exploration,” The Quarterly journal of economics, 2003, 118 (4),
1279–1333.
Babina, Tania, “Destructive Creation at Work: How Financial Distress Spurs Entrepreneurship,”
2015.
Backus, David, Thomas Cooley, and Espen Henriksen, “Demography and low-frequency
capital flows,” Journal of International Economics, 2014, 92, S94–S102.
Bartik, Timothy J, “Who benefits from state and local economic development policies?,” 1991.
Basker, Emek and Javier Miranda, “Taken by Storm: Business Financing and Survival in the
Aftermath of Hurricane Katrina,” 2016.
, , and Sergio Urzúa, “The Transmission of Commodity Price Super-Cycles,” Technical
Report, National Bureau of Economic Research 2018.
32

Bergmann, Heiko and Rolf Sternberg, “The changing face of entrepreneurship in Germany,”
Small Business Economics, 2007, 28 (2-3), 205–221.
Bilbiie, Florin O, Fabio Ghironi, and Marc J Melitz, “Endogenous entry, product variety,
and business cycles,” Journal of Political Economy, 2012, 120 (2), 304–345.
Blanchflower, David and Andrew Oswald, “What Makes an Entrepreneur?,” Journal of Labor
Economics, 1998, 16 (1), 26–60.
Caliendo, Lorenzo and Esteban Rossi-Hansberg, “The Impact of Trade on Organization and
Productivity,” The Quarterly Journal of Economics, 2012, 127 (3), 1393–1467.
Chatterjee, Satyajit and Russell Cooper, “Entry and exit, product variety, and the business
cycle,” Economic Inquiry, 2014, 52 (4), 1466–1484.
Clementi, Gian Luca and Berardino Palazzo, “Entry, exit, firm dynamics, and aggregate
fluctuations,” American Economic Journal: Macroeconomics, 2016, 8 (3), 1–41.
Colonnelli, Emanuele and Mounu Prem, “Corruption and Firms: Evidence from Randomized
Audits in Brazil,” 2017. mimeo.
Decker, Ryan A, Meagan McCollum, and Gregory B Upton Jr, “Firm Dynamics and Local
Economic Shocks: Evidence from the Shale Oil and Gas Boom,” Technical Report, Working Paper
2017.
Decker, Ryan, John Haltiwanger, Ron Jarmin, and Javier Miranda, “The secular decline
in business dynamism in the US,” Unpublished draft, University of Maryland, 2014.
Delmar, Frédéric and Per Davidsson, “Where do they come from? Prevalence and character-
istics of nascent entrepreneurs,” Entrepreneurship & regional development, 2000, 12 (1), 1–23.
Devereux, Michael B, Allen C Head, and Beverly J Lapham, “Aggregate fluctuations with
increasing returns to specialization and scale,” Journal of economic dynamics and control, 1996,
20 (4), 627–656.
33

Dix-Carneiro, Rafael, “Trade liberalization and labor market dynamics,” Econometrica, 2014,
pp. 825–885.
Djankov, Simeon, Edward Miguel, Yingyi Qian, Gerard Roland, and Ekaterina Zhu-
ravskaya, “Who are Russia’s entrepreneurs?,” Journal of the European Economic Association,
2005, 3 (2-3), 587–597.
Dube, Oeindrila and Juan F Vargas, “Commodity price shocks and civil conflict: Evidence
from Colombia,” The Review of Economic Studies, 2013, 80 (4), 1384–1421.
Engbom, Niklas, “Firm and Worker Dynamics in an Aging Labor Market,” Technical Report,
Working Paper 2017.
Evans, David S and Boyan Jovanovic, “An estimated model of entrepreneurial choice under
liquidity constraints,” Journal of political economy, 1989, 97 (4), 808–827.
and Linda S Leighton, “Some empirical aspects of entrepreneurship,” The American Economic
Review, 1989, 79 (3), 519–535.
Gagnon, Etienne, Benjamin Kramer Johannsen, and J David Lopez-Salido, “Understand-
ing the New Normal: the role of demographics,” 2016.
Gathmann, Christina and Uta Schönberg, “How general is human capital? A task-based
approach,” Journal of Labor Economics, 2010, 28 (1), 1–49.
Gennaioli, Nicola, Rafael La Porta, Florencio Lopez de Silanes, and Andrei Shleifer,
“Human capital and regional development,” The Quarterly journal of economics, 2012, 128 (1),
105–164.
Haltiwanger, John, Ron S. Jarmin, and Javier Miranda, “Who Creates Jobs? Small versus
Large versus Young,” The Review of Economics and Statistics, 2013, 95 (2), 347–361.
, Ron S Jarmin, and Javier Miranda, “Who creates jobs? Small versus large versus young,”
Review of Economics and Statistics, 2013, 95 (2), 347–361.
34

Hamilton, Barton, “Does Entrepreneurship Pay? An Empirical Analysis of the Returns to Self-
Employment,” Journal of Political Economy, 2000, 108 (3), 604–631.
Hombert, Johan, Antoinette Schoar, David Sraer, and David Thesmar, “Can Unem-
ployment Insurance Spur Entrepreneurial Activity?,” Working Paper 20717, National Bureau of
Economic Research November 2014.
Humphries, John Eric, “The Causes and Consequences of Self-Employment over the Life Cycle,”
Technical Report, Mimeo, University of Chicago 2016.
Hurst, Erik and Annamaria Lusardi, “Liquidity Constraints, Household Wealth, and En-
trepreneurship,” Journal of Political Economy, 2004, 112 (2), 319 347.
Iranzo, Susana and Giovanni Peri, “Schooling externalities, technology, and productivity: The-
ory and evidence from US states,” The Review of Economics and Statistics, 2009, 91 (2), 420–431.
Jaimovich, Nir and Henry E Siu, “The young, the old, and the restless: Demographics and
business cycle volatility,” American Economic Review, 2009, 99 (3), 804–26.
and Max Floetotto, “Firm dynamics, markup variations, and the business cycle,” Journal of
Monetary Economics, 2008, 55 (7), 1238–1252.
Jones, Benjamin F, “Age and great invention,” The Review of Economics and Statistics, 2010, 92
(1), 1–14.
Kerr, Sari, William R Kerr, and Ramana Nanda, “House money and entrepreneurship,”
Technical Report, National Bureau of Economic Research 2015.
Kihlstrom, Richard E. and Jean-Jacques Laffont, “A General Equilibrium Entrepreneurial
Theory of Firm Formation Based on Risk Aversion,” Journal of Political Economy, 1979, 87 (4),
719–748.
Kirzner, Israel M, “Competition and Entrepreneurship,” 1973.
35

, Discovery and the capitalist process, University of Chicago Press, 1985.
Kopecky, Joseph Victor, “An aging dynamo: demographic change and the decline of en-
trepreneurial activity in the United States,” 2017.
Lazear, Edward, “Entrepreneurship,” Journal of Labor Economics, 2005, 23 (4), 649–680.
Lazear, Edward P, “Balanced skills and entrepreneurship,” The American Economic Review,
2004, 94 (2), 208–211.
Levesque, Moren and Maria Minniti, “The effect of aging on entrepreneurial behavior,” Journal
of Business Venturing, 2006, 21 (2), 177–194.
Levine, Ross and Yona Rubinstein, “Smart and illicit: who becomes an entrepreneur and do
they earn more?,” The Quarterly Journal of Economics, 2017, 132 (2), 963–1018.
Liang, James, Hui Wang, and Edward P Lazear, “Demographics and entrepreneurship,”
Technical Report, National Bureau of Economic Research 2014.
Lucas, Robert E., “On the Size Distribution of Business Firms,” The Bell Journal of Economics,
1978, 9 (2), 508–523.
Lucas, Robert E, “On the mechanics of economic development,” Journal of monetary economics,
1988, 22 (1), 3–42.
Menezes-Filho, Naércio Aquino, Marc-Andreas Muendler, and Garey Ramey, “The
Structure of Worker Compensation in Brazil, with a Comparison to France and the United States,”
2008, 90 (2), 324–346.
Mian, Atif R and Amir Sufi, “What explains high unemployment? The aggregate demand
channel,” Technical Report, National Bureau of Economic Research 2012.
Miller, Joan G, “Culture and the development of everyday social explanation.,” Journal of per-
sonality and social psychology, 1984, 46 (5), 961.
36

Miller, Robert A, “Job matching and occupational choice,” Journal of Political Economy, 1984,
92 (6), 1086–1120.
Moretti, Enrico, “Workers’ education, spillovers, and productivity: evidence from plant-level
production functions,” American Economic Review, 2004, 94 (3), 656–690.
Moskowitz, Tobias J. and Annette Vissing-Jorgensen, “The Returns to Entrepreneurial
Investment: A Private Equity Premium Puzzle?,” American Economic Review, September 2002,
92 (4), 745–778.
Muendler, Marc-Andreas, Jennifer Poole, Garey Ramey, and Tamara Wajnberg, “Job
Concordances for Brazil: Mapping the Classificaçao Brasileira de Ocupaçoes (CBO) to the Inter-
national Standard Classification of Occupations (ISCO-88),” University of California, San Diego,
unpublished manuscript, 2004.
Parker, Simon C, The economics of entrepreneurship, Cambridge University Press, 2018.
Pugsley, Benjamin W and Aysegul Sahin, “Grown-up business cycles,” 2015.
PwC, “Agribusiness in Brazil: an overview,” 2013.
Quadrini, Vincenzo, “The importance of entrepreneurship for wealth concentration and mobility,”
Review of income and Wealth, 1999, 45 (1), 1–19.
Rauch, James E, “Does history matter only when it matters little? The case of city-industry
location,” The quarterly journal of economics, 1993, 108 (3), 843–867.
Reynolds, Paul Davidson and Sammis B White, The entrepreneurial process: Economic
growth, men, women, and minorities, Praeger Pub Text, 1997.
Rotefoss, Beate and Lars Kolvereid, “Aspiring, nascent and fledgling entrepreneurs: An inves-
tigation of the business start-up process,” Entrepreneurship & Regional Development, 2005, 17
(2), 109–127.
37

Sedlácek, Petr, “Lost generations of firms and aggregate labor market dynamics,” Technical Re-
port, Tech. rep., WP 2014.
Sedláček, Petr and Vincent Sterk, “The growth potential of startups over the business cycle,”
American Economic Review, 2017, 107 (10), 3182–3210.
Sedlacek, Petr, Benjamin Pugsley, Vincent Sterk et al., “The Nature of Firm Growth,” in
“2017 Meeting Papers” number 196 Society for Economic Dynamics 2017.
Stroebel, Johannes and Joseph Vavra, “House prices, local demand, and retail prices,” Tech-
nical Report, National Bureau of Economic Research 2014.
Uusitalo, Roope, “Homo entreprenaurus?,” Applied economics, 2001, 33 (13), 1631–1638.
Wagner, Joachim, “Are nascent entrepreneurs "Jacks-of-all-trades"? A test of Lazear’s theory of
entrepreneurship with German data,” Applied Economics, 2006, 38 (20), 2415–2419.
38

Figure 1Spatial Distribution of Commodities (in 2000)
The map shows the cross sectional variation in the value of crop production relative to the GDP at themunicipality level. Darker shades of blue indicate municipalities where crops are more relevant.
39

Figure 2Residualized Crops Index
The graph captures the variation in the value of municipalities endowment, as captured by Crops Index(CI) and defined in the paper. The plotted variable is the residual from a regression of value of crops onmunicipality and year fixed effects. The thin grey lines are time series of these residuals for a 10% randomsample of all the municipalities in our sample. The solid lines are median (solid line), tenth and ninetithpercentiles (dashed lines) of the distribution of residuals in each year.
40

Figure 3Entrepreneurial Response by Age Group
The coefficients reported in the graphs are estimates of �n
from the model Tinjt
= ↵
nj
+ �
nt
+�
n
·Zjt
+ "
injt
estimated on different age quintiles n. An observation in the model is an individual i, in age quintile n,municipality j and year t. Age quintiles are computed within municipality-year groups. The 95% confidenceintervals are obtained from standard erros clustered at the municipality level. The magnitudes of the coef-ficients are in per-thousand points (e.g. the first coefficient in the figure means that the share of marginalentrepreneurs is 0.4 per-thousand individuals; the share of entrepreneurs in the data is 3 per-thousand).
����
����
��
4� 4� 4� 4�
41

Figure 4Comparison of Age Distribution
The graph reports the probability of being in 4 different quartiles of the age distribution for individuals inthe whole population, individuals in the group new entrepreneurs, and individuals in the group of responsiveentrepreneurs. The quartiles are computed over the entire population. The probabilities for the wholepopulation are 0.25 by construction. The probabilities for the group of new entrepreneurs are computed fromthe data as the share of new entrepreneurs in each age quartile. The probabilities for the group of responsiveentrepreneurs are obtained starting from estimates of �
n
from the model Tinjt
= ↵
nj
+ �
nt
+ �
n
·Zjt
+ "
injt
estimated on the sample of individuals belonging to the n � th age quartiles (for n 2 {1, 2, 3, 4}). Anobservation in the model is an individual i, in subsample n, municipality j in year t. T is a dummy forbeing an entrepreneur, ↵ and � are municipality and time fixed effects, Z
jt
is the shock to the commpodityindex. Then, each probability is computed as the ratio �
n
/� (where � is the coefficient from the model aboveestimated on the whole population) multiplied by 0.25 (the probability of being in each quartile).
���
����
4� 4� 4� 4�
SRSXODWLRQ QHZ�HQWUHS� UHVSRQVLYH�HQWUHS�
42

Figure 5Comparison of Skill Distribution
The graph reports the probability of having the characteristics reported on the y-axis for young individuals inthe whole population, young individuals in the group new entrepreneurs, and young individuals in the groupof responsive entrepreneurs. Here “young” means in the bottom quartile of the population age distribution.The probabilities for the young population and the young new entrepreneurs are computed from the data.The probabilities for the group of young responsive entrepreneurs are obtained starting from estimates of�
x
from the model Tixjt
= ↵
xj
+ �
xt
+ �
x
· Zjt
+ "
ixjt
estimated on the sample of young individuals for whocharacteristic x is verified (e.g. to obtain the estimate in the upper block of bars, only individuals with atleast a high-school degree). An observation in the model is an individual i, in subsample x, municipality j
in year t. T is a dummy for being an entrepreneur, ↵ and � are municipality and time fixed effects, Zjt
is theshock to the commpodity index. Namely, each probability is is obtained as the ratio �
n
/� (where � is thecoefficient from the model above estimated on the young population) multiplied by the probability of havingeach characteristics in the population.
� �� �� �� �� �
$FF��,QFRPH�!PHGLDQ
([SHULHQFH�!�PHGLDQ
3D\�JURZWK�!�PHGLDQ
2FF��*HQHUDOLVW
2FF��1RQ�URXWLQH�FRJQLWLYH
(GXF��+LJK�VFKRRO�RU�PRUH
\RXQJ \RXQJ�QHZ�HQWUHS�\RXQJ�UHVSRQVLYH�HQWUHS�
43

Table 1Summary Statistics
This table reports summary statistics on the main data sources. Panel A describes sector level data. Thesedata are build from the individual level RAIS dataset, and observations refers to the period 1998-2014, formunicipalities with less than 500,000 people, and averaged across years. For each industry we report numberof firms, employees and new firms, and their shares relative to the full sample. Panel B describes municipalitylevel data. These data are built from the individual level RAIS dataset, and other sources described in themain text, and observations refers to the period 1998-2014, for municipalities with less than 500,000 people,and pooled at the municipality level. Some of the financial data is only available for a subset of the yearsand municipalities. Panel C describes the new firms in our data. These data are built from the RAIS dataset and represent a cross section of new firms similarly obtained by pooling together data from the period1998-2014. Panel D describes all the workers in a 5% sample of our data. This information is obtained fromthe RAIS individual data set, and observations refers to the period 1998-2014, for municipalities with lessthan 500,000 people, and excluding individuals who migrate from one municipality to another. Similarly, inPanel E we report statistics for the entrepreneurs in the same 5% sample.
Panel A: Industry Composition - Annual DataShare of Firms Share of Employees Share of New Firms
Agirculture/Mining 0.019 0.053 0.015Manufacturing 0.153 0.325 0.122Non-tradable 0.544 0.277 0.543Transportation/Utilities/Commodities 0.054 0.062 0.057Services 0.203 0.204 0.220
Panel B: Municipality Composition - Annual DataObs. Mean SD Median
RAIS# Firms 80,481 237.917 677.053 47# Employees 80,481 3143.572 10783.486 342# New Firms 80,481 32.909 89.746 7Other Data SourcesPopulation 80,481 24122.059 45640.632 10914GDP per capita (2000 US) 80,481 3093.78 3764.037 2217.473Value of Commodities / GDP 80,481 0.867 2.521 0.126Value of Commodities / Population 80,481 2926.984 10038.188 272.156Total credit (mil 2000 US) 50,282 20.794 97.986 4.129Total BNDES credit (mil 2000 US) 39,534 2.758 17.118 0.228
44

Table 1(Continued)
Panel C: New Firms - Annual DataObs. Mean SD Median
# Years survivorship 6,820,760 6.86 6.236 5Employment at year of entry 6,820,760 7.984 251.707 2Employment 2 years after entry 4,304,322 14.334 330.808 3Employment 5 years after entry 2,685,616 18.967 426.648 4Employment 10 years after entry 1,427,901 26.498 546.994 5Panel D: Individuals Composition - Annual Data
Obs. Mean SD MedianYears of Education 11884935 11.45 3.18 12Male dummy 11884935 0.608 0.488 1Blue collar worker 11884935 0.48 0.5 0White collar worker 11884935 0.416 0.493 0Manager 11884935 0.036 0.187 0General skill set 11884935 0.193 0.395 0Panel E: Founders Composition - Annual Data
Obs. Mean SD MedianYears of Education 34,508 12.113 2.066 12Male dummy 34,508 0.57 0.495 1Blue collar worker in last job 34,508 0.402 0.49 0White collar worker in last job 34,508 0.5 0.5 1Manager in last job 34,508 0.045 0.206 0Generalist in last job 34,508 0.205 0.404 0
45

Table 2Aggregate Results
This table reports the estimated effect of changes in the value of crops on several outcomes. All the outcomesare obtained starting from the RAIS data aggregated at the municipality level. The data span the period1998-2014. The treatment variable is the local endowment shock, obtained as a dummy that equals 1 formunicipality j in year t if the local agricultural endowment in municipality j is in the top 10th percentilechange in the price distribution in year t relative to the municipality mean, and equals zero otherwise. Allspecifications include controls for log-population, year dummies and municipality fixed effects. Standarderrors are clustered by municipality. *,**, and *** denote statistical significance at the 10%, 5%, and 1%level, respectively.
(1) (2) (3) (4) (5)Total Total Number Number Number
Employment Income Firms New firms ClosuresTreatment 0.041*** 0.029*** 0.037*** 0.026*** -0.004
(0.009) (0.010) (0.005) (0.007) (0.007)Year FE Yes Yes Yes Yes YesMunicipality FE Yes Yes Yes Yes YesControls Yes Yes Yes Yes YesObservations 78,409 78,409 78,409 71,713 65,244R-squared 0.426 0.499 0.667 0.238 0.362Municipalities 5,431 5,431 5,431 5,416 5,393
46

Table 3Aggregate Results by Sector
This table reports the estimated effects of changes in the value of crops on the share of new firm creation indifferent sectors. All the outcomes are obtained starting from the RAIS data aggregated at the municipalitylevel. The value of crops is built from different sources as described in the main text. The treatment variableis the local endowment shock, obtained as a dummy that equals 1 for municipality j in year t if the localagricultural endowment in municipality j is in the top 10th percentile change in the price distribution inyear t relative to the municipality mean, and equals zero otherwise. The data span the period 1998-2014.Standard errors are clustered by municipality. *,**, and *** denote statistical significance at the 10%, 5%,and 1% level, respectively.
Panel A: By Sector - Employment(1) (2) (3) (4)
Agriculture /Mining Manufacturing Non-tradable Services
Treatment 0.084*** 0.025* 0.040*** -0.000(0.020) (0.014) (0.009) (0.014)
Year FE Yes Yes Yes YesMunicipality FE Yes Yes Yes YesControls Yes Yes Yes YesObservations 53,142 66,067 77,323 64,730R-squared 0.050 0.177 0.520 0.243Municipalities 4,649 5,078 5,430 5,198
Panel B: By Sector - Number of Firms(1) (2) (3) (4)
Agriculture /Mining Manufacturing Non-tradable Services
Treatment 0.008 0.007 0.055*** -0.006(0.008) (0.006) (0.006) (0.007)
Year FE Yes Yes Yes YesMunicipality FE Yes Yes Yes YesControls Yes Yes Yes YesObservations 53,142 66,067 77,323 64,730R-squared 0.050 0.177 0.520 0.243Municipalities 4,649 5,078 5,430 5,198
47
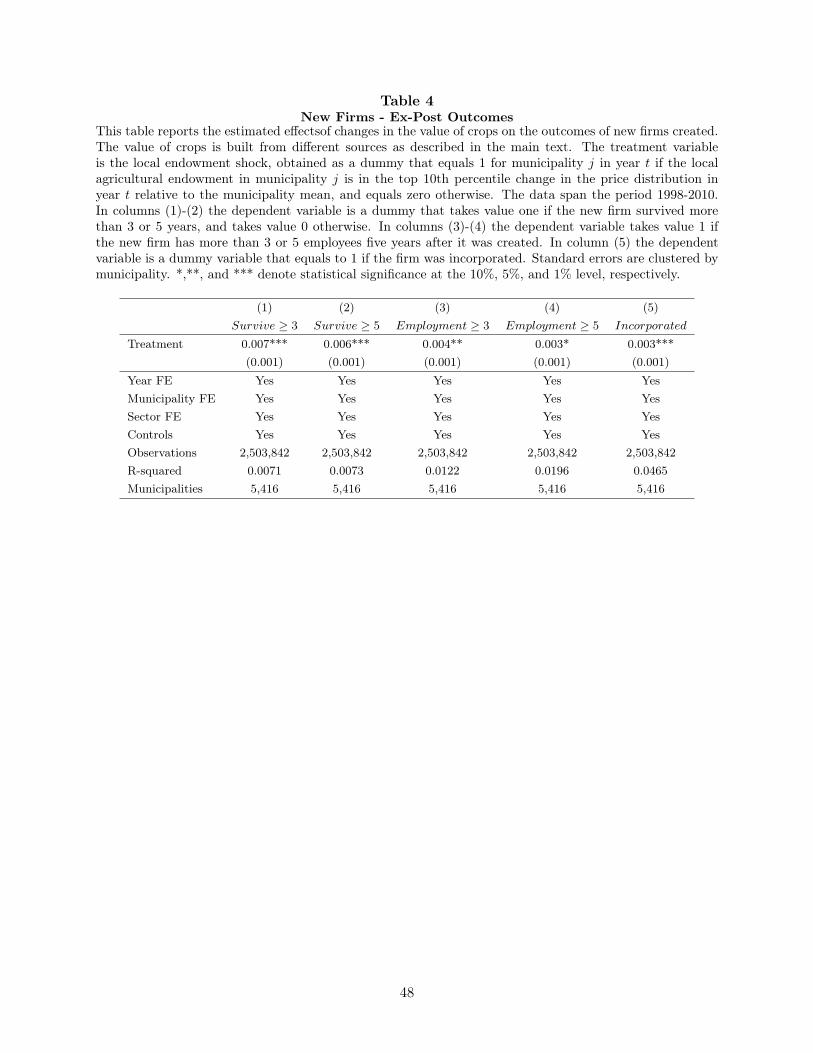
Table 4New Firms - Ex-Post Outcomes
This table reports the estimated effectsof changes in the value of crops on the outcomes of new firms created.The value of crops is built from different sources as described in the main text. The treatment variableis the local endowment shock, obtained as a dummy that equals 1 for municipality j in year t if the localagricultural endowment in municipality j is in the top 10th percentile change in the price distribution inyear t relative to the municipality mean, and equals zero otherwise. The data span the period 1998-2010.In columns (1)-(2) the dependent variable is a dummy that takes value one if the new firm survived morethan 3 or 5 years, and takes value 0 otherwise. In columns (3)-(4) the dependent variable takes value 1 ifthe new firm has more than 3 or 5 employees five years after it was created. In column (5) the dependentvariable is a dummy variable that equals to 1 if the firm was incorporated. Standard errors are clustered bymunicipality. *,**, and *** denote statistical significance at the 10%, 5%, and 1% level, respectively.
(1) (2) (3) (4) (5)Survive � 3 Survive � 5 Employment � 3 Employment � 5 Incorporated
Treatment 0.007*** 0.006*** 0.004** 0.003* 0.003***(0.001) (0.001) (0.001) (0.001) (0.001)
Year FE Yes Yes Yes Yes YesMunicipality FE Yes Yes Yes Yes YesSector FE Yes Yes Yes Yes YesControls Yes Yes Yes Yes YesObservations 2,503,842 2,503,842 2,503,842 2,503,842 2,503,842R-squared 0.0071 0.0073 0.0122 0.0196 0.0465Municipalities 5,416 5,416 5,416 5,416 5,416
48

Table 5Young Responsiveness
This table reports the estimated effects of changes in the value of crops on the likelihood of observing a newentrepreneur. The value of crops is built from different sources as described in the main text. The treatmentvariable is the local endowment shock, obtained as a dummy that equals 1 for municipality j in year t if thelocal agricultural endowment in municipality j is in the top 10th percentile change in the price distributionin year t relative to the municipality mean, and equals zero otherwise. The dependent variable, Founder , isa dummy equal to 1 in year t if the individual has founded a firm in year t, and 0 otherwise. The data spanthe period 1999-2014. Column (1) captures the average response, while Columns (2) to (6) report, in thesecond row, the differential responsiveness of young individuals (i.e. those in the lower quartile of the agedistribution) to the shock. Standard errors are clustered by municipality. *,**, and *** denote statisticalsignificance at the 10%, 5%, and 1% level, respectively.
(1) (2) (3) (4) (5) (6) (7)Founder Founder Founder Founder Founder Founder Founder
Treatment 0.179*** 0.176*** 0.0773 0.0813 0.0779 0.0794 0.0809(0.0630) (0.0613) (0.0645) (0.0648) (0.0648) (0.0648) (0.0647)
Treatment X Young 0.363** 0.358** 0.365** 0.366** 0.366**(0.159) (0.159) (0.159) (0.159) (0.159)
High School 1.86*** 1.85*** 1.74***(0.0407) (0.0407) (0.0406)
> High School 1.15*** 1.13*** .882***(0.0478) (0.0475) (0.0486)
Generalist 0.552*** 0.463***(0.0459) (0.0467)
White Collar .678***(0.047)
Year Y Y Y Y Y Y YMunicipality Y N N N N N NMunicipality X
N Y Y Y Y Y YAge Bottom Quart.Sector N N N Y Y Y YObservations (mil) 11.919 11.919 11.919 11.919 11.919 11.919 11.919
49

Table 6Heterogeneity Within Municipalities (A)
This table reports the estimated effects of changes in the value of crops on the likelihood of observing anew entrepreneur among different subsets of the young population (those in the lowest quartile of the agedistribution) and the old populations (those in the highest three quartiles). The treatment variable is thelocal endowment shock, obtained as a dummy that equals 1 for municipality j in year t if the local agriculturalendowment in municipality j is in the top 10th percentile change in the price distribution in year t relativeto the municipality mean, and equals zero otherwise. The dependent variable, Founder , is a dummy equalto 1 in year t if the individual has founded a firm in year t, and 0 otherwise. The data span the period1999-2014. Standard errors are clustered by municipality. *,**, and *** denote statistical significance at the10%, 5%, and 1% level, respectively.
Panel A - Young Population(1) (2) (3) (4) (5) (6)
Founder Founder Founder Founder Founder FounderTreatment 1.53*** 0.0294 0.931*** 0.326** 0.517*** 0.199
(0.483) (0.236) (0.319) (0.157) (0.172) (0.23)Partition Non-routine Cognitive Generalist EducationPartition Criteria Yes No Yes No >=HS <HSMunicipality FE Y Y Y Y Y YObservations (mil) 0.431 1.597 0.623 2.671 2.67 0.622
Panel B - Old Population(1) (2) (3) (4) (5) (6)
Founder Founder Founder Founder Founder FounderTreatment 0.138 0.0866 0.208 0.0464 0.0688 0.0876
(0.222) (0.146) (0.159) (0.0669) (0.0896) (0.0803)Partition Non-routine Cognitive Generalist EducationPartition Criteria Yes No Yes No >=HS <HSMunicipality FE Y Y Y Y Y YObservations (mil) 1.105 3.093 1.679 6.946 3.148 5.477
50

Table 7Heterogeneity Within Municipalities (B)
This table reports the estimated effects of changes in the value of crops on the likelihood of observing anew entrepreneur among different subsets of the young population (those in the lowest quartile of the agedistribution) and the old populations (those in the highest three quartiles). The treatment variable is thelocal endowment shock, obtained as a dummy that equals 1 for municipality j in year t if the local agriculturalendowment in municipality j is in the top 10th percentile change in the price distribution in year t relativeto the municipality mean, and equals zero otherwise. The dependent variable, Founder , is a dummy equalto 1 in year t if the individual has founded a firm in year t, and 0 otherwise. The data span the period1999-2014. Standard errors are clustered by municipality. *,**, and *** denote statistical significance at the10%, 5%, and 1% level, respectively.
Panel A - Young Population(1) (2) (3) (4) (5) (6)
Founder Founder Founder Founder Founder FounderTreatment 0.731*** 0.202 0.642*** 0.23 0.547*** 0.329
(0.260) (0.291) (0.21) (0.2) (0.209) (0.203)Partition Pay growth Experience Accumulated IncomePartition Criteria >median <median >median <median >median <medianMunicipality FE Y Y Y Y Y YObservations (mil) 0.900 0.865 1.665 1.628 1.665 1.628
Panel B - Old Population(1) (2) (3) (4) (5) (6)
Founder Founder Founder Founder Founder FounderTreatment 0.0566 -0.006 0.0295 0.126 0.0358 0.12
(0.0679) (0.101) (0.075) (0.102) (0.0744) (0.104)Partition Pay growth Experience Accumulated IncomePartition Criteria >median <median >median <median >median <medianMunicipality FE Y Y Y Y Y YObservations (mil) 4.332 4.293 4.293 4.293 4.293 4.293
51

Table 8Heterogeneity Across Municipalities: Access to Finance
This table estimates how the sensitivity to the shock changes across municipalities with different levels ofaccess to finance in the municipality in the first year in which they are observed. Data are obtained from theBrazilian Central Bank datasets (Banco Central do Brasil, BCB) and the BNDES. The measure of sensitivityis �
j
, estimated from the model Tijt
= ↵
j
+ �
t
+ �
j
· Zjt
+ "
ijt
. �
j
measures the municipality level increasein the likelihood of observing a new entrepreneur in response to the shock Z
jt
. T is a dummy for being anentrepreneur, ↵ and � are municipality and time fixed effects, Z
jt
is the shock to the commpodity index. Thereported regressions refer to the model �̂
j
= �↵̂
j
+✓F
j
+�X+µ
j
, where ↵̂
j
is the estimated municpality fixedeffect from the previous model, F
j
is the measure of access to finance reported on the row Factor Variable.The data span the period 1999-2014. Standard errors are clustered by municipality. *,**, and *** denotestatistical significance at the 10%, 5%, and 1% level, respectively.
(1) (2) (3) (4) (5)Municipality Municipality Municipality Municipality MunicipalityResponse (�̂) Response (�̂) Response (�̂) Response (�̂) Response (�̂)
Factor (F ) 1.11*** 0.65*** 0.0566*** 0.0323*** 0.0319***(0.108) (0.07) (0.0111) (0.00778) (0.00709)
Factor Variable Banks Bank Government Total credit Total DepositsBranches Funding Small businesses
Controls Y Y Y Y YObservations 4864 4864 4609 5099 5099
52

Table 9Heterogeneity Across Municipalities: Demographics
This table estimates how the sensitivity to the shock changes across municipalities with different demograph-ics in the municipality in the first year in which they are observed. The measure of sensitivity is �
j
, estimatedfrom the model T
ijt
= ↵
j
+ �
t
+�
j
·Zjt
+ "
ijt
. �
j
measures the municipality level increase in the likelihood ofobserving a new entrepreneur in response to the shock Z
jt
. T is a dummy for being an entrepreneur, ↵ and� are municipality and time fixed effects, Z
jt
is the shock to the commpodity index. The reported regressionsrefer to the model �̂
j
= �↵̂
j
+ ✓F
j
+ �X + µ
j
, where ↵̂
j
is the estimated municpality fixed effect from theprevious model, F
j
is the measure of demographics reported on the row Factor Variable. The data span theperiod 1999-2014. Standard errors are clustered by municipality. *,**, and *** denote statistical significanceat the 10%, 5%, and 1% level, respectively.
(1) (2) (3) (4) (5)Municipality Municipality Municipality Municipality MunicipalityResponse (�̂) Response (�̂) Response (�̂) Response (�̂) Response (�̂)
Factor (F ) 0.483*** 0.358*** 0.121*** 0.314*** -0.595*(0.0659) (0.0653) (0.0259) (0.0376) (0.357)
Factor Variable Generalists White Collar Founders Employees in AgeNew Firms
Controls Y Y Y Y YObservations 4899 4899 4899 5099 4899
53

Appendix
Shai Bernstein, Emanuele Colonnelli, Davide Malacrino, and Tim McQuade
A.1. Estimating Entrepreneur Characteristics
In this appendix, we describe how to formally estimate the distributional charactersitcs of thoseentrepreneurs who start a firm in response to local demand shocks. This will be useful in comparingthe characteristics of these entrepreneurs to the characterstics of the average entrepreneur in theBrazilian population.
As in the main text, let the binary indicator variable Tijt denote the decision in year t of anindividual i in municipality j to become an entrepreneur. We again let Zjt = 1 denote a time ofexogenous increased local demand in municipality j, as proxied for by local agricultural endowmentshocks. Let T1ijt and T0ijt denote the choice to become an entrepreneur when Zjt = 1 and Zjt = 0,respectively. Then we focus on the “responsive entrepreneurs”, namely those individuals who starta business in response to the endowment shock; that is, an individual i for whom T1ijt = 1 andT0ijt = 0 or, equivalently, T1ijt > T0ijt. Our goal is to estimate the size and characteristics of thispopulation.
Towards this end, we investigate heterogeneity in the entrepreneurial response to local demandshocks by sorting on individual characteristics. Specifically, let the variable n index demographiccategories (e.g. terciles, quartiles) of a characteristic of interest such as age. We then estimatethe following linear probability model for each subpopulation indexed by n, in particular for youngindividuals and then again for old individuals:
Tinjt = ↵nj + �nt + �n · Zjt + "injt. (4)
where ↵nj denote municipality fixed effects and �nt denote time fixed effects. We allow eachsubpopulation to have its own baseline level of entrepreneurship and to have its own time trend.
Two assumptions are key to our empirical strategy. First, as long as Zjt is uncorrelated with theerror term, this specification provides a consistent estimate of �n. Second, we assume monotonicity,
⇤This is the substantially revised version of a paper previously titled “Marginal Entrepreneurs”. Shai Bernstein iswith Stanford University, Graduate School of Business, and NBER; Emanuele Colonnelli is with Stanford University,Department of Economics; Davide Malacrino is with the IMF, and Tim McQuade is with Stanford Graduate School ofBusiness. The views expressed in this article/presentation are those of the authors and do not necessarily represent theviews of the IMF, its Executive Board or IMF management. We are grateful to Nick Bloom, Rebecca Diamond, CallumJones, Arvind Krishnamurthy, Luigi Pistaferri, as well as seminar participants at Alabama, Brigham Young, Duke,Statistics Norway, and Stanford University. We are grateful to the Stanford Institute for Innovation in DevelopingEconomies (SEED), the Private Enterprise Development in Low-Income Countries (PEDL) Initiative by the Centrefor Economic Policy Research (CEPR), the Stanford Center for International Development (SCID), and the AbdulLatif Jameel Poverty Action Lab (J-PAL) Governance Initiative for financial support.
1

which says that T1ijt � T0ijt for all i. This rules out cases where an individual starts a businesswhen economic opportunities are weak, but does not start a business when opportunities are strong.
The assumptions of orthogonality and monotonicity imply that:
P (T1injt > T0injt) = E [T1injt � T0injt]
= E [Tinjt|Zjt = 1]� E [Tinjt|Zjt = 0]
= �n.
Within this framework, the treatment coefficient �n reveals not only the increase in the probabilityto become an entrepreneur, but also the proportion of individuals in demographic category n whoare responsive entrepreneurs.
Additionally, we would like to determine the distribution of characteristics conditional on beinga responsive entrepreneur. This will allow us to compare their characteristics to the overall Brazilianpopulation and to the overall set of entrepreneurs. We can accomplish this with Bayes’s rule. Let Xi
be the characteristic of interest. Then, conditional on an individual i being a marginal entrepreneur,the probability that i is in category n can be calculated as follows:
P (Xi = n|T1ijt > T0ijt)
P (Xi = n)=
P (T1ijt > T0ijt|Xi = n)
P (T1ijt > T0ijt)=
�n
�
where � is found by estimating equation (4) on the entire population. This implies that the distri-bution of characteristics of marginal entrepreneurs is given by:
P (Xi = n|T1ijt > T0ijt) =�n
�
P (Xi = n) .
The same statistics for all entrepreneurs in the population are computed directly from the data, asthe fraction of individuals who create a new firm in a given year and that are in a particular agequartile.
2

Table A.1Agricultural Endowments Across Municipalities
This table provides a break down of agricultural crops and the number of municipalities in which they arebeing produced. The table also provide information on average value of these crops in 2000.
Crops Total Municipalities Total Value (USD Billions)Sugarcanes 3529 204.38Total Coffee 2030 9.87Soybeans 1495 9.26Maize 5003 3.67Rice 4045 2.43Cotton 1210 2.06Tobaccos 973 2.05Yerba mate 541 1.05Cocoa 278 0.57Wheat 815 0.32Rubber 421 0.09Sorghums 375 0.07Indiantea 7 0.06Orange 3763 0.05Barley 183 0.03Oatmeal 411 0.01Banana 3870 0.01
3
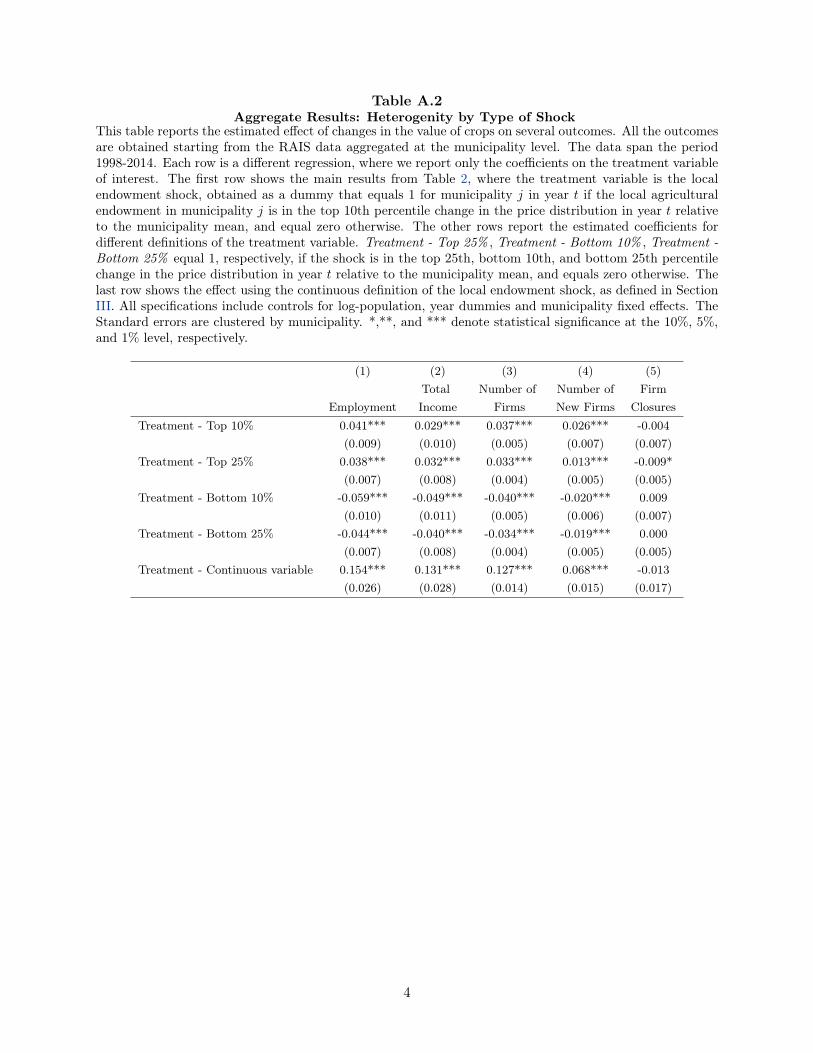
Table A.2Aggregate Results: Heterogenity by Type of Shock
This table reports the estimated effect of changes in the value of crops on several outcomes. All the outcomesare obtained starting from the RAIS data aggregated at the municipality level. The data span the period1998-2014. Each row is a different regression, where we report only the coefficients on the treatment variableof interest. The first row shows the main results from Table 2, where the treatment variable is the localendowment shock, obtained as a dummy that equals 1 for municipality j in year t if the local agriculturalendowment in municipality j is in the top 10th percentile change in the price distribution in year t relativeto the municipality mean, and equal zero otherwise. The other rows report the estimated coefficients fordifferent definitions of the treatment variable. Treatment - Top 25% , Treatment - Bottom 10% , Treatment -
Bottom 25% equal 1, respectively, if the shock is in the top 25th, bottom 10th, and bottom 25th percentilechange in the price distribution in year t relative to the municipality mean, and equals zero otherwise. Thelast row shows the effect using the continuous definition of the local endowment shock, as defined in SectionIII. All specifications include controls for log-population, year dummies and municipality fixed effects. TheStandard errors are clustered by municipality. *,**, and *** denote statistical significance at the 10%, 5%,and 1% level, respectively.
(1) (2) (3) (4) (5)Total Number of Number of Firm
Employment Income Firms New Firms ClosuresTreatment - Top 10% 0.041*** 0.029*** 0.037*** 0.026*** -0.004
(0.009) (0.010) (0.005) (0.007) (0.007)Treatment - Top 25% 0.038*** 0.032*** 0.033*** 0.013*** -0.009*
(0.007) (0.008) (0.004) (0.005) (0.005)Treatment - Bottom 10% -0.059*** -0.049*** -0.040*** -0.020*** 0.009
(0.010) (0.011) (0.005) (0.006) (0.007)Treatment - Bottom 25% -0.044*** -0.040*** -0.034*** -0.019*** 0.000
(0.007) (0.008) (0.004) (0.005) (0.005)Treatment - Continuous variable 0.154*** 0.131*** 0.127*** 0.068*** -0.013
(0.026) (0.028) (0.014) (0.015) (0.017)
4

Table A.3Aggregate Results: Dropping “World Producer” Municipalities
This table reports the estimated effect of changes in the value of crops on several outcomes. All the outcomesare obtained starting from the RAIS data aggregated at the municipality level. The data span the period1998-2014. The treatment variable is the local endowment shock, obtained as a dummy that equals 1 formunicipality j in year t if the local agricultural endowment in municipality j is in the top 10th percentilechange in the price distribution in year t relative to the municipality mean, and equals zero otherwise. InPanel A (Panel B), the sample excludes municipalities that ever produced 1% (0.5%) or more of the worldproduction of any commodity in any year in the period 1996-2015. All specifications include controls forlog-population, year dummies and municipality fixed effects. Standard errors are clustered by municipality.*,**, and *** denote statistical significance at the 10%, 5%, and 1% level, respectively.
Panel A - Dropping 1% World Producers(1) (2) (3) (4) (5)
Total Total Number Number NumberEmployment Income Firms New firms Closures
Treatment 0.040*** 0.028*** 0.036*** 0.026*** -0.003(0.009) (0.010) (0.005) (0.007) (0.007)
Year FE Yes Yes Yes Yes YesMunicipality FE Yes Yes Yes Yes YesControls Yes Yes Yes Yes YesObservations 77,900 77,900 77,900 71,247 64,796R-squared 0.426 0.499 0.666 0.238 0.362Municipalities 5,389 5,389 5,389 5,374 5,352
Panel B - Dropping 0.5% World Producers(1) (2) (3) (4) (5)
Total Total Number Number NumberEmployment Income Firms New firms Closures
Treatment 0.039*** 0.027*** 0.036*** 0.026*** -0.002(0.009) (0.010) (0.005) (0.007) (0.008)
Year FE Yes Yes Yes Yes YesMunicipality FE Yes Yes Yes Yes YesControls Yes Yes Yes Yes YesObservations 76,363 76,363 76,363 69,750 63,351R-squared 0.424 0.496 0.666 0.237 0.360Municipalities 5,286 5,286 5,286 5,271 5,249
5

Table A.4Aggregate Results: Persistence of the Shock
This table reports the estimated effect of changes in the value of crops on several outcomes. All the outcomesare obtained starting from the RAIS data aggregated at the municipality level. The data span the period1998-2014. The treatment variable in column 1 is the main local endowment shock, obtained as a dummythat equals 1 for municipality j in year t if the local agricultural endowment in municipality j is in the top10th percentile change in the price distribution in year t relative to the municipality mean, and equals zerootherwise. Columns 2 to 5 indicate different variations of the main treatment variable, where the shockrefers to 1, 2, 3, or 4 years before year t, respectively. Each row indicates a different dependent variable, andtherefore each cell represents the coefficient of one single regression. All specifications include controls forlog-population, year dummies and municipality fixed effects. Standard errors are clustered by municipality.*,**, and *** denote statistical significance at the 10%, 5%, and 1% level, respectively.
(1) (2) (3) (4) (5)Lag treatment 0 1 2 3 4Total employment 0.041*** 0.045*** 0.038*** 0.033*** 0.029***
(0.009) (0.009) (0.009) (0.009) (0.008)Total income 0.029*** 0.032*** 0.027*** 0.026*** 0.025***
(0.010) (0.010) (0.010) (0.010) (0.009)Total number of firms 0.037*** 0.040*** 0.032*** 0.032*** 0.023***
(0.005) (0.005) (0.005) (0.005) (0.004)Number of new firms 0.026*** 0.016** 0.017** 0.014* -0.002
(0.007) (0.007) (0.007) (0.007) (0.007)Number of dead firms -0.004 0.020*** -0.006 0.007 0.008
(0.007) (0.007) (0.007) (0.007) (0.008)
6

Table A.5Young Responsiveness: Negative Local Economic Shocks
This table reports the estimated effects of changes in the value of crops on the likelihood of observing anew entrepreneur. The treatment variable is the negative local endowment shock, obtained as a dummythat equals 1 for municipality j in year t if the local agricultural endowment in municipality j is in thebottom 10th percentile change in the price distribution in year t relative to the municipality mean, andequals zero otherwise. The dependent variable, Founder , is a dummy equal to 1 in year t if the individualhas founded a firm in year t, and 0 otherwise. The data span the period 1999-2014. Column (1) capturesthe average response, while Columns (2) to (6) report, in the second row, the differential responsiveness ofyoung individuals (i.e. those in the lower quartile of the age distribution) to the shock. Standard errorsare clustered by municipality. *,**, and *** denote statistical significance at the 10%, 5%, and 1% level,respectively.
(1) (2) (3) (4) (5) (6) (7)Founder Founder Founder Founder Founder Founder Founder
Treatment -0.0309 -0.0294 -0.0294 0.0767 0.0797 0.0792 0.0758(0.06) (0.0598) (0.0598) (0.0637) (0.0639) (0.064) (0.0639)
Treatment X Young -0.405*** -0.409*** -0.411*** -0.41***(0.152) (0.153) (0.152) (0.153)
High School 1.65*** 1.64*** 1.52***(0.0378) (0.0378) (0.0379)
> High School 0.549*** 0.477***(0.046) (0.0468)
Generalist 0.543***(0.0461)
White Collar 0.678***(0.047)
Year Y Y Y Y Y Y YMunicipality Y N N N N N NMunicipality X
N Y Y Y Y Y YAge Bottom Quart.Sector N N N Y Y Y YObservations (mil) 11.919 11.919 11.919 11.919 11.919 11.919 11.919
7

Table A.6Young Responsiveness: Attrition
This table reports the estimated effects of changes in the value of crops on the likelihood of observing a newentrepreneur. The treatment variable is the local endowment shock, obtained as a dummy that equals 1 formunicipality j in year t if the local agricultural endowment in municipality j is in the top 10th percentilechange in the price distribution in year t relative to the municipality mean, and equals zero otherwise.The dependent variable, FounderPre, is a dummy equal to 1 in year t if the individual has founded a firmprior to year t and that firm is still alive in year t, and 0 otherwise. The data span the period 1999-2014.Column (1) captures the average response, while Columns (2) to (6) report, in the second row, the differentialresponsiveness of young individuals (i.e. those in the lower quartile of the age distribution) to the shock.Standard errors are clustered by municipality. *,**, and *** denote statistical significance at the 10%, 5%,and 1% level, respectively.
(1) (2) (3) (4) (5) (6) (7)FounderPre FounderPre FounderPre FounderPre FounderPre FounderPre FounderPre
Treatment 0.14** 0.137** 0.138** 0.0458 0.0421 0.0435 0.0445(0.0615) (0.0592) (0.0593) (0.0632) (0.0632) (0.0632) (0.0631)
Treatment X Young 0.343** 0.35** 0.351** 0.351**(0.152) (0.152) (0.152) (0.152)
High School 1.56*** 1.55*** 1.44***(0.0363) (0.0362) (0.0364)
> High School 0.514*** 0.448***(0.0442) (0.0451)
Generalist 0.501***(0.044)
White Collar 0.678***(0.047)
Year Y Y Y Y Y Y YMunicipality Y N N N N N NMunicipality X
N Y Y Y Y Y YAge Bottom Quart.Sector N N N Y Y Y YObservations (mil) 11.919 11.919 11.919 11.919 11.919 11.919 11.919
8