who | global vaccine market report
TRANSCRIPT

WORKING DRAFT - December 2019 | 1
Global Vaccine Market Report
Overview of MI4A
WHO launched MI4A (Market Information for Access to Vaccines) in January 2018 in response to calls by the World Health Assembly, Member States and WHO’s Strategic Advisory Group (SAGE) on Immunization to:
• Improve access to market information for health commodities;
• Enhance the understanding of global vaccine demand, supply and pricing dynamics and identify affordability and shortage risks;
• Convene all relevant global health partners to contribute to the development of policies, strategies and guidance to address identified risks;
• Strengthen national and regional capacity for improved access to vaccines supply.
MI4A focuses on addressing the needs of self-procuring countries that benefit from limited international support.
This initiative helps inform dialogue on access in context of WHO’s work on Fair Pricing of Medicines.
MI4A information and reports are available at: who.int/immunization/MI4A
You can contact the MI4A project team at [email protected].
Executive SummaryThis Global Vaccine Market Report provides an annual update to Member States, WHO’s international partners and civil society on the state of global vaccine markets.
The report is divided into seven sections: Collection of Global Market Intelligence, Global Market Volumes, Vaccine Supply Dynamics, Vaccine Prices, Vaccine Regulation, Vaccine Stockouts & Shortages, and Global Market Value.
This resource complements other valuable Gavi, UNICEF, PAHO RF (Pan American Health Organization Revolving Fund) and WHO resources (see Annex 1).
Key observations made in this report:
• Participation in MI4A continues to increase year over year with 93% (182) of Member States reporting some market information, including 81% (158) reporting price data in 2019 (up from 26% reporting price data just three years ago).
• Estimated global demand for vaccines totaled 3.5 billion doses in 2018,1 up approximately 25% from last year due to growth in SEAR and AFR markets. Self-procuring middle-income countries (MICs) and UNICEF (Gavi) bought the highest volumes of vaccines. D&T- and measles-containing vaccines contributed most to demand.
• Supply security issues persist, with 32% of vaccines having fewer than four suppliers and 63% with two or fewer prequalified (PQ’d) products. Developing country vaccine manufacturers (DCVMs) continue to come to market and offer additional choices of products, and countries are leveraging regionally based supply.
• Compared to 2014–15, average vaccine prices have decreased for DTwP-HepB-Hib, HepB, HPV, PCV and seasonal flu and have increased for DTaP-Hib-IPV.
• UNICEF’s and PAHO RF’s pooled procurement mechanisms achieve lower prices for 80% of vaccines, compared to self-procurement.
• High-income countries (HICs) pay higher median prices than MICs for vaccines. However, MICs’ prices-paid overlap HICs’ prices-paid significantly and MICs regularly voice affordability concerns.
• The global community is close to achieving the Global Vaccine Action Plan 2020 target for vaccine quality, with 98.5% of vaccine doses used in NIPs being of assured quality.
• Maintaining last year’s levels, 69 countries reported facing stockouts in 2018. IPV and OPV vaccines registered the highest number of reported stockouts this year. WHO has also explored the market dynamics implications of global shortages of HPV and meningococcal vaccines and potential supply risks for aP-containing vaccines.
• The estimated global market value of vaccines was $26 billion¹ in 2018. HICs in WHO’s AMR and EUR regions account for 68% of value. Analyses predict a substantial growth in market value of HPV vaccines by 2030.
1 Excluding OPV, seasonal influenza, travel and military markets

GLOBAL VACCINE MARKET REPORT
WORKING DRAFT - December 2019 | 2
1. Collection of Global Vaccine Market IntelligenceMarket transparency continues to increase, with more countries reporting information on their vaccine purchases this year than ever before, with 182 countries reporting market information and 158 countries reporting price data.
Price reporting this year marks a 3% increase from last year and more than triple the reporting from three years ago. Notably, six countries reported price for the first time this year. The largest proportion of non-reporters are HICs, with 20% having never reported any market information. WHO continues to work with partial-reporting2 and non-reporting countries to better understand their challenges.
WHO’s understanding of supply dynamics (i.e. market forces related to supply of vaccines) also improves each year due to regular collection of available products and supply information from manufacturers. WHO uses this market intelligence data in conjunction with other available resources3 to inform global strategy and policy discussions and to support countries’ immunization budgeting and procurement decisions.
Global partnerships also saw strong progress on market transparency in 2019 with the 2019 May WHA (World Health Assembly) Resolution4 supporting transparency of market information as a way to “facilitate efforts towards affordable and equitable access to health products,” following the Director-General’s 2018 report on access to medicines.5 The same month, IVIR-AC reviewed and endorsed MI4A’s methods for market analysis, noting the unique contributions of the project to vaccine market transparency.6
2 Complete reporting is defined as reporting all requested market information (products, volumes and prices); some countries exclude price but still report valuable data on products and volumes.
3 This report leverages data reported by countries to the Joint Reporting Form (JRF), publicly available prices and market information from UNICEF, PAHO RF, and Gavi, and information on global demand, price and products from the Global Vaccine Market Model (accessed September 2019, Linksbridge SPC).
4 WHO. (2019). Improving the transparency of markets for medicines, vaccines, and other health products. http://apps.who.int/gb/ebwha/pdf_files/WHA72/A72_ACONF2Rev1-en.pdf
5 WHO. (2018). Addressing the global shortage of, and access to, medicines and vaccines. http://apps.who.int/gb/ebwha/pdf_files/WHA71/A71_12-en.pdf
6 WHO. (2019). Weekly Epidemiological Record, 94. https://apps.who.int/iris/bitstream/handle/10665/312312/WER9419.pdf?ua=1
Figure 1.1 Countries reporting price data to MI4A
Figure 1.2 Proportion of countries reporting (2019)
Complete reporting from self-procuring MICs increased 12% over last year

GLOBAL VACCINE MARKET REPORT
WORKING DRAFT - December 2019 | 3
2. Global Market VolumesFor global market volumes, and all subsequent sections, we divide the market into these sections7 to present meaningful segments for analysis:
• UNICEF (Gavi): Countries procuring through UNICEF that are eligible for Gavi support or transitioned from eligibility for Gavi support (not limited to Gavi-supported vaccines)
• UNICEF-procuring MICs:8 Middle-income countries (MICs) not eligible for Gavi support that procure most vaccines through UNICEF
• PAHO RF: Countries that procure through PAHO Revolving Fund
• Self-procuring MICs: MICs that self-procure all or most vaccines9
• Self-procuring HICs: High-income countries (HICs) that self-procure vaccines
Where relevant, analyses also present the contributions of highly populous countries India, China and Indonesia separately
Global market volumes increased approximately 20% last year to reach 3.5 billion doses in 2018, excluding OPV, seasonal influenza, and travel and military markets. Growth in SEAR and AFR primarily contributed to this increase, due to new introductions across both regions and large-scale campaigns in India. Additionally, this year’s volume estimates newly include a more comprehensive estimate of private market volumes for HPV, PCV, meningococcal and acellular pertussis (aP) vaccines.
The largest buyers in 2018 were SEAR and AFR (46% of total volumes), driven by self-procuring MICs (53%) and UNICEF (Gavi) countries (47%). Highly populated countries, China and India, contribute significantly to the volumes from self-procuring MICs. However, without these countries, self-procuring MICs still account for 17% of global volumes (compared to UNICEF [Gavi] with 31% and self-procuring HICs with 9%).
The largest vaccine markets continue to be diphtheria- and tetanus-containing (D&T-containing) vaccines10 and
7 For these country groupings, MI4A has categorized countries by their predominant procurement mechanism (e.g. a MIC with 70% of purchased volumes from UNICEF and 30% self-procured would be classified as UNICEF-procuring).
8 This grouping may also include HICs if a HIC procures the majority of its vaccines from UNICEF, but this is a rare occurrence.
9 Though India and Indonesia are eligible for Gavi support, these countries are included in this category, given that most vaccines are procured via self-procurement.
10 This grouping excludes DTwP-HepB-Hib, which is analyzed separately.
Figure 2.1 Global volume by (a) region, (b) country group and (c) vaccine group (2018)
High volume is due to 3-6-dose immunization schedules, including boosters
High volume due to supplementary immunization activities (SIAs)
Notes:Analysis excludes OPV, seasonal flu, military/travel market for all vaccines, and global stockpile for YF, OCV and meningococcal vaccines
Only the top 15 vaccines by market volume are shown in the vaccine group section
measles-containing vaccines (MCVs). Combined, these vaccines comprise 43% of global volumes.
MCV and D&T-containing vaccines also saw the greatest growth over 2017. The estimated 30–40% increase is mostly due to new introductions of MCV2 and D&T-containing boosters, large-scale MCV campaigns in India, and larger estimates of aP-containing vaccines used in the private market.

GLOBAL VACCINE MARKET REPORT
WORKING DRAFT - December 2019 | 4
The greatest decline in volumes was seen for TT, given that many countries are replacing these products with Td, in line with WHO recommendations.
Future growth can be expected in markets with growing populations and lagging vaccine adoption: AFR, UNICEF (Gavi), and UNICEF- and self-procuring MICs. See the chart above for more detail on vaccine-specific market growth from MI4A’s in-depth market studies.
3. Vaccine Supply DynamicsMI4A vaccine purchase data indicates potential supply security challenges in two key areas: 1) where there are too few suppliers of individual vaccines or vaccine components and 2) where countries are limiting their available choices by relying predominantly on supply from certain manufacturers or manufacturer groups.
Few markets are true monopolies; 68% of vaccines have more than four manufacturers and 37% have three or more PQ’d suppliers. Vaccine markets with few marketed products and high or variable demand, such as meningococcal vaccines or PPSV, may face supply security risks if production is interrupted for one or more key suppliers (Table 3a).11 Vaccine supply security may also be at risk if the manufacture of vaccine components, such as adjuvants or singular antigens in combination products, is concentrated in one or few manufacturers.
DCVMs continue to come to market and offer additional choice across almost all vaccine groups (92%) (Figure 3.1). In 2018
11 While products are PQ’d by WHO, manufacturers may not actually be producing
WHO has conducted in-depth market analyses to forecast supply and demand for BCG, D&T-containing and HPV vaccines.* Based on these analyses, there is significant room for growth in HPV (anticipated 135% growth), Td (32% growth), and DTwP-HepB-Hib (20% growth) markets by 2030. HPV shows significant percent growth due to low current demand, partly because of supply constraints that have inhibited country introductions and high forecasted country adoption needed to meet cervical cancer elimination goals.
* Forecasted growth in demand for these vaccines assumes high-growth conditions, forecasting introduction of HPV in all countries by 2030, and Gavi support of D&T-containing boosters for second year of life, children and adolescents.
Potential Vaccine Market Volume Growth 2019 –2030 (from MI4A market studies on BCG, D&T-containing and HPV vaccines)
The replacement of TT with Td and the anticipated introduction of booster doses drive the significant expected growth for Td and DTwP-HepB-Hib.
The highest percent growth is expected for HPV due to many countries left to introduce (including highly populated ones), given ongoing supply constraints.
Figure 3.1 Manufacturer type by vaccine

GLOBAL VACCINE MARKET REPORT
WORKING DRAFT - December 2019 | 5
MI4A purchase data, only HPV and PCV were made solely by IFPMA (International Federation of Pharmaceutical Manufacturers & Associations) manufacturers. The market has already evolved, as a DCVM entered the Rota market in 2018. Clinical pipeline data shows more suppliers are entering concentrated or monopoly markets such as HPV and meningococcal vaccines.12
Additionally, countries are leveraging the availability of regional products, with AMR and EUR showing a large proportion of procurement from regionally based manufacturers and SEAR relying almost exclusively on Indian manufactured products (Figure 3.2). However, individual countries may find fewer options than indicated in MI4A purchase data if there is a predominant reliance on specific manufacturers or manufacturer groups.
Finally, there is an increasing risk of market segmentation within indications due to product differentiation, which further complicates supply dynamics.
12 MI4A HPV and Meningococcal Vaccine Market Studies: https://www.who.int/immunization/programmes_systems/procurement/mi4a/platform/module2/en/
Table 3a Number of companies and PQ’d product by vaccine market
Figure 3.2 Regional procurement by manufacturer type
EUR shows notably low demand for non-IFPMA, non-European-produced products

GLOBAL VACCINE MARKET REPORT
WORKING DRAFT - December 2019 | 6
Figure 4.1 Average Percent Change in Price 2014/15–2018
Notes:
Across all groups except UNICEF, IPV prices increased
The significant change in Td price for self-procuring MICs is driven by one country that procured Td from a new manufacturer in 2018 for ~5x what they typically pay when procuring from another manufacturer
Across all groups except self-procuring HICs, MMR prices increased
*UNICEF prices for HPV, PCV and Rota are the prices offered to Gavi-supported countries only
Groups are based on the method of procurement for each purchase and the income level of the country purchasing
Vaccines are included where there are at least three data points for both 2014/15 and 2018 data for the same reporting countries
The same countries must have reported purchases in both 2014/15 and 2018 to have the reported price included
Average price is adjusted for cumulative inflation in the same time period

GLOBAL VACCINE MARKET REPORT
WORKING DRAFT - December 2019 | 7
4. Vaccine PricesMI4A purchase data shows no clear positive or negative trend in vaccine prices over time (see Figure 4.1 on previous page). While there is no consistent trend in prices across all vaccines, some individual vaccines show evidence of rising or declining prices. Average price increased for DTaP-Hib-IPV, potentially influenced by the monopoly position of the supplier and dearth of convenient substitutes. Conversely, average prices decreased for DTwP-HepB-Hib, HepB, HPV, PCV and seasonal flu. Common reasons for decreasing price that may have impacted these markets are donor intervention and increased supplier competition, particularly from new DCVM entrants. Across all vaccines, DCVMs offer a lower average price than IFPMA manufacturers (Figure 4.2). In 2018 purchase data, YF and rabies vaccines had the greatest notable difference in prices.
By country group, self-procuring MICs saw the largest change in average price across all purchased vaccines – a 9% increase. Prices declined 3% for UNICEF (Gavi) and stayed stable (+/– 1%) for PAHO RF and self-procuring MICs.13
13 Vaccine prices for PAHO RF and UNICEF used in the price section are as reported by these organizations.
Figure 4.2 Price variance by manufacturer type (2018)
Notes:Excludes vaccines that have only one type of manufacturer
Excludes manufacturers that only supply to domestic markets
By procurement mechanism (e.g. UNICEF, self-procurement), there must be purchases from both manufacturer types to be included
Figure 4.3 Price per dose (USD) for all vaccines by procurement/income group (2018)
Notes:UNICEF and PAHO RF prices are average prices as reported by these organizations; self-procured prices are median prices
Groups are based on the method of procurement for each purchase, not country groups
Only included in analysis if there were purchases from >=2 countries for each group

GLOBAL VACCINE MARKET REPORT
WORKING DRAFT - December 2019 | 8
There is strong evidence of price tiering by procurement mechanism. Compared to self-procurement, pooled procurement leads to lower prices for 24 of 30 vaccines (Figure 4.3). Self-procuring MICs pay nearly three times more than non-Gavi MICs procuring through UNICEF and over two times more than countries procuring through PAHO RF.
While price is tiered by income at an aggregate level, there is substantial overlap in prices paid by self-procuring MICs and HICs. Self-procuring HICs pay more than five times more than self-procuring MICs, on average. However, Figure 4.4 shows many cases of lower-income countries paying higher prices than higher-income countries for the same vaccine.
WHO continues to engage with countries and partners to understand where affordability issues exist and support access to vaccines.
5. Vaccine RegulationWHO and its partners strive to ensure all countries have access to sufficient doses of vaccine that are of assured quality.14 Stable, well-functioning, and integrated regulatory systems with streamlined processes and predictable timelines are key to facilitate this access.
In 2018, more than 98.5% of the globally available vaccine doses used in NIPs were of assured quality, up 2.5% from 2017. Additional vaccine-producing countries with functional national regulatory authorities (NRAs) are expected to reduce the remaining 1.5% gap in the coming years. Key remaining challenges that could
14 Vaccines of assured quality include vaccines produced in a country with a stable, well-functioning and integrated national regulatory authority (NRA), including vaccines prequalified by WHO. For more information, please refer to GVAP Secretariat Report 2013; page 80 (http://www.who.int/entity/immunization/global_vaccine_action_plan/GVAP_secretariat_report_2013.pdf#page=80) and WHO Vaccine Supply and Quality Unit GPV policy statement on vaccine quality (https://apps.who.int/iris/handle/10665/63578).
Figure 4.4 Price (USD) vs. GNI (gross national income) per capita for self-procured purchases (2018)
Notes:Each dot represents one country
Selected four vaccines that had the most overall data
Only self-procured purchases
Single-product registration and access risks: BCG and Td examplesMI4A’s 2017 market studies investigating reported shortages of BCG and D&T-containing vaccines found that registration of a single vaccine product was a risk to vaccine access. The 2018 update of the BCG study revealed that more than one-fifth of countries with BCG in routine immunization schedules have only one or no BCG products registered and do not accept PQ’d vaccines or expedited procedures. Similarly, the 2018 market study update on D&T-containing vaccines highlighted Td as a particular area for concern, with nearly 15% of countries with Td in schedule having one or no Td products registered and requiring full registration for product use.Countries can mitigate temporary production interruptions from their preferred vaccine manufacturer if clear and efficient emergency import procedures are in place. However, in many countries, these procedures are still not defined.
Several MICs paid higher prices than HICs for PCV

GLOBAL VACCINE MARKET REPORT
WORKING DRAFT - December 2019 | 9
stall progress are lack of necessary commitment and plans to further strengthen regulatory authorities of concern, insufficient resources at the country level, and inconsistent vaccine production by local manufacturers. WHO continues to work with Member States to strengthen their regulatory capacity and achieve stable, well-functioning and integrated regulatory systems.
Countries’ access to sufficient doses of preferred products could be improved by standardizing and streamlining regulatory pathways for registering vaccines. When vaccines are substitutable, flexible legislation to mitigate anticipated risks, such as registering more than one product or establishing faster registration processes, can help countries to avoid stockouts in the case of market exit or supply shortage from the preferred manufacturer. However, countries and suppliers are challenged in achieving this flexibility by lengthy and widely varying registration requirements that prolong timelines and drive up costs. These requirements are more burdensome for lower-cost manufacturers, potentially limiting access to more affordable products. See box on previous page for an example of registration and access risks with BCG and Td vaccines.
WHO has made several investments to alleviate these challenges. For more information about WHO activity in this area, please go to: https://www.who.int/medicines/regulation/benchmarking_tool/en/
Global vaccine shortages from MI4A’s in-depth market studiesWHO has carried out in-depth market studies for several vaccines (BCG, D&T-containing, HPV and meningococcal) to investigate reported access issues, understand the resulting impacts on the market and identify areas for action. These market studies have identified global shortages* for HPV and meningococcal vaccines and highlighted potential supply risks for aP-containing vaccines. HPV supply is currently not sufficient to meet increasing global demand due to insufficient manufacturing capacity, and this likely will not improve until the mid-2020s when additional supply is available, including new products. Issues in accessing meningococcal vaccines have been reported primarily by MICs and HICs for both polysaccharide and conjugate C, W-containing vaccines, specifically MenACWY. Discontinuation of all but one MenACWY polysaccharide product available to the global market, the rising incidence of C and W meningococcal serogroups in all regions, and the requirement for quadrivalent vaccination for Hajj pilgrims have contributed to increased demand for quadrivalent conjugate products and created access issues for countries that cannot afford the much higher-priced conjugate vaccine. While supply of aP-containing vaccines used in the infant schedule and as boosters is anticipated to be sufficient to meet existing demand, significant buffer capacity is not available. Any substantial (10%+) increase in demand (e.g., due to product or schedule changes) may require careful planning and communication from countries, partners and manufacturers.* A shortage is defined as “the supply of medicines, health products, and vaccines identified as essential by the health system is considered to be insufficient to meet public health and patient needs or when demand exceeds supply at any point in the supply chain.” (Source: WHO [2017], Technical Definitions of Shortages and Stockouts of Medicines and Vaccines)

GLOBAL VACCINE MARKET REPORT
WORKING DRAFT - December 2019 | 10
6. Vaccine Stockouts & ShortagesSixty-nine countries worldwide reported a national stockout15 of one or more vaccines in 2018, representing 46% of 149 total reporting countries (Figure 6.1).16 Of these 69 countries, 42 (61%) reported national stockouts of two or more vaccines.
The reported causes of stockouts are largely driven by global vaccine shortages (35%) or procurement delays17 (26%) rather than cold chain issues or distribution issues. For UNICEF (Gavi) and PAHO RF countries, funding delays also played an important role (25% and 27%, respectively). To better understand and prevent stockouts caused by the inability to access vaccines from procurers or manufacturers, WHO is developing a shortage notification system to standardize and accelerate communication of shortages and streamline responses to mitigate or resolve the shortage.
Vaccines with significant reporting of stockouts were YF, measles and IPV/OPV. IPV and OPV had the largest number of countries reporting stockouts. A high proportion of countries using YF and measles vaccines
15 From the 2014 Global Vaccine Action Plan: “A stock-out event is defined when a stock-out of a vaccine occurred for a duration of at least one month… If a stock-out (of at least one month) in one country were reported for two vaccines, these would be considered as two stock-out events for that country.” Available at: www.who.int/immunization/global_vaccine_action_plan/gvap_secretariat_report_2014.pdf
16 Stockout data is as reported by countries and not validated by WHO.
17 UNICEF and PAHO procurement delays likely due to delay in transfer of funds from countries.
Figure 6.1 Reported stockouts over time
Figure 6.2 Global reporting of stockouts by vaccine (2018)
Figure 6.3 Reported stockout causes by country group (2018)
Notes:Excludes groups with fewer than five countries
Distinct count of countries reporting is provided. However, countries may have reported more than one cause
GLOBAL VACCINE MARKET REPORT
WORKING DRAFT - December 2019 | 11
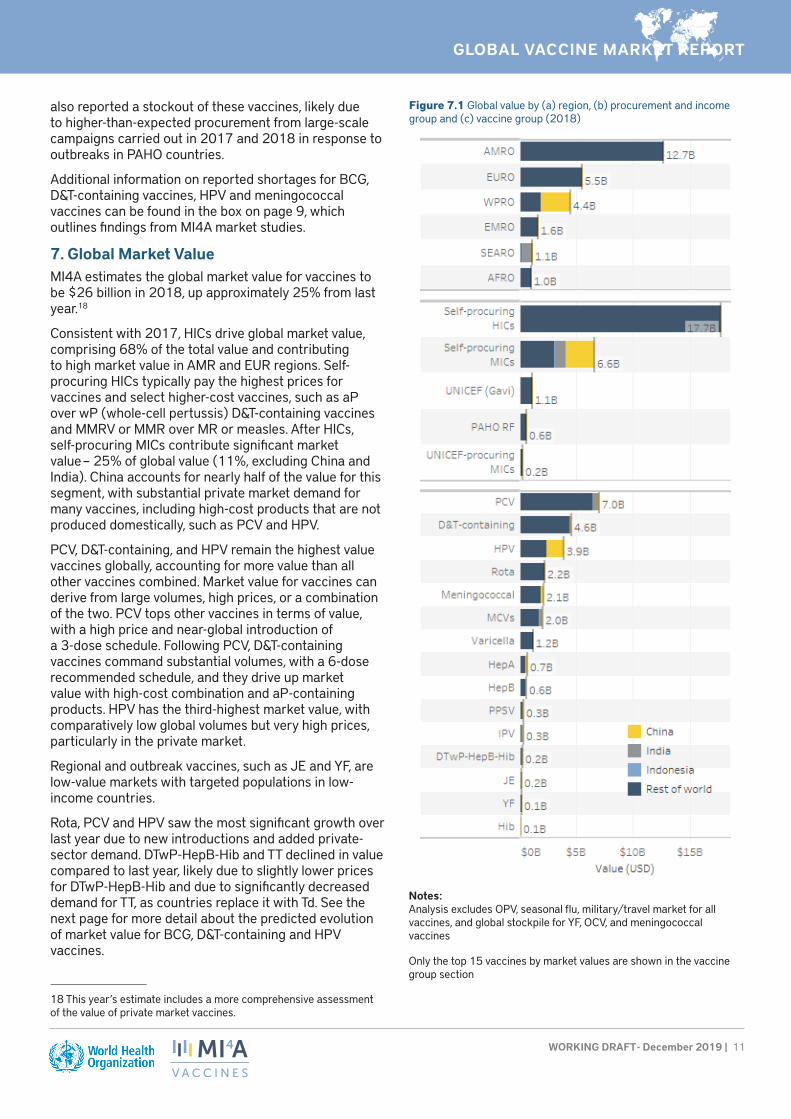
also reported a stockout of these vaccines, likely due to higher-than-expected procurement from large-scale campaigns carried out in 2017 and 2018 in response to outbreaks in PAHO countries.
Additional information on reported shortages for BCG, D&T-containing vaccines, HPV and meningococcal vaccines can be found in the box on page 9, which outlines findings from MI4A market studies.
7. Global Market ValueMI4A estimates the global market value for vaccines to be $26 billion in 2018, up approximately 25% from last year.18
Consistent with 2017, HICs drive global market value, comprising 68% of the total value and contributing to high market value in AMR and EUR regions. Self-procuring HICs typically pay the highest prices for vaccines and select higher-cost vaccines, such as aP over wP (whole-cell pertussis) D&T-containing vaccines and MMRV or MMR over MR or measles. After HICs, self-procuring MICs contribute significant market value – 25% of global value (11%, excluding China and India). China accounts for nearly half of the value for this segment, with substantial private market demand for many vaccines, including high-cost products that are not produced domestically, such as PCV and HPV.
PCV, D&T-containing, and HPV remain the highest value vaccines globally, accounting for more value than all other vaccines combined. Market value for vaccines can derive from large volumes, high prices, or a combination of the two. PCV tops other vaccines in terms of value, with a high price and near-global introduction of a 3-dose schedule. Following PCV, D&T-containing vaccines command substantial volumes, with a 6-dose recommended schedule, and they drive up market value with high-cost combination and aP-containing products. HPV has the third-highest market value, with comparatively low global volumes but very high prices, particularly in the private market.
Regional and outbreak vaccines, such as JE and YF, are low-value markets with targeted populations in low-income countries.
Rota, PCV and HPV saw the most significant growth over last year due to new introductions and added private-sector demand. DTwP-HepB-Hib and TT declined in value compared to last year, likely due to slightly lower prices for DTwP-HepB-Hib and due to significantly decreased demand for TT, as countries replace it with Td. See the next page for more detail about the predicted evolution of market value for BCG, D&T-containing and HPV vaccines.
18 This year’s estimate includes a more comprehensive assessment of the value of private market vaccines.
Figure 7.1 Global value by (a) region, (b) procurement and income group and (c) vaccine group (2018)
Notes:Analysis excludes OPV, seasonal flu, military/travel market for all vaccines, and global stockpile for YF, OCV, and meningococcal vaccines
Only the top 15 vaccines by market values are shown in the vaccine group section

GLOBAL VACCINE MARKET REPORT
WORKING DRAFT - December 2019 | 12
Based on in-depth market analyses of demand evolution and current pricing data, HPV, Td and DTwP-HepB-Hib are anticipated to see significant global market value growth by 2030.* Strongest growth is expected for HPV. While accounting for lower overall value, Td and DTwP-HepB-Hib market values are expected to increase by about 90% and 20%, respectively, due to expected adoption of these vaccines for booster doses and replacement of TT.
*Market value projections leverage the same high-growth volume assumptions presented in section 1. For price, market value projections assume the continuation of a country’s 2018 reported price for each vaccine. For countries that have not reported to the JRF, price was estimated based on a country’s procurement mechanisms and income groups.
Potential Vaccine Market Volume Growth 2019–2030 (from MI4A market studies on BCG, D&T-containing and HPV vaccines)
HPV is anticipated to grow by 30% to reach approximately $4.8 billion, driven by the high price of the vaccine and the substantial increase in adoption that will be required to achieve cervical cancer elimination goals.

GLOBAL VACCINE MARKET REPORT
WORKING DRAFT - December 2019 | 13
Annex 1: Additional ResourcesUNICEF Immunization Supplies and Logistics publications and data (including vaccine price data used in this report): https://www.unicef.org/supply/index_immunization.html
PAHO RFVaccine price data (used in this report): https://www.paho.org/hq/index.php?option=com_content&view=article&id=1864:paho-revolving-fund&Itemid=4135&lang=en
GaviVaccine Roadmap public summaries and other supply and procurement related documents: https://www.gavi.org/library/gavi-documents/supply-procurement/
Other WHO MI4A resourcesVaccine purchase data (in Excel format for download) and vaccine-specific global market studies: http://www.who.int/immunization/mi4a
Annex 2: Data Sources The primary data source for the analyses in this report is purchase and schedule data reported by countries through the WHO-UNICEF Joint Reporting Form (JRF). This is supplemented with additional publicly available information from PAHO RF, UNICEF and past WHO MI4A individual vaccine market studies.
Remaining information gaps are filled using the Global Vaccine Market Model (GVMM), which estimates demand and price by country and vaccine across all WHO Member States, leveraging publicly available information.
World Bank provides data for GNI (gross national income) per capita and global cumulative inflation rate:
https://data.worldbank.org/indicator/NY.GNP.ATLS.CD
https://data.worldbank.org/indicator/FP.CPI.TOTL.ZG
DisclaimerInformation contained in the MI4A database is provided by participating countries that have agreed to share vaccine price and procurement data. Participating countries are solely responsible for the accuracy of the data provided.The information contained in the MI4A database does not in any way imply an endorsement, certification, warranty of fitness or recommendation by WHO of any company or product for any purpose, and does not imply preference over products of a similar nature that are not mentioned. WHO furthermore does not warrant that: (1) the information is complete and/or error free; and/or that (2) the products listed are of acceptable quality, have obtained regulatory approval in any country, or that their use is otherwise in accordance with the national laws and regulations of any country, including but not limited to patent laws. Inclusion of products in the database does not furthermore imply any approval by WHO of the products in question (which is the sole prerogative of national authorities).WHO will not accept any liability or responsibility whatsoever for any injury, death, loss, damage, or other prejudice of any kind that may arise as a result of, or in connection with the procurement, distribution and use of any product listed in the MI4A database.
GLOBAL VACCINE MARKET REPORT
WORKING DRAFT - December 2019 | 14
Annex 3: Acronym List
AFR/AFRO WHO African Region MMR Measles, mumps and rubella
AMR/AMRO WHO Region of the Americas MMRV Measles, mumps, rubella and varicella
aP-containing acellular pertussis–containing MR Measles and rubella
BCG Bacillus Calmette–Guérin (for tuberculosis) NIP(s) National immunization program(s)
bOPV Polio vaccine – oral (OPV) bivalent types 1 and 3
NRA(s) National regulatory authority/ies
D&T-containing Diphtheria- and tetanus-containing OCV Oral cholera vaccine
DCVM(s) Developing country vaccine manufacturer(s)
OPV Oral polio vaccine
DTaP Diphtheria-tetanus-pertussis (acellular) PAHO RF Pan American Health Organization Revolving Fund
DTwP Diphtheria-tetanus-pertussis (whole cell) PCV Pneumococcal conjugate vaccine
EMR/EMRO WHO Eastern Mediterranean Region PPSV Pneumococcal polysaccharide vaccine
EUR/EURO WHO European Region PQ’d Prequalified
GNI Gross national income Ps Polysaccharide
GVAP Global Vaccine Action Plan Rota Rotavirus
GVMM Global Vaccine Market Model SE South-East
HepA, HepB Hepatitis A, hepatitis B SEAR/SEARO WHO South-East Asia Region
Hib Haemophilus influenzae type b SIA Supplementary immunization activities
HIC(s) High-income country/ies TBE Tick-borne encephalitis
HPV Human papillomavirus TCV Typhoid conjugate vaccine
IFPMA International Federation of Pharmaceutical Manufacturers & Associations
Td Tetanus-diphtheria (reduced antigen content)
IPV Inactivated Polio Vaccine Tdap Tetanus-diphtheria-acellular pertussis (reduced antigen content)
IVIR-AC Immunization and Vaccine-related Implementation Research (IVIR) Advisory Committee
TT Tetanus toxoid
JE Japanese encephalitis UNICEF United Nations Children’s Fund
JRF Joint Reporting Form WHA World Health Assembly
MCV(s) Measles-containing vaccine(s) WHO World Health Organization
MCV2 Measles-containing-vaccine second-dose wP whole-cell pertussis
MenA, Men B, MenC Meningococcal A, B, C WPR/WPRO WHO Western Pacific Region
MenACW-135 (Ps) Meningococcal ACW-135 polysaccharide YF Yellow fever
MenACWY Meningococcal ACWY
MIC(s) Middle-income country/ies