who growth standards bc training module - british …€¦ · bc training module june 2, ... •...
TRANSCRIPT

World Health Organization Growth Standards
BC Training Module June 2, 2011

Purpose of the Training Module
• To train BC health care providers currently using CDC growth charts on how to use the World Health Organization (WHO) Growth charts adapted for Canada.
2

Training Module Objectives
To increase healthcare providers’ understanding of:• The new WHO Growth Charts and the importance of serial
measurements• The differences between Centre for Disease Control (CDC)
growth charts and WHO Growth Standards• How to plot on the appropriate growth chart• How to interpret results and refer growth concerns• How to communicate growth with parent/caregiver.• The resources available
3

Components of the Training Module• Slide presentation• Speaker’s Notes • Appendices of materials which include:
– Acknowledgments
– Case Study Scenarios and Answer Guide
– Staff Quiz and Answers
– Recommended Resources for Parents
– Recommended Resources for Health Care Providers
– Tools and Techniques for Measuring Growth
– Evaluation Form
– WHO Growth Charts available in Canada from birth to 19 years of age
4

See Appendices for Staff Quiz and Answer Key
5

Why is BC Adopting the New WHO Growth Charts for Canada?
• Reflect optimal growth of infants, children and adolescents.
• Endorsed by the Dietitians of Canada, the Canadian Pediatric Society, the College of Family Physicians of Canada and the Community Health Nurses of Canada.
• The BC Ministry of Health Services recommends that all health professionals adopt the new WHO Growth Charts.
6

What is the Purpose of a Growth Chart? • A tool to accurately plot serial measurements including
weight, height/length and head circumference.
• Information that assists health care providers to monitor growth and development of infants, children and adolescents
– Identifies growth disturbances or concerns– Not intended to be used as a diagnostic tool.
7

The New Growth Charts for Use in Canada

WHO Growth Charts for CanadaChart Age Percentiles
Length-for-Age and
Weight-for-Age
Birth to 24 months 0.1st, 3rd, 15th, 50th, 85th, 97th, 99.9th
Head Circumference and
Weight-for-Length
Birth to 24 months 0. 1st, 3rd, 15th , 50th, 85th,97th, 99.9th
Height-for-Age and
Weight-for-Age
2 to 19 Years 0. 1st, 3rd, 15th, 50th, 85th, 97th, 99.9th
Body Mass Index for-Age 2 to 19 Years 0. 1st, 3rd, 15th, 50th, 85th, 97th, 99.9th
Available for download at: www.dietitians.ca/Secondary-Pages/Public/Who-Growth-Charts.aspx9

WHO Growth Charts for Canada - Birth to 24 months
10

WHO Growth Charts for Canada - 2 to 19 years
11

Understanding the New Growth Charts

The WHO Growth Charts
There are two separate series of charts:
• 2006 WHO Child Growth Standards charts for birth to 5 years‐ Illustrate how healthy children “should” grow.‐ CDC charts portrayed how a sample of children “did” grow.
• WHO Growth Reference 2007 charts for 5 to 19 years‐ These are reconstructed CDC growth charts based on best
available historical data and also supplement data from WHO growth standards.
‐ Redesigned to more closely align with optimal growth and address the issue of the increasing overweight/obesity in children and adolescents.
13
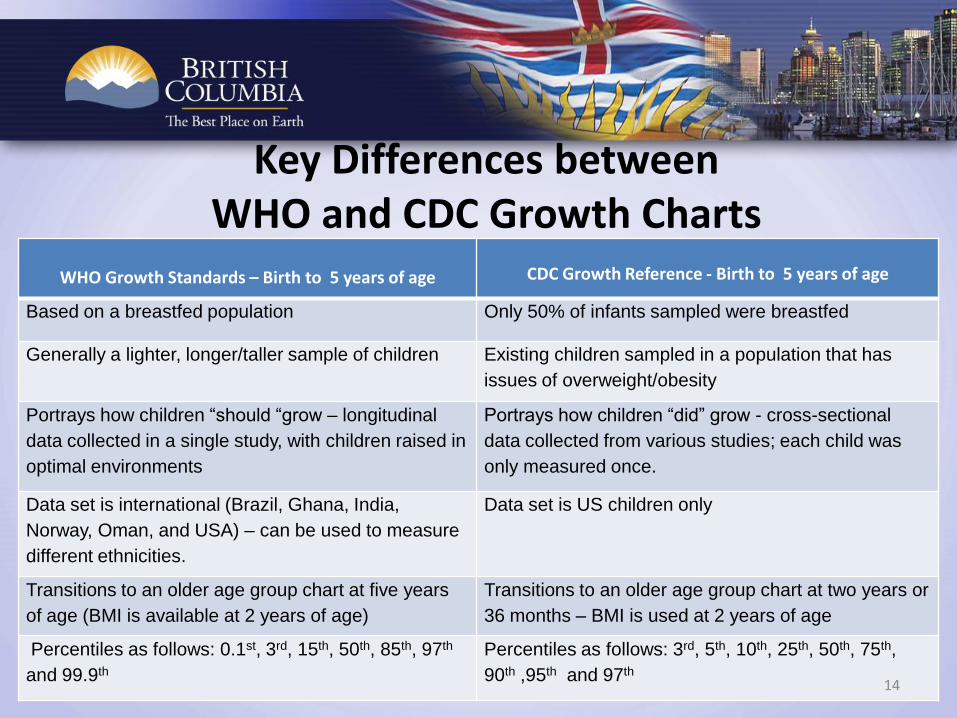
WHO Growth Standards – Birth to 5 years of age CDC Growth Reference - Birth to 5 years of age
Based on a breastfed population Only 50% of infants sampled were breastfed
Generally a lighter, longer/taller sample of children Existing children sampled in a population that has
issues of overweight/obesity
Portrays how children “should “grow – longitudinal
data collected in a single study, with children raised in
optimal environments
Portrays how children “did” grow - cross-sectional
data collected from various studies; each child was
only measured once.
Data set is international (Brazil, Ghana, India,
Norway, Oman, and USA) – can be used to measure
different ethnicities.
Data set is US children only
Transitions to an older age group chart at five years
of age (BMI is available at 2 years of age)
Transitions to an older age group chart at two years or
36 months – BMI is used at 2 years of age
Percentiles as follows: 0.1st, 3rd, 15th, 50th, 85th, 97th
and 99.9th
Percentiles as follows: 3rd, 5th, 10th, 25th, 50th, 75th,
90th ,95th and 97th
Key Differences between WHO and CDC Growth Charts
14

Breast Fed versus Formula Fed on the WHO Growth Charts
• The growth of breastfed infants: – will no longer look as though they are growing too rapidly during the first
six months nor will they look as if they are failing to grow adequately from six to twelve months.
– growth curve will track fairly consistently along a major percentile.
• The growth of formula fed infants:– in the first 6 months may now be observed to track lower on the WHO
growth curves than breastfed infants - may be misinterpreted as growth faltering.
– growth curve will show a correction and a general increasing growth trajectory after 6 months.
15

Pre-Term and Very Low Birth Weight Infants
• WHO Growth Charts can be used for monitoring after discharge
– the growth of preterm infants (less than 37 weeks gestation at birth) with age correction (see slide 23)
– the growth of Very Low Birth Weight infants (born < 1500 grams).
• Alternate charts may also be used (Fenton’s, Infant Health and Development Program).
16

Disorders That Can Affect Growth
• WHO growth charts can be used to assess growth patterns for children with intellectual, developmental, genetic or other disorders
– Other growth charts may provide additional information (e.g. Prader Willi, Down Syndrome growth charts).
17

Body Mass Index (BMI) for 2 - 19 years
• Serial BMI measurements are required to properly monitor growth in children and adolescents over 2 years of age.
• Effective screening tool to identify potential wasting, overweight and/or obesity.
• Reference BMI calculation = – Weight (kg) ÷ Height (cm) ÷ Height (cm) X 10,000 OR– Weight (lb) ÷ Height (in) ÷ Height (in) x 703
18

Using Growth Charts
19

What is Growth Monitoring?• A series of weight and length/height measurements over time
reflect a child’s growth pattern– One time measures reflect a child’s size and may be used to screen
for nutritional risk only.
• Canadian Paediatric Society suggests the following monitoring intervals:
– Baseline measurements at birth– Within 1 to 2 weeks of birth– At 2, 4, 6, 9, 12, 18 and 24 months– 1 time per year after age 2 to 19 years of age.
20

Essential Activities
1. Accurately determine age.
2. Accurately measure weight, length/height and head circumference.
3. Plot measurements on appropriate growth chart.
4. Correctly interpret and assess the pattern of growth.
5. Gather additional information to contribute to the assessment.
6. Discuss growth pattern with parent/caregiver and agree on subsequent action if required.
21

Steps to Plot Growth
• To determine age accurately:– Count age in weeks for first 12 months
E.g. 3 calendar months = 13 weeks
– Use calendar months thereafter to 2 years
– After 2 years round to the nearest ¼ year.
• Obtain accurate weight, length/height, head circumference measures.
• Select the appropriate paper growth chart.
• Record all data to identify growth curve or trajectory.22

Correcting Age for Prematurity (< 37 weeks)
• Corrected postnatal age – is used until 24 months postnatal age– is based on 40 weeks gestation.
• Calculate corrected age as follows: – [Current postnatal age in weeks subtract (40 weeks gestation
subtract age in weeks at birth) equals corrected age in weeks]
e.g. At 14 weeks postnatal age, an infant born at 30 weeks gestational age would be 4 weeks ‘corrected’ postnatal age: [14 - (40 – 30)] = 4 weeks corrected age.
23

Describing a Plotted Point
Major Percentile Curves
• 0.1, 3, 15, 50, 85, 97, 99.9
Point A
Point A is on the 97th percentile therefore child is at the 97th
percentile.
Point B
Point B is between the 50th and the 85th percentile therefore child is between the 50th and 85th
percentiles.
24

Growth Assessment and Monitoring
25

Normal Growth in Healthy Infants and Children
• Typically follows the same growth curve or trajectory over
time.
• A growth curve between the 3rd and 85th percentile that
parallels the 50th percentile.
• Any variability in growth curve typically happens during the
first two years of life and during puberty.
• Weight should be proportional to the height and length.
26

Growth Trajectories in the Early Years• Weight gain approximations:
– Regain birth weight by 14 days
– Double birth weight by four to five months
– Triple birth weight by 12 months
– Gain 3 ½ times birth weight by two years
• Length:
– Weight should be proportional to the length/height
• Head Circumference – At birth, the average is 35 cm and increases an average 1 cm/month
during the 1st year
27

Assessing Measurements on a Growth Chart
1. Look at each plotted measurement:• weight, length/height, weight for length or BMI• head circumference (if appropriate).
2. Compare all measures together to identify:• percentile rank (3rd, 15th, 50th, etc)• if growth is proportional (relationship between all
measurements) • the growth curve and pattern of growth.
3. Gather additional assessment information on child’s health and life situation (slide 29).
28

Additional Assessment Information
Consider:
• Parental Height
• Infant feeding practices
• Hydration (e.g. Number of wet diapers)
• Gestational age and birth weight
• Parent information on child’s growth, health, and eating
• Special health care needs, recent acute or chronic illness
• Family food habits, meal patterns, food security, and history of disordered eating
• Stress or change in the child’s life or family situation29

Interpreting Growth
Consider :• Is the weight and length/height proportional?• Is the head circumference appropriate for age?• Does the child’s growth follow a consistent
pattern?• Is growth between the 3rd and 85th percentiles?• Are there health issues or factors from the
additional information gathered impacting growth?
30

Normal Growth Patterns - Routine MonitoringThese are normal patterns of growth tracking parallel to the 50th percentile
Child is growing at the 50th
percentileChild is growing between
the 3rd and 15th percentilesChild is growing between the
50th and 85th percentiles 31

Normal Variability in Percentile Curves
The growth line on both curves indicates a shift of almost two major percentiles within the first year of life.
No growth concern was identified based on additional information collected on the child.
A shift in growth up to two major percentile curves may be ‘normal’
• in first two to three years of life• during puberty
32

What to Look for When Assessing Growth Concerns
• Age when growth pattern change began
• Direction of growth pattern change
• Time period the change took place
• Number of percentile shifts
• Comparison to the recommended cut off criteria
• Issues identified in the additional assessment information collected
• Parental concerns
33

Recommended Cut Off Criteria –Indicators for Further Assessment
Growth Concern Growth Indicator Birth to 2 yearspercentiles
2 to 5 yearspercentiles
5 to 19 yearspercentiles
Underweight Weight-for-Age < 3rd < 3rd < 3rd
Severely underweight Weight-for-Age < 0.1st < 0.1st <0.1st
Stunted Height/Length-for-age < 3rd < 3rd < 3rd
Severely stunted Height/Length-for-age < 0.1st < 0.1st < 0.1st
Wasted Weight-for-Length < 3rd < 3rd (Use BMI-for-Age) < 3rd (Use BMI-for-Age)
Severely wasted Weight-for-Length < 0.1st < 0.1st (Use BMI-for-Age) < 0.1st (Use BMI-for-Age)
Risk of overweight Weight-for-Length > 85th > 85th (Use BMI-for-Age) N/A
Overweight Weight-for-Length > 97th > 97th (Use BMI-for-Age) >85th (Use BMI-for-Age)
Obese Weight -for-Length > 99.9th > 99.9th >97th
Severely Obese BMI-for-Age N/A N/A >99.9th
Head circumference Head Circumference < 3rd or > 97th N/A N/A34

What is a Growth Concern
• Weight-for-Age, Length-for-Age, or Weight-for-Length at < 3rd percentile – This is the recommended cut off criteria for further assessment for possible
underweight, stunting (shortness), and wasting (thinness).
– At 0.1st percentile, only 1 in 1000 children will grow at this curve.• The recommended cut off criteria for overweight:
– Weight-for-Length at > 97th percentile for birth to two years of age.
– Weight-for-Length at > 85th percentile from five to 19 years of age.
• A sharp incline or decline in one or more growth measures (weight,
length/height, head circumference).
• A growth line that remains flat over time.
• A sudden and unexpected change from the child’s typical growth pattern.
35

When Further Observation Is Required?
• Consistent pattern of growth at < 3rd percentile or > 85th percentile.• Growth line crosses 1 major percentile curve with a shift either
away from or towards the 50th percentile.• Variances in family feeding practices (e.g. high juice intake, frequent
snacking, excessive formula intake, limited income).• Parent concern regarding growth trend.
Refer to a Registered Dietitian (RD): • In your Health Authority• Call 8-1-1 and ask to speak to a registered dietitian (www.healthlinkbc.ca)• In private practice (fee for service - www.dietitians.ca)
• to determine if a RD is a practicing member of the BC College of Registered Dietitians (https://pacific.alinity.com/cdbc/webclient/publicregister.aspx)
36

Moderate Concern-Observation Required
Growth line crosses 1 major percentile curve with a shift towards the 50th.
Growth line crosses 1 major percentile curve with a shift away from the 50th.
Consistent pattern of growth at < 3rd percentile OR > 85th percentile. 37

When Further Investigation Is Required Unexplained growth including:
• Sharp upwards or downwards trend over a short period of time when child crosses 1 major percentile curve and prior to crossing 2 major percentile curves
• Growth at < 3rd percentile or > 97th percentile
• Consistent flat growth trend
• Concerns such as poor nutritional intake, presence of a chronic illness, etc.
Child should be referred to appropriate resource:• Family Physician/General Practitioner
• Paediatrician
38

High Concern - Referral RequiredAny sharp incline in the growth line:
• This is a very significant change in thechild’s growth.
• Changes in weight or length/height shouldbe investigated before a child crosses two major percentile lines.
• An unexplained sharp incline may signal a change in feeding practices - may lead to a child being overweight.
• A sharp incline in a previously ill or undernourished child may be “catch up” growth expected in the re-feeding period.
• Further medical investigation is required.
39

High Concern – Referral RequiredAny sharp decline in growth line:
• This is a very significant change in the child’s growth.
• A sharp decline in a normal or undernourished child indicates a growth disturbance.
• Changes in weight or length/height should be investigated before a child crosses two major percentile lines.
• Further medical investigation is required.
40

High Concern – Referral Required
A flat growth line:
• Child is not growing consistently.• When growth rate is rapid during
first six months of life, even a one month flat line in growth represents a possible concern.
• Further medical investigation is required.
41

Discussing Growth
with Parents and Caregivers
42

Principles for Talking to Parents/Caregivers about Growth
• Adopt a non-judgemental attitude.
• Use neutral language to describe child’s growth.
• Raise issues constructively and sensitively.
• Support families to identify and take action on healthy lifestyle changes.
43

Talking to Parents/Caregivers
1. Initiate discussion of child’s growth pattern at first well-baby visit and continue at each visit
• Explain that the purpose of growth monitoring is to see if the child is growing consistently.
2. Help parents to understand their child’s pattern of growth• Explain the points on the growth chart and describe any
trends clearly and simply, without medical jargon.
44

Talking to Parents/Caregivers
3. Reinforce or motivate positive feeding and healthy lifestyle practices
• If the child is growing consistently, be sure to say so.
4. Involve parents and older children and consider extended family in decision making
• If growth concerns are identified, focus on the health implications and identify possible plan of action.
45

Resources
• A list of resources is available in the appendices for:
– Parents
– Health care providers
46

Case Study
47

Case Study Instructions • Select the appropriate growth chart(s)
• Plot the measurements
• Review the scenario and serial growth measurements
• Interpret the results
• Identify additional information needed (see slide 29)
• Identify what action is required
• Describe the results
48

Case Study Scenario
• Baby Georgia was born at term to small parents
• Weight was 3076 grams, length was 49 cm, head circumference was 34 cm.
• She was breastfed exclusively from birth.
• At 6 months she was introduced to solids as per feeding guidelines.
49

Case Study Data PointsGESTATIONAL AGE AT BIRTH_______39______WEEKS
DATE AGE LENGTH (cm) WEIGHT
(grams)
HEAD CIRC.
(cm)
COMMENTS
2009-01-01 BIRTH 49 3076 34
2009-01-23 3 weeks n/a 4000
2009-03-03 2 months 56 4868
2009-05-05 4 months 59.5 5764
2009-07-05 6 months 63 6435
2010-01-07 12 months 69.5 7420
2010-02-20 13.5 months 70.5 7600
50

Questions to Consider 1. Which chart(s) would you use to monitor growth?
2. What pattern of growth are you seeing and how would you interpret the growth curve?
3. What additional information would you consider?
4. What conclusions would you draw from the measurements and pattern of growth on the growth chart?
5. How would you monitor growth and what actions/next steps would you take?
51

Answers to Case Study 1. Which chart(s) would you use to monitor growth?
• Girls – Birth -24 months Length-for-Age and Weight-for-Age percentiles.• Girls – Head Circumference and Weight-for-Length percentiles.
2. What pattern of growth are you seeing and how would you interpret the growth curve?Length-for-Age shifted from the 50th percentile to the 3rd percentile over a 13 month period. Weight-for-Age was initially at the 50th percentile. After an increase in growth trajectory at 3 weeks of age, her weight shifted gradually over a 13 month period to track just above the 3rd
percentile at twelve months of age. Head Circumference was at the 50th percentile at birth. Weight-for-Length growth curve tracks around the 50th percentile then gradually shifts to the 15th percentile.
3. What additional information would you consider?• See slide 29 for ‘additional assessment information’.
52

Answers to Case Study (continued) 4. What conclusions would you draw from the measurements and pattern of
growth on the growth chart?– Baby Georgia’s Weight-for-Age was initially at the 50th percentile. – After an initial expected weight gain at 3 weeks of age, her weight shifted gradually
over a 14 month period to track just above the 3rd percentile after two months of age. Her length also shifted from the 50th percentile to the 3rd percentile over this same time period. Weight-for-Length shows initially at the 50th percentile then gradually shifts to the 15th percentile.
– It appears that Baby Georgia is shifting downwards and may elicit concern. Based on the measurements, the time period, and additional information gathered raised no concerns, the growth curve may be normal. Monitoring next plotting is required to determine if further investigation is warranted.
– Note that when plotted on the CDC growth chart this child was identified as failure to thrive at about 6 months of age and referred to the registered dietitian .
53

Answers to Case Study (continued)
5. How would you monitor growth and what actions/next steps would you take?
Monitoring: Routine.• Anticipatory Guidance: Positive reinforcement on current feeding
practices including continuing to breastfeed. • Confirm positive feeding relationship and encourage development of
physical milestones.• Monitor Georgia to ensure that the growth trajectory is not continuing
downward. If next plot is dropping, refer to physician for further investigation.
54

Weight-for-Age Birth to 24 Months
55
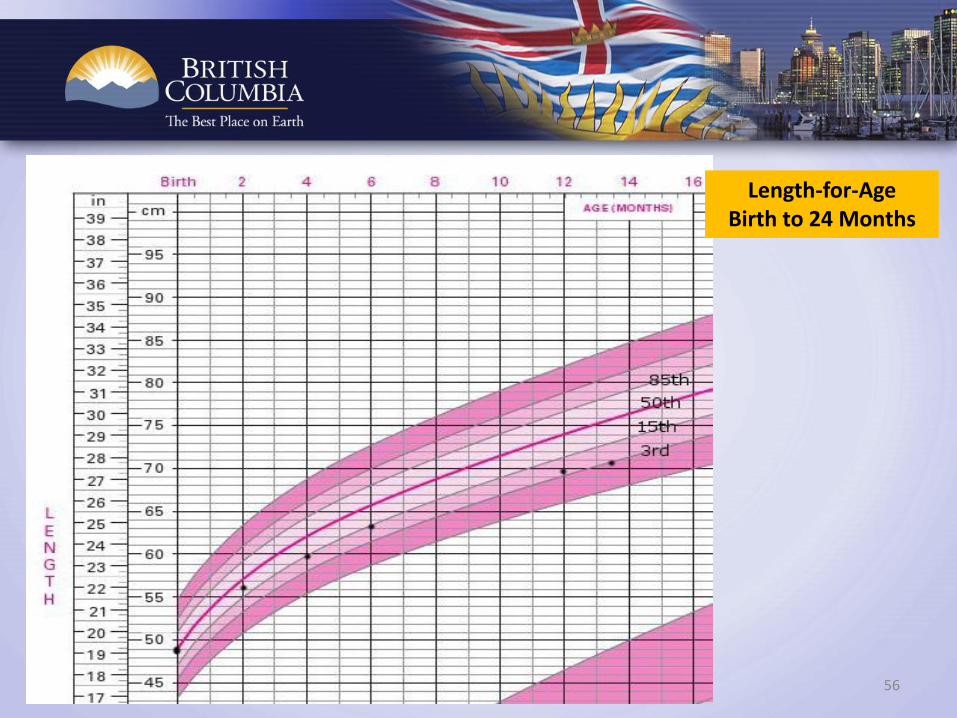
Length-for-AgeBirth to 24 Months
56

Head Circumference
57

Weight for LengthBirth to 24 months
Weight for Length is the most important comparative measurement.
It is a critical measurement to identify monitoring frequency and next steps.
58

Case Study # 1 Breastfed InfantComparison of CDC and WHO Growth Chart - Weight-for-Age
59
CDC - Birth to 2 years Weight for Age

Additional Reference Materials
• Please visit the Dietitians of Canada website for additional materials:
– Collaborative statement on WHO Growth Charts
– Health Professionals Guide for Using the New Growth Charts
– Q and A for Health Professionals
– Q and A for Parents(www.dietitians.ca/Secondary-Pages/Public/Who-Growth-Charts.aspx)
60