who guidelines onwho guidelines on stability evaluation · pdf filewho guidelines onwho...
TRANSCRIPT

WHO Guidelines onWHO Guidelines on Stability Evaluation of Vaccines
Presented by Tim SchofieldDirector, US Regulatory AffairsGSK BiologicalsGSK Biologicals

WHO Guidelines on Stability Evaluation of Vaccines
The views and opinions expressed in the following PowerPoint slides are those of the individual presenter and should not be attributed to Drug Information Association, Inc. (“DIA”), its directors, officers, employees, volunteers, members, chapters, councils, Special Interest Areavolunteers, members, chapters, councils, Special Interest Area Communities or affiliates, or any organization with which the presenter is employed or affiliated.
These PowerPoint slides are the intellectual property of the individual presenter and are protected under the copyright laws of the United States of America and other countries. Used by permission. All rights reserved. Drug Information Association DIA and DIA logo are registered trademarks orInformation Association, DIA and DIA logo are registered trademarks or trademarks of Drug Information Association Inc. All other trademarks are the property of their respective owners.
2www.diahome.orgDrug Information Association

Outline
• Overview of WHO GuidelineOverview of WHO Guideline• Stability quality attributes• Basic principles of vaccine stabilityBasic principles of vaccine stability• Stability during development• Stability supporting licensure• Stability supporting licensure• Post licensure stability evaluation• Challenges to implementation• Challenges to implementation
Drug Information Association www.diahome.org 3

Overview of WHO Guidelines
• Acknowledges the importance of stability to the success of immunizationstability to the success of immunization programs worldwide
• Provides a scientific basis and guiding g gprinciples for evaluation of stability over the vaccine lifecycle– For the purpose of clinical trial
monitoringg– For licensing– For post licensure monitoring
• Adopted by the 57th meeting of the• Adopted by the 57th meeting of the WHO Expert Committee on Biological Standarization, 23-27 October 2006
Drug Information Association www.diahome.org 4

Overview of WHO Guidelines (cont.)
• Supported by pp yimplementation workshops
Seoul Korea (Apr 2008)– Seoul, Korea (Apr 2008)– Geneva, Switz. (Oct 2008)
• Workshop proceeding published in a special issue of Biologicalsissue of Biologicals, November 2009, 37(6)
Drug Information Association www.diahome.org 5

Stability Quality Attributes
• Stability quality attributes should include those properties which impact safety and/or efficacywhich impact safety and/or efficacy– e.g., potency, sterility, etc.
• Note: all properties change over time; thus any parameter related to safety and/or efficacy should be part of the vaccine stability program
• Stability quality attributes should also include propertiesStability quality attributes should also include properties which impact stability over the course of shelf-life– e.g., increase in moisture over time for a lyophilized vaccine
• Similarly properties which impact stability should be part of the release specification for the product– Moisture of a lyophilized vaccineMoisture of a lyophilized vaccine– pH of an adjuvanted vaccine
Drug Information Association www.diahome.org 6

Basic Principles of Vaccine Stability
• A scientific basis of stability begins with d t di h i d dunderstanding how vaccines degrade
– First order kinetics• The rate of decay is [C] dependent Po
tenc
y
td d tik
potency, initialP where
,ePPotency
0
tk0
=
⋅= ⋅−
0 6 12 18 24 30 36
Time (Months)
• Linear in log potency
rate.ndegradatiok =
tk)Pl ()P tl ( (Pot
ency
)
– The log transformation also “normalizes” potency measurements, and “stabilizes”
i bilit th t
tk)Pln()Potencyln( 0 ⋅−=
0 6 12 18 24 30 36
Time (Months)
ln(
variability across the potency range
Drug Information Association www.diahome.org 7

Basic Principles of Vaccine Stability (cont.)
• A first order kinetics equation (log of potency) is fit to vaccine stability data using least squares regression 3 2
3.43.63.84.0
/mL
Me Stability
3 23.43.63.84.0
/mL
Me Stability
q g• Like all statistical estimates,
the least squares regression ti i i t d ith
2.02.22.42.62.83.03.2
log 1
0TC
ID50
/
2.02.22.42.62.83.03.2
log 1
0TC
ID50
/
equation is associated with variability– This can be expressed as a
0 6 12 18 24 30 36Time (Months)
0 6 12 18 24 30 36Time (Months)
confidence interval on the regression line
– Forms the basis for ICH shelf-life determinationdetermination
Drug Information Association www.diahome.org 8

Basic Principles of Vaccine Stability (cont.)
• Study design should acknowledge the goal of the stability studystability study– ICH intervals are designed to provide sufficient data at time of filing– Statistical design can be used to minimize uncertainty
4.95.15.35.5
mL
Usual ICH Intervals– Shelf-life Determination
• Data clustered at the desired shelf-life will minimize impact of uncertainty on SL
– Determination of loss rate• Testing at beginning and end will
reduce uncertainty on the loss rate
3.43.63.84.0
mL
Me Stability
3.53.73.94.14.34.54.7
0 6 12 18 24 30 36
log 1
0TC
ID50
/m
5.5
Centered on 24-Months
uncertainty on SL determination
Design 1
Design 2
2.02.22.42.62.83.03.2
0 6 12 18 24 30 36
log
10T
CID
50/m
0 6 12 18 24 30 36Time (Months)
3.94.14.34.54.74.95.15.3
log 1
0TC
ID50
/mL
0 1 2 3 4 5
Design 1 Design 21 12 13 44 4
0 6 12 18 24 30 36Time (Months)
Drug Information Association www.diahome.org 9
3.53.73.9
0 6 12 18 24 30 36Time (Months)
4 4sb=0.45 sb=0.33
Reduction=25%

Stability During Development
• Strategic use of accelerated stability dataU d t di i t bilit– Understanding vaccine stability
• Mechanism of degradation• Kinetics model
– Formulation development– Impact of bulk stability on final product stability
• in lieu of sequential stability
– Benchmark for vaccine changes 0
1
Arrehnius Plot
changes• Process change• Facility change
-8-7-6-5-4-3-2-10
ln(k
)
Drug Information Association www.diahome.org 10
-9-8
0.003 0.0032 0.0034 0.00361/|T|
T 60C 45C 30C 22C 10C 5C

Stability During Development (cont.)
• Use clinical stability to define what the subject
Clinical Stability
Regression
Upper Bound
received, and thereby specifications– Using immunogenicity
Pote
ncy
as the endpoint, interpolate the potency associated with a clinical correlate of
Res
pons
e
0 6 12 18 24Time (Months)
clinical correlate of efficacy
– Using efficacy as the endpoint, perform a
Dose
80%
100%
p , plogistic analysis and interpolate the dose corresponding to
d i d ffi 0%
20%
40%
60%Protected
Unprotected
Logistic
a desired efficacy claim
Drug Information Association www.diahome.org 11
0%
Dose

Stability Supporting Licensure
• Shelf-life determination –Long Term Stability at 2-8 C
4 0
measles example– Is shelf-life 12-months due
to a stability measurement EAC
2 5
3.0
3.5
4.0
y (lo
g10
TCID
50/D
ose)
Lot 1
Lot 2
Lot 3EACto a stability measurement at 18-months for lot 2 which falls below the expiry acceptance criteria (EAC)?
• “Compliance Model”
2.0
2.5
0 6 12 18 24 30 36
Time (Months)
Pote
ncy
Shelf-Life = 12-months
• Compliance Model– ICH Q1E defines shelf-life
as the time where the lower bound on the confidence
Shelf-Life Determination (All Lots)
3.6
3.8
4.0
mL
Lot 1Lot 2Lot 3RegressionLower BoundMin. Req.
interval intersects the EAC• “Estimation Model”• Risk based approach
2 6
2.8
3.0
3.2
3.4lo
g 10T
CID 5
0/
Shelf-Life = 24-months
EAC
Drug Information Association www.diahome.org 12
2.60 6 12 18 24 30 36
Time (Month)
Stability Supporting Licensure (cont.)
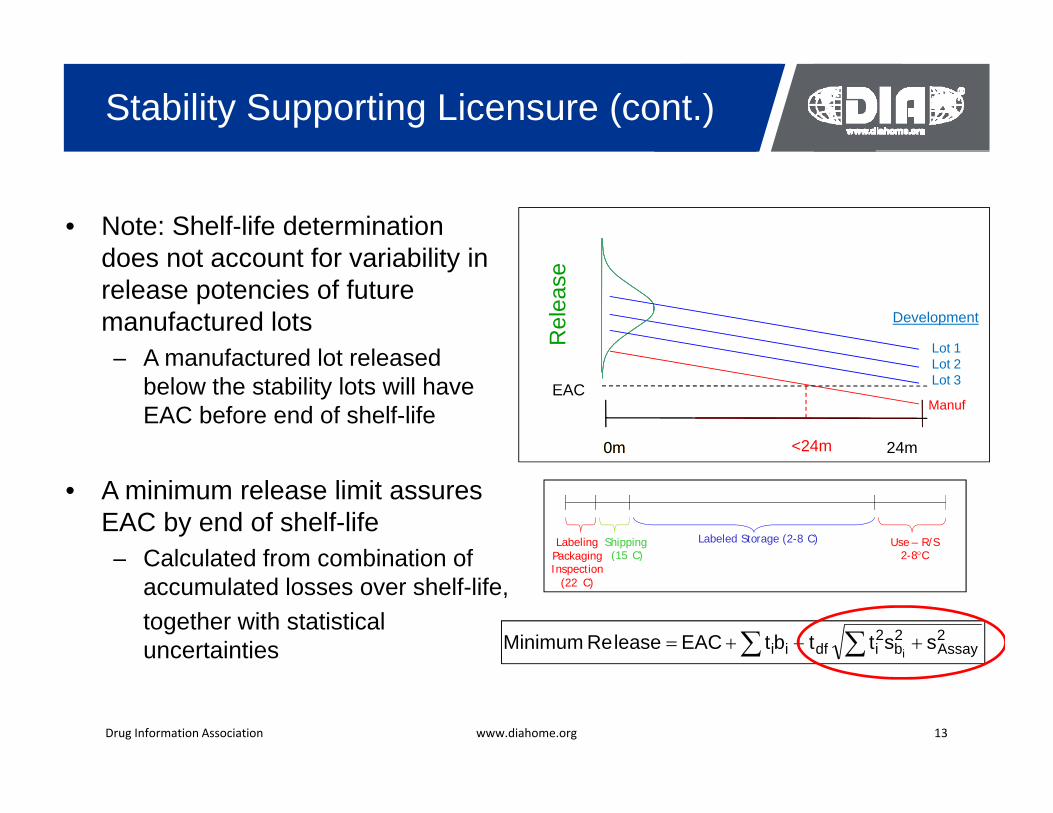
• Note: Shelf-life determination does not acco nt for ariabilit indoes not account for variability in release potencies of future manufactured lots
A manufactured lot released
Rel
ease
Lot 1
Development
– A manufactured lot released below the stability lots will have EAC before end of shelf-life Manuf
0m0m 24m
Lot 2Lot 3
EAC
<24m
• A minimum release limit assures EAC by end of shelf-life– Calculated from combination of
LabelingPackaging
Shipping (15 C)
Labeled Storage (2-8 C) Use – R/S2-8°C– Calculated from combination of
accumulated losses over shelf-life, together with statistical uncertainties
g gInspection
(22 C)
( )
∑ ∑ +++= 2Assay
2b
2idfii ssttbtEACleaseRe Minimum
i
Drug Information Association www.diahome.org 13

Post Licensure Stability Evaluation
• Similar to shelf-life determination, stability modeling should be tili d t ti t d t lit d i t bilit it iutilized to estimate product quality during stability monitoring– Highly variable measurements yield sporadic stability OOS results– The stability model yields a more precise estimate of vaccine quality
Regression versus Individual Stability Time PointRegression versus Individual Stability Time Point
ten
cyte
ncy
PoPo
t
Drug Information Association www.diahome.org 14
0 6 12 18 24 30Time (Months)
0 6 12 18 24 30Time (Months)
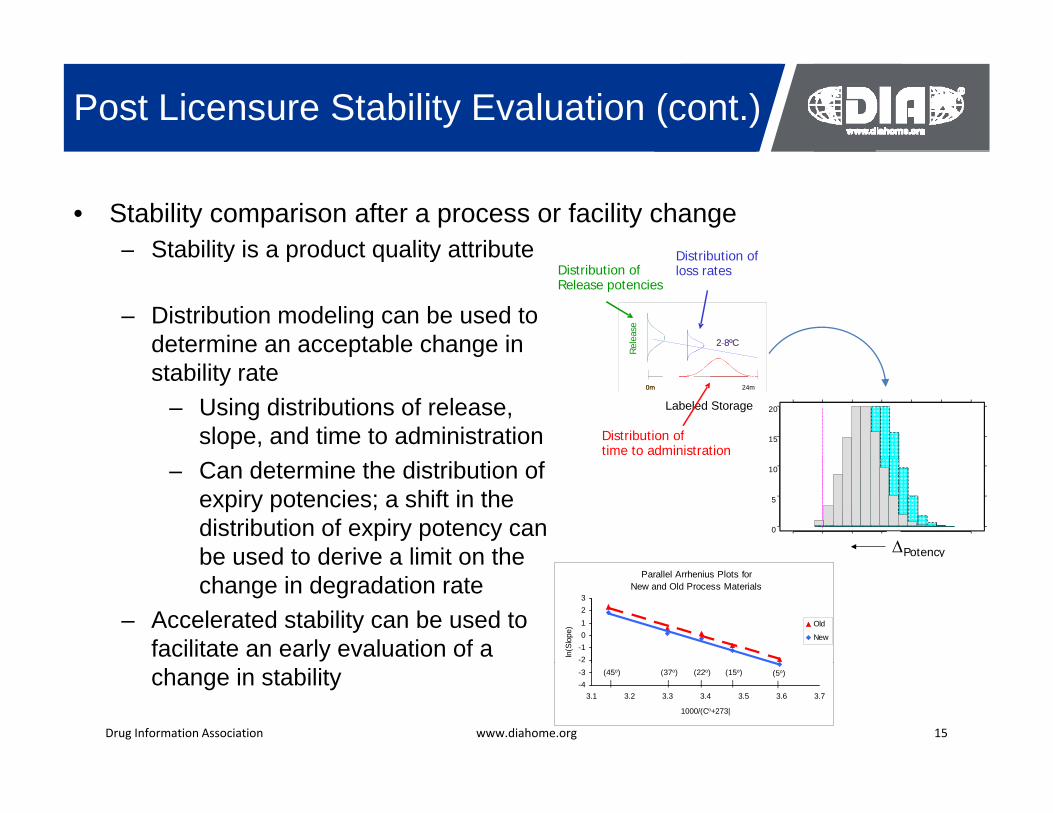
Post Licensure Stability Evaluation (cont.)
• Stability comparison after a process or facility change– Stability is a product quality attribute Dist ib tion ofStability is a product quality attribute
– Distribution modeling can be used to determine an acceptable change in
Distribution ofloss rates
2-8ºC2-8ºC
Rel
ease
Distribution ofRelease potencies
p gstability rate
– Using distributions of release, slope, and time to administration 15
20
Distribution oftime to administration
0m0m 24m
Labeled Storage
– Can determine the distribution of expiry potencies; a shift in the distribution of expiry potency can be used to derive a limit on the
0
5
10
ΔΔPotencybe used to derive a limit on the change in degradation rate
– Accelerated stability can be used to facilitate an early evaluation of a
Parallel Arrhenius Plots for New and Old Process Materials
-2-10123
ln(S
lope
) Old
New
Drug Information Association www.diahome.org 15
change in stability -4-3
3.1 3.2 3.3 3.4 3.5 3.6 3.7
1000/(Co+273|
(45o) |
(37o) |
(22o) |
(15o) |
(5o) |

Challenges to Implementation
• Statistical thinking and modeling– Appreciation of variability and risk– Growing awareness of the need for skilled
statisticians in nonclinical developmentstatisticians in nonclinical development• Statistical approaches to bioassay development,
validation, and maintenance• Application of design of experiments to support quality
by design• Statistical process controlStatistical process control• Stability modeling and comparability strategies
– Statistical training of industry and regulatory scientists– User friendly software solutions
Drug Information Association www.diahome.org 16

Challenges to Implementation (cont.)
• Inaccurate stability modeling can lead to poor estimates of vaccine shelf-lifeof vaccine shelf life– The default model for
stability of vaccines is a 1st order kinetics model
Stability Kinetics0‐order
1st order
1 order kinetics model– Modeling by 0-order
kinetics can lead to underestimation of shelf- 0 6 12 18 24underestimation of shelflife, and limitations on vaccine supply
– Some vaccines degrade 4.505.005.50
cyt0031.0t0840.0
tb2
tb1
e72.1e43.3
eaeaPotency log 21
⋅−⋅−
⋅⋅
⋅+⋅=
⋅+⋅=
Time (Month)
Some vaccines degrade by higher order kinetics, leading to complex stability modeling 2.00
2.503.003.504.00
0 6 12 18 24
ln P
oten
c
Drug Information Association www.diahome.org 17
y g0 6 12 18 24
Time (Months)

Challenges to Implementation (cont.)
• Harmonization of stability modeling and stability monitoringICH shelf life determination ses a model of the mean prod ct
Observations
Regression
X Observations
Regression
X ObservationsRegression
X– . . . however, stability OOS lt it d d i t
– ICH shelf-life determination uses a model of the mean product stability profile
g
Lower 95% CI
X
X
X
X
X
Regression
Lower 95% PI
X
X
X
X
X
Lower 95% CILower 95% PI
X
X
X
X
X
results are cited during post licensure studies• Ex., a batch which yields a
24 month shelf life pre
0 4 8 12 16 20 24 28 32
X
X
0 4 8 12 16 20 24 28 32
X
X
0 4 8 12 16 20 24 28 32
5%9%
18%
X
X24-month shelf-life pre-licensure would have a ~30% chance of yielding a stability OOS if tested post
Time (Months)Time (Months)0 4 8 12 16 20 24 28 32
Time (Months)
Probability of OOS= 1-(0.95x0.91x0.82) = 29%
licensure– Post licensure data should
be statistically modeled to
Probability of OOS=1 – (0.95*0.91*0.82) = 29%
Drug Information Association www.diahome.org 18
reduce risk of failing a good lot
Challenges to Implementation (cont.)
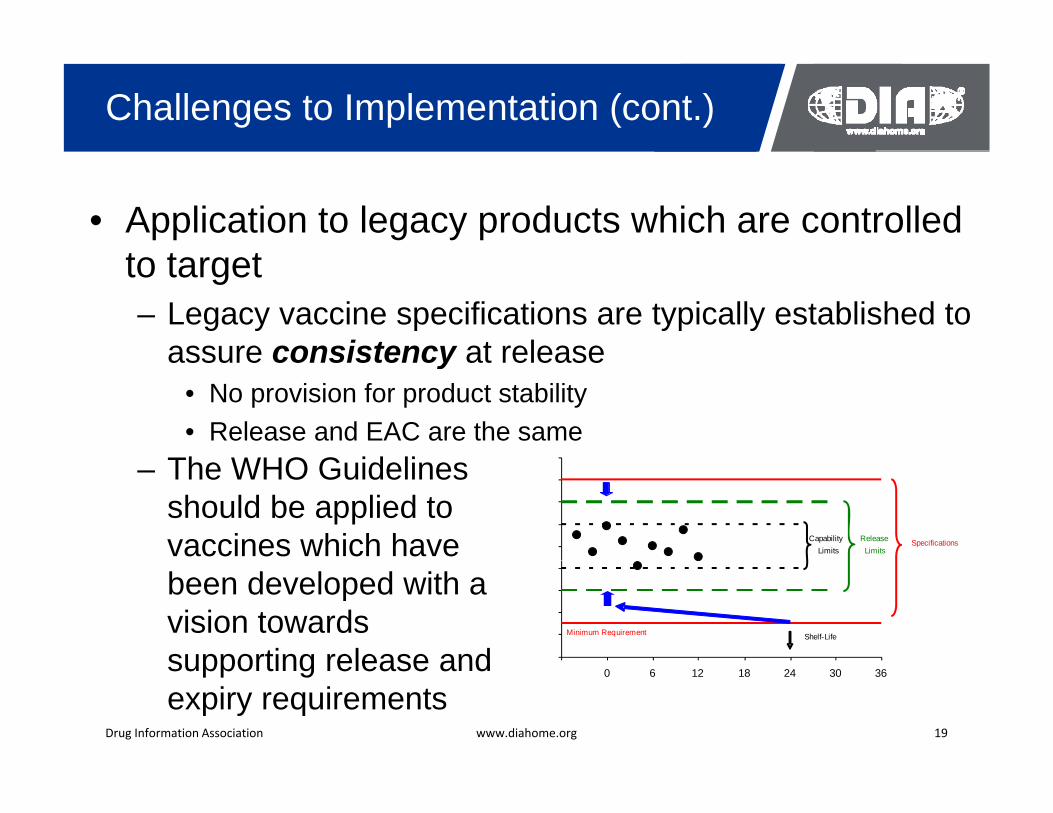
• Application to legacy products which are controlled t t tto target– Legacy vaccine specifications are typically established to
assure consistency at releaseassure consistency at release• No provision for product stability• Release and EAC are the same
Th WHO G id li– The WHO Guidelines should be applied to vaccines which have SpecificationsRelease
LimitsCapability
Limits
been developed with a vision towards supporting release and
Shelf-LifeMinimum Requirement
Drug Information Association www.diahome.org 19
supporting release and expiry requirements
-6 0 6 12 18 24 30 36
Summary
• The WHO Guidelines on Stability Evaluation of Vaccines yprovides a scientific framework for assuring vaccine quality throughout shelf-lifeA i t t ti ti l d i d l i d th• Appropriate statistical design and analysis reduces the uncertainty in vaccine stability evaluation, and thereby risk
• Implementation of the guidelines has both statistical and practical challenges which must be addressed to help assure adequate supply of quality vaccines to the worldassure adequate supply of quality vaccines to the world
Drug Information Association www.diahome.org 20