who is smarter? academic or cte students? jack elliot jim knight the university of arizona
TRANSCRIPT

Who is Smarter?Academic or CTE
Students?Jack ElliotJim Knight
The University of Arizona

Evaluating Achievement•Widely used standardized
tests may be hampering efforts to improve math and science education, and they hurt minority students the most (Clark Kerr,
President Emeritus U. of CA)

Is there a crisis?•Seldom in the course of
policymaking in the U.S. have so many firm convictions held by so many been based on so little convincing proof.(Susan Chirca, 1992)

Educational Myth # 4People who enter
teaching have little ability and
receive poor education.
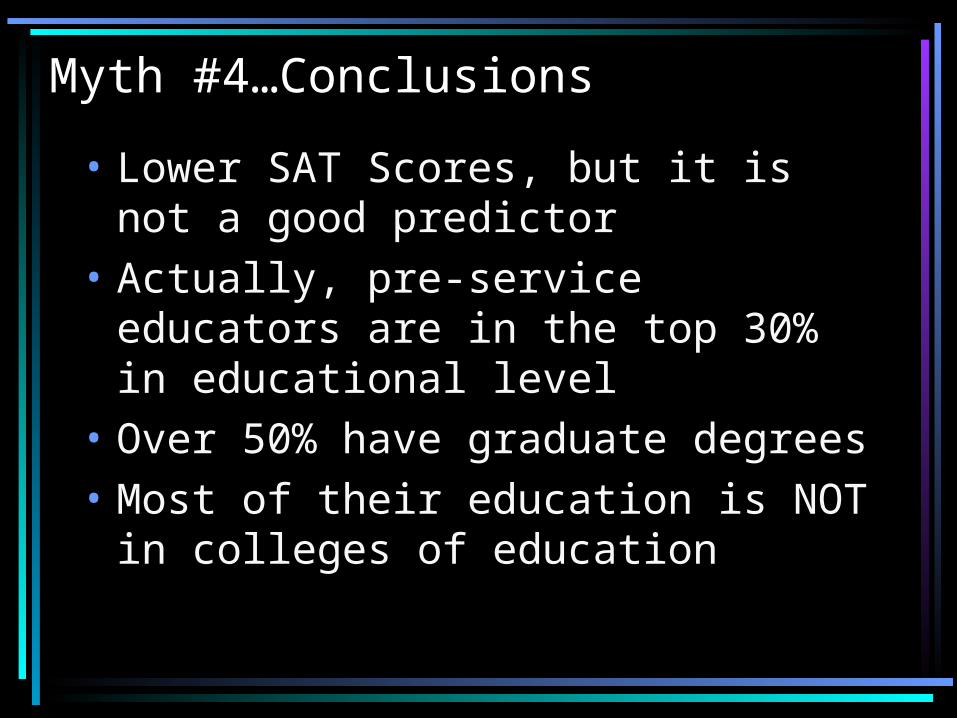
Myth #4…Conclusions
• Lower SAT Scores, but it is not a good predictor
• Actually, pre-service educators are in the top 30% in educational level
• Over 50% have graduate degrees• Most of their education is NOT in
colleges of education

Educational Myth # 3American schools
fail in international comparisons.

Myth #3…Conclusions
• Most comparisons are affected by sampling biases, system differences & inconsistent data collection methods
• Comparisons of technical workforces & the general populace reflect well on US education
• “The opportunity to learn is the single most powerful predictor of student achievement.”
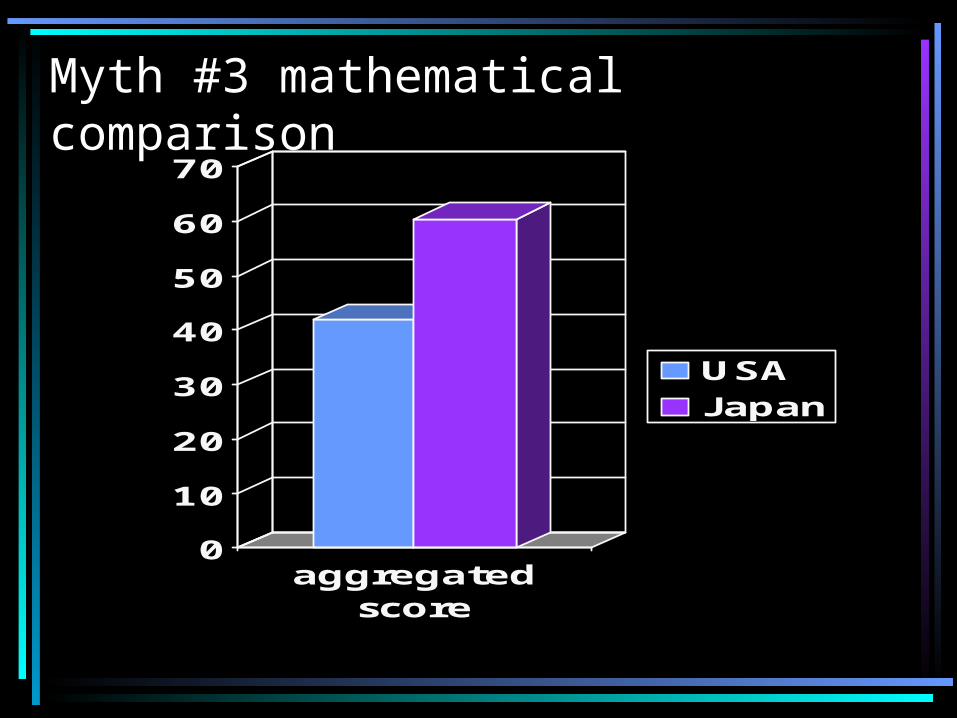
Myth #3 mathematical comparison
0
10
20
30
40
50
60
70
aggregatedscore
USAJapan

Myth #3 mathematical comparison 9th grade
0
10
20
30
40
50
60
70
80
Japanalgebra
USA
remedial
USA
typical
USA
prealgebra
USA
algebra

Educational Myth # 2Post secondary
performance has declined.

Myth #2…Conclusions• There is higher participation
(enrollment) by all groups of people in post secondary education.
• This should be applauded as more people are taking the opportunity to pursue higher education.

Educational Myth # 1Achievement is on
the decline.More money will not
improve achievement.
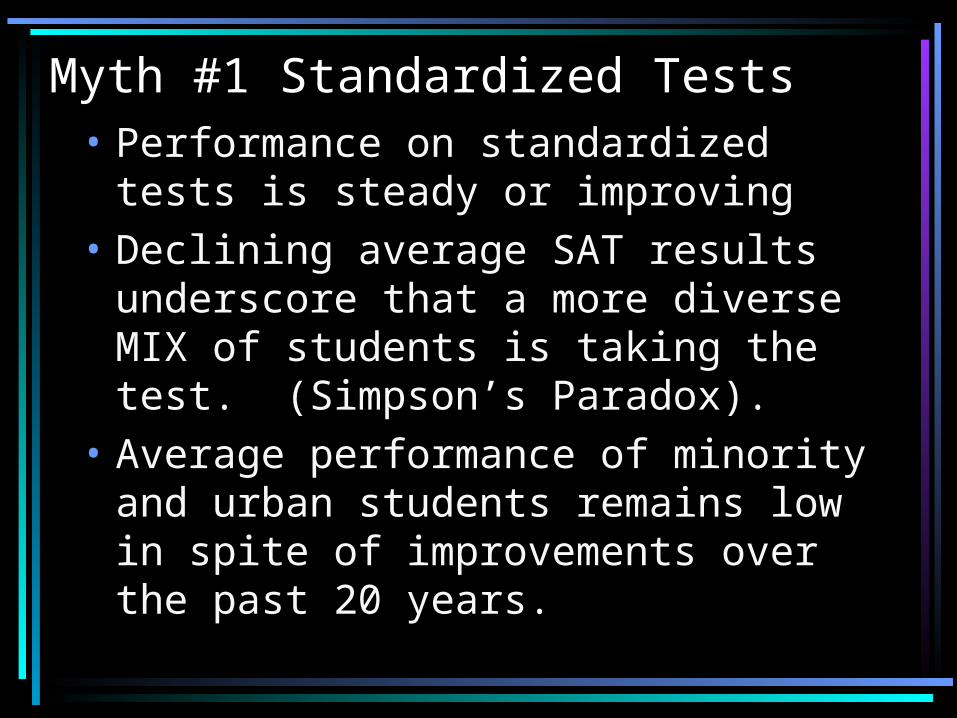
Myth #1 Standardized Tests• Performance on standardized tests
is steady or improving• Declining average SAT results
underscore that a more diverse MIX of students is taking the test. (Simpson’s Paradox).
• Average performance of minority and urban students remains low in spite of improvements over the past 20 years.

Myth # 1 SAT
• Educational Spending Does NOT Improve Achievement– Top 5 states (relatively low spenders on
education)• Iowa• North Dakota• South Dakota• Utah• Minnesota
– #39 – New Jersey (#1 spender on education)

Myth # 1 % who took SAT
• Top 5 states (relatively low spenders on education)– 5% Iowa– 6% North Dakota– 6% South Dakota– 4% Utah– 10% Minnesota
• #39 – New Jersey (#1 spender on education) 76%
? What about diversity?

Myth # 1 SAT Math
• 89% of the variability in students’ math scores can be accounted for with 4 variables:
– Number of parents in the home– Level of parental education– Type of community– Poverty rates for ages 5-17
• (Robinson & Brandon, 1994)

High Stakes Testing
•State Measure Only•Stanford9


Objective:•to compare the Stanford9 test
scores between career and technical education and non-career and technical education students while controlling for extraneous variables:– learning styles, special populations, gender, race, and ethnicity.

Methodology•Static Group Comparison•Stanford9 scores•Arizona graduates (year
2000) from an urban, suburban and rural school–CTE program concentrators–All other students

Principle of Control
•To estimate the true effect of a factor using survey data one MUST control, in the analysis, for the effects of other crucial factors that can affect the relationship.

Extraneous Variables•Gender•Race/Ethnicity•Special Populations•Learning Styles

Data Sources•Schools
– Learning styles – IVEP eligibility
•Arizona Dept. of Ed.– CTE: concentrator, gender, race
ethnicity, IVEP services received– Academic: Stanford9 scores

Results: race
Frequency Percent
White 1547 63.4
Black 65 2.7
Hispanic 336 13.8
American Indian 38 1.6
Asian 63 2.6
Other 167 6.8
Missing 224 9.2
Total 2440
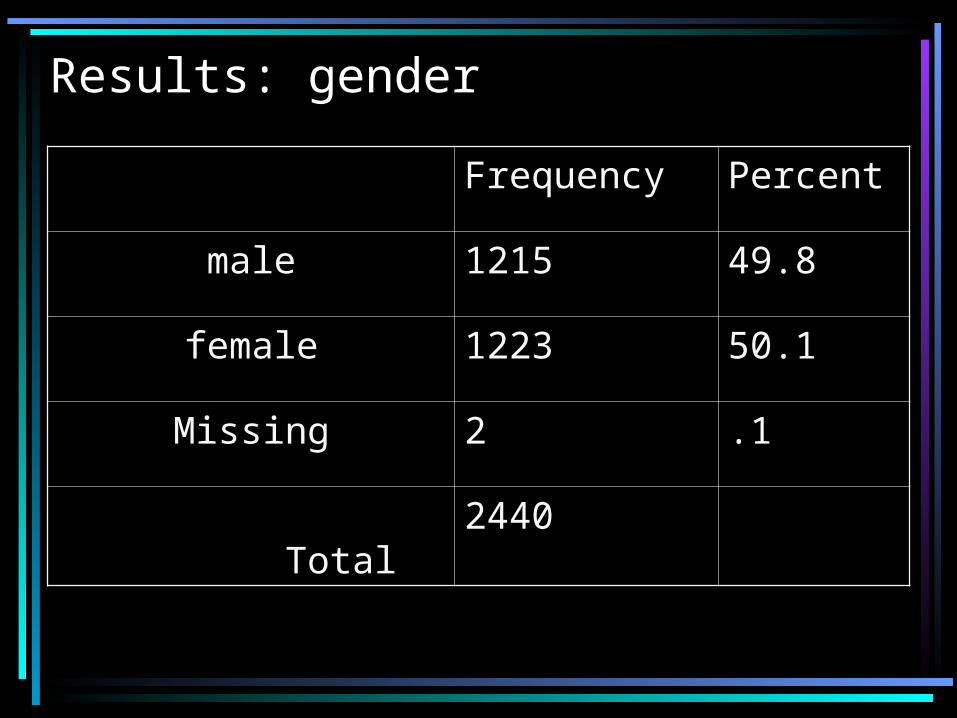
Results: gender
Frequency Percent
male 1215 49.8
female 1223 50.1
Missing 2 .1
Total
2440

Results: Is it a fair comparison?
•No, CTE students scored lower (149/258) than other students (165/258) on the Stanford9
•Yet, when the extraneous variables were added to the equation there was NO DIFFERENCE between the 2 groups

Results: Is it a fair comparison?
•Associated with lower scores:–Black, Hispanic or other male–Hispanic female–Kinesthetic Learner

Results: Is it a fair comparison?
•Associated with higher scores:–Visual Learner–Auditory Learner

Conclusions
• CTE students do worse than other students on high stakes tests
• However, when appropriate extraneous variables are built into the equation and controlled for, there is NO DIFFERENCE between the 2 groups
• The 2 groups are simply different.
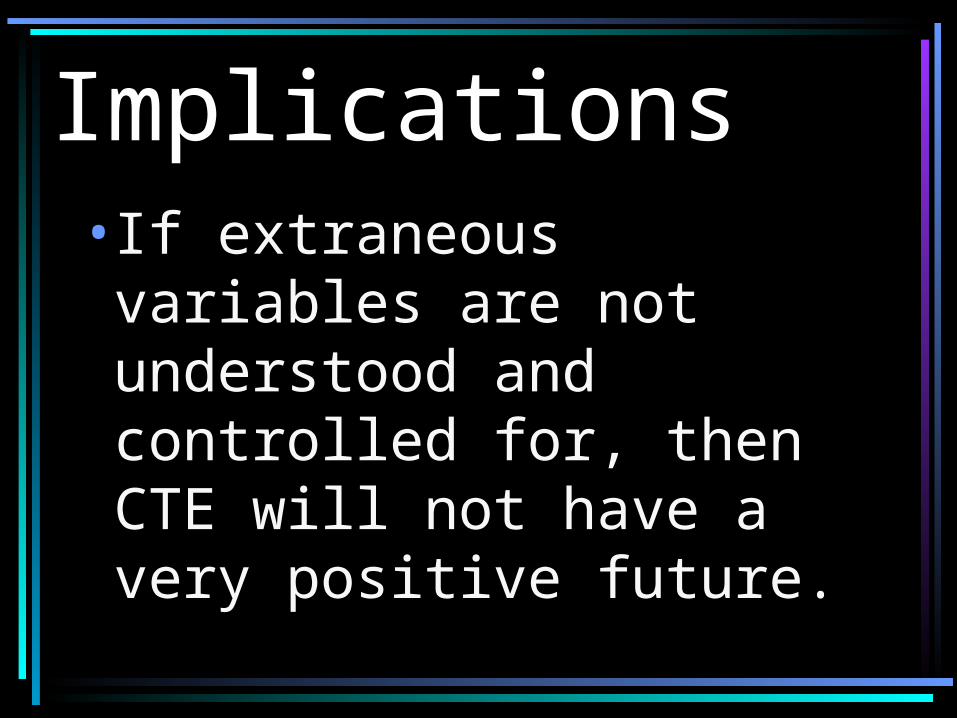
Implications•If extraneous variables are not understood and controlled for, then CTE will not have a very positive future.
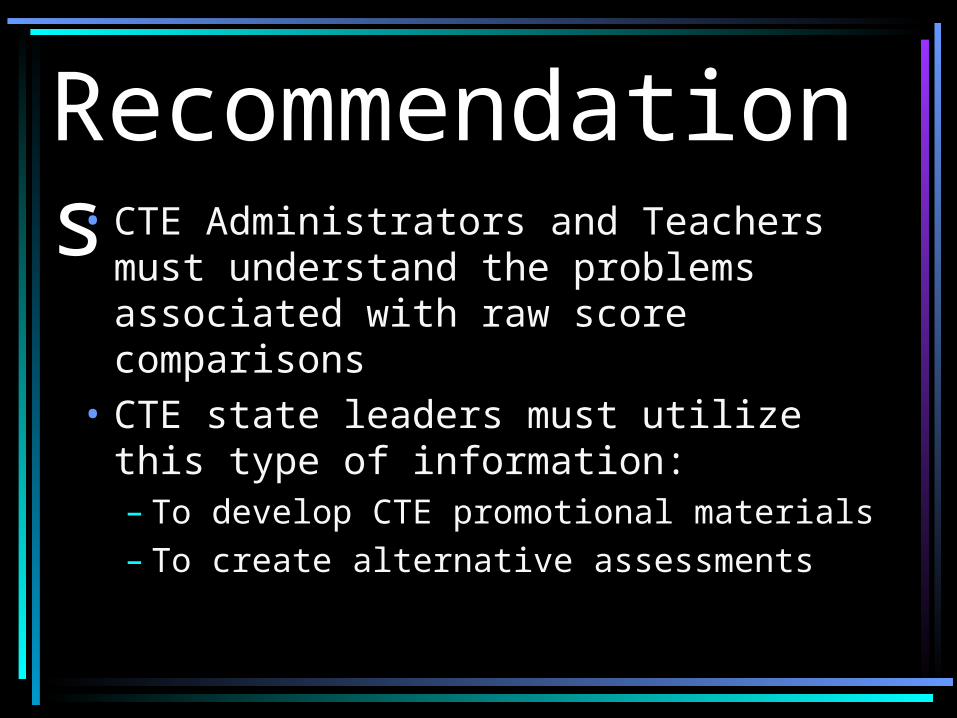
Recommendations• CTE Administrators and Teachers
must understand the problems associated with raw score comparisons
• CTE state leaders must utilize this type of information:– To develop CTE promotional materials– To create alternative assessments

Overall Conclusion…More Research is Needed• Knowledge will forever govern
ignorance, and a people who mean to be their own governors must arm themselves with the power knowledge gives.(James Madison, 1822)