who leaves? teacher attrition and student achievement - eric
TRANSCRIPT

Who Leaves?
Teacher Attrition and
Student Achievement
DonalD BoyD,
Pamela Grossman,
Hamilton lankforD,
susanna loeB,
anD James Wyckoff
w o r k i n g p a p e r 2 3 • m a r c h 2 0 0 9 ( s e p t e m b e r 2 0 0 8 v e r s i o n )

Who Leaves? Teacher Attrition and Student Achievement Donald Boyd
University at Albany Pamela Grossman
Stanford University
Hamilton Lankford University at Albany
Susanna Loeb Stanford University
James Wyckoff University of Virginia
We are grateful to the New York City Department of Education and the New York State Education Department for the data employed in this paper. We appreciate comments on an earlier draft from Vicki Bernstein, Amy McIntosh, Jonah Rockoff, Tim Sass, and participants at both the Economics of Teacher Quality Conference at the Australian National University and the New York Federal Reserve Education Policy Workshop. The research is supported by funding from the Carnegie Corporation of New York, the National Science Foundation, the Spencer Foundation and the National Center for the Analysis of Longitudinal Data in Education Research (CALDER), supported by Grant R305A060018 to the Urban Institute from the Institute of Education Sciences, U.S. Department of Education. The views expressed in the paper are solely those of the authors and may not reflect those of the funders. Any errors are attributable to the authors. CALDER working papers have not gone through final formal review and should be cited as working papers. They are intended to encourage discussion and suggestions for revision before final publication.

Who Leaves? Teacher Attrition and Student Achievement Donald Boyd, Pamela Grossman, Hamilton Lankford, Susanna Loeb, and James Wyckoff CALDER Working Paper No. 23 Abstract This paper analyzes attrition patterns among teachers in New York City public elementary and middle schools and explores whether teachers who transfer among schools, or leave teaching entirely, are more or less effective than those who remain. We find that the first-year teachers who are less effective in improving student math scores have higher attrition rates than do more effective teachers. The first-year differences are meaningful in size; however, the pattern is not consistent for teachers in their second and third years. Attrition patterns differ between schools having disproportionate numbers of low- vs. high-scoring students. A relatively high percentage of the ineffective first-year teachers in low-scoring schools leave teaching altogether; whereas inefficient first-year teachers in higher-scoring schools disproportionately transfer within NYC. In general, first-year teachers who transfer, on average, are less effective than their peers in their new schools, as was the case in their original schools. Furthermore, the more effective first-year teachers who transfer differentially move to schools with fewer low-scoring, poor, Black and Hispanic students, possibly contributing to achievement gaps. As discussed in the paper, these findings raise important questions about policies and policy proposals intended to reduce teacher attrition.
i
1
I. Introduction
Almost a quarter of entering public-school teachers leave teaching within the first three years
(U.S. Department of Education, 2007). The rates are higher in schools with low academic
achievement, leading many to conclude that policies to reduce teacher attrition are needed in order to
improve student achievement. High attrition would be particularly problematic if those leaving were
the more able teachers. While teachers who have stronger academic backgrounds, measured by test
scores and the competitiveness of their undergraduate institutions, are more likely to leave teaching
(Boyd et al., 2005), there is remarkably little evidence that documents the effectiveness of teachers
who leave low-scoring schools. Employing estimates of the value novice teachers add to student test-
score gains in New York City (NYC), the paper assesses the relative effectiveness of teachers who
stay in their original school, transfer within NYC, transfer to another New York State (NYS) district,
or leave NYS public schools. We pay particular attention to attrition patterns in lower-scoring
schools and, for the teachers in these schools who transfer within the NYC public system, differences
between the schools to which the relatively more and less effective teachers move.
Teacher retention may affect student learning in several ways. First, in high-turnover schools,
students may be more likely to have inexperienced teachers who we know are less effective on
average (Rockoff, 2004; Rivkin et al., 2005; Kane et al., 2006). Second, high turnover creates
instability in schools, making it more difficult to have coherent instruction. This instability may be
particularly problematic in schools trying to implement reforms, as new teachers coming in each year
are likely to repeat mistakes, rather than improve upon reform implementation. Third, high turnover
can be costly in that time and effort is needed to continuously recruit teachers. In addition to all these
factors, turnover can reduce student learning if more effective teachers are the ones more likely to
leave.
Recent research has dramatically increased our understanding of teacher retention (e.g., Boyd
et al., 2005; Hanushek et al., 2004; Ingersoll & Smith, 2003 and 2004; Johnson, 2004; Loeb et al.,
2005; Podgursky et al., 2004). These studies show that teacher mobility differs by the characteristics
of both teachers and their students. Teachers are more likely to stay in schools having higher student
achievement, and teachers – especially white teachers – are more likely to stay in schools with higher
proportions of white students. Teachers who score higher on tests of academic achievement are more
likely to leave, as are teachers whose home town is farther from the school in which they teach.
Attributes of teachers and the students they teach appear to interact in important ways. In particular,
teachers having stronger qualifications (as measured by general-knowledge certification-exam
scores) are more likely to quit or transfer than are less-qualified teachers, especially if they teach in

2
low-achieving schools (Boyd et al., 2005).
Whether reducing teacher attrition would improve the teacher workforce is an open question.
How attrition affects the quality of the teacher workforce depends upon several factors, including the
typical gains in effectiveness teachers realize from additional experience, how the average quality of
entering cohorts of teachers differ from those who entered the profession earlier, and how turnover
affects the functioning of the school and, in turn, the effectiveness of other teachers. A crucial factor
is whether those teachers who leave teaching are more or less effective than their peers who remain.
Studying the attrition of 104 elementary-school teachers in an urban school district, Murnane
(1984) found that, in the first two years, less effective teachers had higher attrition from the district.
Recent large-scale studies find strikingly similar results. Hanushek et al. (2005) find that the teachers
leaving schools in an urban Texas district have lower student achievement gains on average than do
the teachers who remain in the same school. This is true for those transferring within the district as
well as those leaving, with the differences in teacher effectiveness larger for teachers making intra-
district transfers following their second and third years of teaching. Concurrent with the research
reported here, Goldhaber el al. (2007) also find that North Carolina teachers who transfer and leave
teaching are less effective than those who remain.
The goal of this paper is to provide further evidence regarding whether and how the
effectiveness of teachers in improving student test scores differs by their retention status over the first
three years of teaching. We do this by looking specifically at how attrition rates vary with teacher
effectiveness and, by following teachers who transfer, assess the extent to which more and less
effective teachers systematically sort into differing types of schools. Using 2000 to 2006 data for
NYC schools, we find that first-year teachers identified as being less effective have higher attrition
rates than do more effective teachers, in both low-achieving and high-achieving schools. The first-
year differences are meaningful in size; however, this is not the case for second- and third-year
teachers. Patterns of attrition differ across schools. Attrition rates are higher in low-performing
schools and, among those leaving these school, more effective teachers tend to transfer to higher-
achieving schools, while those less effective move to other lower-performing schools likely
exacerbating differences in the educational opportunities of students.
II. Teacher Attrition and Student Performance: Data and Methods
We classify individuals as remaining in the same school, transferring to another public school
within NYC, transferring to another public school district in New York or leaving the NYS public
school system. This last category includes individuals who quit teaching as well as those who take

3
teaching jobs in private schools or in public schools in other states.
Much of the discussion regarding teacher retention takes a system-wide perspective focusing
on the percentage of teachers leaving the profession overall. However, those specifically interested in
educational outcomes in a particular district often take a narrower view, being concerned about
teachers who leave the district. From an even more local perspective, school principals, parents and
others primarily concerned with teacher turnover in particular schools likely will have a school-level
perspective. A school-level perspective has broad policy interest as well, given the systematic sorting
of students and teachers across schools. Given the large differences across schools in both student
achievement and teacher characteristics, improving outcomes for low-performing students often
requires focusing at the school level.
Figure 1 shows the cumulative transition rates for entering cohorts of certified NYC teachers
who started teaching between 2000 and 2004 in schools containing grades four through eight.1 After
three years, 28 percent of the teachers had left the NYS public system and another six percent were
teaching in other NYS districts. Seventeen percent of the entering teachers were teaching in another
school within NYC.2 The net result was that by the start of the fourth year less than half of the
teachers remained in the schools where they first taught.
The school-level attrition for second-year teachers is lower than that for first-year teachers
(17 vs. 23 percent). The destinations of the teachers who leave also differ. Nearly half of the teachers
who leave following their first year transfer to another school within NYC, 40 percent leave the NYS
system (e.g., quit teaching) and 11 percent transfer to the suburbs. Among those leaving their initial
school placement after the second year, 24 percent transfer within New York City and 62 percent
leave the NYS system.
The transition rates alone do not shed light on the quality of teachers staying, transferring or
leaving. Teachers differ meaningfully in effectiveness; however, we have little information on how
teacher effectiveness differs across schools. When teachers teach similar students, it is relatively easy
to estimate the contributions of teachers to students’ learning. However, there is substantial evidence
that teachers and students are systematically sorted across schools.3 Thus, it is difficult to
disentangle between-school differences in teacher value-added from student and other school factors
1 Stopping with the 2004 cohort, we are able to follow the attrition of all teachers for three years. 2 The 17 percent figure does not include the additional four percent of teachers who transferred within NYC but subsequently quit teaching or transferred to another district. 3 For example, teachers in schools with the highest proportions of low-performing students are less qualified as measured by certification status, their own exam performance, and teaching experience than are teacher in better performing schools (Betts et al., 2000; Lankford et al., 2002; Clotfelter et al., 2006; Peske & Haycock 2006).

4
that also differ across schools. We avoid this complication by focusing on the relationship between
within-school differences in teacher effectiveness and teacher retention. We also explore where
teachers go if they transfer, assessing the extent to which more effective teachers transfer to certain
types of schools.
Data: Our analyses employ a rich database drawn from administrative data from the NYC
Department of Education (NYCDOE) and the NYS Education Department (NYSED). We include
individuals who entered teaching over the 1999-2000 to 2005-06 school years, provided they were
certified at the time their students were tested.4 Over this period, the State gave statewide student
exams in mathematics and English language arts (ELA) in grades four and eight. In addition,
NYCDOE tested third, fifth, sixth and seventh graders in these subjects. All the exams are aligned to
the NYS learning standards, with each set of tests scaled to reflect item difficulty and equated across
grades and over time.5 Tests are given to all registered students with limited accommodations and
exclusions. Thus, for nearly all students, the tests provide a consistent assessment of achievement for
a student from grade three through grade eight.
To estimate the contributions of teachers to student achievement, we create a student
database with student exam scores, lagged scores and characteristics of students and their peers
linked to their schools and teachers. The NYCDOE student data consists of demographic and exam
data files for each year from 1998-99 through 2005-06. The demographic files include measures of
gender, ethnicity, language spoken at home, free-lunch status, special-education status, number of
absences, and number of suspensions for each student who was active in grades three through eight
that year – approximately 450,000 to 500,000 students each year. More detail is provided in the
Appendix.
The exam files include, among other things, the year an exam was taken, the grade level, and
each student’s scaled score on the exam. For most years, the file contains scores for approximately
65,000 to 80,000 students in each grade. The only significant exception is that the files does not
4 In earlier years temporary license teachers constitute a meaningful portion of new hires in New York City; however since 2002-03 year uncertified teachers have been hired in only very limited situations. Attrition patterns for unlicensed teachers are likely to differ from those for certified teachers for several reasons. First, all uncertified teachers were technically terminated at the end of each school year. Even though many of these individuals were rehired in the same or different schools, attrition patterns could differ as a result. Attrition patterns for uncertified teachers could also differ from those for certified teachers because of differences in the extent to which they are committed to careers in teaching. How the effectiveness-attrition relationship differs between uncertified and certified teachers is briefly discussed below. However, our analysis largely focuses on certified teachers who make up the current NYC teacher workforce. 5 CTB-McGraw Hill developed the mathematics exams in all grades as well as the NYS 4th and 8th grade ELA exams. In 2003 NYC switched from CTB to Harcourt Brace for its third- and fifth- through seventh-grade exams, using an equating study to account for the switch.

5
contain seventy-grade ELA scores in 2002, because the NYC Department of Education is not
confident that exam scores for that year and grade were measured in a manner comparable to the 7th
grade ELA exams in other years.
Using these data, we construct a student-level database where exam scores are normalized for
each subject, grade and year to have a zero mean and unit standard deviation in order to allow for
year-to-year or grade-to-grade anomalies in the exams. For this purpose, we employ a student’s gain-
score information when he or she has a score in a given subject (ELA or math) for the relevant year
and a score for the same subject in the immediately preceding year for the immediately preceding
grade. We do not include cases in which a student took a test for the same grade two years in a row,
or where a student skipped a grade.
To enrich our data on teachers, we match NYC teachers to NYSED databases, using a
crosswalk file that links NYC teacher file reference numbers to unique identifiers linking records in
both databases. Variables for NYC teachers are drawn from these data files as follows:
• Teacher Experience: We use transaction data from the NYCDOE payroll system to calculate
experience in teaching positions in the NYC public school system. This is supplemented using
NYSED data on whether teachers previously taught in other NYS public school districts.
Teachers are included in the analysis only if they first taught in NYC during the period analyzed
and had not previous taught in another NYS district.
• Attrition: We use NYCDOE transaction data to identify the schools where novice teachers
initially taught and, in subsequent years, whether they continue to teach in the same, or some
other, NYC school. For those teachers who left the NYC public system, NYSED data is used to
determine which of these individuals transferred to another NYS district.
Finally, we match teachers and students to their schools, and incorporate data on those schools from
the NYCDOE Annual School Report database, including:
• School-average performance on state and city standardized exams
• Poverty measured by the percent of students eligible for Free and Reduced-Price Lunch
• Racial and ethnic breakdown of students
In part of our analysis schools are grouped into categories based on average student math scores.
Measuring Teacher Effectiveness: A student’s acquisition of skills and knowledge is a
complex social enterprise producing a variety of outcomes for students. This paper focuses on grades
four through eight test-score gains in math and ELA. Teachers clearly affect students more broadly
6
so that the analyses in this paper do not fully account for all the contributions that teachers make to
students. Nonetheless, these scores are a metric for measuring part of teacher effectiveness, both
because they are the measure of student learning chosen by the State and because similar measures of
achievement increasingly have been found to be strong predictors of students’ later educational and
economic success (Murnane et al., 2000).
Even when limiting the analysis to achievement gains in math and ELA, disentangling the
contributions of a particular teacher from the contributions of other school inputs and many other
determinants (e.g., home influences) is a challenge. We estimate the effectiveness of teachers in
improving the educational outcomes of students using the value-added model shown in Equation 1.
ijstY is the test score of the ith student taught by the jth teacher in school s during
ijstjtsjtitijst CXY εγδβα ++++= (1)
year t. We separately analyze scores in math and ELA.6 To net out the effects of a student’s own
background and past academic achievement, the vector of student attributes, itX , includes measures
indicating the student’s poverty status, whether the student is an English language learner, the
student’s race, school absences and suspensions in the prior year, whether the student transferred
from another school as well as the students’ scores on both the math and ELA exams in the prior
grade and those scores squared. jtC includes averages of these same variables for the student’s
classmates as well as the class-level standard deviations of the lagged math and ELA scores. To
capture the wide range of school-level factors affecting student outcomes, we include school fixed-
effects, sδ . We account for these various factors in an effort to isolate the value added by a student’s
teacher, here measured by jtγ . Note that this is a teacher-year fixed-effect which is estimated
separately for each year a person teaches, and that estimates of the jtγ only provide information
about a teacher’s effectiveness relative to other teachers in the same school, as a result of the model
including school fixed-effects. Finally, ijstε is an error term capturing other factors affecting a
student’s score (e.g., test measurement error).
Descriptive statistics for the variables included in the value-added models are reported in the
Appendix, along with parameter estimates for the four models. That is, we estimate models that yield
both math and ELA value-added estimates for fourth- and fifth-grade teachers and value-added
estimates for both math and ELA teachers in middle schools. These teacher-by-year fixed-effects are
6 Test scores, normalized by grade and year, have zero means and standard deviations of one.

7
estimated for all teachers in these grades and subjects. However, the retention analysis focuses upon
teachers in their first three years of teaching.
With the inclusion of the many student, class and school controls, the estimated teacher-year
effects aim to measure within-school differences in the effectiveness of teachers in improving the test
performance of students.7 Even so, the fixed-effect estimates are subject to statistical error so that
part of the observed variation is due to measurement error, not actual differences in teacher
effectiveness. We employ the empirical Bayes approach to adjust the teacher-effect estimates for
such estimation error.8 We use with-in school differences in these adjusted fixed-effects by level of
experience as our measure of teacher effectiveness.9 For example, our measure for a sixth, seventh
or eighth grade, second-year teacher in math is calculated as the difference between the teacher’s
adjusted fixed effect and the average of the adjusted fixed-effects for all the second-year math
teachers who taught in that same school during the period 2000-2006. This approach yields fairly
clean estimates of how effective each teacher is relative to their equally experienced peers in the
same school.
Because most fourth and fifth grade teachers teach both math and ELA, it is possible to
estimate measures of their effectiveness in both subject areas. For first-year teachers in these grades,
the standard deviation of our measure of effectiveness is 0.13 in math and 0.10 in ELA. The
correlation between the effectiveness measures for math and ELA for fourth- and fifth-grade, first-
year teachers is 0.45, indicating that teachers good in one area are generally effective in the other, but
that many teachers are relatively better in one area. The student test score itself is measured in
standard deviation units so that a one standard deviation difference in math effectiveness corresponds
to a 0.13 standard deviation difference in student test performance. The standard deviation of the gain
in student test scores is somewhat lower (0.63) so that a standard deviation difference in teacher
effectiveness corresponds to approximately a twenty percent of the standard deviation of test-score
gains.10
7 An alternative would be to explicitly model the gains from experience and estimate teacher effects, instead of teacher-year effects. We chose the latter because of our focus on teachers in the first few years of their careers and our decision to compare teachers only to other teachers in their same school having the same level of experience. 8 See Jacob and Lefgren (2005) for a clear summary of the approach we use as well as Kane and Staiger (2002) and Morris (1983) for earlier references. 9 From the empirical-Bayes-adjusted estimate of a teacher’s effectiveness in a particular year we subtracted the mean adjusted estimate for all teachers in the school having the same level of experience. We employ this normalized teacher effectiveness measure is our analysis. 10 The standard deviation of the gain in student test scores, 0.63, reflects the dispersion in the actual gain in student learning as well as test measurement error for both the pre- and post-tests. Boyd et al. (2008) present a relatively straightforward way to estimate the overall extent of test measurement error and report that once test measurement error is taken into account the standard deviation of the gain in actual achievement is 0.25, much smaller than 0.63.

8
Middle-school results are similar. The standard deviation of our effectiveness measure in
grades six through eight is 0.11 in math and 0.09 in ELA.11 With course specialization in middle-
school grades, only 10 percent of sixth- through eighth-grade teachers teach both subjects. For them,
the correlation in effectiveness measures for the two subjects is 0.33.
III. Teacher Attrition and Student Performance: Results
Teacher attrition for novice teachers in New York City is marked by two dominant themes.
First, teachers of low-performing students are more likely to leave their current schools during their
first two years of teaching than are teachers of high-performing students; and, second, across both
low and high-performing schools, teachers who are less effective in raising student achievement are
more likely to leave their current school than are more effective teachers. These results hold up
across grade levels and across schools grouped by the performance of students in math or ELA. The
results are far more systematic for teacher effectiveness measured by math, than by ELA, value-
added.
Teachers in low-performing schools more likely to leave. Figure 2 shows attrition patterns
for teachers by school average achievement scores. The category higher-scoring schools includes the
quartile of schools having the highest mean math scores, while the lower-scoring category includes
the quartile of schools having the lowest mean math scores. The middle-scoring group consists of
schools in the middle 50 percent.12 We observe higher proportions of first- and second-year teachers
leaving lower-scoring schools, compared to those in higher-
scoring schools; lower-scoring schools have higher transfer rates within NYC as well as relatively
more teachers leaving the NYS system. The net result is that school-level attrition rates differ by 12
percentage points (37 vs. 25 percent) by the end of the second year. When schools are grouped based
on either student poverty measured by free-lunch eligibility or the percent of students who are either
Black or Hispanic, the patterns of school-level attrition are quite similar as are the attrition patterns
for the separate transitions.
Less-effective novice teachers more likely to leave – 4th and 5th grade results. Figure 3a
displays attrition rates for fourth- and fifth-grade teachers grouped according to whether their math
Thus, an estimated one standard deviation difference in teacher effectiveness (0.13) corresponds to more than half a standard deviation gain in student learning over the course of a year. 11 These standard deviations are roughly comparable to those reported by Rockoff (2004) and smaller than those reported by Hanushek et al. (2005) as well as Jacob and Lefgren (2005). 12 Schools are grouped based on mean math scores of fourth- and fifth-grade students, weighted by the numbers of teachers in those grades. Similar groupings are employed for middle schools.

9
value-added is in the top or bottom quartile or the middle half. First-year teachers with relatively low
math value-added are more likely both to transfer to another school within NYC and to leave the
NYS system, compared to their more effective peers. Over 16 percent of first-year teachers whose
math value-added is in the bottom quartile transfer or leave teaching, while only 11 percent of those
in the top-quartile do so. The differences for second-year teachers are somewhat smaller. There is
little difference in attrition rates for teacher grouped according to their teacher effectiveness in ELA.
(See Figure 3b.)
The patterns evident in Figures 3a and 3b come through in multivariate analysis, as well. A
multivariate approach has the benefit of being able to account for school-specific differences in
attrition as well as possible interactions between school type and teacher effectiveness. Equation 2
describes the basic model. Here the probabilities of returning to the same school the
exp( ), 1, 2, 3, 4
exp( )
h hs jh
j g gs j
g
EP h
E
α β
α β
+= =
+∑ (2)
following year (h=1), transferring to another NYC school (h=2), transferring to another NYS district
(h=3) and leaving the NYS public system (h=4) are functions of jE representing either a scalar or
vector measure of teacher effectiveness. The hsα are school-specific parameters that capture general
attrition patterns in each school. This fixed-effect multinomial logit model is attractive in that we
need not estimate the school fixed effects; they can be swept from the model, allowing us to focus on
estimating how within-school differences in teacher effectiveness explain which teachers in a school
leave conditional on the schools’ overall attrition rates. Without loss of generality, we employ the
normalizations 011 == βα s . Thus, estimates of 2β , 3β and 4β , allow us to make inferences
regarding how the transition probabilities within a school vary with the relative effectiveness of
teachers.13 A word of caution is warranted here in that non-zero values of the s'β do not necessarily
imply a causal relationship; an estimated model merely provides a clearer empirical description of
13 Because all the s'β enter the formula for each of the transition probabilities, interpreting the estimated coefficients is somewhat complicated. However, given the normalization we employ,
)exp()exp(1j
hhsj
hj EPP βα= . A negative value of hβ indicates that an increase in teacher effectiveness is
associated with a reduction in the probability of transition h relative to the probability of remaining in the same school. Note that the magnitude of the effect depends upon hβ as well as the school’s baseline pattern of transition,
captured by the school fixed effect, hsα ; in particular, the magnitude of the effect of an increase in jE will be larger
as )exp( hsα is larger.

10
how attrition varies with teachers’ own effectiveness. Standard software packages do not include
procedures that allow direct estimation of the model in (2). Our approach is described in the
appendix.
Table 1 shows parameter estimates for several different specifications for fourth- and fifth-
grade teachers.14 Model A, estimated for teachers having up to three years of experience, indicates
that less effective math teachers are more likely to transfer within NYC compared to more effective
teachers. There is a similar inverse relationship for the probability of leaving the NYS system. In
contrast, more effective ELA teachers are more likely to leave the NYS public school system, but
ELA effectiveness has no statistically significant effect on transfers within NYC or to other NYS
school districts. We explore the robustness of these results by estimating a number of different model
specifications. The results presented for math effectiveness and the three forms of attrition differ only
in minor ways across these model specifications. The same is not true for the relationship between
ELA effectiveness and leaving the NYS system. In particular, when math effectiveness is dropped
from the specification, the coefficient for ELA effectiveness is both small and not statistically
significant. Not holding effectiveness in math constant, there is no systematic relationship between
ELA effectiveness and attrition – a result consistent with the small differences in attrition rates seen
in Figure 3b.
The systematic pattern for math effectiveness does not hold equally for first, second and third
year teachers. Model B shows the pattern for first-year teachers is as just noted. However, the second
row of Model B shows that less effective second- and third-year math teachers in grades 4 and 5 are
more likely to transfer but that the likelihood of leaving the NYS system is not statistically different
for this group, which is not the same as for first-year teachers.
The within-school relationship between attrition and teacher effectiveness in math is
statistically significant, but is it of policy importance? Figure 4 shows the relationship between
estimated attrition probabilities and teacher effectiveness for first-year teachers corresponding to
coefficient estimates for Model B. The probabilities shown in Figure 4 are for the case where the
values of 2sα , 3
sα and 4sα from Equation 2 result in the estimated transition probabilities, evaluated at
14 N = 3192 shown in the top panel of Table 1 is the number of entering novice teachers included in the analysis. In specifications where second- and third-year teachers enter the analysis, the number of observations exceed N since many of these teachers teach multiple years. The models estimated are somewhat more complicated than the specification shown in (2). In particular, we included alternative-specific dummy variables indicating one’s years of experience beyond the first year, in order to account for the fact that transition patters for teachers in their second and third years might well differ systematically from those for first-year teachers.

11
the mean value of jE (i.e., zero), being equal to the observed transition rates. This is what would
result had the hsα been restricted to be the same across schools (i.e., '
h hs sα α= for all schools) and
jointly estimated along with the efficiency coefficients.15 Thus, the heights of the three curves in
Figure 4 are determined by the overall transition rates observed in the data, with the slopes of the
three curves determined by the estimated effectiveness coefficients in Model B.
Figure 4 shows that a first-year teacher whose effectiveness is one standard deviation below
the mean (-0.13) has an estimated probability of transferring within NYC that is one-third larger than
that for a teacher one standard deviation above the mean (7.6 vs. 5.7 percent). There is a 50 percent
difference in the estimated probability of quitting (5.7 vs. 3.7 percent). The range of values on the
horizontal axis, -0.25 to +0.25, is slightly larger than the range from the fifth to the 95th percentile of
math value-added. The estimated probability of leaving the NYS system is twice as large at the fifth
percentile compared to the 95th percentile. Less effective teachers are much more likely to transfer or
leave the NYS system than are their more effective colleagues.
The above analysis shows that more effective math teachers are less likely to transfer or leave
teaching after their first year, but not how much more effective teachers are who stay, compared to
those who transfer or leave. Figure 5 shows the distribution of the value-added in math for fourth-
and fifth-grade teachers by their transition status following the first year. Consistent with the attrition
patterns discussed above, two differences stand out. First, a greater proportion of teachers
transferring within NYC are less effective than those who remain in the same school, as shown by
the greater frequency of transferring teachers having low levels of math effectiveness, in particular
values less than -0.20. Six percent of the first-year teachers who remain in the same school were
below this threshold, compared to 11 percent of those transferring within NYC. The second notable
difference is that those leaving teaching in NYS public schools are less effective than their peers who
remain in the same school. The effectiveness of one-in-three of the first-year teachers leaving the
NYS system is less than -0.1, compared to one-in-five of the first-year teachers returning to the same
school.
As suggested by Figure 5, there are differences between first-year teachers who leave and
their peers who remain in the same school. The top row of Table 2 shows the average within-school
differences in teacher effectiveness in math for fourth and fifth-grade teachers. On average, those
transferring within NYC are less effective by -0.026 compared to the first-year teachers who remain
15 The estimated probabilities evaluated at the means of the explanatory variables will equal the relative frequencies observed for the data used in estimation.

12
in the same schools.16 The average difference for those who leave the NYS system is -0.041. To put
these numbers into perspective, 0.050 is the average difference in effectiveness between the second
year of teaching and the first, for those individuals who remain in the same school for a second year.
From a different perspective, -0.041 is one third as large as the standard deviation of the math value-
added measure for first-year fourth- and fifth-grade teachers. By either perspective, this difference in
effectiveness is meaningful.
How teacher attrition varies with teacher effectiveness differs between low- and high-
scoring schools. The analyses so far have looked at all schools together. However, as discussed
above, teachers systematically sort across schools due to their own preferences and how school
leaders differ in their handling of personnel matters (e.g., counseling-out ineffective teachers). Thus,
it would not be surprising if the aggregate results mask differences across schools, particularly
schools grouped by student achievement, race/ethnicity or poverty. Model C in Table 1 explores such
potential differences using interactions between the measure of effectiveness in math and dummy
variables indicating whether a school is in the lower- or higher-scoring quartiles or in the middle
group of schools. In this way, we estimate separate effectiveness coefficients for each of the three
school groupings. Less effective teachers from higher scoring schools are more likely to transfer
within NYC, although there is no statistically significant NYC transfer relationship between
effectiveness and school performance for the lower and middle scoring schools.17 That is, for higher-
scoring schools, greater effectiveness is associated with a lower probability of transferring, relative to
staying in the same school.
In contrast, the effectiveness coefficients for leaving teaching in NYS are statistically
different than zero for lower- and middle-scoring schools, implying that greater effectiveness is
associated with a lower probability of leaving teaching, relative to remaining in the same school. The
magnitude of the estimated coefficient for lower-scoring schools is more than twice as large as the
coefficient for middle-scoring schools and more than four times as large as that for higher-scoring
schools, the latter of which is not statistically different from zero. The hypothesis that the coefficients
are equal is rejected at the one percent level of significance, indicating that the relationship between
teacher effectiveness in math and the probability of leaving teaching in NYS is relatively stronger in
the lowest scoring schools. There does not appear to be a relationship between teachers’ effectiveness
and their probability of transferring to another district for any of the school types. 16 These estimates and standard errors were obtained by regressing the value-added measure on dummy variables indicating the three transitions as well as school fixed effects. 17 Using a likelihood-ratio test, the hypothesis that the three coefficients are equal is rejected at the five-percent level of significance.
13
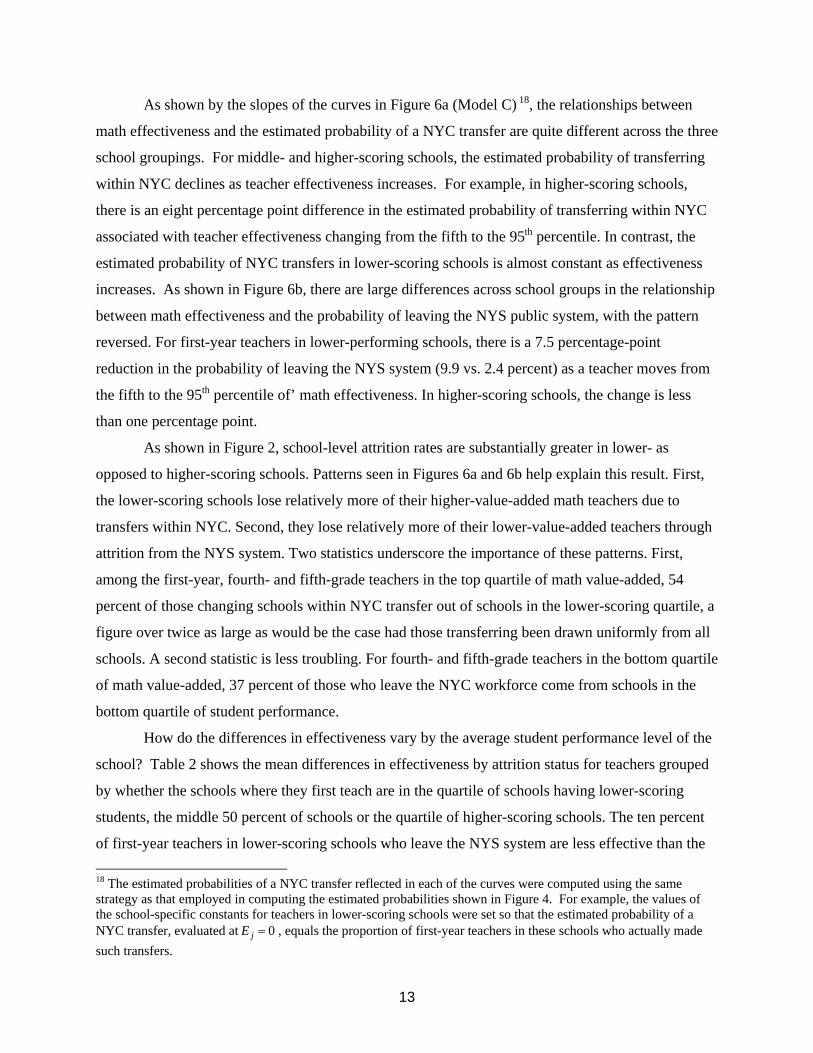
As shown by the slopes of the curves in Figure 6a (Model C) 18, the relationships between
math effectiveness and the estimated probability of a NYC transfer are quite different across the three
school groupings. For middle- and higher-scoring schools, the estimated probability of transferring
within NYC declines as teacher effectiveness increases. For example, in higher-scoring schools,
there is an eight percentage point difference in the estimated probability of transferring within NYC
associated with teacher effectiveness changing from the fifth to the 95th percentile. In contrast, the
estimated probability of NYC transfers in lower-scoring schools is almost constant as effectiveness
increases. As shown in Figure 6b, there are large differences across school groups in the relationship
between math effectiveness and the probability of leaving the NYS public system, with the pattern
reversed. For first-year teachers in lower-performing schools, there is a 7.5 percentage-point
reduction in the probability of leaving the NYS system (9.9 vs. 2.4 percent) as a teacher moves from
the fifth to the 95th percentile of’ math effectiveness. In higher-scoring schools, the change is less
than one percentage point.
As shown in Figure 2, school-level attrition rates are substantially greater in lower- as
opposed to higher-scoring schools. Patterns seen in Figures 6a and 6b help explain this result. First,
the lower-scoring schools lose relatively more of their higher-value-added math teachers due to
transfers within NYC. Second, they lose relatively more of their lower-value-added teachers through
attrition from the NYS system. Two statistics underscore the importance of these patterns. First,
among the first-year, fourth- and fifth-grade teachers in the top quartile of math value-added, 54
percent of those changing schools within NYC transfer out of schools in the lower-scoring quartile, a
figure over twice as large as would be the case had those transferring been drawn uniformly from all
schools. A second statistic is less troubling. For fourth- and fifth-grade teachers in the bottom quartile
of math value-added, 37 percent of those who leave the NYC workforce come from schools in the
bottom quartile of student performance.
How do the differences in effectiveness vary by the average student performance level of the
school? Table 2 shows the mean differences in effectiveness by attrition status for teachers grouped
by whether the schools where they first teach are in the quartile of schools having lower-scoring
students, the middle 50 percent of schools or the quartile of higher-scoring schools. The ten percent
of first-year teachers in lower-scoring schools who leave the NYS system are less effective than the 18 The estimated probabilities of a NYC transfer reflected in each of the curves were computed using the same strategy as that employed in computing the estimated probabilities shown in Figure 4. For example, the values of the school-specific constants for teachers in lower-scoring schools were set so that the estimated probability of a NYC transfer, evaluated at 0jE = , equals the proportion of first-year teachers in these schools who actually made such transfers.
14
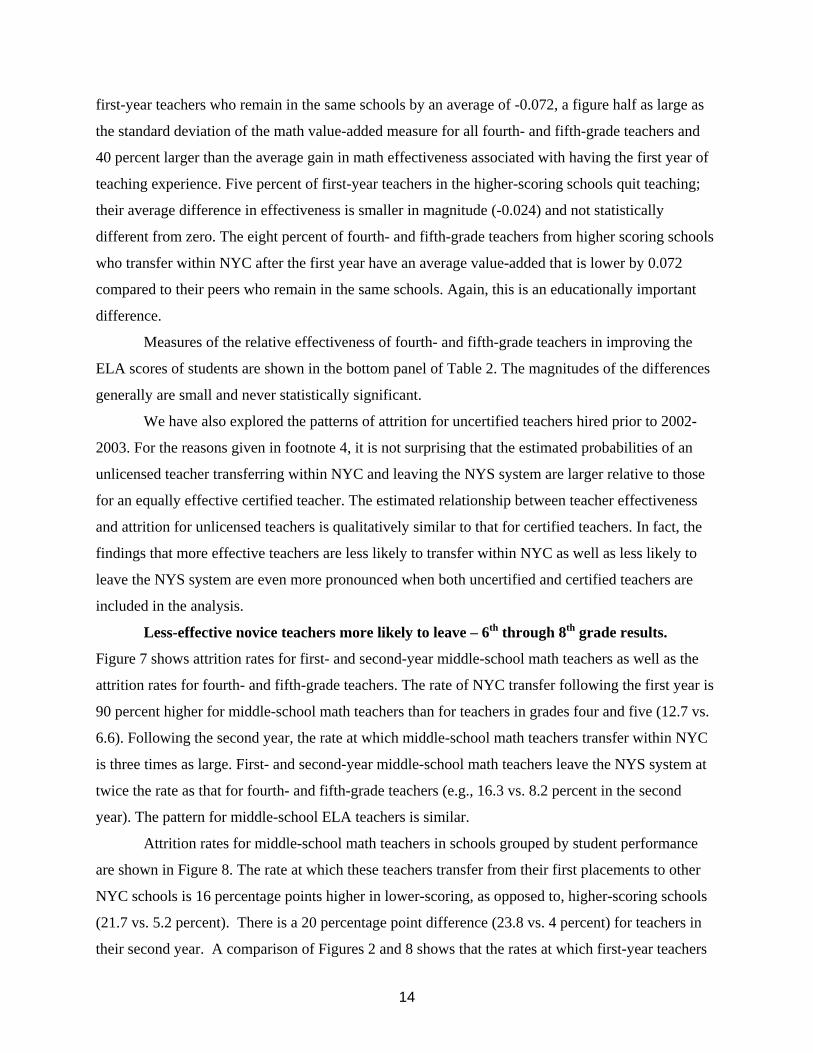
first-year teachers who remain in the same schools by an average of -0.072, a figure half as large as
the standard deviation of the math value-added measure for all fourth- and fifth-grade teachers and
40 percent larger than the average gain in math effectiveness associated with having the first year of
teaching experience. Five percent of first-year teachers in the higher-scoring schools quit teaching;
their average difference in effectiveness is smaller in magnitude (-0.024) and not statistically
different from zero. The eight percent of fourth- and fifth-grade teachers from higher scoring schools
who transfer within NYC after the first year have an average value-added that is lower by 0.072
compared to their peers who remain in the same schools. Again, this is an educationally important
difference.
Measures of the relative effectiveness of fourth- and fifth-grade teachers in improving the
ELA scores of students are shown in the bottom panel of Table 2. The magnitudes of the differences
generally are small and never statistically significant.
We have also explored the patterns of attrition for uncertified teachers hired prior to 2002-
2003. For the reasons given in footnote 4, it is not surprising that the estimated probabilities of an
unlicensed teacher transferring within NYC and leaving the NYS system are larger relative to those
for an equally effective certified teacher. The estimated relationship between teacher effectiveness
and attrition for unlicensed teachers is qualitatively similar to that for certified teachers. In fact, the
findings that more effective teachers are less likely to transfer within NYC as well as less likely to
leave the NYS system are even more pronounced when both uncertified and certified teachers are
included in the analysis.
Less-effective novice teachers more likely to leave – 6th through 8th grade results.
Figure 7 shows attrition rates for first- and second-year middle-school math teachers as well as the
attrition rates for fourth- and fifth-grade teachers. The rate of NYC transfer following the first year is
90 percent higher for middle-school math teachers than for teachers in grades four and five (12.7 vs.
6.6). Following the second year, the rate at which middle-school math teachers transfer within NYC
is three times as large. First- and second-year middle-school math teachers leave the NYS system at
twice the rate as that for fourth- and fifth-grade teachers (e.g., 16.3 vs. 8.2 percent in the second
year). The pattern for middle-school ELA teachers is similar.
Attrition rates for middle-school math teachers in schools grouped by student performance
are shown in Figure 8. The rate at which these teachers transfer from their first placements to other
NYC schools is 16 percentage points higher in lower-scoring, as opposed to, higher-scoring schools
(21.7 vs. 5.2 percent). There is a 20 percentage point difference (23.8 vs. 4 percent) for teachers in
their second year. A comparison of Figures 2 and 8 shows that the rates at which first-year teachers
15
in higher-scoring schools transfer within NYC are similar for 6-8 grade math teachers and 4-5 grade
teachers. The same is not true for these groupings of teachers in middle- and lower-scoring schools.
The overall higher transfer rates for middle-school math teachers are the result of transfer rate
difference in middle- and lower-scoring schools. Similarly, the overall higher rate at which middle-
school math teachers leave the NYS system after the second year, compared to teachers in grades
four and five, generally reflects the high quit rates for the middle-school math teachers in lower- and
middle-scoring schools. Forty percent of the first-year middle-school math teachers teaching in
lower-scoring schools transfer within NYC during the first two years. With an additional 25 percent
leaving the NYS public school system and modest transfers to other NYS pubic schools, only 39
percent of the first-year math teachers teaching in lower-scoring schools return to the same school for
a third year, a figure strikingly different than the 70 percent two-year retention rate in higher-scoring
schools.
We find no systematic relationship between attrition and effectiveness for second- and third-
year teachers based on the logit model described above; see model D in Table 3. Similar to fourth
and fifth grade teachers, the probability of first-year middle-school math teachers making a NYC
transfer, relative to that of remaining in the same school, declines with teacher’s relative
effectiveness in teaching math. As was the case for fourth and fifth grade teachers, the aggregate
results mask dramatic differences across school types, as shown by the parameter estimated in model
E and the implied probabilities of NYC transfers in Figure 9a. In all but lower-scoring schools, the
estimated probability of a NYC transfer declines as teachers are more effective; the relationship is
reversed in lower-scoring schools, but is not statistically different from zero. Note that the
differences in the estimated transfer probabilities between the three school groups (Figure 9a)
meaningfully increase the higher is the level of teacher effectiveness. Consider teachers whose math
value-added is one standard deviation above the average for their school peers (0.11). The estimated
probability that such a relatively more effective teacher in a lower-scoring school will transfer within
NYC is 20 percentage points higher compared to that for an equally effective teacher in a higher-
scoring school (22.5 vs. 3.0 percent). This explains why most of the more effective teachers who
transfer within NYC following their first year leave schools having relatively low student scores. For
example, 69 percent of the middle-school math teachers in the top quartile of effectiveness who left
their initial school placement after the first year left schools grouped in the lower-scoring quartile.
For middle-school math teachers in middle- and higher-scoring schools, we do not find a
statistically significant relationship between teacher value-added and the probability of leaving the
NYS system relative to the probability of remaining in the same school. In contrast, the probability
16
that a middle-school math teacher in a lower-scoring school will leave the NYS system is lower as
value-added rises (Model E and Figure 9b). The probability of quitting for a teacher whose
effectiveness is one standard deviation below average is over twice as large as that for a teacher
whose effectiveness is one standard deviation above average (11.6 vs. 4.5 percent).
The top row of Table 4 shows average within-school differences in teacher effectiveness for
middle-school math teachers. On average, those who leave the NYS public system are less effective
by -0.047, compared to the first-year teachers who remain in the same schools. The average
difference for all those who transfer within NYC is smaller (-0.028). However, schools vary
significantly in this regard. In higher-performing middle schools, those transferring within NYC are
less effectiveness by -0.090 on average, compared to their peers remaining in the same schools. In
lower-scoring schools there is no difference for the first-year math teachers who transfer within NYC
compared to their peers who remain in the same schools, but those who leave the NYS system are
less effective by -0.080. These systematic differences are quite large when compared to the 0.038
gain in effectiveness from those returning to the same school having a year of experience. From a
different perspective, -0.09 and -0.08 are relatively large when compared to the 0.11 standard
deviation of the value-added measure for all first-year, middle-school math teachers. With about
eight percent of first-year teachers in higher-scoring schools transferring, their attrition could
meaningfully improve student achievement in those schools.
Comparing Tables 2 and 4, the patterns of differences in math effectiveness are strikingly
similar for fourth- and fifth-grade common-core teachers and middle-school math teachers.
The relationship between attrition and the value-added by middle-school ELA teachers is less
systematic. For example, consider Model G in Table 3. The pattern of estimated coefficients
associated with NYC transfers is qualitatively similar to that for middle-school math teachers, but
coefficients are smaller in magnitude and only the interaction for the middle group of schools is
statistically different from zero. There appears to be no systematic pattern for the estimated
probability of middle-school ELA teachers leaving the NYS system.
Why might the ELA value-added patterns differ from those for math in both grade
groupings? This is not the first study in which results for math differ from those for ELA. Jacob and
Lefgren (2005) compare subjective evaluations provided by principals with estimates of teachers’
effectiveness obtained using an approach similar to the one we use. In that study, principals who
assessed how effective teachers were “at raising student math (reading) achievement,” were less
successful at identifying teachers who were effective as measured by value-added test scores in
reading, as compared to math. Sixty-nine percent of the teachers whom principals assigned the

17
lowest rating in math were also in the lowest group as measured by value-added. There was less
consistency in reading, the comparable figure being 42 percent. Murnane’s analysis (1984) of
whether attrition rates vary with teacher effectiveness also compares the value-added estimates of
teacher effectiveness in math and reading with principals’ evaluations of teachers measured by an
index based on 19 dimensions of performance. He reports the Pearson simple correlation between
principals’ evaluations and the estimated teacher effects for math is 0.44 and 0.25 for reading, a
difference consistent with the findings of Jabob and Lefgren. To the extent that principals “counsel
out” teachers they perceive as being less effective, a difference in their ability to distinguish effective
teaching in math, as compared to ELA, could be a factor in explaining the difference in attrition
results. Alternatively, the student exams may be a better instrument for identifying teachers’ effects
in math than in ELA.
The results for both grade-level groupings point to systematic differences in attrition behavior
for more and less effective teachers, but do not explanation those differences. The observed pattern
that more effective math teaches have lower attrition rates does not establish causation. Even if it
were true that lower effectiveness were a cause for higher attrition, we still would not know the
mechanism through which effectiveness causes the observed actions. Do less effective teachers
choose to leave their job on their own; or are they “counseled out” or subject to more direct action
taken by their employers? Separating supply and demand in the context of a teacher’s employment
or transition status is very difficult.19
IV. Characterizing NYC Transfers
Less-effective teachers disproportionately leave after their first year. Some of these less-
effective teachers leave teaching but others transfer to other schools. The effect that transferring has
on students depends in part on the schools to which these teachers transfer. Two mechanisms come
into play here. First, if the less effective teachers who transfer are systematically more likely to
transfer to schools serving low-performing students, than are the more effective teachers who
transfer, the transfer process would further disadvantage schools with lower-performing students.
Alternatively if more effective teachers are differentially more likely to go to low-scoring schools,
the transfer process can benefit the quality of teaching in those schools. Second, teachers who
transfer may be more effective in the schools they transfer to than in the schools they came from. If
this is the case then they may benefit the schools to which they transfer; the transfer process would 19 For a discussion of these issues and one method to disentangle supply and demand in the context of hiring novice teachers, see Boyd et al. (2006).
18
then be a net gain for both the sending and the receiving school.
Between seven and 19 percent of first-year teachers transfer to a different school following
their first year of teaching, depending on grade level and academic performance of the school. To
understand these transfer patterns, we compare the attributes of the schools in which they initially
teach with those to which they transfer, including how such differences vary with the value-added of
teachers in their first year. In so doing, we need to account for a natural tendency for teachers in low-
scoring schools to move to higher-scoring schools – there are simply more higher-scoring schools to
move to – and the reverse for teachers transferring from high-scoring schools. This regression to the
mean is likely to hold for a variety of school attributes. If the effectiveness of teachers who transfer
were correlated with their initial schools’ attributes, such regression to the mean would complicate
the interpretation of simple mean differences between the pre- and post-move school attributes.
We net out the effect of regression to the mean by regressing the pre- to post-move change in
each school attribute on the pre-move school attribute value expressed as a deviation from the overall
mean. The negative values for this variable’s regression coefficient, shown in columns two and six of
Table 5 for various specifications, indicate there is regression to the mean. The remaining
coefficients show effects net of this regression to the mean.
As shown in columns three to five of Table 5, the coefficients on the variables indicating the
value-added category of teachers show a systematic pattern in how transfers vary across the teacher
groupings. Teachers, regardless of their effectiveness, on average move to schools with higher
student test scores and fewer poor, Black and Hispanic students. However, the effect is strongest
among the more effective teachers.
Consider the school average math test scores of students, a measure of school-level academic
performance. On average, teachers move to schools that have math scores that are greater than the
schools they left by 0.134 (column 1). However, the difference between the new and original schools
differs with the first-year math value-added of teachers. Less effective teachers move to schools
where the difference is .091 (column 5). In contrast, more effective teachers move to schools whose
scores for students are 0.196 higher on average, with the school difference for middle group of
teachers (0.143) halfway in between.
These differences are important from a policy perspective, as shown by comparing the 0.196
difference in the school average score to one or more measures characterizing the dispersion in this
measure across schools. For example, consider the interquartile range for this measure. Twenty-five
percent of the elementary and middle schools in our sample have average student scores that are
below -0.397, with another 25 percent of the schools having average scores that exceed 0.275. The

19
difference between the 75th and 25th percentile scores (i.e., the interquartile range), here 0.672
(= 0.275 - -0.397), is an intuitive measure of the dispersion in average scores across schools, as the
mean scores of half the schools fall within this range. The 0.196 average difference for the more
effective teachers who move is 29 percent of the change needed to move from a school at the 25th to
one at 75th percentile. The 0.196 is 40 percent as large as the standard deviation in the school-average
math score (0.486). From a different perspective, the 0.095 difference (i.e., 0.196 – 0.091) in the
change in school mean math score is one-seventh as large as the mean scores interquartile range
across schools.
As a second measure of student achievement, consider the percentage of students in a school
scoring in the bottom quartile of scores citywide and how this measure differs between the new
schools of those transferring and the schools from which they moved. After accounting for regression
to the mean, teachers on average move to schools that have five percentage points fewer lower-
scoring students. (The variable’s interquartile range is 0.21.) However, this differs with teachers’
first-year effectiveness teaching math. Teachers having lower value-added move to schools with 4.3
percent fewer lower-scoring students, while teachers in the highest value-added category move to
schools where the incidence of students scoring in the bottom quartile is 7.2 percentage points lower
on average. Table 5 also shows these same teachers move to schools with more students in the top
quartile of student achievement. Among teachers transferring within NYC, those who are more
effective – as measured by their contributions to the test score gains of their students in math – are
more likely than are their less effective colleagues to move to schools whose students already are
attaining higher academic achievement. Such systematic sorting disadvantages students in schools
with high concentrations of students failing to achieve even minimal academic success.
A similar pattern emerges for schools based on student demographic characteristics. Less
effective teachers on average move to schools with student race and poverty percentages similar to
those they left. In contrast, teachers in the higher quartile and middle half of the effectiveness
distribution move to schools with about five percentage points fewer free-lunch-eligible students and
5.5 percentage points fewer Black and Hispanic students. Both of these average differences are
statistically significant and between 11 and 15 percent of the measures’ inter-quartile ranges,
indicating that these school differences for those transferring are more modest.
So far we have seen that the more effective teachers who transfer differentially move to
schools with higher-scoring students. This process clearly benefits higher-performing students more
than other students. However, the ultimate effect of the transfer process also depends on how well
these teachers do in the schools to which they transfer. Table 6 shows that the fourth- and fifth-grade
20
teachers who transfer have value-added in their second year (first year in their new school) that is
smaller than those who have taught in that same new school both years. In middle schools, transfers
appear to perform at about the same level as their new colleagues, on average, although math
teachers transferring to lower-performing schools are less effective than their new colleagues. These
results are similar to those found in earlier work (Hanushek et al., 2005) and are consistent with the
above finding that transferring teachers are, on average, less effective than those who remain in the
same school.
The consistency of teachers’ value-added across schools suggests that the potential
mechanism that would have led to a “better fit” of teachers with their new school is unlikely to offset
the differential sorting of the more effective teachers transferring into the schools with higher scoring
students. In keeping with this, the bottom of Table 6 shows that in grades four and five, those
teachers transferring into lower- and middle-scoring schools are less effective teaching math than are
their new peers, but the same is not true for the higher scoring schools. Those transferring into
higher-scoring schools are equally effective in math, compared to those continuing to teach in the
same schools. Middle school math teachers demonstrate a somewhat similar pattern but, again, we
find no clear relationships with ELA effectiveness.
V. Summary and Conclusions
A large number of teachers leave their initial school placements by the end of their first two
years, especially in schools having relatively more low-performing students. Nearly 44 percent of
elementary teachers in lower-performing NYC schools left their initial school within two years; that
figure is 11 percentage points higher for middle schools. For these and other reasons, teacher
retention is the focus of a substantial body of recent and ongoing research and dominates many
policy discussions concerned with improving classroom teaching.
However, researchers and policymakers should not jump to the conclusion that across-the-
board reductions in teacher attrition are desirable. It may benefit students for some teachers to leave,
particularly those teachers who are ineffective in improving student achievement. While we find little
evidence of differential attrition by the effectiveness of teachers with more than one year of teaching
experience, elementary teachers and middle-school math teachers who leave teaching in New York
prior to their second year are responsible for lower achievement gains for their students, on average,
than are their colleagues who remain, especially for those teaching in schools where student
achievement is lowest. In other words, the achievement scores of many students will likely increase
as a result of the attrition of some teachers. This may be a reasonable response to a poor initial career

21
choice and may reflect “counseling out” by school officials.
Yet, some of the problems with the attrition process relate to the pattern of transfers within
New York City. Elementary teachers who transfer from higher scoring schools to other schools in
New York City after their first year are less effective on average than the colleagues they leave
behind. The same is true for middle-school math teachers in all but the lowest-scoring schools. That
is, some ineffective teachers are leaving schools, which may be good for the students in those
schools. However, these teachers are simply moving to other schools. If these less effective teachers
were a “better fit” with their new schools, such transfers could result in a net gain, but we do not find
evidence that this is the case. Teachers who were relatively less effective in the schools they left, on
average, are relatively less effective in the schools they enter. This churning of less effective teachers
occurs even though educational outcomes likely would improve if many of these individuals left
teaching.
The churning would be sub-optimal even if there were no differential sorting by those
transferring across schools, but this is not the case. First-year teachers who transfer tend to move to
schools having relatively higher student achievement and relatively fewer poor, Black and Hispanic
students, with the more effective of those transferring experiencing the greatest changes in student
attributes. Thus, the net effect is that traditionally low-performing students are further disadvantaged
and often left with the most inexperienced teachers hired to replace those transferring within New
York City and those leaving teaching in New York State.
Retention policies that differentiate between teachers based on their effectiveness in
improving the educational outcomes of students could be far more beneficial than indiscriminant
policies aimed at reducing attrition across the board. For example, eliminating first-year teacher
attrition could actually be detrimental to student achievement. Even if we assume that leavers would
be replaced by first-year teachers who on average are less effective than second-year teachers, that
extra year of experience does not offset the weak achievement gains of many of the first-year
teachers who leave.
Different policy issues arise with respect to within-district transfers. First, because a
substantial number of ineffective teachers leave their first school and find jobs in another school,
providing a better means to screen applicants might alter this outcome. Second, many relatively
effective teachers leave their initial placements, disproportionately leaving schools with relatively
more low-performing students and transferring to schools with relatively more higher-performing
students, exacerbating achievement gaps. If schools with lower-performing students were as
appealing to teach in as those with higher-scoring students, such sorting could be alleviated.

22
Improving working conditions in traditionally difficult-to-staff schools is central to addressing the
sorting of more effective teachers.
The results presented here raise questions about the nature of teacher retention policies.
Eliminating or even reducing the achievement gaps will inevitably rely on improving the quality of
teachers and teaching for low-achieving, poor, Black and Hispanic students. The recruitment,
selection, development, support, and retention of teachers must be linked to policies that improve
outcomes for students. Several of the policy prescriptions presented here rely on having good
measures of teachers’ abilities to improve a broad range of outcomes for students. Unfortunately,
most states and school districts do not have good measures of a broad range of student outcomes and
there is well-founded concern that a focus on isolating teacher effectiveness solely based on value-
added achievement results will have unintended consequences. We have much to learn about the
properties of such value-added test score measures and their correlation with a broad set of student
learning outcomes. Successful teacher retention policies likely will need to differentiate among the
performance of teachers and create incentives to retain teachers who are most effective and either
help less-effective teachers to improve or encourage them to leave.

23
Figure 1: Cumulative Attrition Rates for Entering NYC Teachers, 2000-2003
0%
5%
10%
15%
20%
25%
1st year 2nd year 3rd year 1st year 2nd year 3rd year 1st year 2nd year 3rd year
Transfer within NYC Transfer outside NYC Leave NYS System
Figure 2: Attrition Rates of First- and Second-Year Teachers in Grades 4-5, by School Groupings Based on Student Performance, 2000-2006
0%
2%
4%
6%
8%
10%
12%
1st Year 2nd Year 1st Year 2nd Year 1st Year 2nd Year
Transfer within NYC Transfer outside NYC Leave NYS system
Higher-scoring schools Middle-scoring schools Lower-scoring schools
Figure 3a: Attrition Rates for First- and Second-Year Teachers in Grades 4-5, by Groupings Based on Teachers’ Value-Added in Math, 2000-2006
0%
2%
4%
6%
8%
10%
1st Year 2nd Year 1st Year 2nd Year 1st Year 2nd Year
Transfer within NYC Transfer outside NYC Leave NYS system
Higher VA (top quartile) Middle group (middle 50%) Lower VA (bottom quartile)

24
Figure 3b: Attrition Rates for First- and Second-Year Teachers in Grades 4-5, by Groupings Based on Teachers’ Value-Added in ELA, 2000-2006
0%2%
4%
6%
8%10%
1st Year 2nd Year 1st Year 2nd Year 1st Year 2nd Year
Transfer within NYC Transfer outside NYC Leave NYS system
Higher VA (top quartile) Middle group (middle 50%) Lower VA (bottom quartile)
a
Figure 4: Estimated First-Year Transition Probabilities by Teacher’s
Effectiveness in Math, Grades 4-5
0
0.020.04
0.06
0.08
-0.25 -0.15 -0.05 0.05 0.15 0.25teacher effectiveness
trans
ition
pro
babi
lity
NYC transfer
NYS transfer
leave NYS system
Figure 5: Distributions of Fourth- and Fifth-Grade Teacher Effectiveness in Math by Retention Status, Schools in Lower-Scoring Quartile
0
0.5
1
1.5
2
2.5
3
-0.5 -0.4 -0.3 -0.2 -0.1 0 0.1 0.2 0.3 0.4 0.5effectiveness in math
rela
tive
freq
uenc
y
same school NYC transfer NYS transfer leave NYS system

25
Figure 6a: Estimated Probability of Transferring Within NYC by Teachers’ Effectiveness in Math with School Grouping Based on Student Performance, First-Year Teachers in Grades 4-5
00.020.040.060.08
0.10.12
-0.25 -0.15 -0.05 0.05 0.15 0.25teacher effectiveness
trans
ition
pro
babi
litie
s higher-scoring schoolsmiddle grouplower-scoring schools
Figure 6b: Estimated Probability of Leaving NYS System by Teachers’ Effectiveness in Math with School Grouping, First-Year Teachers in Grades 4-5
00.020.040.060.080.1
0.12
-0.25 -0.15 -0.05 0.05 0.15 0.25teacher effectiveness
trans
ition
pro
babi
litie
s
higher-scoring schools middle grouplower-scoring schools
Figure 7: Annual Attrition Rates for Teachers in Grades 4-5 and Math Teachers in Grades 6-8
0%
4%
8%
12%
1st Year 2nd Year 1st Year 2nd Year 1st Year 2nd Year
Transfer within NYC . Transfer outside NYC . Leave NYS system
Teachers in Grades 4-5
Math Teachers in Grades 6-8

26
Figure 8: Attrition Rates of First- and Second-Year Math Teachers in Grades 6-8, by School Groupings Based on Student Performance, 2000-2006
0%
4%
8%
12%
16%
20%
24%
1st Year 2nd Year 1st Year 2nd Year 1st Year 2nd Year
Transfer within NYC Transfer outside NYC Leave NYS system
Higher-scoring schools
Middle-scoring schools
Lower-scoring schools
1E+22
Figure 9a: Estimated Probability of First-Year Middle School Math Teachers Transferring Within NYC by Math Value Added and School Grouping
0
0.04
0.08
0.12
0.16
0.2
0.24
-0.15 -0.1 -0.05 0 0.05 0.1 0.15teacher effectiveness
trans
ition
pro
babi
litie
s
higher-scoring schools
middle group
lower-scoring schools
Figure 9b: Estimated Probabilities of First-Year Middle School Math Teachers Leaving the NYS System by Math Value-Added and School Grouping
0
0.04
0.08
0.12
0.16
0.2
0.24
-0.15 -0.1 -0.05 0 0.05 0.1 0.15teacher effectiveness
trans
ition
pro
babi
litie
s
higher-scoring schools
middle group
lower-scoring schools

27
Table 1: Estimates of Parameters Reflecting How Transition Probabilities Vary with Teacher Effectiveness, Fixed-Effect Logit Models for Teachers in Grades Four and Five
Teachers in Grades 4-5 NYC transfer NYS transfer Leave NYS system (N = 3192) 2β s.e. 3β s.e. 4β s.e.
A: Model including measures of math and ELA effectiveness, 1st – 3rd year teachers Math effectiveness -1.354** (0.557) -0.370 (0.710) -1.238** (0.485) ELA effectiveness 0.365 (0.772) 1.283 (0.928) 1.262* (0.661)
B: Model entering math effectiveness separately for 2nd and 3rd year teachers Effectiveness - 1st year teachers -1.247* (0.656) 0.338 (0.896) -1.789*** (0.687) Effectiveness – 2nd & 3rd years teachers -1.184* (0.688) -0.245 (0.917) -0.156 (0.534)
C: Model for 1st year teachers with interactions for schools having lower and higher scoring students Math effect.*low-scoring school -0.169 (1.079) 0.700 (2.215) -3.282*** (1.237) Math effect. *middle group -1.283 (1.132) 0.279 (1.278) -1.209** (0.964) Math effect. *high scoring school -2.729** (1.386) -0.135 (1.970) -0.648 (1.595)
Table 2: Average Within-School Differences in the Effectiveness of the Teachers Making Transitions Compared to Those Remaining in the Same School and
Attrition Rates, First-Year Teachers in Grades 4-5
NYC Transfer NYS Transfer Leave NYS Relative Effectiveness in Math
All Teachers -0.026* 0.003 -0.041*** (0.014) (0.018) (0.014) Teachers in … Lower Scoring Schools -0.004 0.010 -0.072*** (0.021) (0.039) (0.023)
Middle group of schools -0.025 0.005 -0.021 (0.021) (0.023) (0.019)
Higher Scoring Schools -0.072** -0.008 -0.024 (0.032) (0.042) (0.043) Relative Effectiveness in English Language Arts (ELA)
All Teachers 0.001 0.012 0.008 (0.010) (0.013) (0.010) Teachers in … Lower Scoring Schools 0.005 0.038 -0.012 (0.016) (0.029) (0.017)
Middle group of schools 0.003 0.001 0.023 (0.016) (0.018) (0.014)
Higher Scoring Schools -0.007 0.019 0.013 (0.024) (0.031) (0.032)

28
Table 3: Estimates of Parameters Reflecting How Transition Probabilities Vary with Teacher Effectiveness, Fixed-Effect Logit Models for Math and ELA Teachers in Grades 6-8
Math Teachers in Grades 6-8
NYC transfer NYS transfer
Leave NYS system
(N = 1521) 2β s.e. 3β s.e. 4β s.e.
D: Model entering math effectiveness separately for 2nd and 3rd year teachers Math effectiveness - 1st year -1.776* (0.944) 1.299 (2.069) -2.422** (1.008) Math effectiveness – 2nd & 3rd years 0.025 (0.857) 3.432* (1.768) -0.431 (0.798) E: Model for 1st year teachers with interactions for schools having lower- and higher-scoring students Math effect.*low scoring school 0.184 (1.097) 1.705 (3.620) -3.993** (1.557) Math effect. *middle group -5.943*** (2.018) 0.612 (3.004) -1.385 (1.652) Math effect. *high scoring school -5.679** (4.056) 0.275 (4.263) -0.374 (3.069)
ELA Teachers in Grades 6-8 NYC transfer NYS transfer Leave NYS system (N = 1743) 2β s.e. 3β s.e. 4β s.e.
F: Model entering ELA effectiveness separately for 2nd and 3rd year teachers Effectiveness in ELA - 1st year -0.563 (0.916) 2.245 (2.065) 0.004 (1.096) Effectiveness in ELA - 2nd & 3rd years 0.474 (0.869) 3.697* (2.054) -0.021 (0.812) G: Model for 1st year teachers with interactions for schools having lower and higher scoring students ELA effectiveness*low scoring school 1.718 (1.231) 2.796 (3.745) -0.914 (1.718) ELA effect. *middle group -2.923** (1.413) 1.586 (2.673) 1.177 (1.542) ELA effect. *high scoring school -3.467 (4.078) 5.632 (7.779) -6.639 (5.382)
Table 4: Average Within-School Differences in the Effectiveness of the Teachers Making Transitions Compared to Those Remaining in the Same School and Attrition
Rates, First-Year Math Teachers in Grades 6-8
NYC Transfer NYS Transfer Leave NYS Relative Effectiveness in Math All Teachers -0.028** 0.018 -0.047*** (0.012) (0.027) (0.015) Teachers in … Lower Scoring Schools -0.006 0.046 -0.080*** (0.018) (0.057) (0.025)
Middle group of schools -0.056*** 0.025 -0.035* (0.019) (0.033) (0.021)
Higher Scoring Schools -0.090* 0.004 -0.010 (0.046) (0.057) (0.036)

29
Table 5: Regression of Difference in School Attributes Between First and Second Year Teachers by
Teacher Effectiveness in Math, Controlling for Regression Toward the Mean, Grades 4-8
Basic models Models grouping teachers by their effectiveness (1) (2) (3) (4) (5) (6)
Change in… All
teachers
First-year value
demeaned
More effective teachers
Middle group
Less effective teachers
First-year value
demeaned School mean math score 0.134*** -0.498*** 0.196*** 0.143*** 0.091** -0.482*** (0.020) (0.046) (0.049) (0.034) (0.043) (0.052)
Percent of students -0.050*** -0.602*** -0.072*** -0.049*** -0.043*** -0.571*** scoring in bottom quartile (0.007) (0.047) (0.017) (0.012) (0.014) (0.054)
Percent of students 0.042*** -0.456*** 0.063*** 0.046*** 0.027* -0.467*** scoring in top quartile (0.007) (0.046) (0.018) (0.012) (0.016) (0.052)
Percent free-lunch -0.035*** -0.530*** -0.040* -0.061*** -0.014 -0.522*** eligible (0.009) (0.044) (0.024) (0.017) (0.021) (0.052)
Percent of students who -0.038*** -0.383*** -0.055** -0.058*** -0.018 -0.387*** are Black or Hispanic (0.009) (0.040) (0.027) (0.019) (0.024) (0.046)
Table 6: Average Within-School Differences in Teacher Effectiveness for the Second Year of Teaching Comparing Teachers Who Transferred Within
NYC to Teachers in the Same Schools Who Did Not, Grades 4-8
Grades 4-5 Grades 6-8 Math ELA Math ELA All Teachers -0.061*** -0.049*** -0.033 0.019 (0.022) (0.016) (0.025) (0.020) Teachers in … Lower Scoring Schools -0.074* -0.044 -0.061* 0.012 (0.041) (0.030) (0.034) (0.030)
Middle group of schools -0.064** -0.061*** -0.018 0.018 (0.029) (0.021) (0.040) (0.031)
Higher Scoring Schools -0.035 -0.023 -0.060 0.039 (0.054) (0.039) (0.126) (0.064)

References Betts, Julian R., Kim S. Reuben, and Anne Danenberg. 2000. “Equal Resources, Equal Outcomes?
The Distribution of School Resources and Student Achievement in California.” San Francisco, CA: Public Policy Institute of California.
Boyd, Donald J., Pamela L. Grossman, Hamilton Lankford, Susanna Loeb, and James H. Wyckoff.
2008. “Measuring Effect Sizes: The Effect of Measurement Error.” CALDER Working Paper No. 19. Washington, D.C.: National Center for Analysis of Longitudinal Data in Education Research.
Boyd, Donald J., Hamilton Lankford, Susanna Loeb, Jonah E. Rockoff, and James H. Wyckoff. 2007.
“The Narrowing Gap in New York City Teacher Qualifications and Its Implications for Student Achievement in High Poverty Schools.” CALDER Working Paper No. 10. Washington, D.C.: National Center for Analysis of Longitudinal Data in Education Research.
Boyd, Donald J., Hamilton Lankford, Susanna Loeb, and James H. Wyckoff. 2006. “Analyzing the
Determinants of the Matching of Public School Teachers to Jobs: Estimating Compensating Differentials in Imperfect Labor Markets.” Albany, NY: Teacher Policy Research.
Boyd, Donald J., Hamilton Lankford, Susanna Loeb, and James H. Wyckoff. 2005. “Explaining the
Short Careers of High-Achieving Teachers in Schools with Low-Performing Students.” American Economic Review Proceedings 95(2): 166-171.
Clotfelter, Charles T., Helen F. Ladd, Jacob L. Vigdor, and Justin Wheeler. 2007. “High Poverty
Schools and the Distribution of Teachers and Principals.” CALDER Working Paper No.1. Washington, D.C.: National Center for Analysis of Longitudinal Data in Education Research.
Falch, Torberg, and Marte Rønning. 2005. “The Influence of Student Achievement on Teacher
Turnover.” CESIFO Working Paper No. 1469. Munich, Germany: Munich Society for the Promotion of Economic Research (CESifo GmbH).
Goldhaber, Dan, Betheny Gross, and Daniel Player. 2007. “Are Public Schools Really Losing Their
Best? Assessing the Career Transitions of Teachers and Their Implications for the Quality of the Teacher Workforce.” CALDER Working Paper No. 12. Washington, D.C.: National Center for Analysis of Longitudinal Data in Education Research.
Eric A. Hanushek, John F. Kain, Daniel M. O'Brien, and Steven G. Rivkin.2005. “The Market for
Teacher Quality.” NBER Working Paper No. 11154. Cambridge, MA: National Bureau of Economic Research, Inc.
Eric A. Hanushek, John F. Kain, and Steven G. Rivkin. 2004. “Why Public Schools Lose Teachers.” Journal of Human Resources 39(2): 326-354.
Ingersoll, Richard M., and Thomas M. Smith. 2003. “The Wrong Solution to the Teacher Shortage.”
Educational Leadership 60(8): 30-33. Ingersoll, Richard M., and Thomas M. Smith. 2004. “What are the Effects of Mentoring and Induction
on Beginning Teacher Turnover?” American Education Research Journal 41(3): 681-714. Jacob, Brian A., and Lars Lefgren. 2005. “Principals as Agents: Subjective Performance Measurement
in Education.” NBER Working Paper No. 11463.Cambridge, MA: National Bureau of Economic Research, Inc.
30

Johnson, Susan M., and The Project on the Next Generation of Teachers 2004. Finders and Keepers: Helping New Teachers Survive and Thrive in Our Schools. San Francisco, CA: Wiley, John & Sons, Inc.
Kane, Thomas J., Jonah E. Rockoff, and Douglas O. Staiger. 2006. “What Does Certification Tell Us
About Teacher Effectiveness? Evidence from New York City.” NBER Working Paper 12155. Cambridge, MA: National Bureau of Economic Research, Inc.
Kane, Thomas J., and Douglas O. Staiger. 2002. “Volatility in School Test Scores: Implications for Test-Based Accountability Systems.” In Brookings Papers on Education Policy, edited by Diane Ravitch. Washington, D.C.: The Brookings Institution.
Lankford, Hamilton, Susanna Loeb and James H. Wyckoff. 2002. “Teacher Sorting and the Plight of
Urban Schools: A Descriptive Analysis.” Educational Evaluation and Policy Analysis 24(1): 38-62.
Loeb, Susanna, Linda Darling-Hammond, and John Luczak. 2005. “How Teaching Conditions Predict
Teacher Turnover in California Schools.” Peabody Journal of Education 80(3): 44-70. Morris, Carl N. 1983. “Parametric Empirical Bayes Inference: Theory and Application.” Journal of
the American Statistical Association 78(381): 47-55. Murnane, Richard J. 1984. “Selection and Survival in the Teacher Labor Market.” The Review of
Economics and Statistics 66(3): 513-518. Murnane, Richard J., John B. Willett, Yves Duhaldeborde, and John H. Tyler. 2000. “How Important
Are the Cognitive Skills of Teenagers in Predicting Subsequent Earnings?” Journal of Policy Analysis and Management 19(4): 547-568.
Peske, Heather G.., and Kati Haycock. 2006. “Teaching Inequality: How Poor and Minority Students
Are Shortchanged on Teacher Quality.” Washington, D.C.: The Education Trust. Podgursky, Michael, Ryan Monroe, and Donald Watson. 2004. “The Academic Quality of Public
School Teachers: An Analysis of Entry and Exit Behavior.” Economics of Education Review 23(5): 507- 518.
Rivkin, Steven G., Eric A. Hanushek, and John F. Kain. 2005. “Teachers, Schools and Academic
Achievement.” Econometrica 73(2): 417-458.
Rockoff, Jonah E. 2004. “The Impact of Individual Teachers on Student Achievement: Evidence from Panel Data.” American Economic Review Proceedings 94(2): 247-252.
Marvel, John, Deanna M. Lyter, Pia Peltola, Gregory A. Strizek, and Beth A. Morton. 2007. Teacher
Attrition and Mobility: Results from the 2004–05 Teacher Follow-up Survey NCES 2007–307. U.S. Department of Education, National Center for Education Statistics. Washington, DC: U.S. Government Printing Office.
31
32
Appendix
Value-Added Analysis: Descriptive statistics for the variables included in the four value-
added models are reported in Table A1. Data for the same schools, teachers and students are used
to estimate the math and ELA value-added models for fourth- and fifth-grade teachers shown as
Models 1 and 2 in Table A2. However, the descriptive statistics for the class-attribute variables
differ very slightly because of differences in the compositions of the classes taught by some of
these teachers. Value-added Models 3 and 4 are for math and ELA in grades six through eight.
The two sets of estimates are based on the same sets of schools and students, except for some
missing data. However, the estimated models largely correspond to two different sets of teachers
as only five percent of all math and ELA middle-school teachers teach both subjects.
Estimation of Attrition Model: The approach we used to estimate the effectiveness
coefficients report in Table 1 warrants some explanation. Standard software packages such as
SAS and Stata do not include procedures that allow direct estimation of the fixed-effect
multinomial Logit model in (2). However, a work-around is possible since these packages can be
used to estimate binary logit models containing fixed effects. Starting with our model shown in
(2), consider the probability of making a particular transition, say leaving the NYS system (h=4),
conditional on the teacher either making that change or remaining in the same school. This
condition probability, shown below, is a simple binary logit probability that only depends upon the
effectiveness coefficient and fixed-effect associated with this transition. Thus, 4 4
44 4
exp( )1 exp( )
s jj
s j
EP
Eα β
α β
+=
+ +
standard fixed-effect binary Logit software and data for teachers who either remain in their
original school or leave the NYS system can be used to estimate 4β . This is the method we
employed for each of the three transitions, yielding estimates of all the effectiveness coefficients.
The parameter estimates are consistent. However, there is some loss in efficiency compared to the
case where the fixed-effect multinomial model was directly estimated.

33
Table A1: Descriptive Statistics for Dependent and Explanatory Variables in Regression Models Used to Estimate Value-Added Measures for Teachers
Math, Grades 4-5 ELA, Grades 4-5 Math, Grades 6-8 ELA, Grades 6-8 Students’ own attributes Mean Std. Dev. Mean Std. Dev. Mean Std. Dev. Mean Std. Dev. Current year score 0.1049 0.9529 0.0725 0.9746 0.0733 0.9422 0.0433 0.9698 Lagged ELA score 0.0991 0.9342 0.0991 0.9342 0.0511 0.9508 0.0588 0.9467 Lagged math score 0.1362 0.9237 0.1363 0.9236 0.0935 0.9249 0.0994 0.9230 School change during year 0.1041 0.3054 0.1041 0.3054 0.4085 0.4915 0.4078 0.4914 Female 0.5109 0.4999 0.5109 0.4999 0.5107 0.4999 0.5106 0.4999 Hispanic 0.3631 0.4809 0.3631 0.4809 0.3492 0.4767 0.3445 0.4752 Black 0.3524 0.4777 0.3524 0.4777 0.3696 0.4827 0.3721 0.4834 Asian 0.1190 0.3238 0.1190 0.3238 0.1196 0.3245 0.1207 0.3258 Other minority 0.0048 0.0690 0.0048 0.0690 0.0034 0.0579 0.0034 0.0579 Home Language English 0.6143 0.4867 0.6144 0.4867 0.5884 0.4921 0.5921 0.4914 Free-lunch eligible 0.6656 0.4718 0.6656 0.4718 0.6256 0.4840 0.6235 0.4845 Reduced-lunch eligible 0.0770 0.2667 0.0770 0.2667 0.0828 0.2756 0.0832 0.2762 Free or reduced lunch missing 0.1130 0.3166 0.1130 0.3166 0.1563 0.3632 0.1568 0.3636 ELL per IEP or lab exam 0.0187 0.1355 0.0187 0.1355 0.0341 0.1816 0.0290 0.1678 ELL per the school 0.0001 0.0097 0.0001 0.0097 0.0001 0.0097 0.0001 0.0094 IEP does not require bilingual services 0.0004 0.0193 0.0004 0.0193 0.0003 0.0182 0.0003 0.0181 Lagged absences 10.968 10.072 10.968 10.072 12.058 11.250 12.051 11.249 Lagged suspensions 0.0116 0.1263 0.0116 0.1263 0.0257 0.1925 0.0257 0.1925 Class attributes Lagged ELA score - mean 0.0979 0.6201 0.0978 0.6202 0.0500 0.6875 0.0577 0.6847 Lagged ELA score - standard deviation 0.6879 0.2009 0.6879 0.2009 0.6423 0.2045 0.6389 0.2039 Lagged math score - mean 0.1245 0.6015 0.1247 0.6015 0.0893 0.6667 0.0955 0.6616 Lagged math score - standard deviation 0.7052 0.1854 0.7050 0.1854 0.6333 0.2085 0.6362 0.2047 Hispanic 0.3639 0.2850 0.3641 0.2851 0.3459 0.2754 0.3414 0.2723 Black 0.3493 0.3318 0.3493 0.3318 0.3688 0.3199 0.3714 0.3202 Asian 0.1217 0.1837 0.1215 0.1836 0.1222 0.1729 0.1231 0.1730 Other minority 0.0050 0.0158 0.0050 0.0158 0.0037 0.0130 0.0037 0.0130 Home language English 0.6028 0.2791 0.6028 0.2792 0.5849 0.2612 0.5887 0.2585 Free-lunch eligible 0.6639 0.2961 0.6646 0.2964 0.6209 0.2889 0.6195 0.2891 Reduce-lunch eligible 0.0756 0.0812 0.0757 0.0813 0.0819 0.0822 0.0824 0.0823 ELL per IPE or lab exam 0.0440 0.0986 0.0440 0.0988 0.0452 0.1228 0.0397 0.1060 Lagged absences 11.213 3.901 11.209 3.898 12.549 4.920 12.542 4.929 Lagged suspensions 0.0123 0.0356 0.0123 0.0355 0.0279 0.0621 0.0279 0.0623 Class-size 26.3 4.6 26.2 4.6 27.3 5.1 27.3 5.2 Grade 5 dummy variable 0.5030 0.5000 0.5030 0.5000 Grade 7 0.3477 0.4763 0.3482 0.4764 Grade 8 0.3260 0.4688 0.3275 0.4693

34
Table A2: Parameter Estimates for Regression Models Used to Estimate Value-Added Measures for Teachers
Dependent variable Grades 4-5 Grades 6-8 Math Score ELA Score Math Score ELA ScoreStudent’s own attributes Coefficients Std. error Coefficients Std. error Coefficients Std. error Coefficients Std. error Lagged ELA Score 0.1523*** (0.0010) 0.4940*** (0.0011) 0.1256*** (0.0010) 0.4753*** (0.0011) Lagged ELA Score squared 0.0081*** (0.0004) -0.0131*** (0.0004) -0.0013*** (0.0003) -0.0034*** (0.0004) Lagged math Score 0.6150*** (0.0010) 0.2610*** (0.0012) 0.5427*** (0.0010) 0.1850*** (0.0011) lagged math Score squared -0.0415*** (0.0004) -0.0078*** (0.0004) 0.0004 (0.0003) 0.0069*** (0.0004) School change during year -0.0037 (0.0025) 0.0003 (0.0027) -0.0370*** (0.0027) -0.0438*** (0.0031) Female -0.0564*** (0.0012) 0.0669*** (0.0013) -0.0234*** (0.0012) 0.1038*** (0.0014) Hispanic -0.0611*** (0.0025) -0.0470*** (0.0028) -0.0558*** (0.0025) -0.0355*** (0.0028) Black -0.0889*** (0.0027) -0.0497*** (0.0030) -0.0636*** (0.0026) -0.0456*** (0.0029) Asian 0.1333*** (0.0028) 0.0138*** (0.0031) 0.1120*** (0.0028) -0.0063** (0.0031) Other minority -0.0581*** (0.0093) -0.0397*** (0.0102) -0.0237** (0.0112) -0.0494*** (0.0124) Home Language English -0.0740*** (0.0017) -0.0118*** (0.0019) -0.0578*** (0.0017) 0.0013 (0.0019) Free-lunch eligible -0.0482*** (0.0023) -0.0805*** (0.0025) -0.0266*** (0.0022) -0.0603*** (0.0025) Reduced-lunch eligible -0.0210*** (0.0029) -0.0517*** (0.0032) -0.0061** (0.0029) -0.0313*** (0.0032) Free or reduced lunch -0.0357*** (0.0036) -0.0377*** (0.0039) -0.0342*** (0.0029) -0.0404*** (0.0032) ELL per IEP or lab exam -0.0854*** (0.0055) -0.1559*** (0.0060) -0.0908*** (0.0045) -0.1822*** (0.0051) ELL per the school -0.0219 (0.0652) 0.0933 (0.0713) -0.0383 (0.0651) 0.0636 (0.0746) IEP does not require bilingual -0.0565* (0.0325) -0.0105 (0.0356) -0.1549*** (0.0344) -0.1171*** (0.0386) Lagged absences -0.0030*** (6.7103) -0.0006*** (0.0000) -0.0040*** (0.0000) -0.0007*** (0.0000) Lagged suspensions -0.0165*** (0.0050) -0.0276*** (0.0055) -0.0386*** (0.0034) -0.0273*** (0.0038)Class attributes Lagged ELA score - mean -0.0007 (0.0396) -0.1386*** (0.0436) 0.0770*** (0.0041) 0.1213*** (0.0048) Lagged ELA score - standard 0.0223 (0.0436) -0.0044 (0.0480) 0.0145*** (0.0048) 0.0247*** (0.0056) Lagged math score - mean -0.2044*** (0.0374) 0.1465*** (0.0412) 0.1508*** (0.0045) 0.1582*** (0.0053) Lagged math score - standard 0.0607 (0.0481) 0.1113** (0.0529) 0.0570*** (0.0046) 0.0489*** (0.0054) Hispanic -0.5853*** (0.1325) -0.2807* (0.1452) -0.1078*** (0.0135) -0.0636*** (0.0155) Black -0.7616*** (0.1361) -0.5061*** (0.1495) -0.0941*** (0.0133) -0.0734*** (0.0154) Asian -0.4151** (0.2063) -0.0192 (0.2266) 0.0370** (0.0145) 0.0790*** (0.0168) Other minority -1.7313*** (0.5047) -1.6778*** (0.5547) -0.0387 (0.0682) -0.0664 (0.0795) Home language English 0.2704** (0.1110) 0.3280*** (0.1211) -0.0338*** (0.0102) 0.0147 (0.0118) Free-lunch eligible -0.2335** (0.1108) -0.1182 (0.1233) -0.0687*** (0.0094) -0.0881*** (0.0108) Reduce-lunch eligible -0.1555 (0.1745) -0.6203*** (0.1938) -0.0102 (0.0153) -0.0725*** (0.0175) ELL per IPE or lab exam -0.2195 (0.1494) -0.7024*** (0.1689) 0.0876*** (0.0119) 0.0645*** (0.0148) Lagged absences 0.0031 (0.0036) -0.0063 (0.0039) -0.0056*** (0.0003) -0.0047*** (0.0003) Lagged suspensions 0.0250 (0.2713) 0.1825 (0.2970) -0.1016*** (0.0180) -0.1139*** (0.0208) Class-size -0.0042* (0.0025) -0.0122*** (0.0027) 0.0000 (0.0002) 0.0012*** (0.0002) Grade 5 0.0468*** (0.0181) 0.2198*** (0.0199) Grade 7 0.0627*** (0.0049) 0.0488*** (0.0060)
Grade 8 0.0232*** (0.0056) 0.0182*** (0.0068)