who likes to learn new things: measuring adult motivation
TRANSCRIPT

Who likes to learn new things: measuring adult motivation to learn with PIAAC data from 21 countriesJulia Gorges1*, Débora B. Maehler2, Tobias Koch3 and Judith Offerhaus4
BackgroundSince the introduction of the Programme for International Student Assessment (PISA) in the year 2000, many countries measure and compare adolescents’ competencies on a regular basis. PISA gives insight into how effective a country’s educational system is in terms of equipping high school students with key skills for life in a modern society (OECD 2014). Additionally, educational and psychological research using data from the comprehensive background questionnaires adds to the literature on non-cognitive fac-tors contributing to competence acquisition and other educational outcomes. Thereby PISA sheds light on Motivation-to-Learn (MtL), a key theoretical construct in educa-tional psychology (e.g., Nagengast et al. 2011; for an overview on motivation in educa-tion see Marsh and Hau 2004; Schunk et al. 2014).
Abstract
Background: Despite the importance of lifelong learning as a key to individual and societal prosperity, we know little about adult motivation to engage in learning across the lifespan. Building on educational psychological approaches, this article presents a measure of Motivation-to-Learn using four items from the background questionnaire of the Programme for the International Assessment of Adult Competencies (PIAAC).
Methods: We used multiple-group confirmatory factor analyses for ordered categori-cal data to investigate the scale’s dimensionality and measurement invariance across countries. Regression analyses were used to investigate the scale’s criterion validity.
Results: Results show that the proposed four-item scale fits the data considerably bet-ter than the original six-item scale labeled Readiness-to-Learn. Further analyses support the scale’s configural, metric (weak) and partial scalar (strong) measurement invariance across 21 countries. As expected, Motivation-to-Learn has significant relations to the working population’s engagement in learning in terms of participation in non-formal education over the last 12 months. These relations remain relevant after taking literacy as an indicator of level of education into account.
Conclusion: The Motivation-to-Learn scale presented here may be used to indicate adult motivation in cross-country comparisons. The potential of using the scale in future PIAAC analyses and research on adult learning is discussed.
Open Access
© 2016 Gorges et al. This article is distributed under the terms of the Creative Commons Attribution 4.0 International License (http://creativecommons.org/licenses/by/4.0/), which permits unrestricted use, distribution, and reproduction in any medium, provided you give appropriate credit to the original author(s) and the source, provide a link to the Creative Commons license, and indicate if changes were made.
RESEARCH
Gorges et al. Large-scale Assess Educ (2016) 4:9 DOI 10.1186/s40536-016-0024-4
*Correspondence: [email protected] 1 Faculty of Psychology and Sports Science, Department of Psychology, Bielefeld University, PO Box 10 01 31, 33501 Bielefeld, GermanyFull list of author information is available at the end of the article

Page 2 of 22Gorges et al. Large-scale Assess Educ (2016) 4:9
In 2013, the Programme for the International Assessment of Adult Competencies (PIAAC) drew the attention of politicians and researchers to adult learners, a previously neglected group within educational psychology. Unlike full-time students in the PISA, adults participating in the PIAAC vary substantially in their past, present and poten-tial future engagements in educational activities. Further education during adulthood is central to catching up on and maintaining competencies. However, the majority of exist-ing research on participation in further education focuses on individual and contextual socio-demographic predictors (OECD 2005), whereas adult MtL is relatively understud-ied despite its theoretical and empirical relevance for adult lifespans (Courtney 1992; Gorges 2015).
It is difficult to account for motivation in the PIAAC because—unlike PISA—it does not measure established motivational psychological constructs. However, section I of the background questionnaire pertains to psychological factors of skill acquisition that provide an opportunity to measure motivation via a newly developed scale hitherto referred to as Readiness to Learn (RtL). Building on the RtL items, the goal of the present paper is twofold: (1) to examine whether the RtL items also assess adult MtL and (2) to empirically investigate the psychometric properties of the resulting MtL measure. We start with a review of potential theoretical constructs that constitute adult MtL and map the RtL items onto established MtL measures from educational psychology research. We then examine the MtL scale’s factorial validity and test for measurement invariance across countries using confirmatory factor analyses. Finally, we check the scale’s crite-rion validity based on its relations with participation in further education as assessed in the PIAAC background questionnaire, while accounting for socio-demographic deter-minants of age, employment, and literacy as an indicator of level of education (OECD 2005). In sum, our goal is to build a psychometrically sound scale that may be used as a measure of general adult MtL in future investigations using PIAAC data.
Motivation‑to‑Learn in educational psychology
Educational psychology produced manifold theoretical approaches to define MtL in educational contexts (Schunk et al. 2014). While earlier research mostly differentiated quantities of motivation, later research shifted its focus from quantities to qualities of motivation providing fruitful explanation for and predictions of individuals’ experi-ences and behaviors. The latter expounded on student MtL during primary and sec-ondary school, which are both relevant for research on adult learning (Courtney 1992; Gorges 2015; Gorges and Kandler 2012). Furthermore, what motivates task choice typi-cally motivates cognitive task engagement (Pintrich and Schrauben 1992), use of deep-level versus surface-level learning strategies (Ames and Archer 1988), and consequential learning outcomes (cf., Schunk et al. 2014). Therefore, our review of research focuses on motivational constructs that predict engagement in learning.
One major line of research focuses on the distinction between intrinsic and extrin-sic forms of motivation (cf., Rheinberg 2010; Ryan and Deci 2000). Intrinsic motiva-tion refers to the (anticipated) enjoyment gained from task engagement independent of extrinsic rewards or subsequent consequences. Intrinsic motivation is closely related to the concept of interest, and is a positive emotional and personal valence attached to a particular object of interest or an activity (cf. Renninger et al. 1992). However, intrinsic

Page 3 of 22Gorges et al. Large-scale Assess Educ (2016) 4:9
motivation has been conceptualized as situation-specific, whereas interest-based moti-vation can be situation-specific or reflect an enduring personal characteristic (cf., Ren-ninger et al. 1992; Schiefele 2009). Intrinsically motivated behavior is driven by positive incentives inherent in particular activities and experiences in school contexts (cf., Schunk et al. 2014) and beyond (e.g., Durik et al. 2006). By contrast, extrinsic motiva-tion refers to task engagement due to external incentives or punishments (cf., Rhein-berg 2010; Ryan and Deci 2000). Extrinsic motivation may lead to selection of a task that contributes to the learner’s short- or long-term personal goals (e.g., career aspirations). Intrinsic motivation is typically assessed using items that explicate people’s affective and/or cognitive evaluations of a particular object or activity, whereas extrinsic motiva-tion is assessed with reference to external incentives for task engagement.
A second productive strand of motivational research refers to goal-directed behavior. People pursue higher order goals across specific tasks and situations, and this goal ori-entation provides underlying reasons for engaging in learning activities. In educational settings, the distinction between performance and mastery goal orientation has received considerable attention (Maehr and Zusho 2009). Learners with performance goal ori-entation strive to outperform others and demonstrate their abilities, whereas learners with mastery goal orientation strive to develop their skills. Goal orientation can be con-ceptualized as either situation- or person-centered (Maehr and Zusho 2009). The for-mer refers to active goals guiding a learner’s behavior in a particular learning situation; the latter reflects an “enduring personality disposition” guiding action across situations (Kaplan and Maehr 2007, p. 163). The respective conceptualization is typically implied in the instructions used to assess goal orientation. For example, Harackiewicz et al. (1997) asked university students to report on their goal orientation with respect to a specific course. Accordingly, implementing a person-centered conceptualization of goal ori-entation, individuals may be asked to report on their mastery goal orientation using a measure that refers to their general—i.e., not situation-specific—goal orientation. In this case, individuals with high mastery goal orientation should be more likely to embrace opportunities to develop their skills and expand their knowledge than individuals with low mastery goal orientation (Gorges et al. 2013; Schunk et al. 2014). In addition, mas-tery goal orientation relates to the use of deep-level learning strategies such as elabora-tion (Ames and Archer 1988). Hence, goal orientations explain differences in individual task preferences, and the quality and extent of cognitions and experiences during task engagements (cf. Maehr and Zusho 2009).
Motivation in the PIAAC
Items in the PIAAC background questionnaire
PIAAC “provides a rich source of data on adults’ proficiency in literacy, numeracy and problem solving in technology-rich environments [ICT]—the key information-process-ing skills that are invaluable in 21st-century economies—and in various ‘generic’ skills, such as co-operation, communication, and organizing one’s time” (OECD 2013a, p. 3). These skills are assumed to be critical information-processing competencies important for adults in different life contexts, like work and social participation.
To gain a deeper understanding of skill development and skill differences, the PIAAC background questionnaire includes a range of questions on generic skills, everyday

Page 4 of 22Gorges et al. Large-scale Assess Educ (2016) 4:9
activities, and the subjective perception of matching skills and workplace requirements for example (OECD 2011). Although not specified in further detail, the background ques-tionnaire features a so-called Readiness-to-Learn scale (Yamamoto et al. 2013, p. 24). It is important to note that this scale has also been labeled meta-cognitive abilities in the con-ceptual framework of the background questionnaire (i.e., abilities that “structure the learning process and affect the efficiency with which new information is being processed” OECD 2011, p. 52), learning styles in the reader’s companion (i.e., “interest in learning, approach to new information” OECD 2013a, p. 39), or learning strategies in other sources (i.e., “ability to acquire […] skills after leaving education” Allen et al. 2013, p. 10). The fact that all these labels refer to the same items illustrates a common challenge in educational psychology that may be termed “jingle-jangle fallacy”, which refers to the problem of dif-ferentiating between the multitude of different motivational constructs and terms used in the literature (see Murphy and Alexander 2000 for a thorough review of motivational ter-minology). For PIAAC investigators, including RtL1 items was considered crucial because “there is good empirical evidence that [these] learning strategies affect the acquisition of skills and educational attainment” (OECD 2011, p. 53; see also OECD 2013b).
According to the conceptual framework of the background questionnaire, RtL items go back to the work of Kirby and coauthors on approaches to learning (OECD 2011). Building on Biggs (1985) and Entwistle and Ramsden (1982), Kirby et al. (2003) concep-tualize approaches to learning as “a set of motives and strategies” (p. 32). While Biggs (1985) distinguishes different forms of motivation on the one hand and different learn-ing strategies on the other, Kirby et al. (2003, p. 50) argue that each form of motivation is inherently linked to a specific strategic approach to learning (e.g., intrinsic motivation is related to deep-level learning). Hence, they built subscales comprising both motivational items (e.g., “In my job one of the main attractions for me is to learn new things”) and items referring to learning strategies (“In trying to understand new ideas, I often try to relate them to real life situations to which they might apply”).
Existing instruments to assess approaches to learning within the school context (Mar-ton and Saljö 1976; Entwistle and Ramsden 1982) are not consistent with Kirby et al. (2003) approaches to learning in work contexts. Therefore, newly developed items that “aim to measure the extent of elaborate or deep learning” were implemented in the PIAAC background questionnaire (OECD 2011, p. 53). While the initial goal was to measure deep and surface approaches to learning using 13 items, only the six items listed in Table 1 were retained after preliminary studies (OECD 2010a).
Smith et al. (2015) examined the psychometric properties of this 6-item RtL scale for the PIAAC US-sample. Although they state that the underlying theoretical constructs are unclear they argue that RtL relates to concepts from educational psychology and adult education research. Their findings show that the scale fails to show unidimension-ality unless they allowed for correlated errors between item 1 and item 3. Including error correlations in their confirmatory factor analyses lead to an acceptable fit, which, how-ever, is statistically questionable because it indicates that some items share more than what is captured by the one RtL factor. According to Smith et al. (2015) the RtL scale with correlated errors shows strong measurement invariance across gender, age groups,
1 We use this unspecified term to refer to the 6-item scale following its usage in the education literature (Smith et al. 2015), and to avoid anticipation of our results.

Page 5 of 22Gorges et al. Large-scale Assess Educ (2016) 4:9
Tabl
e 1
Item
s of
the
read
ines
s-to
-lear
n sc
ale
in th
e pi
aac
back
grou
nd q
uest
ionn
aire
Verb
atim
que
stio
ns: “
I wou
ld n
ow li
ke to
ask
you
som
e qu
estio
ns a
bout
how
you
dea
l with
pro
blem
s an
d ta
sks
you
enco
unte
r. To
wha
t ext
ent d
o th
e fo
llow
ing
stat
emen
ts a
pply
to y
ou?”
; ans
wer
s ha
ve b
een
reco
rded
us
ing
the
follo
win
g re
spon
se o
ptio
ns: 1
not
at a
ll, 2
ver
y lit
tle, 3
to s
ome
exte
nt, 4
to a
hig
h ex
tent
, 5 to
a v
ery
high
ext
ent
No.
Item
s fr
om P
IAA
C (o
rigi
nal v
aria
ble
nam
e)Si
mila
r ite
ms
from
edu
catio
nal p
sych
olog
y re
sear
chSo
urce
1W
hen
I hea
r or r
ead
abou
t new
idea
s, I t
ry to
rela
te th
em to
real
lif
e si
tuat
ions
to w
hich
they
mig
ht a
pply
. (I_
Q04
b)I t
ry to
rela
te id
eas
in th
is s
ubje
ct to
thos
e in
oth
er c
ours
es
whe
neve
r pos
sibl
eLe
arni
ng s
trat
egie
s fro
m th
e M
SLQ
(Dun
can
and
McK
each
ie
2005
)
2I l
ike
lear
ning
new
thin
gs. (
I_Q
04d)
In a
cla
ss li
ke th
is, I
pre
fer c
ours
e m
ater
ial t
hat r
eally
cha
lleng
es
me
so th
at I
can
lear
n ne
w th
ings
. Why
do
you
go to
col
-le
ge?
Beca
use
I exp
erie
nce
plea
sure
and
sat
isfa
ctio
n w
hile
le
arni
ng n
ew th
ings
Mot
ivat
ion
from
the
MSQ
L (D
unca
n an
d M
cKea
chie
200
5),
intr
insi
c m
otiv
atio
n (V
alle
rand
et a
l. 19
92)
3W
hen
I com
e ac
ross
som
ethi
ng n
ew, I
try
to re
late
it to
wha
t I
alre
ady
know
. (I_
Q04
h)W
hen
read
ing
for t
his
clas
s, I t
ry to
rela
te th
e m
ater
ial t
o w
hat
I alre
ady
know
Lear
ning
str
ateg
ies
from
the
MSL
Q (D
unca
n an
d M
cKea
chie
20
05)
4I l
ike
to g
et to
the
bott
om o
f diffi
cult
thin
gs. (
I_Q
04j)
The
mos
t sat
isfy
ing
thin
g fo
r me
is to
und
erst
and
the
cont
ent
as th
orou
ghly
as
poss
ible
. I e
njoy
puz
zlin
g ov
er […
] pro
b-le
ms
Mot
ivat
ion
from
the
MSQ
L (D
unca
n an
d M
cKea
chie
200
5),
intr
insi
c ta
sk v
alue
(Tra
utw
ein
et a
l. 20
12)
5I l
ike
to fi
gure
out
how
diff
eren
t ide
as fi
t tog
ethe
r. (I_
Q04
l)I l
ike
the
subj
ect m
atte
r of t
his
cour
se. W
hy d
o yo
u go
to c
ol-
lege
? Fo
r the
hig
h fe
elin
g th
at I
expe
rienc
e w
hile
read
ing
on
vario
us in
tere
stin
g su
bjec
ts
Mot
ivat
ion
from
the
MSQ
L (D
unca
n an
d M
cKea
chie
200
5),
intr
insi
c m
otiv
atio
n (V
alle
rand
et a
l. 19
92)
6If
I don
’t un
ders
tand
som
ethi
ng, I
look
for a
dditi
onal
info
rma-
tion
to m
ake
it cl
eare
r. (I_
Q04
m)
If I c
an le
arn
som
ethi
ng n
ew in
[…],
I’m p
repa
red
to u
se m
y fre
e tim
e to
do
so. U
nder
stan
ding
[…] i
s im
port
ant t
o m
eIn
trin
sic
task
val
ue (T
raut
wei
n et
al.
2012
); m
aste
ry g
oal o
rient
a-tio
n (H
arac
kiew
icz
et a
l. 19
97)

Page 6 of 22Gorges et al. Large-scale Assess Educ (2016) 4:9
and employment status, although the scale failed to show such invariance across edu-cational levels. Thus, although the six-item scale has successfully been used by M. C. Smith, Rose, Ross-Gordon, and Smith et al. (2014) to predict literacy skills above and beyond socio-demographic factors, findings regarding the factorial structure of the RtL scale suggest that—at least in the US sample—it potentially lumps together what are actually two distinct theoretical constructs underlying the six items.
From readiness‑to‑learn to motivation‑to‑learn
The conceptualization of approaches to learning used to develop the RtL scale in the PIAAC background questionnaire explicitly combines motivation to learn and learn-ing strategies, which are theoretically and empirically distinct constructs according to the educational psychology literature (see examples in Table 1 and research using the Motivated Strategies for Learning Questionnaire; cf., Duncan and McKeachie 2005). Thus, combining both in one scale obliterates the theoretical existence of two impor-tant and discrete prerequisites of successful engagement in learning. Therefore, we care-fully examine the items at hand in order to differentiate MtL, or the use of deep learning strategies, within the theoretically conglomerate RtL scale.
A closer look at the six items reveals that they may be grouped into items expressing intrinsic forms of motivation (what people “like” to do in items 2, 4, and 5), and spon-taneous behaviors people show in particular situations (what people “try” or “look” for in context in items 1, 3, and 6). Two of the behavioral items (1 and 3) match expres-sions typically used to assess the deep-level learning strategy of elaboration (Duncan and McKeachie 2005) but neither of the two items includes information on the motiva-tion for people to use such a strategy. However, item 6 contains not only a spontaneous behavior but also a motivation for this behavior (“to make it clearer”). Thus, in addition to intrinsic motivation in items 2, 4, and 5, item 6 also focuses on aspects of individual MtL and skill development.
Looking more closely, item 2 refers to the positive experience of learning new things. Individuals agreeing with this statement should enjoy learning and willingly engage in learning opportunities. Motivational measures of the experiential quality of learning pri-marily tap intrinsic forms of motivation. Accordingly, the wording of this item is close to a typical measure of intrinsic motivation (e.g., Trautwein et al. 2012). Items 4 and 5 refer to the satisfaction one gains from task engagement with the purpose of understand-ing if not mastering difficult things. Thus, these items relate to a mastery goal orienta-tion. Finally, item 6 describes goal-directed behavior explicitly; the goal is to understand “something unclear”. Given this reason behind one’s actions, the item relates to mastery goal orientation and, thus, is motivational as well. Table 1 illustrates the substantial over-lap of the six RtL items with items from educational psychology research. Overall, we conclude that these four items show theoretical MtL content validity based on the dis-cussion outlined above, and thus proceed to test their construct validity.
Cross‑country comparisons based on PIAAC data
One of the PIAAC’s outstanding features is collection of cross-national data offering large-scale comparisons of multiple OECD countries and cultures. PIAAC data have been collected from representative samples of the adult population aged 16–65 in 24
Page 7 of 22Gorges et al. Large-scale Assess Educ (2016) 4:9
countries (OECD 2013a). However, comparisons across countries require measure-ment instruments—standardized skill assessments and scales—to be equivalent across countries. In order to draw reasonable conclusions from such analyses we must be sure that the meaning of the scale of interest or the items used to measure it are not cultur-ally influenced. For this purpose, it is necessary to examine the degree of measurement invariance by country (Chen 2008).
Measurement invariance (MI) in multiple group comparison may pertain to different parameters of psychological assessment (Chen 2008; Sass 2011). In the case of continu-ous observed variables, the following parameters are constrained to establish different levels of MI across groups: intercept parameters, factor loadings, and residual variances. Hence, in the case of continuous observed variables, four levels of MI are typically tested (see e.g. Widaman and Reise 1997): (1) configural, (2) weak or metric, (3) strong or sca-lar, and (4) strict. Configural MI means that the parameters (e.g., factor loadings, inter-cept parameters, and residual variances) in the measurement model are not constrained, but freely estimated in all groups. Weak (or metric) MI implies that the factor loadings are set equal in all groups. However, the intercept and residual variances are allowed to vary across groups. Strong (or scalar) MI is established if the factor loadings and inter-cept parameters are held equal in all groups. For identification purposes the means of latent factors is fixed to zero in one group (i.e., the reference group) and freely estimated in all remaining groups when testing for strong MI. Strict MI requires that researchers constrain all parameters in the measurement model. Hence, strict MI is established if the intercept parameters, factor loadings and residual variances are held equal in groups. From a psychometrical point of view, strong measurement invariance is sufficient to ensure that the same construct is measured in all groups and to compare the means of the latent factor across countries (Widaman and Reise 1997).
In this study, we treated the items as ordered categorical observed variables. Because factor models with categorical observed variables are based on conditional probabilities, intercept parameters are fixed to zero and residual variances are fixed to 1 using a fac-tor analytical approach (Millsap and Yun-Tein 2004). This means that researchers may impose restrictions on thresholds and/or factors loadings in order to test the level of MI in case of ordered categorical data.
The present study
Building on the theoretical analyses of the PIAAC background questionnaire items, the goal of the present study is to test whether items 2, 4, 5, and 6 reflect the underly-ing construct of MtL. As the PIAAC background questionnaire does not contain other motivational scales, our analyses focus on testing factorial validity (i.e., factor structure), measurement invariance (MI) across groups, and the relation of MtL to participation in further education. We approach the empirical test of the scale in three steps. First, we use multiple-group confirmatory factor analysis (MG-CFA) to investigate whether the six items actually measure an underlying theoretical construct (factorial validity), and whether the proposed four-item-scale fits the data better than the original six-item-scale. Second, we examine whether the scale measures the same underlying construct in all PIAAC countries by testing the degree of MI across countries. We treat the items as ordered categorical items and use a multiple-group graded response model (Samejima

Page 8 of 22Gorges et al. Large-scale Assess Educ (2016) 4:9
1969 see below), which is statistically more appropriate but has not been applied so far to these data. Finally, we scrutinize the scale’s criterion validity by investigating its rela-tions to participation in further education. We expect that MtL shows significant rela-tions to participation in both job-related and non-job-related further education above and beyond typical socio-demographic factors (e.g., education, employment and age).
MethodsData
Our analysis includes PIAAC data from the 21 countries that met the psychometric pre-requisites and provided representative samples (OECD 2013).2 It should be noted that completed cases in PIAAC are defined by an international consortium on standards and guidelines (OECD 2010b). Here also literacy-related non-respondents (LRNR) are assigned (for whom age and gender were collected by the interviewer) to completed cases and were handled as part of the PIAAC net sample. Literacy-related reasons for non-interviews or breakoffs to the background questionnaire are, e.g., language prob-lems, mental disabilities, etc. In the countries included in our analyses, these respond-ents comprise less than 5 % of the population.
Measures
All scales and socio-demographic information were part of the PIAAC background questionnaire. The administration of the background questionnaire was a computer-assisted personal interview (CAPI).
Our core construct Motivation-to-Learn–what we label MtL–is measured using items 2, 4, 5, and 6 listed in Table 1 whereas the RtL scale comprises all six items. Responses were recorded on a 5-point scale (see Table 1).
Level of education (based on the variable EDCAT6) is classified according to the International Classification of Educational Attainment (UNESCO 1997). Following conventions from large-scale multi-national studies we distinguish three levels (high, intermediate, and low) to describe our sample (OECD 2013c; Heisig and Solga 2015).
Participation in further education was measured as participation in non-formal, non-compulsory education during the 12 months prior to data collection indicated by the derived NFE12 variables. Non-formal education is defined as “any organized and sus-tained educational activities” (OECD 2011, p. 39) which are not “provided in the system of schools, colleges, universities and other formal educational institutions that normally constitutes a continuous ‘ladder’ of full-time education” (OECD 2011, p. 34). Hence, providers of non-formal education include adult education centers (e.g., courses on health-related issues, foreign languages, culture, or use of information technology), for-eign language schools, human resource development programs and more. Non-formal education may be job-related (NFE12JR) or non-job-related (NFE12NJR).
Literacy is used as a continuous indicator of level of education in our analyses of cri-terion validity due to the close relation of these two constructs (OECD 2013a). Literacy is defined as the capability to understand, interpret, and use information in written form as productive and goal attaining knowledge (Jones et al. 2009; OECD 2013a). Literacy
2 Cyprus, the Russian Federation, and Belgium (Flanders) are excluded. For further details on the data collection proce-dure, see the PIAAC Technical report (OECD 2013b).

Page 9 of 22Gorges et al. Large-scale Assess Educ (2016) 4:9
in PIAAC was measured with tasks like reading and understanding medical instruction leaflets, a short newspaper article, or a job description in an online portal, for example.
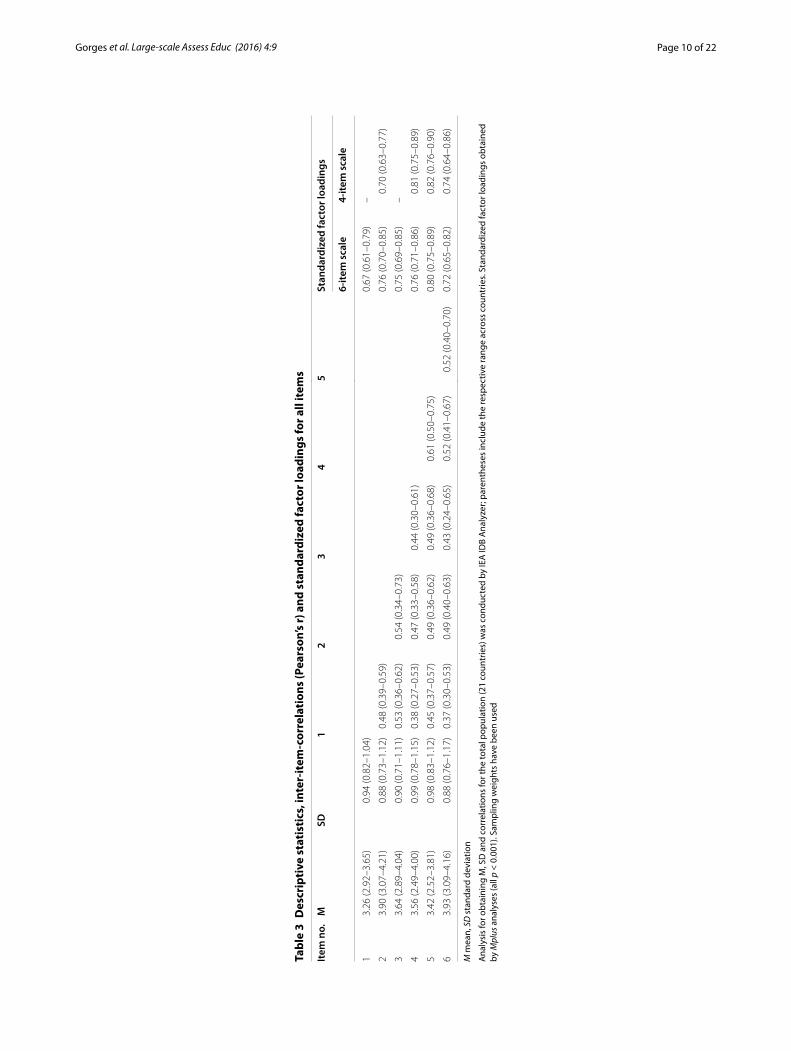
Table 2 gives an overview of the number of cases per country, distributions of relevant background variables, and participation in further education.3 The proportion of female participants is evenly distributed across countries. In all countries except Italy over 50 % of the population has a medium or high educational attainment. The age distribution shows that the majority of respondents are working aged (around 40 %). Descriptive sta-tistics and zero-order correlations between all items are shown in Table 3.
Statistical analyses
In the present study, we conducted multiple-group confirmatory factor analysis (MG-CFA) for ordered categorical observed variables. Fitting different MG-CFA models scru-tinizes the hypothesized one-factor structure in all 21 countries simultaneously, tests
3 Age is indicated based on five-year intervals (from the variable AGEG5LFS) and treated as a quasi-continuous measure because it was not available as a continuous variable in all PIAAC countries.
Table 2 Descriptive statistics by countries using sampling weights
NFE non-formal education, NFE–JR job-related non-formal education, NFE–NJR non-job-related non-formal education
Country N Female (%)
Level of education (%)
Age group (%) Participation rates in NFE (%)
High Medium Low 16–29 30–49 50–65 NFE NFE–JR NFE–NJR
Australia 7430 50 33 39 28 30 42 29 55.97 50.61 5.36
Austria 5130 50 17 60 23 26 44 31 55.82 47.87 7.96
Canada 26683 50 46 39 15 27 41 33 60.96 50.60 8.01
Czech Republic
6102 50 18 67 16 25 43 32 53.42 47.33 6.10
Denmark 7328 50 34 40 26 26 42 32 67.94 61.87 6.02
England/N. Ireland (UK)
8892 50 36 40 24 29 42 29 56.70 52.04 4.65
Estonia 7632 52 37 45 18 28 41 30 57.14 47.84 9.29
Finland 5464 50 36 44 20 26 39 35 72.38 63.15 9.23
France 6993 51 27 45 28 27 42 32 40.26 37.54 2.72
Germany 5465 50 30 53 17 25 44 31 58.76 52.79 5.97
Ireland 5983 51 32 40 28 28 47 26 49.63 43.90 5.73
Italy 4621 50 12 34 54 23 47 30 26.36 24.09 2.27
Japan 5278 50 42 44 15 23 44 33 44.06 38.96 5.10
Korea 6667 50 35 43 22 26 46 28 53.34 42.25 11.09
Netherlands 5169 50 31 38 31 26 42 32 66.29 60.08 6.21
Norway 5128 49 35 38 27 27 43 30 67.97 61.84 5.96
Poland 9366 51 26 59 15 30 39 31 37.95 33.74 4.21
Slovak Republic
5723 50 19 60 21 29 42 29 36.21 33.75 2.45
Spain 6055 50 29 23 47 21 48 30 48.43 40.66 7.74
Sweden 4469 49 28 48 24 28 41 32 70.43 60.60 9.83
United States
5010 51 36 50 15 29 41 30 59.02 52.74 6.28
OECD total/average
150588 50 30 45 24 27 43 31 54.24 47.82 6.29
Page 10 of 22Gorges et al. Large-scale Assess Educ (2016) 4:9
Tabl
e 3
Des
crip
tive
sta
tist
ics,
inte
r-it
em-c
orre
lati
ons
(Pea
rson
’s r)
and
sta
ndar
dize
d fa
ctor
load
ings
for a
ll it
ems
M m
ean,
SD
sta
ndar
d de
viat
ion
Ana
lysi
s fo
r obt
aini
ng M
, SD
and
cor
rela
tions
for t
he to
tal p
opul
atio
n (2
1 co
untr
ies)
was
con
duct
ed b
y IE
A ID
B A
naly
zer;
pare
nthe
ses
incl
ude
the
resp
ectiv
e ra
nge
acro
ss c
ount
ries.
Stan
dard
ized
fact
or lo
adin
gs o
btai
ned
by M
plus
ana
lyse
s (a
ll p
< 0.
001)
. Sam
plin
g w
eigh
ts h
ave
been
use
d
Item
no.
MSD
12
34
5St
anda
rdiz
ed fa
ctor
load
ings
6‑ite
m s
cale
4‑ite
m s
cale
13.
26 (2
.92–
3.65
)0.
94 (0
.82–
1.04
)0.
67 (0
.61–
0.79
)–
23.
90 (3
.07–
4.21
)0.
88 (0
.73–
1.12
)0.
48 (0
.39–
0.59
)0.
76 (0
.70–
0.85
)0.
70 (0
.63–
0.77
)
33.
64 (2
.89–
4.04
)0.
90 (0
.71–
1.11
)0.
53 (0
.36–
0.62
)0.
54 (0
.34–
0.73
)0.
75 (0
.69–
0.85
)–
43.
56 (2
.49–
4.00
)0.
99 (0
.78–
1.15
)0.
38 (0
.27–
0.53
)0.
47 (0
.33–
0.58
)0.
44 (0
.30–
0.61
)0.
76 (0
.71–
0.86
)0.
81 (0
.75–
0.89
)
53.
42 (2
.52–
3.81
)0.
98 (0
.83–
1.12
)0.
45 (0
.37–
0.57
)0.
49 (0
.36–
0.62
)0.
49 (0
.36–
0.68
)0.
61 (0
.50–
0.75
)0.
80 (0
.75–
0.89
)0.
82 (0
.76–
0.90
)
63.
93 (3
.09–
4.16
)0.
88 (0
.76–
1.17
)0.
37 (0
.30–
0.53
)0.
49 (0
.40–
0.63
)0.
43 (0
.24–
0.65
)0.
52 (0
.41–
0.67
)0.
52 (0
.40–
0.70
)0.
72 (0
.65–
0.82
)0.
74 (0
.64–
0.86
)

Page 11 of 22Gorges et al. Large-scale Assess Educ (2016) 4:9
the degree of measurement invariance using classical model fit criteria, and adequately models the measurement level of the scale. More specifically, we used a multiple-group graded response model for the analyses (Koch and Eid 2015; Samejima 1969), which can be expressed as follows:
where i = (1, . . . , i, . . . I) are indicators (e.g., items or item parcels), and g =
(
1, . . . , g , . . . ,G)
represent groups (e.g., countries). In the above model (see Eq. 1), it is assumed that there is a continuous normally distributed latent response (Yig
*) for each observed variable Yig. The continuous normally distributed latent response variable (Yig
*) can be decomposed in a similar way as in confirmatory factor models for continuous variables, assuming an (additive) intercept parameter αig, a weighted latent factor λigηg and a measurement error εig variable (Koch and Eid 2015). The observed variables Yig are linked to latent response Yig
* assuming a threshold relationship (Eid 1996; Millsap and Yun-Tein 2004; Muthén 1984):
The parameters κisg are threshold parameters that divide the continuous latent variable Yik
* into S categories.In order to identify and estimate the model (Eq. 1) certain restrictions have to be
made. First, all intercepts αig have to be fixed to zero, as there are no intercept parame-ters in case of categorical observed variables. Second, for each factor one loading param-eter has to be fixed to a value greater than zero (usually to one). Third, the variances Var
(
εig)
of the error variables have to be fixed to a value larger than zero (usually to one) in one group. In many SEM packages (e.g., Mplus, Muthén and Muthén 1998) the latent mean of ηg is fixed to zero by default, whereas the variance of ηg is freely estimated in all groups. Mplus allows two ways to formulate and estimate such a model: the Delta and the Theta parameterization. The Delta parameterization does not allow residual variables ɛig to be part of the model and uses scaling factors instead (see Muthén and Asparouhov 2002). The Theta parameterization used here allows residual variables to be freely esti-mated in all groups, but the reference group. However, in order to obtain a model that is equivalent to an item response model (i.e., probit model or graded response model), the residual variances need to be fixed to unity (see Eid 1996; Samejima 1969; Takane and de Leeuw 1987). In order to test strong or scalar MI in this model, it is necessary to impose all of the following restrictions (see Eid and Kutscher 2014):
1. The threshold parameters κisg are equal in all groups (i.e. κisg = κisg’ = κis).2. The factor loadings λig are equal in all groups (i.e. λig = λig’ = λi).3. The variances Var(ɛig) are equal in all groups e.g.,
[
Var(
εig)
= Var(
εig ′)
= Var(εi) = 1]
.
(1)Y ∗
ig = αig + �igηg + εig ,
Yig = 0, if Y ∗
ig ≤ κisg ,
Yig = s, if κisg < Y ∗
ig ≤ κi(s+1)g , for 0 < s < S, and
Yig = S, if κiSg < Y ∗
ig .

Page 12 of 22Gorges et al. Large-scale Assess Educ (2016) 4:9
4. In one group, the expected value (mean) of the latent factor has to be fixed to 0 [E (η1) = 0], whereas it is freely estimated in the remaining groups.
Weak or metric MI requires only restrictions 2 & 3, while configural MI just requires restriction 3. Each type of MI is considered full if the restrictions apply to all items, and partial if the restrictions apply to most but not all items (Byrne et al. 1989; Steenkamp and Baumgartner 1998). Partial MI requires that the model parameters of interest (i.e. the factor loadings and/or the thresholds) of at least two items remain invariant across all groups; the invariant items then define the meaning of these latent variables (Byrne et al. 1989; Steenkamp and Baumgartner 1998). In our study we tested for partial MI in cases where full MI could not be established. Comparing the fit of these models tests the different levels of MI.
Commonly, the test of exact model fit (i.e. Chi square or Chi square difference test), the root-mean-square-error-of-approximation (RMSEA, Steiger 1990) and compara-tive fit index (CFI, Bentler 1990) are used for model testing. A model is said to fit the data well, if (1) the p value of the Chi square test (or the Chi square difference test) is equal or larger than 0.05, (2) the RMSEA is below 0.06 (or fit acceptably if below 0.08, see Chen et al. 2008; Hu and Bentler 1999) and the CFI is greater than 0.97 (or fit accept-ably if greater than 0.95, see Schermelleh-Engel et al. 2003). Note that the Chi square test has been subject to criticism for being too sensitive in large samples, which is often the case in cross-cultural studies with hundreds or thousands of observations in each coun-try (Schermelleh-Engel et al. 2003; Nagengast and Marsh 2014). In such situations, the Chi square test (as well as the Chi square difference test) will often reject the model of interest as a result of its large power to detect even small (marginal or practically insig-nificant) parameter deviations. Cheung and Rensvold (2002) and Chen (2007) therefore provided guidelines to compare the fit of competing models. They argue that a decrease of model fit is said to be practically insignificant when the RMSEA drops by less than 0.015 and when the CFI drops by less than 0.01.
To estimate the fit of the model we used weighted least square mean-and-variance adjusted (WLSMV) estimation implemented in Mplus (Muthén and Muthén 1998). We included sampling weights as recommended for this type of analysis. Note that Mplus uses pairwise present data when using WLSMV estimation and does not permit a full information approach. Given the fact that the percentage of missing data was very low (less than 0.05 % regarding the items from the RtL scale), we considered this procedure as tolerable.
If full measurement invariance (e.g. equivalence of all factor loadings across all groups) should not hold, partial measurement invariance will be tested (Byrne et al. 1989; Steenkamp and Baumgartner 1998). Additionally, we inspected modification indices to identify potential misfit within each country. A modification value corresponds to the expected change in Chi square value (model fit) if certain parameter restrictions (e.g., uncorrelated measurement errors) are relaxed.
To evaluate the criterion validity of MtL, we investigated its relation to participation in further education. In doing so, we used the IEA-IDB analyzer4 (IEA 2012) to see how
4 International Data Base (IDB) Analyzer is a program that, e.g., creates SPSS syntax that can be used to combine and analyze data from the “International Association for the Evaluation of Educational Achievement” (IEA) studies such as PIAAC.

Page 13 of 22Gorges et al. Large-scale Assess Educ (2016) 4:9
MtL relates to participation in education both with and without controlling for literacy as an indicator of level of education. We first specified factor scores obtained from Mplus indicating MtL as a single predictor of participation in further education. Then we specified literacy as a second predictor of participation in further education. Because employment, age, and language are further key socio-demographic factors predicting participation in further education we reduced our sample to the employed working pop-ulation aged 30–49 where test language is the same as native language. We considered three types of participation in non-formal further education to further check the robust-ness of our MtL scale. Because, strictly speaking, we tested for effects of MtL on partici-pation in education we report beta coefficients. However, as PIAAC is a cross-sectional dataset, we refer to these analyses as testing criterion validity (rather than predictive validity). In all analyses conducted with the IEA-IDB analyzer the replicate weights were taken into account and standard errors were computed using the jackknife repeated rep-lication method (IEA 2012).
ResultsEstablishing an MtL scale and testing configural invariance
First, we tested if the original six RtL items form one common factor in all countries by fitting a common factor model imposing only configural MI; i.e., we did not allow for any residual correlations among the six items by country. This model did not pro-duce an acceptable overall fit to the data, χ2(189) = 21,089.265, p < 0.001, CFI = 0.967, RMSEA = 0.125 [0.123; 0.126]. Note that evaluating the CFI and RMSEA different con-clusions could be drawn. According to the CFI, the common factor model fitted the data acceptably (CFI > 0.95), whereas the RMSEA indicated that the model did not fit the data (RMSEA > 0.10). The CFI compares the fit of the specified model to the fit of a baseline model in which all items are assumed to be uncorrelated with each other. As a consequence, the CFI will be high if the observed items are substantially correlated with each other. In contrast, the RMSEA is a measure of approximate fit and has been regarded “as relatively independent of sample size, and additionally favors parsimonious models” (Schermelleh-Engel et al. 2003, p. 37). Because not all model fit criteria were met we concluded that the common factor model using the original six items does not fit the data.
To investigate sources of local misfit in the common factor model, we evaluated modification indices above 100 to identify only major sources of misfit. The modifica-tion indices pointed towards substantial residual correlations between items 1 and 3, suggesting that these items form a second factor apart from the postulated common MtL factor. Particularly high modification indices and therefore high residual cor-relations (often greater than 0.30) were observed for Australia, Canada, Denmark, Estonia, Finland, South Korea, Netherlands, Sweden, UK, and USA. Allowing resid-ual correlations between items 1 and 3 in all countries improved the fit of the model, χ2(168) = 14,244.282, p < 0.001, CFI = 0.978, RMSEA = 0.109 [0.107; 0.110], but the RMSEA still suggests lack of fit.
It is worth noting that by allowing residual correlations in one or more countries, researchers cannot decide whether or not the particular scale is one-dimensional or two-dimensional. This is because a common factor model with correlated residual variables

Page 14 of 22Gorges et al. Large-scale Assess Educ (2016) 4:9
is data equivalent to a factor model with two correlated factors or a factor model with an additional method factor. Since the goal was to test the unidimensionality of the six-item scale (i.e., configural invariance), we fixed the residual correlations to zero in all coun-tries for the subsequent analyses.
We evaluated the fit of the one-factor model using the four-item scale next (excluding items 1 and 3) also imposing configural MI. Compared to the six-item scale, the one-factor four-item model fits the data considerably better, χ2(42) = 2256,255, p < 0.001, CFI = 0.994, RMSEA = 0.086 [0.083, 0.089]. The Chi square value of the four-item scale was almost six times less than the Chi square value of the six-item scale. Additionally, the RMSEA dropped by 0.023 and the CFI increased by 0.016. These results show a sub-stantial improvement in model fit, resulting from excluding items 1 and 3 from the origi-nal scale. Table 3 summarizes standardized factor loadings for both scales.
We continued testing beyond mere configural MI despite the fact that the RMSEA slightly exceeded the cut-off value of 0.08. This seemed justifiable given that the RMSEA was between 0.08 and 0.10 indicating mediocre fit (Schermelleh-Engel et al. 2003).
Testing measurement invariance across countries
Table 4 presents the fit of the models that were used for testing different levels of MI for the four-item factor (see Additional file 1: Table S1) for analogous analyses for the six-item scale). Due to the large sample size, the Chi square tests were significant when testing and comparing all of the subsequent models. Thus, we followed the guidelines by Cheung and Rensvold (2002) and Chen (2007) and compared the models according to the changes in RMSEA and CFI. First, we fixed all factor loadings to be equal across countries. Comparing the fit of Model 1 and Model 2 (configural MI vs. full weak MI), the RMSEA dropped by 0.022 indicating a practically significant improvement of fit when full weak invariance was imposed. As other aspects of model fit did not deterio-rate, full weak MI could be established.
Next, we tested full strong or scalar MI by fixing all threshold parameters to be equal across all countries (Model 3a). This model containing full strong MI still fits the data acceptably (i.e. RMSEA = 0.078, CFI = 0.955). However, based on the guidelines by Cheung and Rensvold (2002) and Chen (2007) the change in the RMSEA and CFI indi-cate a practically significant decrease in fit compared to Model 2 because the RMSEA increased by 0.014 and the CFI dropped by 0.034 units. Thus, we decided to test for par-tial strong MI. Again, we first evaluated parameter restrictions showing modification
Table 4 Fit indices for multiple-group CFAs of the four-item scale for different levels of measurement invariance
Model 1 configural invariance without constraints, Model 2 full weak model with factor loading invariance, Model 3a full weak/full strong; Model 3b full weak/partial strong without constraints for all four items on two thresholds (2 and 3); χ2 χ2 test statistics, df degrees of freedom, npar number of free parameters, CFI comparative fit index, RMSEA root mean square error of approximation. Significant χ2 and ∆χ2 (p < 0.05) are printed in italics
Model χ2 df χ2/df npar RMSEA (CI) CFI ∆χ2 ∆df ∆χ2/df
Model 1 2256.255 42 53.72 420 0.086 (0.083 0.089) 0.994 – – –
Model 2 3045.744 102 29.86 360 0.064 (0.062 0.066) 0.992 1301.509 60 21.69
Model 3a 17977.828 402 44.72 60 0.078 (0.077 0.079) 0.955 14893.465 300 49.64
Model 3b 7702.566 242 31.82 220 0.066 (0.065 0.067) 0.981 4778.658 140 34.13

Page 15 of 22Gorges et al. Large-scale Assess Educ (2016) 4:9
Tabl
e 5
MtL
pre
dict
ing
part
icip
atio
n in
furt
her e
duca
tion
: res
ults
from
regr
essi
on a
naly
ses
wit
hout
and
wit
h co
ntro
lling
for l
iter
acy
Ana
lyse
s co
nduc
ted
by IE
A ID
B an
alyz
er; M
tL m
otiv
atio
n to
lear
n; N
FE12
par
ticip
atio
n in
non
-form
al e
duca
tion
in th
e 12
mon
ths
prec
edin
g su
rvey
(der
ived
); N
FE12
JR p
artic
ipat
ion
in n
on-fo
rmal
edu
catio
n fo
r job
-rel
ated
re
ason
s in
the
12 m
onth
s pr
eced
ing
surv
ey (d
eriv
ed);
NFE
12N
JR p
artic
ipat
ed in
non
-form
al e
duca
tion
for n
on-jo
b-re
late
d re
ason
s in
12
mon
ths
prec
edin
g su
rvey
(der
ived
); va
lues
of N
FE12
, NFE
12JR
and
NFE
12N
JR
com
bine
d: 0
did
not
par
ticip
ate;
1 p
artic
ipat
ed; L l
itera
cy in
clud
ed a
s se
cond
pre
dict
or; S
E st
anda
rd e
rror
; sam
ple
rest
ricte
d to
wor
king
pop
ulat
ion
(i.e.
, em
ploy
ed fo
r mor
e th
an 1
0 h
per w
eek
in th
e 12
mon
ths
prec
edin
g th
e su
rvey
and
age
d be
twee
n 30
and
49)
whe
re te
st la
ngua
ge is
the
sam
e as
nat
ive
lang
uage
; the
OEC
D p
atch
was
use
d fo
r the
adj
ustm
ent o
f the
NFE
var
iabl
es; s
igni
fican
t coe
ffici
ents
are
prin
ted
in it
alic
s (p
< 0.
05);
for
furt
her d
escr
iptio
n se
e te
xtMtL
<=
NFE
12M
tL <=
NFE
12L
MtL
<=
NFE
12JR
MtL
<=
NFE
12JR
LM
tL <=
NFE
12N
JRM
tL <=
NFE
12N
JRL
ββS
ER2
ββS
ER2
ββS
ER2
ββS
ER2
ββS
ER2
ββS
ER2
Aus
tral
ia0.
100.
030.
010.
051.
960.
080.
080.
030.
010.
041.
640.
050.
030.
020.
000.
021.
020.
01
Aus
tria
0.13
0.03
0.02
0.09
3.57
0.05
0.13
0.02
0.02
0.10
4.40
0.04
−0.
010.
020.
00−
0.03
−1.
200.
01
Cana
da0.
090.
020.
010.
052.
390.
060.
060.
020.
000.
031.
430.
050.
080.
020.
010.
073.
220.
01
Cze
ch R
epub
lic0.
110.
030.
010.
092.
710.
020.
100.
030.
010.
082.
370.
010.
020.
030.
000.
010.
540.
01
Den
mar
k0.
070.
030.
010.
051.
790.
030.
080.
030.
010.
062.
020.
03−
0.02
0.02
0.00
−0.
02−
0.86
0.00
Uni
ted
King
dom
0.11
0.03
0.01
0.08
2.94
0.06
0.07
0.02
0.01
0.04
1.66
0.04
0.09
0.02
0.01
0.08
3.07
0.01
Esto
nia
0.19
0.02
0.04
0.15
6.90
0.07
0.16
0.02
0.02
0.13
6.06
0.03
0.05
0.02
0.00
0.02
1.09
0.02
Finl
and
0.10
0.02
0.01
0.08
3.19
0.03
0.06
0.02
0.00
0.05
1.96
020.
050.
030.
000.
041.
480.
00
Fran
ce0.
140.
020.
020.
095.
190.
060.
120.
020.
020.
094.
530.
050.
040.
020.
000.
021.
010.
01
Ger
man
y0.
150.
030.
020.
124.
070.
070.
140.
030.
020.
124.
260.
060.
010.
030.
000.
00-0
.01
0.00
Irela
nd0.
090.
030.
010.
061.
930.
050.
060.
030.
000.
031.
170.
040.
050.
020.
000.
052.
360.
00
Italy
0.09
0.03
0.01
0.07
2.34
0.06
0.07
0.03
0.01
0.05
1.60
0.05
0.07
0.03
0.01
0.07
2.06
0.01
Japa
n0.
210.
020.
040.
187.
920.
060.
200.
020.
040.
187.
970.
050.
020.
020.
000.
000.
020.
01
Kore
a0.
210.
020.
040.
156.
820.
100.
170.
020.
030.
125.
210.
070.
070.
020.
000.
052.
570.
01
Net
herla
nds
0.18
0.02
0.03
0.15
5.90
0.05
0.16
0.02
0.03
0.14
5.78
0.04
0.02
0.03
0.00
0.01
0.52
0.00
Nor
way
0.08
0.03
0.01
0.07
2.45
0.02
0.05
0.02
0.00
0.05
1.86
0.01
0.04
0.03
0.00
0.04
1.20
0.00
Pola
nd0.
250.
020.
060.
208.
480.
110.
240.
020.
060.
208.
920.
100.
030.
020.
000.
010.
580.
01
Slov
ak R
epub
lic0.
150.
030.
020.
124.
400.
060.
150.
030.
020.
124.
490.
050.
010.
020.
000.
000.
000.
00
Spai
n0.
080.
020.
010.
062.
610.
050.
050.
020.
000.
041.
560.
020.
060.
020.
000.
052.
180.
02
Swed
en0.
160.
030.
020.
134.
290.
040.
150.
030.
020.
134.
340.
03−
0.01
0.03
0.00
−0.
02−
0.66
0.00
Uni
ted
Stat
es0.
130.
030.
020.
124.
420.
070.
120.
030.
010.
113.
680.
050.
020.
0300
0.01
0.49
0.00
Page 16 of 22Gorges et al. Large-scale Assess Educ (2016) 4:9
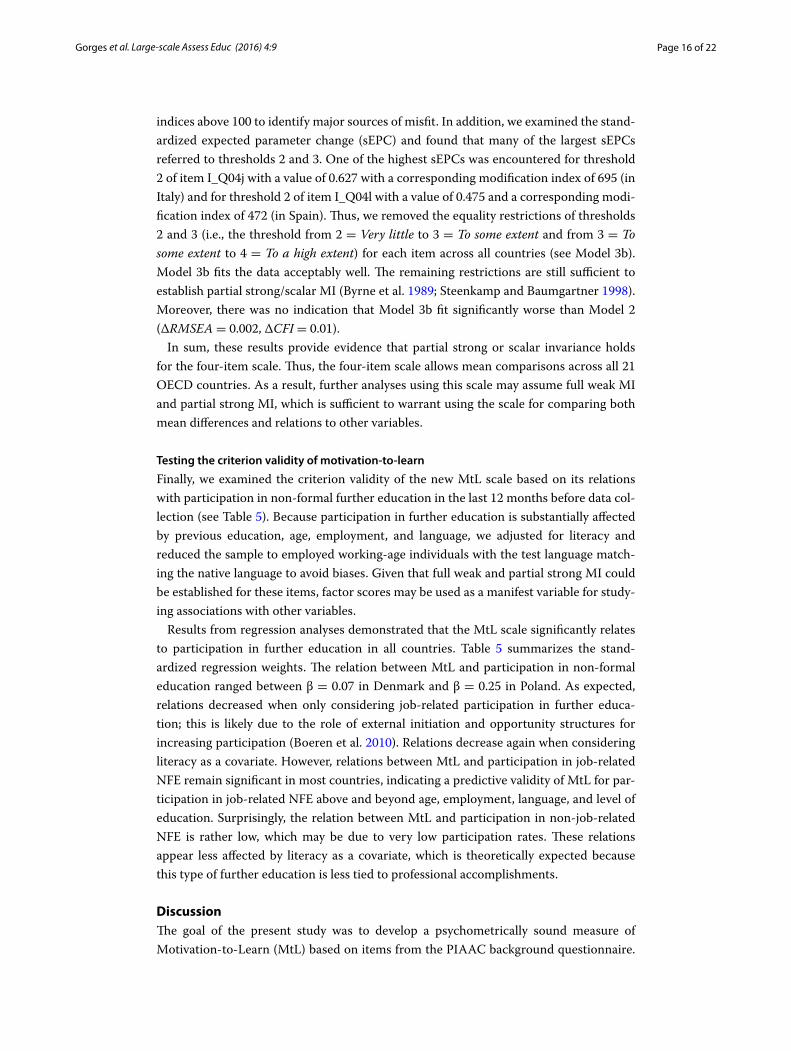
indices above 100 to identify major sources of misfit. In addition, we examined the stand-ardized expected parameter change (sEPC) and found that many of the largest sEPCs referred to thresholds 2 and 3. One of the highest sEPCs was encountered for threshold 2 of item I_Q04j with a value of 0.627 with a corresponding modification index of 695 (in Italy) and for threshold 2 of item I_Q04l with a value of 0.475 and a corresponding modi-fication index of 472 (in Spain). Thus, we removed the equality restrictions of thresholds 2 and 3 (i.e., the threshold from 2 = Very little to 3 = To some extent and from 3 = To some extent to 4 = To a high extent) for each item across all countries (see Model 3b). Model 3b fits the data acceptably well. The remaining restrictions are still sufficient to establish partial strong/scalar MI (Byrne et al. 1989; Steenkamp and Baumgartner 1998). Moreover, there was no indication that Model 3b fit significantly worse than Model 2 (∆RMSEA = 0.002, ∆CFI = 0.01).
In sum, these results provide evidence that partial strong or scalar invariance holds for the four-item scale. Thus, the four-item scale allows mean comparisons across all 21 OECD countries. As a result, further analyses using this scale may assume full weak MI and partial strong MI, which is sufficient to warrant using the scale for comparing both mean differences and relations to other variables.
Testing the criterion validity of motivation‑to‑learn
Finally, we examined the criterion validity of the new MtL scale based on its relations with participation in non-formal further education in the last 12 months before data col-lection (see Table 5). Because participation in further education is substantially affected by previous education, age, employment, and language, we adjusted for literacy and reduced the sample to employed working-age individuals with the test language match-ing the native language to avoid biases. Given that full weak and partial strong MI could be established for these items, factor scores may be used as a manifest variable for study-ing associations with other variables.
Results from regression analyses demonstrated that the MtL scale significantly relates to participation in further education in all countries. Table 5 summarizes the stand-ardized regression weights. The relation between MtL and participation in non-formal education ranged between β = 0.07 in Denmark and β = 0.25 in Poland. As expected, relations decreased when only considering job-related participation in further educa-tion; this is likely due to the role of external initiation and opportunity structures for increasing participation (Boeren et al. 2010). Relations decrease again when considering literacy as a covariate. However, relations between MtL and participation in job-related NFE remain significant in most countries, indicating a predictive validity of MtL for par-ticipation in job-related NFE above and beyond age, employment, language, and level of education. Surprisingly, the relation between MtL and participation in non-job-related NFE is rather low, which may be due to very low participation rates. These relations appear less affected by literacy as a covariate, which is theoretically expected because this type of further education is less tied to professional accomplishments.
DiscussionThe goal of the present study was to develop a psychometrically sound measure of Motivation-to-Learn (MtL) based on items from the PIAAC background questionnaire.

Page 17 of 22Gorges et al. Large-scale Assess Educ (2016) 4:9
Building on the existing six-item Readiness-to-Learn (RtL) scale, our results show that the proposed four-item MtL scale fits the data reasonably well, whereas the full RtL scale, which includes items on the use of learning strategies, is not appropriate. Further-more, we found evidence for configural, full metric and partial scalar invariance across 21 countries for the four-item MtL scale. Finally, results from regression-based analyses using the IEA-IDB Analyzer show that the relations between MtL and participation in further education (controlling for literacy) support the scale’s criterion validity. In sum, results suggest that the four-item MtL scale is satisfactory for further use in future analy-ses of the PIAAC data, and for measuring motivation.
Readiness‑to‑learn versus motivation‑to‑learn across countries
The concept of RtL was supposed to merge both motivational aspects and use of learn-ing strategies into a specific approach to learning (Kirby et al. 2003). The conceptual framework of the PIAAC background questionnaire refers to a total of 13 items intended to measure deep versus surface approaches (OECD 2011). With this number of items it could have been possible to distinguish at least two forms of motivation—intrinsic and extrinsic—and/or two strategic approaches to learning—deep and surface—as proposed by Biggs (1985). Apparently, the questionnaire had to be shortened to include only six items (OECD 2010a). Unfortunately, there is no hint as to why these particular six items were chosen for the final version of the questionnaire.
Given only six items it is no longer possible to measure diverse and discrete moti-vational qualities and strategic approaches to learning. Instead, results from multiple-group confirmatory factor analyses support our theoretically driven compilation of the hypothesized scale to measure MtL. More specifically, excluding the two items that clearly refer to the use of learning strategies significantly increased the fit of the scale. Thus, these items apparently do not belong to the underlying MtL factor but measure a second factor reflecting use of deep-level learning strategies. Our results are in line with previous findings by Smith et al. (2015), who show that the respective items had sub-stantial error correlations when specifying a one-factor-model using all six items in the US sample. Thus, the MtL scale is a sound instrument to capture motivation in further analyses, while the use of the six-item RtL scale is not recommended.
Our analyses show reasonably strong MI allowing for comparisons of latent factor means and structural coefficients across 21 PIAAC countries. As we had measurement error fixed throughout the analyses, the MtL scale score may be used in latent and mani-fest analyses to compare both relations and means across countries.
Criterion validity for participation in further education
Results from the regression-based analyses of the relations between MtL, participation in further education and literacy are largely as expected; hence, bolstering our empirical arguments for the soundness of the four-item MtL scale. MtL shows substantial rela-tions to participation in further education that decrease when literacy—as indicator of level of education—is taken into account. The strength of association varies across coun-tries, which may be explained by differences in educational policy and opportunities offered by educational institutions (Desjardins and Rubenson 2013). More specifically, the influence of motivation as an antecedent of participation in further education may

Page 18 of 22Gorges et al. Large-scale Assess Educ (2016) 4:9
be small when participation in further education is commonplace and demanded inde-pendent of personal aspirations, so that most people participate. By contrast, motivation may be more important when adults have high chances to realize their educational plans because educational offers are readily available but participation is largely left to indi-vidual choice. Future research should focus on the role of motivation for participation in further education across different regimes of educational policy.
Surprisingly, relations between MtL and non-job-related participation in NFE are non-significant in many countries. One possible explanation for this finding could be that participation rates were very low in all countries. In addition, participation in non-job-related non-formal education could also be driven by factors other than the desire to expand one’s competence. For example, several findings emphasize that adults may engage in learning as a social activity (Courtney 1992). Future research should inves-tigate relations between MtL and participation in further education in more detail, for example, by distinguishing types of further education or considering level of education as a moderating variable. For example, findings from a recent study based on German data from the Adult Education Survey demonstrating that individual learning motiva-tion—comprising both enjoyment of learning and benefits gained from further educa-tion—is particularly important for further education participation for people with lower levels of education, especially for informal learning activities (Gorges and Hollmann 2015).
Limitations
Because Kirby et al.’s (2003) approaches to learning draw on motivational theories and theories about learning strategies, the present study focused on constructs from the edu-cational psychology literature as a theoretical underpinning of readiness-to-learn and motivation-to-learn, respectively. However, considering the items used in the readiness-to-learn scale, different theoretical constructs, for example, from personality psychology (openness, typical intellectual engagement; Goff and Ackerman 1992; need for cogni-tion; Cacioppo and Petty 1982) may be relevant for the conceptualization of readiness-to-learn as well. However, it may be assumed that such personality traits’ predictions of educational task choice (i.e., participation in further education) will be mediated by motivation, which is considered a direct antecedent of behavior derived from both per-sonal and contextual factors (Heckhausen and Heckhausen 2009). Consequently, MtL should also be assessed independent of any specific learning content, educational insti-tution, or other organizational framework.
The current analyses were somewhat limited by the contents of the PIAAC background questionnaire. For example, the data did not contain further psychological measures to examine the scale’s discriminant and convergent validity in more detail. Furthermore, due to its cross-sectional design, we had to focus on the scale’s criterion validity, whereas its longitudinally predictive validity would be an important aspect as well. Confirmatory factor analyses revealed some correlated errors indicating that the scale’s underlying theoretical construct is not absolutely clear-cut. Moreover, we had to free some param-eters, that is, we had differential item functioning for some countries. Nonetheless, given the large sample sizes that might pander to spurious significant findings, and the large

Page 19 of 22Gorges et al. Large-scale Assess Educ (2016) 4:9
number of countries representing diverse cultural contexts, we conclude that the scale performed quite well.
Outlook and suggestions for future research
Overall, the scale is comparable across countries. Nevertheless, because different sub-populations vary substantially in their competencies (e.g., for Germany, see Maehler et al. 2013), future research still needs to investigate the scale’s psychometric proper-ties and comparability across different subgroups within countries such as gender or age groups (see, for example, the approach taken by Smith et al. 2015).
As MtL significantly relates to participation in further education, it can be considered an important variable in future analyses of the PIAAC data. However, without deny-ing the important role of the present scale, both large- and small-scale future research on adults in educational settings would benefit from theoretically sound and clear-cut measures to assess both MtL and use of learning strategies. Only recently, Gorges (2015) outlined the potential of motivational research for studies on further education partic-ipation. As already mentioned, because psychological research on MtL is mostly con-strained to educational institutions, MtL is typically measured and analyzed with respect to learners’ current educational activities and the particular learning contents of those activities. However, while adults are generally potential participants in educational activ-ities, they are not necessarily engaged in learning at the time of survey. Moreover, adults may choose from a great variety of possible educational activities. Thus, measuring gen-eral adult MtL seems quite fruitful to understanding the processes of why they partici-pate in further education. At the same time, however, it is unclear which educational activity the respondents may refer to or might plan next on their educational agenda making the task challenging with the data at hand. Therefore, instruments to measure adult MtL, and eventually to predict lifelong learning, have to fulfill a range of prereq-uisites: They should capture MtL independent of any current learning activity, but they should not refer to some abstract future learning activity in which people might engage. In addition, such measures should not emphasize the instrumentality of learning as this is very specific to the individual learners’ situations. Rather, MtL should predict engage-ment in learning regardless of external incentives to learn, or—ideally—instruments to measure MtL should be able to differentiate between external and internal forms of motivation.
As PIAAC and other representative surveys such as the Adult Education Survey or the German National Educational Panel are designed to cover myriad further educa-tion forms, very specific measures of adult motivation to learn would not be sufficiently broad. Hence, because such measures would have to abstract from particular learning opportunities, they will probably lose predictive power compared to more specific scales (Steinmayr and Spinath 2009). Nevertheless, although the development of adult motiva-tion to learn scales appears to be quite challenging, such measures in concert with the present four-item scale would fully realize their potential in a longitudinal dataset with more detailed information on past and future learning activities, which unfortunately is a general shortcoming of educational psychology research on adult learning at the moment (Calfee 2006).

Page 20 of 22Gorges et al. Large-scale Assess Educ (2016) 4:9
Finally, we would like to encourage researchers to replicate our findings and/or use more sophisticated methods that have recently been proposed for testing the degree of measurement invariance in large-scale assessments (e.g., Asparouhov and Muthén 2014; Oberski et al. 2015; Van de Schoot et al. 2013).
Author details1 Faculty of Psychology and Sports Science, Department of Psychology, Bielefeld University, PO Box 10 01 31, 33501 Biele-feld, Germany. 2 Department of Survey Design and Methodology, GESIS Leibniz-Institute for the Social Sciences, PO Box 12 21 55, 68072 Mannheim, Germany. 3 Faculty of Education, Leuphana University of Lüneburg, Scharnhorst-str. 1, 21335 Lüneburg, Germany. 4 Institute of Sociology and Social Psychology, University of Cologne, Greinstr. 2, 50939 Cologne, Germany.
AcknowledgementsWork on this paper was supported by the College for Interdisciplinary Educational Research (CIDER), a Joint Initiative of the BMBF, the Jacobs Foundation and the Leibniz Association. The data used have been provided by the Leibniz-Institute for the Social Sciences (GESIS), the OECD (Public Use Files) and the Australian Bureau of Statistics (Australian Public Use File). This paper has been presented at the 8th Biennnal SELF Conference, 20–24 August 2015 in Kiel, Germany, and at the 1st International CIDER Conference, 24–26 January 2016, Berlin, Germany.
Competing interestsThe authors declare that they have no competing interests.
Received: 28 August 2015 Accepted: 27 April 2016
ReferencesAllen, J., van der Velden, R., Helmschrott, S., Martin, S., Massing, N., Rammstedt, B., Zabal, A., & von Davier, M. (2013). The
development of the PIAAC background questionnaires (Chapter 3). In OECD (Ed.), Technical report of the Survey of Adult Skills (PIAAC). Paris: OECD.
Ames, C., & Archer, J. (1988). Achievement goals in the classroom: students’ learning strategies and motivation processes. J Educ Psychol, 80(3), 260–267.
Asparouhov, T., & Muthén, B. (2014). Multiple-group factor analysis alignment. Struct Equ Modeling, 21(4), 495–508.Bentler, P. M. (1990). Comparative fit indexes in structural models. Psychol Bull, 107(2), 238–246.Biggs, J. B. (1985). The role of meta-learning in study processes. British J Educ Psychol, 55, 185–212.Boeren, E., Nicaise, I., & Baert, H. (2010). Theoretical models of participation in adult education: the need for an integrated
model. Int J Lifelong Educ, 29(1), 45–61.Byrne, B. M., Shavelson, R. J., & Muthén, B. (1989). Testing for the equivalence of factor covariance and mean structures:
the issue of partial measurement invariance. Psychol Bull, 105(3), 456.Cacioppo, J. T., & Petty, R. E. (1982). The need for cognition. J Pers Soc Psychol, 42(1), 116.Calfee, R. (2006). Educational psychology in the 21st Century. In P. A. Alexander & P. H. Winne (Eds.), Handbook of Educa-
tional Psychology (2nd ed., pp. 29–42). Mahwah: Erlbaum.Chen, F. F. (2007). Sensitivity of goodness of fit indexes to lack of measurement invariance. Struct Equ Modelling, 14(3),
464–504.Chen, F. F. (2008). What happens if we compare chopsticks with forks? The impact of making inappropriate comparisons
in cross-cultural research. J Pers Soc Psychol, 95(5), 1005.Chen, F. F., Curran, P. J., Bollen, K. A., Kirby, J., & Paxton, P. (2008). An empirical evaluation of the use of fixed cutoff points in
RMSEA test statistic in structural equation models. Soc Methods Res, 36(4), 462–494.Cheung, G. W., & Rensvold, R. B. (2002). Evaluating goodness-of-fit indexes for testing measurement invariance. Struct Equ
Modeling, 9, 233–255.Courtney, S. (1992). Why adults learn: Towards a theory of participation in adult education. London: Routledge.Desjardins, R., & Rubenson, K. (2013). Participation patterns in adult education: the role of institutions and public policy
frameworks in resolving coordination problems. Eur J Educ, 48(2), 262–280.Duncan, T. G., & McKeachie, W. J. (2005). The making of the motivated strategies for learning questionnaire. Educ Psychol,
40(2), 117–128.Durik, A. M., Vida, M., & Eccles, J. S. (2006). Task values and ability beliefs as predictors of high school literacy choices: a
developmental analysis. J Educ Psychol, 98, 382–393. doi:10.1037/0022-0663.98.2.382.Eid, M. (1996). Longitudinal confirmatory factor analysis for polytomous item re-spon-ses: model definition and model
selection on the basis of stochastic measure-ment theory. Methods Psychol Res, 1, 65–85.
Additional file
Additional file 1: Table S1. Fit indices for a multiple-group CFAs of the six-item scale for different levels of meas-urement invariance.

Page 21 of 22Gorges et al. Large-scale Assess Educ (2016) 4:9
Eid, M., & Kutscher, T. (2014). Statistical models for analyzing stability and change in happiness. In K. M. Sheldon & R. E. Lucas (Eds.), Stability of happiness Theories and evidence on whether happiness can change (pp. 263–297). Amsterdam: Elsevier.
Entwistle, N. J., & Ramsden, P. (1982). Understanding student learning. London: Helm.Goff, M., & Ackerman, P. L. (1992). Personality-intelligence relations: assessment of typical intellectual engagement. J Educ
Psychol, 84(4), 537.Gorges, J. (2015). Why (not) particpate in further education? An expectancy-value perspective on adult learners’ motiva-
tion. J Educ Res, 18(1), 9–28. doi:10.1007/s11618-014-0595-1. (Special Issue 30).Gorges, J., & Hollmann, J. (2015). Motivational factors for participation in further education with high, medium, or low
level of education. J Educ Res., 18(1), 51–69. doi:10.1007/s11618-014-0598-y. (Special Issue 30).Gorges, J., & Kandler, C. (2012). Adults’ learning motivation: expectancy of success, value, and the role of affective memo-
ries. Learn Individ Differ, 22, 610–617. doi:10.1016/j.lindif.2011.09.016.Gorges, J., Schwinger, M., & Kandler, C. (2013). Linking university students’ willingness to learn to their recollections of
motivation at secondary school. J Psychol, 9(4), 764–782. doi:10.5964/ejop.v9i4.638.Harackiewicz, J. M., Barron, K. E., Elliot, A. J., Carter, S. M., & Lehto, A. (1997). Predictors and consequences of achievement
goals in the college classroom: maintaining interest in making the grade. J Pers Soc Psychol, 73, 1284–1295.Heckhausen, J., & Heckhausen, H. (2009). Motivation and action: introduction and overview. In J. Heckhausen & H. Heck-
hausen (Eds.), Motivation and action (pp. 1–9). Cambridge: University Press.Heisig, J. P., & Solga, H. (2015). Secondary education systems and the general skills of less-and intermediate-educated
adults a comparison of 18 countries. Soc Educ, 88(3), 202–225.Hu, L., & Bentler, P. M. (1999). Cutoff criteria for fit indexes in covariance structure analysis: conventional criteria versus
new alternatives. Struct Equ Modeling, 6(1), 1–55.IEA [International Association for the Evaluation of Educational Achievement]. (2012). International database analyzer
version 3.2. Hamburg: IEA Data Processing and Research Center.Jones, S., Gabrielsen, E., Hagston, J., Linnakylä, P., Megherbi, H., & Sabatini, J., et al. (2009). PIAAC literacy a conceptual frame-
work (OECD education working paper Nr. 34). Paris: OECD.Kaplan, A., & Maehr, M. L. (2007). The contributions and prospects of goal orientation theory. Educ Psychol Rev, 19(2),
141–184.Kirby, J. R., Knapper, C. K., Evans, C. J., Carty, A. E., & Gadula, C. (2003). Approaches to learning at work and workplace
climate. Int J Train Develop, 7(1), 31–52.Koch, T., & Eid, M. (2015). Statistische Methoden der komparativen internationalen Migrationsforschung [Statistical
methods for international comparative migration research]. In D. B. Maehler & H. U. Brinkmann (Eds.), Methoden der Migrationsforschung [Methods of migration research] (pp. 225–259). Wiesbaden: Springer.
Maehler, D. B., Massing, N., Helmschrott, S., Rammstedt, B., Staudinger, U. M., & Wolf, C. (2013). Grundlegende Kompeten-zen in verschiedenen Bevölkerungsgruppen [Basic skills of specific population subgroups]. In B. Rammstedt et al. (Ed.), Grundlegende Kompetenzen Erwachsener im internationalen Vergleich—Ergebnisse von PIAAC 2012 [Basic skills of adults in international comparison: Results of PIAAC 2012] (pp. 77–124). Münster: Waxmann Verlag.
Maehr, M. L., & Zusho, A. (2009). Achievement goal theory. In K. R. Wentzel & A. Wigfield (Eds.), Handbook of motivation in school (pp. 77–104). New York: Routledge.
Marsh, H. W., & Hau, K. T. (2004). Explaining paradoxical relations between academic self-concepts and achievements: cross-cultural generalizability of the internal/external frame of reference predictions across 26 countries. J Educ Psychol, 96(1), 56–67.
Marton, F., & Saljö, R. (1976). On qualitative differences in learning: i. Outcome and process. Br J Educ Psychol, 46(1), 4–11.Millsap, R. E., & Yun-Tein, J. (2004). Assessing factorial invariance in ordered-categorical measures. Multivar Behav Res, 39(3),
479–515.Murphy, P. K., & Alexander, P. A. (2000). A motivated exploration of motivation terminology. Contemp Educ Psychol, 25(1), 3–53.Muthén, B. (1984). A general structural equation model with dichotomous, ordered categorical, and continuous latent
variable indicators. Psychometrika, 49, 115–132.Muthén, L., & Muthén, B. (1998). Mplus user’s guide version 7. Los Angeles: Muthén & Muthén.Nagengast, B., & Marsh, H. W. (2014). Motivation and engagement in science around the globe: Testing measurement invari-
ance with multigroup structural equation models across 57 countries using PISA, 2006. In L. Rutkowski, M. von Davier, & D. Rutkowski (Eds.), Analysis of international large-scale assessment data. New York: Taylor & Francis.
Nagengast, B., Marsh, H. W., Scalas, L. F., Xu, M., Hau, K.-T., & Trautwein, U. (2011). Who took the “x” out of expectancy-value theory? A psychological mystery, a substantive-methodological synergy, and a cross-national generalization. Psychol Sci, 22, 1058–1066.
Oberski, D. L., Vermunt, J. K., & Moors, G. B. (2015). Evaluating measurement invariance in categorical data latent variable models with the EPC-interest. Polit Anal, 23(4), 550–563.
OECD [Organization for Economic Co-Operation and Development]. (2005). Promoting Adult Learning. Paris: OECD Publishing.
OECD [Organization for Economic Co-Operation and Development]. (2010a). PIAAC Background questionnaire MS version 2.1 d.d. 15-12-2010. Paris: OECD. Retrieved from URL: http://www.oecd.org/edu/48442549.pdf.
OECD [Organization for Economic Co-Operation and Development]. (2010b). PIAAC technical standards and guidelines. Retrieved from http://www.oecd.org/site/piaac/PIAAC-NPM%282014_06%29PIAAC_Technical_Standards_and_Guidelines.pdf.
OECD [Organization for Economic Co-Operation and Development]. (2011). PIAAC Background Questionnaire Conceptual Framework V5.0. Paris: OECD. Retrieved from URL: http://www.oecd.org/edu/48865373.pdf
OECD [Organization for Economic Co-Operation and Development]. (2014). PISA 2012 results: What Students Know and Can Do–Student Performance in Mathematics, Reading and Science Volume I, Revised edition, February 2014. Paris: OECD Publishing.
OECD [Organization for Economic Co-Operation and Development]. (2013a). The Survey of adult skills: reader’s companion. Paris: OECD.

Page 22 of 22Gorges et al. Large-scale Assess Educ (2016) 4:9
OECD [Organization for Economic Co-Operation and Development]. (2013b). Technical Report of the Survey of Adult Skills (PIAAC). Paris: OECD.
OECD [Organization for Economic Co-Operation and Development]. (2013c). OECD Skills Outlook 2013: First Results from the Survey of Adult Skills. Paris: OECD.
Pintrich, P. R., & Schrauben, B. (1992). Students motivational beliefs and their cognitive engagement in classroom academic tasks. In D. Schunk & J. Meece (Eds.), Student perceptions in the classroom: causes and consequences (pp. 149–183). Hillsdale: Erlbaum.
Renninger, K. A., Hidi, S., & Krapp, A. (Eds.). (1992). The role of interest in learning and development. Hillsdale: Erlbaum.Rheinberg, F. (2010). Intrinsic motivation and flow-experience. In J. Heckhausen & H. Heckhausen (Eds.), Motivation and
action (pp. 323–348). Cambridge: University Press.Ryan, R. M., & Deci, E. L. (2000). Intrinsic and extrinsic motivations: classic definitions and new directions. Contem Educ
Psychol, 25(1), 54–67.Sass, D. (2011). Testing measurement invariance and comparing latent factor means within a confirmatory factor analysis
framework. Journal of Psychoeducational Assessment, 29(4), 347–363.Samejima, F. (1969). Estimation of ability using a response pattern of graded scores. Psychometrika Monogr Suppl, 17,
1–100.Schermelleh-Engel, K., Moosbrugger, H., & Müller, H. (2003). Evaluating the fit of structural equation models: test of signifi-
cance and descriptive goodness-of-fit measures. Methods Psychol Res, 8(2), 23–74.Schiefele, U. (2009). Situational and individual interest. In K. R. Wentzel & A. Wigfield (Eds.), Educational psychology handbook
series. Handbook of motivation at school (pp. 197–222). London: Routledge.Schunk, D. H., Meece, J. R., & Pintrich, P. R. (2014). Motivation in education: Theory, research and applications. London:
Pearson Education.Smith, M. C., Rose, A. D., Ross-Gordon, J., & Smith, T. J. (2014). Adults’ readiness to learn as a predictor of literacy skills.
Retrieved from URL: https://static1.squarespace.com/static/51bb74b8e4b0139570ddf020/t/54da7802e4b08c6b90107b4f/1423603714198/Smith_Rose_Ross-Gordon_Smith_PIAAC.pdf
Smith, T. J., Smith, M C., Rose, A. D., & Ross-Gordon, J. (2015). An assessment of the factor structure and factorial invariance of scores from the Readiness to Learn scale. Paper presented at the Annual Meeting of the American Educational Research Association, Chicago, IL.
Steenkamp, J.-B., & Baumgartner, H. (1998). Assessing measurement invariance in cross-national research. J Consum Res, 25(1), 78–90.
Steiger, J. H. (1990). Structural model evaluation and modification: an interval estimation approach. Multivar Behav Res, 25, 173–180.
Steinmayr, R., & Spinath, B. (2009). The importance of motivation as a predictor of school achievement. Learn Indiv Differ, 19, 80–90. doi:10.1016/j.lindif.2008.05.004.
Takane, Y., & de Leeuw, J. (1987). On the relationship between item response theory and factor analysis of discretized variables. Psychometrika, 52, 393–408.
Trautwein, U., Marsh, H. W., Nagengast, B., Lüdtke, O., Nagy, G., & Jonkmann, K. (2012). Probing for the multiplicative term in modern expectancy–value theory: a latent interaction modeling study. J Educ Psychol, 104(3), 763. doi:10.1037/a0027470.
UNESCO [United Nations Educational, Scientific and Cultural Organization]. (1997). International Standard Classification of Education (ISCED). Retrieved from URL: http://www.uis.unesco.org/Library/Documents/isced97-en.pdf.
Vallerand, R. J., Pelletier, L. G., Blais, M. R., Briere, N. M., Senecal, C., & Vallieres, E. F. (1992). The academic motivation scale: a measure of intrinsic, extrinsic, and a motivation in education. Educ Psychol Meas, 52(4), 1003–1017.
Van de Schoot, R., Kluytmans, A., Tummers, L., Lugtig, P., Hox, J., & Muthén, B. (2013). Facing off with Scylla and Charybdis: a comparison of scalar, partial, and the novel possibility of approximate measurement invariance. Front Psychol, 4, 770. doi:10.3389/fpsyg.2013.00770.
Widaman, K. F., & Reise, S. P. (1997). Exploring the measurement invariance of psychological instruments: Applications in the substance use domains. In K. J. Bryant, M. Windle, & S. G. West (Eds.), The science of prevention: methodological advances from alcohol and substance abuse research (pp. 281–324). Washington: Am Psychol Assoc.
Yamamoto, K., Khorramdel, L., & Davier, M. (2013). Scaling PIAAC cognitive data. In OECD (Ed.), Technical report of the survey of adult skills PIAAC (pp. 1–33). Paris: OECD.