who we are - lcsedu.net • after-school ... (teach kids at their instructional level and . behavior...
TRANSCRIPT


Who we are . . .

0
50
100
150
200
250
300
350
Econonmically Disadvantaged Students with Disabilities
Economically Disadvantaged and Students with Disabilities by Race 2011-2012
Other
White
Black
Black 42%
51%
0%
7%
Student Population by Race 2011-2012
Black
White
Other
Economically Disadvantag
ed 49%
Not Economically Disadvantag
ed 51%
Econonmically Disadvantaged and Not Economically Disadvantaged
Students with
Disabilities 10%
Students Without
Disabilities 90%
Students with Disabilities and Students Without
Disabilities

48
40 39
0
10
20
30
40
50
60
6th Grade 7th Grade 8th Grade
2011 - 2012 Referrals that Resulted in at Least 1 Day Suspension

Suspensions 20%
Economically Disadvangtaged
Students with Disabilties
Other 4
White 7 1
Black 87 8
0
20
40
60
80
100
120 Students with Suspensions 2011-2012
Black 83%
White 11%
Other 6%
Suspensions by Race
Students with at least 1 Short Term Suspension 2011-2012
No Suspensions 80%

Students with 7 or more
Unexcused Absences
15%
Students with fewer that 7 Unexcused Absences
85%
Black 60%
White 30%
Other 10%
0
10
20
30
40
50
60
70
80
Economically Disadvantaged including Students with
Disabilities
Students Neither Economically Disadvantaged or with Disabilities
Students with 7 or more Unexcused Absences 629 LMS Students 2011-2012
by Race

Proficiency Gap Dashboard (FAMO)
AMO Target
AMO Result
Met AMO Target
All Students 85 84 3YR
Gap Group 1 76 71 NO
Gap Group 2 76 70 NO
Gap Group 3 80 79 TS
Total Reading Grades 6-8 2011-2012
84
70
96
79
72
47
0
20
40
60
80
100
120 Achievement Gap of 26% between black and white
students
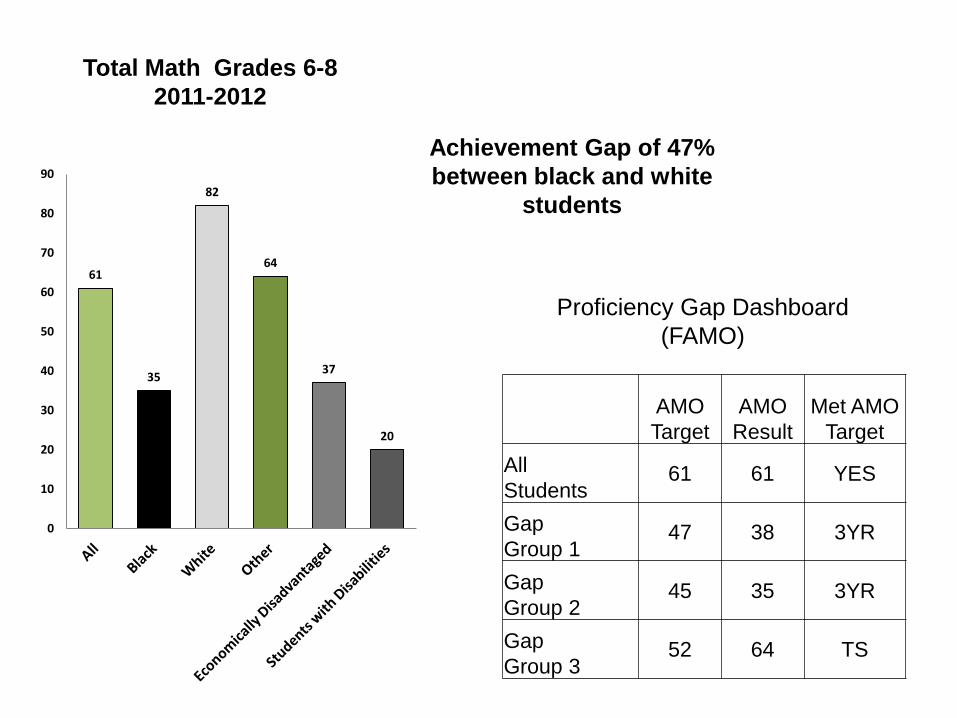
Proficiency Gap Dashboard (FAMO)
Total Math Grades 6-8 2011-2012
AMO Target
AMO Result
Met AMO Target
All Students
61 61 YES
Gap Group 1
47 38 3YR
Gap Group 2
45 35 3YR
Gap Group 3
52 64 TS
Achievement Gap of 47% between black and white
students
61
35
82
64
37
20
0
10
20
30
40
50
60
70
80
90

Total Science Grades 6-8 2011-2012
Achievement Gap of 11%
between black and white students
Total Social Studies Grades 6-8 2011-2012
Achievement Gap of 25%
between black and white students
86
72
97
79 75
64
0
20
40
60
80
100
120
93 87
98
85
63
0
20
40
60
80
100
120

0
20
40
60
80
100
120
140
160
180
A B C D F
Grade Distribution - English 2011-2012
Black White
Other Econ Dis
w/ Disabil

0
20
40
60
80
100
120
140
A B C D F
B
W
Other
Econ
Sped
Grade Distribution - Science 2011-2012
Black White
Other Econ Dis
w/ Disabil

0
20
40
60
80
100
120
140
A B C D F
B
W
Other
Econ
Sped
Grade Distribution - Math 2011-2012
Black White
Other Econ Dis
w/ Disabil
0
20
40
60
80
100
120
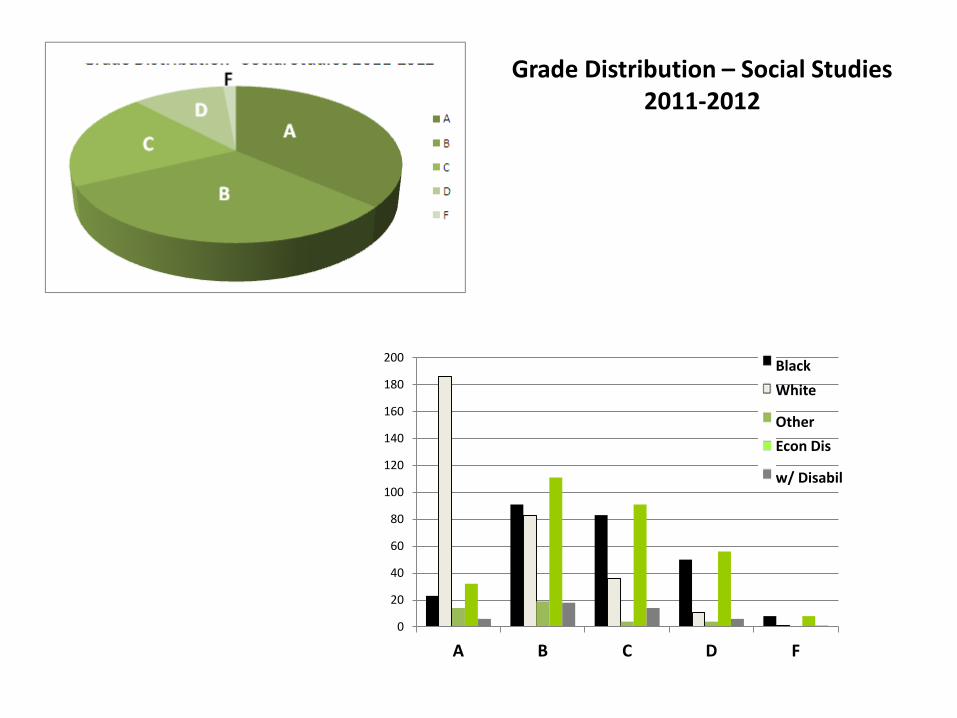
140
160
180
200
A B C D F
B
W
Other
Econ
Sped
Grade Distribution – Social Studies 2011-2012
Black White
Other Econ Dis
w/ Disabil

Staff Attendance 2011-2012
0
50
100
150
200
250
300
350
400
Personal Illness Family Illness Family Death Leave w/ Pay Leave w/o Pay Personal Leave

Where we started . . .

0
2
4
6
8
10
12
14
16
18
20
Low test/quiz
grades
Does not turn in
homework
Frequently out of class or absent
Does not make up
work
Lacks prerequisite
skills
Does not use classtime wisely /
Does not participate
in class
Inattentive in class
Does not complete classwork
Affected by disruptive
students in class
Won't stay after school
for extra help
Does not bring
materials to class
Not in appropriate placement
Reasons for Student Failure Survey Results
We asked and surveyed: Why aren’t our students being successful?
2010

Stanford Reading Diagnostic Test 2010-2011
LMS serves a very diverse population
6th
7th
8th
0
20
40
60
80
100
120
140
160
Below 5.5 On Grade Level Above 7.5
0
10
20
30
40
50
60
70
80
90
100
Below 6.5 On Grade Level Above 8.5
0
20
40
60
80
100
120
Below 7.5 On Grade Level Above 9.5

InterVenTion Team
Goal: To assist students in overcoming behavioral distracters and academic road blocks that effect school success

System of Interventions

Parallel Instruction for differentiation
Boot Camp for work completion
Support Classes for struggling Advanced
students
Mentors Parent / LU / Peer
Tutors
Many New Strategies
More Enrichment Opportunities for our
High Achievers
E-Period for more instructional time
Remediation for underperforming
students

•Accommodations/modifications
•Enrichment or Remediation Pull-out
•Differentiated instruction
•Pre & post testing and data monitoring
•Instruction based on progress monitoring of data
•Blocked math and reading
•Standards-based education with evidenced based practices
•Safe environment conducive to learning
•Cooperative learning
•Technology enhanced curriculum
•Student/parent conferencing
•Extra help offered
•Peer tutoring
•Proximity seating
•Bootcamp
•After-school tutoring
•TEAM
•School day tutoring
•Support classes
•Individual/small group counseling
•Academic/Behavior contracts
•Child Study/ special education
•Alternative education
•Day Treatment
•Health-related
Tier 2 – Results from teacher recommendations (typically take place outside the classroom)
Tier 3 – Requires parent support in designing behavior/educational plans
Tier 1 – Accessible to all students (typically implemented in the classroom or during the class period)
•Referral to IVT
•Mentoring
•Adjusted scheduling
•Student conferencing with IVT
Linkhorne Middle School Pyramid of Tiered Interventions

Continue reflection and evaluation with annual surveys (teachers, students, parents)
Seek outside resources: Consult Dr. Christopher Jones, Longwood (Teach kids at their instructional level and behavior and culture will improve)
Improve existing programs and interventions through collaborative problem-solving
Read and discuss as a faculty: Teach Like a Champion by Lemov
Utilize the expertise and strengths of existing staff

Where we are . . .

81
112
10
B W O
8th Grade
57
84
9
B W O
7th Grade
38
114
16
B W O
6th Grade Students Enrolled in at Least 1 Advanced
Course 2011-2012
by Race and Grade Level

Students Enrolled in at Least 1 Advanced Course 2011-2012
0
50
100
150
200
250
300
350
400
B W O
Students w/ Disabilities in at least 1 Adv Class
Economically Disadvantaged in at least 1 Adv Class
Enrolled in at least 1 Advanced Course
Enrolled in at least 1
Advanced Course
83%
Enrolled in No Advanced
Course 17%

56
38
98
0
10
20
30
40
50
60
70
80
90
100
110
Below 5.5 on Grade Level
Above 7.5
63
32
91
0
10
20
30
40
50
60
70
80
90
100
Below 7.5 on Grade Level
Above 9.5
76
40
89
0
10
20
30
40
50
60
70
80
90
100
Below 6.5 on Grade Level
Above 8.5
Stanford Reading Diagnostic Test 2012-2013
As our population changes, the gap widens
6th
7th
8th

Staff Survey: Describe the perfect LMS
•High Expectations for all: students, parents, teachers, and administrators •Excitement for teaching and learning •Accountability and Consistency •Team Work •Differentiation to challenge and meet the needs of every student •Communication among teachers, administrators, PLCs and with students, parents, and all stakeholders

LMS School Improvement Plan SY 2012-2013
Achievement
Behavior
Culture
• Use data to make decisions
•Correct students who are not following rules
•Celebrate successes
• Monitor and challenge teaching practices
• Distribute school’s Compact to stakeholders
• Administer pre/posts tests
• Review results
• Individualize instruction based on pre/post data
• Use data to identify students needing support/enhancement
• Develop instructional plans for students needing intervention

Where we’re headed . . .

from the bottom up
Close the achievement gap

more students in advanced classes with built in
supports when needed
staff development for differentiation of instruction
higher expectations for all students
highly invested faculty as a result of improved communication and support
use data to drive instructional decision making
continue to reflect, adjust and refine practices and programs
strategic use of faculty strengths
continue to seek out and access community resources

Preparing every student, by name and by need, for graduation and beyond

Appendix 2012-2013
School Improvement Plan Indicators and Strategies

ID10 - The school’s Leadership Team regularly looks at school performance data and aggregated classroom observation data and uses that data to make decisions about school improvement and professional development needs. (45)
STRATEGY EVALUATION / EVIDENCE OF COMPLETION RESPONSIBILITY
Professional Learning Communities will be provided with relevant SOL score data.
Test Scores and Grade Level Data Spreadsheets (eventually Datacation will serve this purpose)
Counseling Director Testing Clerk
Professional Learning Communities will establish frequency of pre/post testing of students.
Minutes of weekly PLC meetings Teachers
Professional Learning Communities will develop pre/post tests.
Minutes of weekly PLC meetings Teachers
Professional Learning Communities will establish a meeting schedule to review data and make instructional decisions.
Minutes of weekly PLC meetings Teachers
Professional Learning Communities will complete data analysis/instructional planning worksheets and submit them to the principal.
Minutes of weekly PLC meetings, data analysis documents submitted by PLCs 3 times each 9 week grading period
Teachers
The principal will analyze data from the Professional Learning Communities with the School Leadership Team.
Minutes of weekly School Leadership Team meetings where data is discussed, summary reports of data analysis completed 3 times each 9 week grading period
Principal
The School Leadership Team will report outcome of data analysis to the SIT.
SIT meeting minutes, summary reports of data analysis completed 3 times each 9 week grading period
School Leadership Team
The SIT, with input from the School Leadership Team, will look at overall trends in data and recommend needed professional development.
SIT meeting minutes, Professional Development Calendar, professional development sessions as noted on master calendar of school events
School Improvement Team School Leadership Team

IE 09 - The principal challenges and monitors unsound teaching practices and supports the correction of them. (60)
STRATEGY EVALUATION / EVIDENCE OF COMPLETION RESPONSIBILITY
The Administration will communicate instructional expectations to the faculty.
Faculty Meeting Agenda, Teacher Handbook
Principal Assistant Principals
The Administration will conduct regular classroom observations of teachers.
Documentation of walk-throughs, formal and informal classroom observations
Principal Assistant Principals
Teachers will receive a summary of their observations with recommendations for improvement. This will occur on the schedule provided by School Board policy.
Classroom observation summaries Principal Assistant Principals
The LMS staff will participate in regular professional development to enhance instructional practice. The Administration will communicate the expectation that strategies learned should be incorporated into classroom practice. These practices will be looked for during observations.
Professional Development Calendar, attendance at professional development sessions, faculty meeting agendas, minutes of PLC, grade level, and department meetings, classroom observation summaries
Principal Assistant Principals
The Administration will utilize Professional Plans of Assistance as necessary when teacher performance is determined to be below standard.
Professional Plans of Assistance and related documentation
Principal Assistant Principals

IIB02 - Unit pre-tests and post-tests are administered to all students in the grade level and subject covered by the unit of instruction.
STRATEGY EVALUATION / EVIDENCE OF COMPLETION RESPONSIBILITY
Instructional Teams (Professional Learning Communities) will collaboratively develop pre- and post-tests aligned with the standards-based objectives for each academic unit.
Minutes of weekly PLC meetings, copies of pre/post tests that indicate SOL objectives assessed
Teachers
At the beginning of each unit, teachers will administer the unit pre-test to each student.
Lesson plans, Class Data Document Teachers
At the end of each unit, teachers will administer the unit-post test to each student.
Lesson plans, Class Data Document Teachers

IIB03 - Unit pre-test and post-test results are reviewed by the instructional team.
STRATEGY EVALUATION / EVIDENCE OF COMPLETION RESPONSIBILITY
Professional Learning Communities will collaboratively develop pre- and post-tests aligned with the standards-based objectives for each academic unit.
Minutes of weekly PLC meetings, copies of pre/post tests that indicate SOL objectives assessed
Teachers
Professional Learning Communities will develop clear and specific criteria for mastery for each pre- and post-test.
Minutes of weekly PLC meetings, mastery criteria cited on each pre/post test
Teachers
Professional Learning Communities will meet to review the results of the pre-tests to determine areas of focus for instruction.
Minutes of weekly PLC meetings, Class Data Document with Data Analysis and Action Plan turned in to Principal 3 times each 9 week grading period
Teachers
Professional Learning Communities will meet to review the results of the post-tests to identify students who will need remediation and the areas of remediation.
Minutes of weekly PLC meetings, Class Data Document with Data Analysis and Action Plan turned in to Principal 3 times each 9 week grading period
Teachers
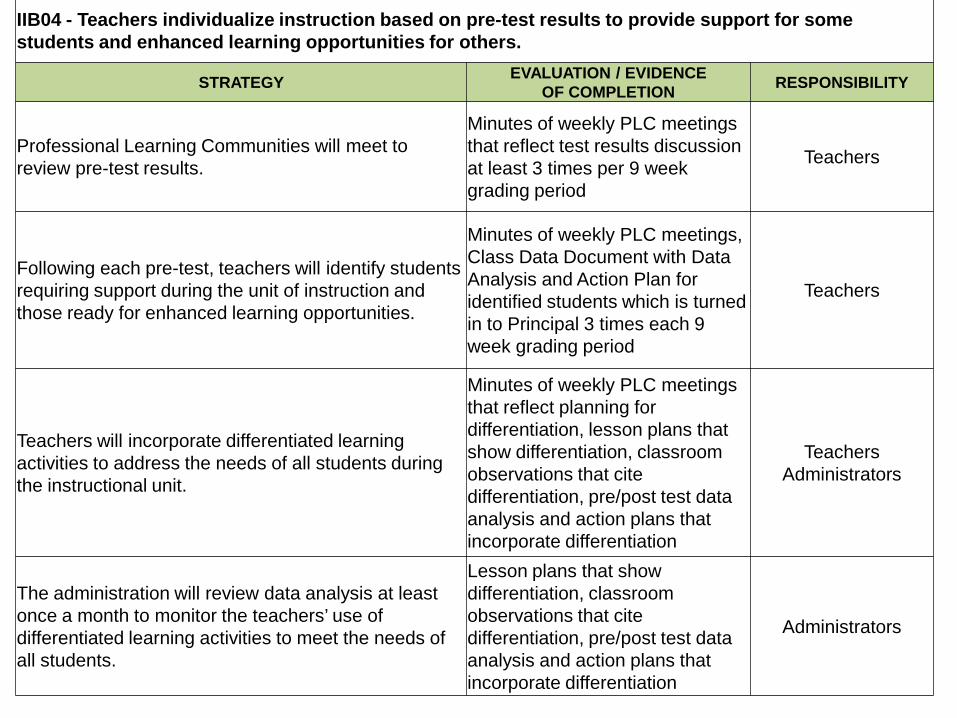
IIB04 - Teachers individualize instruction based on pre-test results to provide support for some students and enhanced learning opportunities for others.
STRATEGY EVALUATION / EVIDENCE OF COMPLETION RESPONSIBILITY
Professional Learning Communities will meet to review pre-test results.
Minutes of weekly PLC meetings that reflect test results discussion at least 3 times per 9 week grading period
Teachers
Following each pre-test, teachers will identify students requiring support during the unit of instruction and those ready for enhanced learning opportunities.
Minutes of weekly PLC meetings, Class Data Document with Data Analysis and Action Plan for identified students which is turned in to Principal 3 times each 9 week grading period
Teachers
Teachers will incorporate differentiated learning activities to address the needs of all students during the instructional unit.
Minutes of weekly PLC meetings that reflect planning for differentiation, lesson plans that show differentiation, classroom observations that cite differentiation, pre/post test data analysis and action plans that incorporate differentiation
Teachers Administrators
The administration will review data analysis at least once a month to monitor the teachers’ use of differentiated learning activities to meet the needs of all students.
Lesson plans that show differentiation, classroom observations that cite differentiation, pre/post test data analysis and action plans that incorporate differentiation
Administrators
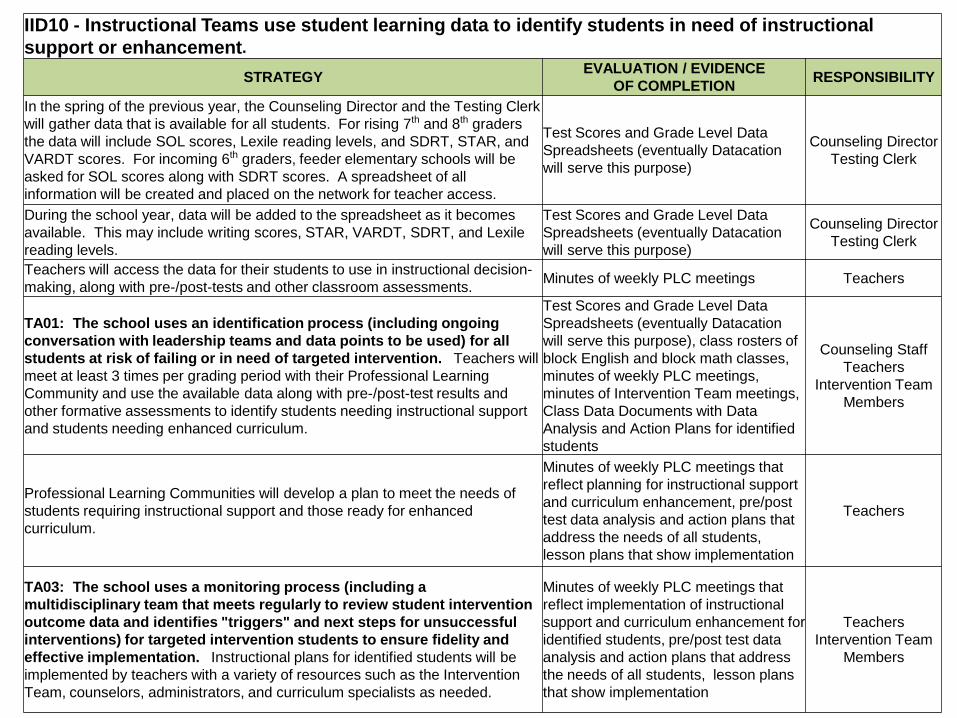
IID10 - Instructional Teams use student learning data to identify students in need of instructional support or enhancement.
STRATEGY EVALUATION / EVIDENCE OF COMPLETION RESPONSIBILITY
In the spring of the previous year, the Counseling Director and the Testing Clerk will gather data that is available for all students. For rising 7th and 8th graders the data will include SOL scores, Lexile reading levels, and SDRT, STAR, and VARDT scores. For incoming 6th graders, feeder elementary schools will be asked for SOL scores along with SDRT scores. A spreadsheet of all information will be created and placed on the network for teacher access.
Test Scores and Grade Level Data Spreadsheets (eventually Datacation will serve this purpose)
Counseling Director Testing Clerk
During the school year, data will be added to the spreadsheet as it becomes available. This may include writing scores, STAR, VARDT, SDRT, and Lexile reading levels.
Test Scores and Grade Level Data Spreadsheets (eventually Datacation will serve this purpose)
Counseling Director Testing Clerk
Teachers will access the data for their students to use in instructional decision-making, along with pre-/post-tests and other classroom assessments. Minutes of weekly PLC meetings Teachers
TA01: The school uses an identification process (including ongoing conversation with leadership teams and data points to be used) for all students at risk of failing or in need of targeted intervention. Teachers will meet at least 3 times per grading period with their Professional Learning Community and use the available data along with pre-/post-test results and other formative assessments to identify students needing instructional support and students needing enhanced curriculum.
Test Scores and Grade Level Data Spreadsheets (eventually Datacation will serve this purpose), class rosters of block English and block math classes, minutes of weekly PLC meetings, minutes of Intervention Team meetings, Class Data Documents with Data Analysis and Action Plans for identified students
Counseling Staff Teachers
Intervention Team Members
Professional Learning Communities will develop a plan to meet the needs of students requiring instructional support and those ready for enhanced curriculum.
Minutes of weekly PLC meetings that reflect planning for instructional support and curriculum enhancement, pre/post test data analysis and action plans that address the needs of all students, lesson plans that show implementation
Teachers
TA03: The school uses a monitoring process (including a multidisciplinary team that meets regularly to review student intervention outcome data and identifies "triggers" and next steps for unsuccessful interventions) for targeted intervention students to ensure fidelity and effective implementation. Instructional plans for identified students will be implemented by teachers with a variety of resources such as the Intervention Team, counselors, administrators, and curriculum specialists as needed.
Minutes of weekly PLC meetings that reflect implementation of instructional support and curriculum enhancement for identified students, pre/post test data analysis and action plans that address the needs of all students, lesson plans that show implementation
Teachers Intervention Team
Members

IID11 - Instructional Teams review the results of pre-/post-tests to make decisions about the curriculum and instructional plans and to “red flag” students in need of intervention (both students in need of tutoring or extra help and students needing enhanced learning opportunities because of their early mastery of objectives).
STRATEGY EVALUATION / EVIDENCE OF COMPLETION RESPONSIBILITY
In their Professional Learning Community, teachers will collaboratively develop pre-/post-tests aligned with standards-based objectives for each unit.
Minutes of weekly PLC meetings, copies of pre/post tests that indicate SOL objectives assessed
Teachers
Professional Learning Communities will develop clear and specific criteria for mastery of each pre-/post-test.
Minutes of weekly PLC meetings, mastery criteria cited on each pre/post test
Teachers
Professional Learning Communities will meet regularly and use pre-/post-test results along with other formative assessments to identify students needing instructional support, as well as those needing enhanced curriculum.
Minutes of weekly PLC meetings, Class Data Document with Data Analysis and Action Plan for identified students which is turned in to Principal 3 times each 9 week grading period
Teachers
Professional Learning Communities will develop a plan to meet the needs of students requiring instructional support and those ready for enhanced curriculum.
Minutes of weekly PLC meetings that reflect planning for instructional support and curriculum enhancement, pre/post test data analysis and action plans that address the needs of all students, lesson plans that show implementation
Teachers
TA02: The school uses a tiered, differentiated intervention process to assign research-based interventions aligned with the individual needs of identified students (the process includes a description of how interventions are selected and assigned to students as well as the frequency and duration of interventions for Tier 2 and Tier 3 students). In order to address the specific needs of Gap 1 and Gap 2 students in the area of reading, identified students will be placed in “Block” English classes thus providing additional instructional time five days per week. Additionally, instructional plans for identified students will be implemented with Professional Learning Community members and available support staff, which includes the LMS Intervention Team.
Rosters of block English classes, minutes of weekly Intervention Team meetings, LMS Pyramid of Interventions, minutes of weekly PLC meetings, Class Data Document with Data Analysis and Action Plan for identified students which is turned in to Principal 3 times each 9 week grading period
Teachers Intervention Team
Members

IIIC09 - All teachers correct students who do not follow classroom rules and procedures.
STRATEGY EVALUATION / EVIDENCE OF COMPLETION RESPONSIBILITY
Each teacher will post classroom rules and procedures.
Jaguar Expectations poster mounted in every classroom. Teachers
Each teacher will teach the rules and procedures so all students understand expectations in the classroom.
Lesson plans that indicate student rules and expectations were reviewed, dates of Jaguar Expectations assemblies as noted on master calendar of school events, LMS agenda that includes student rules and expectations, student quiz on Jaguar Expectations administered the first week of school
Teachers Administrators
Teachers will remind students of the rules and procedures when they are not being followed.
Documentation of Discipline and related actions Teachers
Teachers will intervene promptly when inappropriate behavior occurs.
Documentation of Discipline and related actions Teachers

IE 10 - Principal celebrates individual, team, and school successes, especially related to student learning outcomes.
STRATEGY EVALUATION / EVIDENCE OF COMPLETION RESPONSIBILITY
For students and teachers, the principal will coordinate with the School Leadership Team and the PTO to create a system of rewards/recognitions that will reach the majority of students and many teachers during the school year.
Minutes of School Leadership Team meetings, minutes of IVT meetings, minutes of PTO meetings, minutes of faculty meetings, activities as noted on master calendar of school events
Principal School Leadership Team
PTO
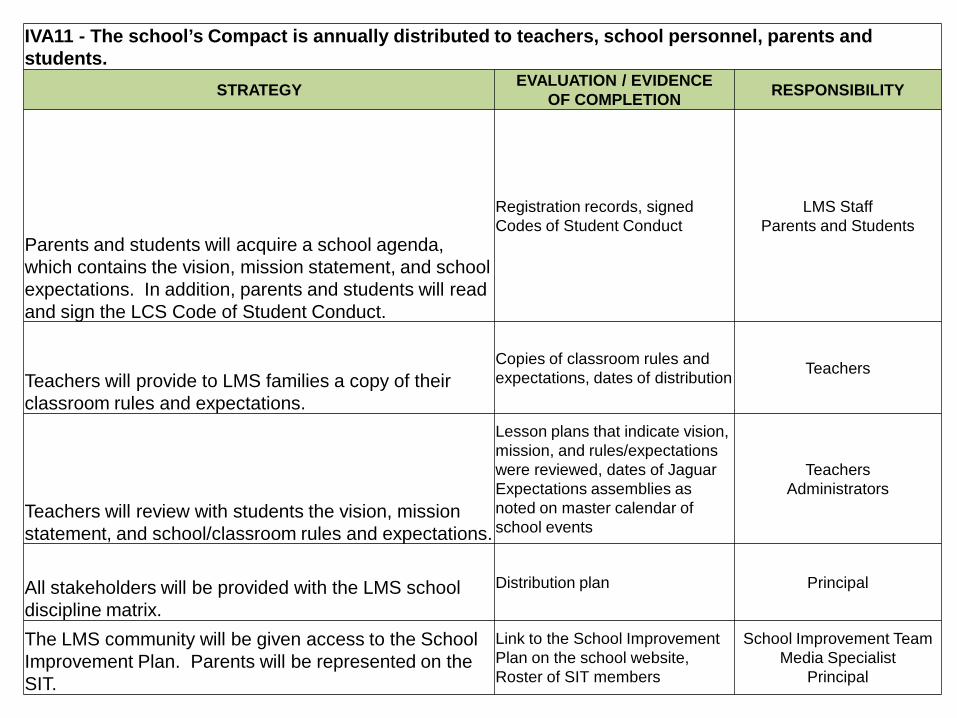
IVA11 - The school’s Compact is annually distributed to teachers, school personnel, parents and students.
STRATEGY EVALUATION / EVIDENCE OF COMPLETION RESPONSIBILITY
Parents and students will acquire a school agenda, which contains the vision, mission statement, and school expectations. In addition, parents and students will read and sign the LCS Code of Student Conduct.
Registration records, signed Codes of Student Conduct
LMS Staff Parents and Students
Teachers will provide to LMS families a copy of their classroom rules and expectations.
Copies of classroom rules and expectations, dates of distribution Teachers
Teachers will review with students the vision, mission statement, and school/classroom rules and expectations.
Lesson plans that indicate vision, mission, and rules/expectations were reviewed, dates of Jaguar Expectations assemblies as noted on master calendar of school events
Teachers Administrators
All stakeholders will be provided with the LMS school discipline matrix.
Distribution plan Principal
The LMS community will be given access to the School Improvement Plan. Parents will be represented on the SIT.
Link to the School Improvement Plan on the school website, Roster of SIT members
School Improvement Team Media Specialist
Principal