whole-tree water relations of co-occurring mature pinus palustris and...
TRANSCRIPT

Whole-tree water relations of co-occurring maturePinus palustris and Pinus elliottii var. elliottii
Carlos A. Gonzalez-Benecke, Timothy A. Martin, and Wendell P. Cropper, Jr.
Abstract: The natural range of longleaf pine (Pinus palustris P. Mill.) and slash pine (Pinus elliottii var. elliottii Engelm.)includes most of the southeastern US Coastal Plain, and there is now considerable interest in using these species for eco-logical forestry, restoration, and carbon sequestration. It is therefore surprising that little information is currently availableconcerning differences in their ecological water relations in natural stands. In this study, we compared water use, stomatalconductance at the crown scale (Gcrown), and whole-tree hydraulic conductance of mature pine trees growing in a naturallyregenerated mixed stand on a flatwoods site in north-central Florida. We found remarkable similarities between longleafand slash pine in stored water use, nocturnal transpiration, and whole-tree hydraulic conductance. Mean daily transpirationrate was higher for slash than for longleaf pine, averaging 39 and 26 L�tree–1, respectively. This difference was determinedby variations in tree leaf area. Slash pine had 60% more leaf area per unit basal sapwood area than longleaf pine, but thelarger plasticity of longleaf pine stomatal regulation partially compensated for leaf area differences: longleaf pine hadhigher Gcrown on days with high volumetric water content (qv) but this was reduced to similar or even lower values thanfor slash pine on days with low qv. There was no species difference in the sensitivity of Gcrown to increasing vapor pressuredeficit.
Resume : L’aire de repartition naturelle du pin des marais (Pinus palustris P. Mill.) et du pin d’Elliott typique (Pinus el-liottii var. elliottii Engelm.) comprend presque toute la plaine cotiere du sud-est des Etats-Unis et l’utilisation de ces espe-ces pour la foresterie ecologique, la restauration et la sequestration du carbone suscite actuellement un interetconsiderable. Il est par consequent surprenant que peu d’information soit presentement disponible au sujet de leurs diffe-rences quant aux relations hydriques de nature ecologique dans les peuplements naturels. Dans cette etude, nous compa-rons l’utilisation de l’eau, la conductance stomatique de la cime (Gcrown) et la conductance hydraulique de l’arbre entierchez des pins matures croissant dans un peuplement melange regenere naturellement dans une station des « flatwoods » ducentre-nord de la Floride. Nous avons observe de remarquables similarites entre le pin des marais et le pin d’Elliott ty-pique quant a l’utilisation de l’eau emmagasinee, la transpiration nocturne et la conductance hydraulique de l’arbre entier.Le taux journalier moyen de transpiration du pin d’Elliott typique etait plus eleve que celui du pin des marais, soit respec-tivement 39 et 26 L�arbre–1. Cette difference etait determinee par la surface foliaire des arbres. Le pin d’Elliott typiqueavait 60 % plus de surface foliaire par unite de surface terriere de l’aubier que le pin des marais. Par contre, une plusgrande plasticite de la regulation stomatique chez le pin des marais compensait en partie pour les differences de surface fo-liaire : la valeur de Gcrown etait plus elevee chez le pin des marais les jours ou la teneur volumetrique en eau (qv) etait ele-vee mais elle atteignait des valeurs similaires ou meme inferieures a celles du pin d’Elliott typique les jours ou qv etaitfaible. La sensibilite de Gcrown a l’augmentation du deficit de pression de vapeur etait la meme chez les deux especes.
[Traduit par la Redaction]
Introduction
Pine forests once dominated the upland plant communitiesof the southeastern Coastal Plain (Pessin 1933). Althoughlongleaf pine (Pinus palustris P. Mill.) was the dominanttree species in drier sandhills, slash pine (Pinus elliottii var.elliottii Engelm.) was an important codominant in wetterflatwoods (Pessin 1933; Abrahamson and Hartnett 1990).Flatwoods are the most extensive type of terrestrial ecosys-tem in the US outer coastal plain province, covering225 000 km2, about 50% of its land area (McNab and Avers1994). Longleaf and slash pine are characteristic of pineflatwoods. More than 97% of the original land area of long-
leaf pine has been converted to other uses (Johnson andGjerstad 2006) and some of the most species-rich areas andhighest concentrations of endangered and threatened speciesin the Southeast are found on mesic flatwood sites (Cohen etal. 2004). These characteristics have led to increasing inter-est in restoration and ecological management of longleaf andslash pine forests in the region (Alavalapati et al. 2002).
The native pine species of flatwoods are well adapted tofrequent, low intensity fires, but the greater fire sensitivityof slash pine (Abrahamson and Hartnett 1990) coupled withlonger fire return times in flatwoods relative to sandhills is astandard explanation of slash and longleaf pine co-occur-rence on these sites. Experimental fire studies indicate that
Received 2 June 2010. Accepted 25 November 2010. Published on the NRC Research Press Web site at cjfr.nrc.ca on 2 February 2011.
C.A. Gonzalez-Benecke,1 T.A. Martin, and W.P. Cropper, Jr.. School of Forest Resources and Conservation, P.O. Box 110410,University of Florida, Gainesville, FL 32611-0410, USA.
1Corresponding author (e-mail: [email protected]).
509
Can. J. For. Res. 41: 509–523 (2011) doi:10.1139/X10-230 Published by NRC Research Press
Can
. J. F
or. R
es. D
ownl
oade
d fr
om w
ww
.nrc
rese
arch
pres
s.co
m b
y 12
8.22
7.5.
142
on 0
4/11
/11
For
pers
onal
use
onl
y.

long-term persistence of longleaf pine in flatwood sites mayinvolve complex interactions of fire, pine life history, andsite water balance (Glitzenstein et al. 1995). The potentialsignificance of water availability and plant water relationsin sites with fine sand soils that have little moisture-holdingcapacity typical of pine flatwoods (Abrahamson and Hart-nett 1990) is underappreciated. Longleaf pine diametergrowth has been shown to have a high correlation withspring and summer Palmer drought severity index estimates(Van De Gevel et al. 2009). Florida oak species show dis-tinct habitat segregation in response to soil moisture gra-dients (Cavender-Bares et al. 2004).
The relative densities and proportions of longleaf andslash pine depend on geographic location, climate, edaphicconditions, fire history, and human influences (Ewel 1990).Longleaf and slash pine can overlap on mesic flatwoodssites. Longleaf pine typically dominates on higher ground(drier) and better-drained sites, while slash pine dominateson lower (wetter) sites where seasonal ponding occurs. Slashpine is primarily located around or even inside the seasonalponds, while longleaf pine dominates the higher areas be-tween the ponds (Ewel 1990; Peet 2006).
At a global scale, water availability is one of the most im-portant factors controlling productivity and species distribu-tions, and interactions between water availability and waterrelations within species are important in determining habitatassociations (Baraloto et al. 2007). Few studies exist thathave examined water relations of mature longleaf and slashpine under field conditions (Teskey et al. 1994; Martin2000; Ford and Brooks 2003; Vose et al. 2003; Addingtonet al. 2004, 2006; Ford et al. 2004). Whole-tree water rela-tions characteristics, including leaf-specific hydraulic con-ductivity (KL-wt) and stomatal conductance to water vapor atthe crown level (Gcrown), are important hydraulic architecturetraits (Cruiziat et al. 2002). Variations in these traits havesignificant implications for patterns of transpiration and leafwater potential observed within forest canopies (Wulls-chleger et al. 1998) and for assessing the trade-offs betweenwater transport and vulnerability of woody stems to xylemcavitation (Sperry et al. 1998). The objective of this studywas to characterize whole-tree water relations of maturetrees of these co-occurring species in terms of total dailytranspiration, water storage use, leaf to sapwood area, KL-wt,and adjustments in Gcrown to varying vapor pressure deficit(D) and soil water content (qv) conditions. Because longleafpine tends to dominate on drier and better-drained sites,while slash pine dominates on wetter sites, we hypothesizedthat (i) transpiration rate, water storage use, leaf to sapwoodarea ratio, and KL-wt are higher in slash pine trees and (ii)longleaf pine Gcrown is more sensitive than slash pine Gcrownto changes in D and qv.
Materials and methods
Site and stand descriptionThe study was carried out from 17 April to 9 July 2007 at
the University of Florida’s Austin Cary Memorial Forest lo-cated 15 km northeast of Gainesville, Florida (29844’N,82809’W). Soils are classified as poorly-drained Pomonasands (sandy, siliceous, hyperthermic Ultic Aplaquods) witha discontinuous spodic horizon at 0.3–0.6 m depth and
deeper argillic horizon at 1.0–1.4 m depth (Gaston et al.1990). The study stand consists of a naturally regeneratedmixed longleaf and slash pine stand with tree ages rangingbetween 25 and 85 years with a mean age of 65 years. Pre-scribed fires have been applied since the 1950s with a 3- to5-year return interval. The stand was thinned in 1991, re-moving proportionally for both species 27% of the basalarea. The stand basal area at the time of measurement was16.9 m2�ha–1 (73% longleaf pine and 17% slash pine).Within the stand, slash pine tended to be clumped in thelower lying areas and along pond margins, all within a ma-trix of longleaf pine. The understory consisted of native spe-cies dominated by gallberry (Ilex glabra (L.) Gray), sawpalmetto (Serenoa repens (Bartr.) Small), wax myrtle(Myrica cerifera L.), and wiregrass (Aristida stricta Michx)(Powell et al. 2005).
Meteorological measurementsEnvironmental conditions were monitored using an auto-
matic weather station located on the top of a 30 m scaffold-ing tower extended approximately 5 m above the meancanopy height (Powell et al. 2005). We measured relativehumidity and air temperature (HMP45C-L; Vaisala, Inc.,Helsinki, Finland), photosynthetic photon flux density(PPFD) (mmol�m–2�s–1,) (Li-190; LI-COR Inc., Lincoln, Ne-braska), wind direction and velocity (03001-L; CampbellScientific, Logan, Utah), and precipitation (TR525-I; TexasElectronics, Dallas, Texas) at 30 s intervals using an auto-matic datalogger (CR10X; Campbell Scientific) and stored30 min averages. Water table depth was measured (F-68;Leupold and Stevens, Inc., Beaverton, Oregon) in a piezom-eter well located approximately at the midpoint between thelongleaf and slash pine sectors.
Soil propertiesWe measured volumetric soil water content qv) (m3�m–3)
with vertically oriented, 200 mm long capacitive soil mois-ture probes (EC-20; Decagon Devices, Pullman, Washing-ton). Probes were installed at 0.4–0.6, 0.9–1.1, and 1.4–1.6 m depths into two sectors representing the slash andlongleaf pine microsites. These intervals were selected basedon previous studies showing that changes in canopy conduc-tance were better correlated with changes in qv between 0.3and 0.75 m depth (Gonzalez-Benecke and Martin 2010). Es-timates of water content from each probe were extrapolatedto the midpoint distance between sensors. Specific calibra-tions were developed from soil samples taken 0.5 m awayfrom each probe from the same depth. Soil-specific calibra-tions (not significantly different from the manufacturer’s de-fault calibration) were used to transform sensor output (mV)to volumetric water content: qv = –0.24508 + 0.0007958 �mV. There was no difference between samples taken ateach depth and the manufacturer’s calibration (P = 0.65 and0.82 for intercept and slope, respectively). Soil matric poten-tial (Js) (MPa) was estimated for the 0.4–0.6 m depth meas-urements using previous soil water retention curvesgenerated for local Spodosols (H.L. Gholz, unpublisheddata) and for the 0.9–1.0 and 1.4–1.6 m depth measurementsusing a computer program based on pedotransfer functionsand parameterized with soil texture and bulk density dataobtained at each location (Schaap et al. 2001; ROSETTA
510 Can. J. For. Res. Vol. 41, 2011
Published by NRC Research Press
Can
. J. F
or. R
es. D
ownl
oade
d fr
om w
ww
.nrc
rese
arch
pres
s.co
m b
y 12
8.22
7.5.
142
on 0
4/11
/11
For
pers
onal
use
onl
y.

version 1.2, US Salinity Laboratory ARS-UDA, Riverside,California). Particle size distribution was determined usingthe hydrometer method (Gee and Bauder 1986). Soil bulkdensity (rs) (kg�m–3) was determined using a soil core sam-pler (0200; Soil Moisture Equipment Corp., Santa Barbara,California). Available soil water (mm) and relative extract-able soil water (REW) (%) were calculated for each micro-site and day by analyzing the limits of wetting and drying ofthe soil through the entire study period (Ritchie 1981).
Tree selectionFour measurement trees per species were chosen from
across the range of tree diameters using ‘‘quantiles of total’’,a stratification scheme that weights the selection of large-di-ameter trees more heavily than small-diameter trees (Hattonet al. 1995; Martin et al. 1997), concentrating measurementresources in tree size-classes that tend to dominate standtranspiration (Martin et al. 1997). On each tree, we meas-ured leaf water potential, sap flow, sapwood, and leaf area.Details of biometric attributes of selected trees are presentedin Appendix A.
Sap flow measurementsTwenty millimetre long Granier-type heat dissipation
probes (Granier 1985) were installed approximately 0.2 mbelow the base of the crown (Scrown) of each measurementtree (see Appendix A). Briefly, the system consists of twoprobes inserted radially into the stem one above anotherabout 0.1–0.15 m apart. The upper probe contains a heaterand a T-type thermocouple and the lower probe containsonly the thermocouple. The upper probe was heated at con-stant power, while the lower one was used as referencemeasuring the ambient temperature of the wood. The tem-perature difference between the heated and reference probes(DT) was recorded. Sap flux density (JS) (g water�m2
sapwood–1�s–1) was determined using the empirical calibra-tion developed by Granier (1985) and confirmed by Braunand Schmid (1999) and Clearwater et al. (1999):
JS ¼ 119� DTm �DT
DT
!1:2310@
Sap flow data were corrected to account for nocturnal tran-spiration by using the method proposed by Oishi et al.(2008), where DTm was determined as the highest DT onstable days with negligible D (average, minimum 2 h D <0.05 kPa). Nocturnal transpiration (Enight) was determinedfor each tree as the total daily sap flow measured at Scrownwhen PPFD < 5 mmol�m–2�s–1.
To determine radial patterns JS (Lu et al. 2000; Ford et al.2004), variable length sap flow probes, as described byJames et al. (2002), were installed at 1.8 m stem height(Sbase). Probes were inserted at 10 mm depth intervals withthe tip of the 10 mm long probes reaching 10, 20, 30, 40,60, 80, and 100 mm depths (assuming to measure sap fluxdensity in discrete depths, e.g., 0–10, 10–20, ..., 90–100 mm). The probe for the outermost position was installedon the north side of the stem and subsequent probes wereinstalled clockwise around the stem at 458 intervals.Weighted average JS at Sbase (Js-b) was calculated at each
time step as the sum of the product of JS and annulus areacorresponding to each depth divided by total sapwood areato determine a unique and integrated value of JS for eachtree and time step. Weighted average JS at Scrown (Js-c) wascalculated using sap flux density values measured at thecrown base at 0–20 mm sapwood depth corrected by the ra-dial profile in native sapwood-specific hydraulic conductiv-ity at Scrown determined for each tree (Gonzalez-Benecke etal. 2010). Sap flux density was converted to sap flow bymultiplying Js-b and Js-c by the corresponding sapwood areaof each measurement point. With a chisel, bark andcambium were removed at the probe installation point to in-sert the sensors entirely into the xylem. Probes were coatedwith thermally conductive silicone grease before placementin the trees. All the sensors were protected against radiation,thermal gradients, and precipitation by reflective insulation.
Estimations of Js-c were carried out with the objective tominimize water storage effects on time lags between crowntranspiration and stem sap flow measurements Sbase (Braunand Schmid 1999; Phillips et al. 2003). Daily stored wateruse (SWU) was computed following Goldstein et al. (1998)as the difference between Js-c and Js-b when Js-b < Js-c (waterstorage withdrawal). SWU was calculated as the proportionof daily water stored to total sap flow at the crown base(Phillips et al. 2003; Daley and Phillips 2006).
Even though our estimates of Js-c were not corrected forradial profile in JS at that point, we believe that the use ofJs-c to estimate tree transpiration is appropriate because (i)the radial profile in stem sapwood-specific native conduc-tance showed no significant differences between 10 and40 mm depth (P > 0.14) (Gonzalez-Benecke and Martin2010), (ii) the sapwood area of the outer 20 mm corre-sponds, on average, to 54% and 51% of total sapwood forlongleaf and slash pine, respectively, and (iii) total dailysap flow per tree estimated at Sbase and Scrown was not differ-ent (P > 0.38) (data not shown).
Leaf and sapwood areaAt the end of the study, all four sap flow measurement
trees from each species were felled to determine total treeleaf area (LA) (m2) using a destructive determination ofleaf mass (g) in conjunction with tree-specific estimationsof all-sided specific LA (cm2�g–1). Trees were felled at astump height of approximately 0.2 m and all branches werecut at the point where live needles started. All branch tipswere weighed green in the field and summed to determinewhole-tree branch tip fresh mass. For each tree, 20 randomlyselected subsamples of branch tips were weighed, bagged,and brought back to the laboratory for separate determina-tions of moisture contents and dry masses of wood and nee-dles of each branch tip. Dry mass of all living needles of thewhole tree crown was estimated as the product of field-de-termined whole-tree branch tip fresh mass and the averagedry needle to fresh branch tip ratios derived from all 20branch tip subsamples. Needles were weighed separatelyinto two age-classes: current year and older needles, so dryneedle to fresh branch tip ratios were also calculated sepa-rately for each needle type.
All-sided specific LA was determined using the ratio be-tween surface area and dry mass of needles. Individual nee-dle surface area was calculated according to Niinemets et al.
Gonzalez-Benecke et al. 511
Published by NRC Research Press
Can
. J. F
or. R
es. D
ownl
oade
d fr
om w
ww
.nrc
rese
arch
pres
s.co
m b
y 12
8.22
7.5.
142
on 0
4/11
/11
For
pers
onal
use
onl
y.

(2001) from needle radius (scaled magnifier, 10�; SPI, Ja-pan) and length (digital caliper, CD-6; Mitutoyo, Japan) on10 needles per tree. After surface area was determined, theneedles were oven-dried for 48 h at 75 8C and weighed tothe nearest 0.0001 g (XA-100; Denver Instruments, Denver,Colorado). A weighted average all-sided specific LA wasdetermined for each tree after including the proportion ofleaf mass of each needle age. To estimatedaily LA for eachtree, seasonal patterns were developed using published peri-odic measurements of leaf area index (m2�m–2) from January2000 to January 2006 (Powell et al. 2008). LA was esti-mated backward in time from the LA measurement day (be-tween 21 June and 9 July) until the sap flow installation day(17 April).
In all measured trees, at the same point where sap flowprobes were installed (at Sbase and Scrown), sapwood area(m2) was estimated at the end of the study by measuringsapwood depth and stem diameter directly in disks extractedafter the trees were felled. The disks were transported backto the laboratory covered with wet towels in plastic bags andstored at 5 8C for further hydraulic conductivity measure-ments (Gonzalez-Benecke et al. 2010). Aboveground sap-wood volume below the crown base was calculated for eachtree by using sapwood area measured at the stump andcrown base and distance from the stump to crown base.Stem diameter and bark thickness were measured verticallyalong the stem every 2 m to determine stem volume. TheHuber value (sapwood to LA ratio, m2 sapwood�m2 LA–1)was calculated for each tree as sapwood area at Sbase orScrown divided by total LA.
Crown conductanceStomatal conductance for water vapor at the individual
tree crown scale (Gcrown) (m�s–1) was calculated as in Gra-nier and Loustau (1994) from the inverted Penman–Mon-teith equation. After correcting for temperature changes inwater density, Gcrown was transformed to molar units (mmolwater�m2 LA–1�s–1). Average daily Gcrown (GCday)(mmol�m–2�s–1) was estimated during daylight time (PPFD >5 mmol�m–2�s–1). A reference Gcrown (GCref) was calculated atD 1 kPa (Granier et al. 1996). The response of Gcrown to Dwas quantified using boundary line analysis (Ewers et al.2001). The upper boundary line for each tree was derivedby binning Gcrown data into 0.2 kPaD intervals (from 0.2 to4.6 kPa) and then selecting the highest 95% Gcrown for anyinterval (Gonzalez-Benecke and Martin 2010. For each tree,all upper Gcrown values in each D interval were related to thenatural logarithm of D (Granier et al. 1996):
Gcrown ¼ GCref � m lnD
where m is the slope of the regression fit, representing sto-matal sensitivity to D (–dGcrown/d ln D)(mmol�m–2�s–1�ln kPa–1). Nocturnal Gcrown was analyzed inthe same way but selecting data during nighttime (PPFD <5 mmol�m–2�s–1). To reduce error due to instrument limita-tions on relative humidity measurements, Gcrown was calcu-lated only when D ‡ 0.2 kPa. Our first approach was to usea threshold of D ‡ 0.6 kPa, as proposed by Ewers and Oren(2000), but as the estimated values were not different if D ‡0.2 kPa was included or not (P > 0.24) and as this informa-
tion allowed us analyze nocturnal Gcrown, we used D ‡0.2 kPa as the cutoff threshold.
To assess the effect of qv in the relationship between day-timeGCref and –dGcrown/d ln D, a GCref under varying soilmoisture conditions was also determined for each tree asthe average Gcrown at D 1 kPa under light-saturated condi-tions (PPFD > 800 mmol�m–2�s–1) by binning Gcrown datainto 0.02 m3�m–3 qv intervals (from 0.10 to 0.18 m3�m–3)and then calculating the averageGcrown for any interval.
Whole-tree hydraulic conductanceWhole-tree sapwood-specific hydraulic conductance
(KS-wt) (mol water�m2 sapwood–1�s–1�MPa–1) was computedas the slope of the linear regression between Js-c (trans-formed to molar units) and leaf water potential (Jl) (MPa)(Wullschleger et al. 1998). For the day of Jl measurements(17 April 2007), JS was measured at 1 min intervals. Jl wasmeasured using a portable pressure chamber (PMS 1000;MPS Instrument Co., Corvallis, Oregon) on one shoot tipfrom predawn (5:00–5:30 a.m.) to late afternoon (6:00–6:30p.m.) at intervals of 2 h approximately, completing fivemeasurements per tree during the day. Each measurementwas completed within 3 min after shoot excision, coveringthe sample with wet towels inside a plastic bag and main-taining inside an insulated box to minimize desiccation.Shoot sampling was carried out using a canopy lift and polepruner.For each tree, if nighttime sap flow was detected dur-ing the night when predawn leaf water potential (Jpred) wasmeasured, Jsat the root zone of each tree (Js-est) was esti-mated as the intercept of the relationship between Js-c andJl. Maximum leaf water potential gradient (DJ) (MPa) wascalculated as the difference between midday leaf water po-tential (Jmidday, the minimum Jl measured close to midday)and Js-est. Whole-tree leaf-specific hydraulic conductanceKL-wt (mmol water�m2 LA–1�s–1�MPa–1) was determined foreach tree as KS-wt multiplied by the corresponding sapwoodto LA ratio (i.e., Huber value at Scrown).
Statistical analysisAnalysis of variance was used to analyze the effects of
species on water relationship traits, including Bonferroni ad-justments for differences in least square means (PROCMIXED; SAS Institute Inc., Cary, North Carolina). The lin-ear model for the analysis was
Yij ¼ mþ Si þ tjðiÞ þ 3ij
where Yij is the response value of the jth tree (j = 1, ..., 4) inthe ith species (i = 1, 2), m is the population mean, Si is thefixed effect of species (longleaf or slash pine), tj(i) is the ran-dom effect of tree nested within species, and 3ij is the errorterm ~ NID (0, s3
2) (NID, normally and independently dis-tributed).
Repeated-measures analysis of variance was used to ana-lyze time series data. Several covariance structure modelswere used for the time series analysis (power, heterogeneousfirst-order autoregressive, compound symmetry, heterogene-ous Toeplitz, unstructured and uncorrelated models) and themodel with the lowest Schwartz’s Bayesian information cri-terion was selected for each variable analyzed (Littell et al.2006).
512 Can. J. For. Res. Vol. 41, 2011
Published by NRC Research Press
Can
. J. F
or. R
es. D
ownl
oade
d fr
om w
ww
.nrc
rese
arch
pres
s.co
m b
y 12
8.22
7.5.
142
on 0
4/11
/11
For
pers
onal
use
onl
y.

Results
Environmental conditionsDuring the sap flow measurement period (from 17 April
to 9 July), total precipitation was 152.9 mm, correspondingto 45.7% of historic averages for the site (during a ‘‘normal’’year, 334.2 mm of rainfall would occur during that period)(ht tp: / /cdo.ncdc.noaa.gov/cgi -bin/c l imatenormals /climatenormals.pl [accessed August 2008]). Mean daily tem-perature increased gradually from values close to 17 8C dur-ing the third week of April to 29 8C during the first week ofAugust. Total daily PPFD ranged from about 20 to75 mol�m–2�day–1 when the study was completed (Fig. 1a).Daily average D followed a similar pattern as daily PPFDbut peaking approximately 1 month earlier. Both PPFD andD increased in variability during the summer in comparisonwith winter daily values (Fig. 1a). Available soil water from0.4 to 1.6 m depth reached minimum values of 23.4 and26.6 mm for longleaf and slash pine sites, respectively, cor-responding to 2.6% and 5.5% REW, respectively (Fig. 1b).Water table depth ranged from 1.4 m at the beginning ofthe growing season up to 2.5 m in mid-July (Fig. 1b). As adifference in elevation of approximately 1.0 m was meas-ured between the midpoint of the longleaf and slash pinetrees, and assuming constant slope between both sectors,water table depth fluctuated between 1.5 and 2.0 m in slash
pine and between 2.5 and 3.0 m in longleaf pine zones dur-ing the sap flow measurement period.
Sap flux density, transpiration, water storage use, andsoil moisture
At 1.8 m height (Sbase), the relationship between Js-b anddistance from the cambium reflected a general trend thatthe outer probes (installed from 10 to 40 mm depth) hadhigher values and followed the daily D cycle comparedwith inner probes (installed at 60 and 80 mm depth), whichtended to peak in late afternoon, even during night when JSfor outer probes decreased to near-zero values (data notshown). In general, after comparing Js-b and Js-c with dailycourses of D and PPFD, it is possible to observe that Js-cfits better with D (Fig. 2) and the use Js-b can result in errorswhen the objective is to match JS with other simultaneousmeteorological or physiological measurements such ascrown conductance or whole-tree hydraulic conductivity.Therefore, we used Js-c for further analysis of tree wateruse, crown conductance, and whole-tree hydraulic conduc-tivity.
For the period analyzed from 28 April to 18 June 2007,overall daily transpiration rates (Eday) (L�tree–1) for longleafand slash pine were 26.1 and 39.5 L�tree–1 with a standarderror of 5.4 and 7.6 L�tree–1, respectively (coefficient of var-iation ~37%). The two species were not consistent in their
Fig. 1. (a) Weekly average vapor pressure deficit (D) during daylight hours and weekly average sum of photosynthetic photon flux density(PPFD) and (b) available soil water (ASW) from 0.4 to 1.6 m depth, rainfall, and water table depth for longleaf pine (Pinus palustris) andslash pine (Pinus elliottii var. elliottii) sites.
Gonzalez-Benecke et al. 513
Published by NRC Research Press
Can
. J. F
or. R
es. D
ownl
oade
d fr
om w
ww
.nrc
rese
arch
pres
s.co
m b
y 12
8.22
7.5.
142
on 0
4/11
/11
For
pers
onal
use
onl
y.

daily course of transpiration over time (P = 0.0001 for thespecies by time interaction) (Fig. 3a). From 28 April to 30May (i.e., days 118 to 151), Eday of slash pine was signifi-cantly greater than Eday of longleaf pine (P < 0.05); this pe-riod corresponds to the time when Js of longleaf pine sitereached values below –1.0 MPa from 0.4 to 0.6 m soil depth(Fig. 3c). After a 45 mm rainfall on 6 June (day 156), Js atthe 0.4 to 0.6 m depth reached values close to –0.2 MPa andtranspiration increased for both species, and Eday for the twospecies was not different (P > 0.14) for the rest of the meas-urement period. Differences in Eday between species re-flected, on average, 50% higher water use by slash than bylongleaf pine (Fig. 3a). That difference can be explained, atleast in part, by the fact that slash pine had more LA than
longleaf pine for trees of the same sapwood area; Huber val-ues of longleaf pine were 60% greater than those of slashpine (P = 0.086) (Table 1).
When Eday was expressed per unit LA (El) (L�m2 LA–1),there was also a strong interaction between species and time(P < 0.001) (Fig. 3b). It is interesting to note that when thesoil was drying (during the 2 weeks before the 6 June rain-fall) and Js on 0.4–0.6 m depth declined far below –1.0 MPa (Fig. 3c), El for longleaf pine was lower than forslash pine (P < 0.001) (Fig. 3b), averaging values of 0.296and 0.366 L�m–2 for longleaf and slash pine, respectively.After rainfall, this trend changed, with El for longleaf pinebecoming higher than for slash pine (P < 0.001), with aver-age values of 0.501 and 0.414 L�m–2 for longleaf and slashpine, respectively. Under well-watered conditions, El oflongleaf pine was higher than for slash pine, but as the soildried in the longleaf pine zone, this trend was reversed, withEl of slash pine being higher than that of longleaf pine.
During the measurement period, average SWU (L�tree–1)was not different between species (P = 0.87), averaging 8.8and 9.6 L�tree–1, with a standard error of 1.2 and 1.6 L�tree–1
for longleaf and slash pine, respectively (Fig. 4a). There wasnot a species by time interaction (P = 0.99). SWU washighly correlated with tree size; daily average SWU had astrong linear relationship (P = 0.001, R2 = 0.84) with above-ground sapwood volume (Fig. 4b). SWU was not correlatedwith LA (P = 0.33; data not shown). After expressing SWUin m3, it is possible to extrapolate from the relationship be-tween SWU and sapwood volume that, on average, 1.7% ofthe sapwood volume is used for water storage. The percent-age of stored water used for daily transpiration averaged33.8% and 24.3%, for longleaf and slash pine, respectively,but the difference between species varied depending on time(P < 0.001 for the species by time interaction). During a drysoil period (e.g., days 139 to 151) (Fig. 3c), mean relativeSWU was 60.2% and 26.5% for longleaf and slash pine, re-spectively (P = 0.01). During wet soil periods (e.g., days153 to 168) (Fig. 3c), mean relative SWU decreased to21.7% and 16.9% for longleaf and slash pine, respectively(P = 0.63). Within species, relative SWU was statisticallydifferent for longleaf pine (P < 0.001) but not for slash pine(P = 0.245) across soil moisture periods. These two subsetsof time were selected based on soil moisture differences be-tween them (P < 0.001) but similar among-species micro-sites (P = 0.12). Across species, qv and Js for ‘‘dry’’ and‘‘wet’’ periods at 0.5 m soil depth reached values of 8.6%and 16.9% and –1.39 and –0.1 MPa, respectively; dailyaverage D and total daily PPFD were similar between se-lected periods (P = 0.266 and P = 0.112, respectively).
Nocturnal transpiration (Enight) was not different betweenspecies (P = 0.87), averaging 2.43 and 2.62 L�tree–1 forlongleaf and slash pine, respectively (Fig. 5a). There wasno interaction between species and time (P = 0.99) andEnight accounted, on average, for 8.7% and 6.1% of Eday forlongleaf and slash pine, respectively. Changes in Enight werepositively correlated with changes in average nocturnal D(Dn) (P < 0.001, R2 = 0.23) (Fig. 5b) and a common rela-tionship for both species was fitted to an exponential func-tion due to no differences between taxa (P > 0.15 for bothcurve parameters; Enight ¼ 3:51� ð1� e�3:18�DnÞ). Noctur-nal transpiration was also positively correlated with increas-
Fig. 2. Example of diurnal courses of (a) photosynthetic photonflux density (PPFD) and vapor pressure deficit (D) and sap fluxdensity (JS) measured at 1.8 m height (Js-b) and at the crown base(Js-c) of (b) the biggest longleaf pine (Pinus palustris) (418 mmDBH) and (c) the smallest slash pine (Pinus elliottii var. elliottii)(204 mm DBH) during the leaf water potential measurement day(17 April 2007).
514 Can. J. For. Res. Vol. 41, 2011
Published by NRC Research Press
Can
. J. F
or. R
es. D
ownl
oade
d fr
om w
ww
.nrc
rese
arch
pres
s.co
m b
y 12
8.22
7.5.
142
on 0
4/11
/11
For
pers
onal
use
onl
y.

ing soil moisture (P < 0.001, R2 = 0.27). A single relation-ship for both species was fit to a Weibull function,Enight ¼ 8:22� 5:89� e�5:06 � ð1� e�5:06�q1:034
v Þ, becausethere were no differences between taxa (P > 0.18 for curvefit parameters). For both species, average Enight was 2.34L�tree–1 when qv < 0.12 m3�m–3 and 3.62 L�tree–1 when qv >0.14 m3�m–3 (data not shown).
Whole-tree hydraulic conductanceThere were no differences in average KS-wt, KL-wt, Jmidday,
and DJ between species (P > 0.11) (Table 1). AverageKS-wt, KL-wt, Jmidday, and DJ for longleaf and slash pinewere 3.37 and 4.20 mol�m–2�s–1�MPa–1, 1.45 and1.13 mmol�m–2�s–1�MPa–1, –1.83 and –1.67 MPa, and 0.94
and 0.87 MPa, respectively. Average Js-est (that was calcu-lated as the intercept of the relationship between Jl and Js)was different between species (P = 0.047), averaging valuesof –0.89 and –0.79 MPa for longleaf and slash pine, respec-tively. On the day of Jl measurements, qv at 0.4–0.6 mdepth was 0.096 and 0.105 m3�m–3 at longleaf and slashpine zones, corresponding to Js of –0.96 and –0.76 MPa, re-spectively. These values were not statistically different fromJs-est for each species (P > 0.36) and support the robustnessof our measurements.
Crown conductanceAverage GCday ranged between 11.4 and 58.8 and between
12.8 and 42.5 mmol�m–2�s–1 for longleaf and slash pine, re-
Fig. 3. (a) Transpiration per tree, (b) transpiration per unit leaf area, and (c) soil matric potential at 0.4–0.6 and 1.4–1.6 m depth, rainfall,and water table depth for longleaf pine (Pinus palustris) (LL) and slash pine (Pinus elliottii var. elliottii) (SL). Symbols are means amongfour tree replicates. Error bars represent SE (n = 4).
Gonzalez-Benecke et al. 515
Published by NRC Research Press
Can
. J. F
or. R
es. D
ownl
oade
d fr
om w
ww
.nrc
rese
arch
pres
s.co
m b
y 12
8.22
7.5.
142
on 0
4/11
/11
For
pers
onal
use
onl
y.

spectively. Depending on the time, there was a species ef-fect on GCday (P < 0.001 for interaction between speciesand time). During the dry period, GCday was not differentfor longleaf and slash pine, but during periods of high soilmoisture (after rain), longleaf pine had larger GCday valuesthan slash pine (P < 0.05). Diurnal and nocturnal Gcrown re-sponse to vapor pressure deficit was similar between species(Table 1; Fig. 6a). Under saturating light and nonlimitingsoil moisture conditions, average Gcrown sensitivity to D
(–dGcrown/d ln D) and average maximum Gcrown at D =1 kPa (GCref) were not different between species (P = 0.12and 0.22, respectively). Nocturnal maximum GCref was26.5% and 29.4% of daytime maximum GCref for longleafand slash pine, respectively (Table 1).
The response of Gcrown to increasing D was influenced bychanges in soil moisture. Under low soil moisture conditions(qv < 0.11 m3�m–3), GCref was highly reduced on both spe-cies. GCref averaged values 36.9% and 29.1% lower than
Table 1. Least-square means of measured traits for longleaf pine (Pinus palustris) and slash pine (Pinus elliottiivar. elliottii).
Species
Trait Units Longleaf pine Slash pine P > F speciesSAbase m2 0.0401 0.0522 0.438SAcrown m2 0.0202 0.0269 0.474LA m2 61.22 104.84 0.127HVbase m2�m–2 � 10–4 8.25 5.15 0.086HVcrown m2�m–2 � 10–4 3.86 2.69 0.192GCref mmol�m–2�s–1 84.88 63.45 0.224–dGcrown/d ln D mmol�m–2�s–1�ln kPa–1 49.76 32.88 0.121GCref (night) mmol�m–2�s–1 22.55 18.67 0.440–dGcrown/d ln D (night) mmol�m–2�s–1�ln kPa–1 13.48 9.140 0.221Jmidday MPa –1.831 –1.668 0.111Jpred MPa –0.86 –0.72 0.004Js-est MPa –0.89 –0.79 0.047DJ MPa 0.943 0.871 0.391KL-wt mmol�m–2�s–1�MPa–1 1.46 1.14 0.517KS-wt mol�m–2�s–1�MPa–1 3.61 4.35 0.254
Note: SAbase, sapwood area at 1.8 m height; SAcrown, sapwood area at crown base; LA, projected leaf area; HVbase, Hubervalue at 1.8 m height; HVcrown, Huber value at crown base; GCref, reference crown conductance at D = 1 kPa under no-limitingradiation and soil moisture conditions; –dGcrown/d ln D, crown conductance sensitivity to changes in D under no-limiting radia-tion and soil moisture conditions (–dGcrown/d ln D); GCref (night), crown conductance during night at D = 1 kPa under no-limit-ing soil moisture conditions; –dGcrown/d ln D (night), crown conductance sensitivity to changes in D during night under no-limiting soil moisture conditions; Jmidday, midday leaf water potential; Jpred, predawn water potential; Js-est, estimated soil ma-tric potential at Jl measurement day; DJ, maximum daily water potential gradient; KL-wt, whole-tree leaf area specific hy-draulic conductance; KS-wt, whole-tree sapwood-specific hydraulic conductance for longleaf and slash pine. P values from amixed-model procedure (n = 4).
Fig. 4. (a) Daily water storage use (SWU) and (b) the relationship between sapwood volume and mean water storage use during the mea-surement period including linear fit (SWU = 2.327 + 10.241 � sapwood volume) for longleaf pine (Pinus palustris) and slash pine (Pinuselliottii var. elliottii). Symbols are means among four tree replicates. Error bars represent SE (n = 4).
516 Can. J. For. Res. Vol. 41, 2011
Published by NRC Research Press
Can
. J. F
or. R
es. D
ownl
oade
d fr
om w
ww
.nrc
rese
arch
pres
s.co
m b
y 12
8.22
7.5.
142
on 0
4/11
/11
For
pers
onal
use
onl
y.

GCref for longleaf and slash pine, respectively (Table 1).There were no significant differences between species (P =0.83) and soil moisture conditions (P = 0.29) in the relation-ship between dGcrown/d ln D and GCref, following a stronglinear relationship (P < 0.001, R2 = 0.98) (Fig. 6b). Afterpooling daytime data, the slope of that relationship was0.626 and was no different (P 0.33) from the slope fornighttime, which was 0.647.
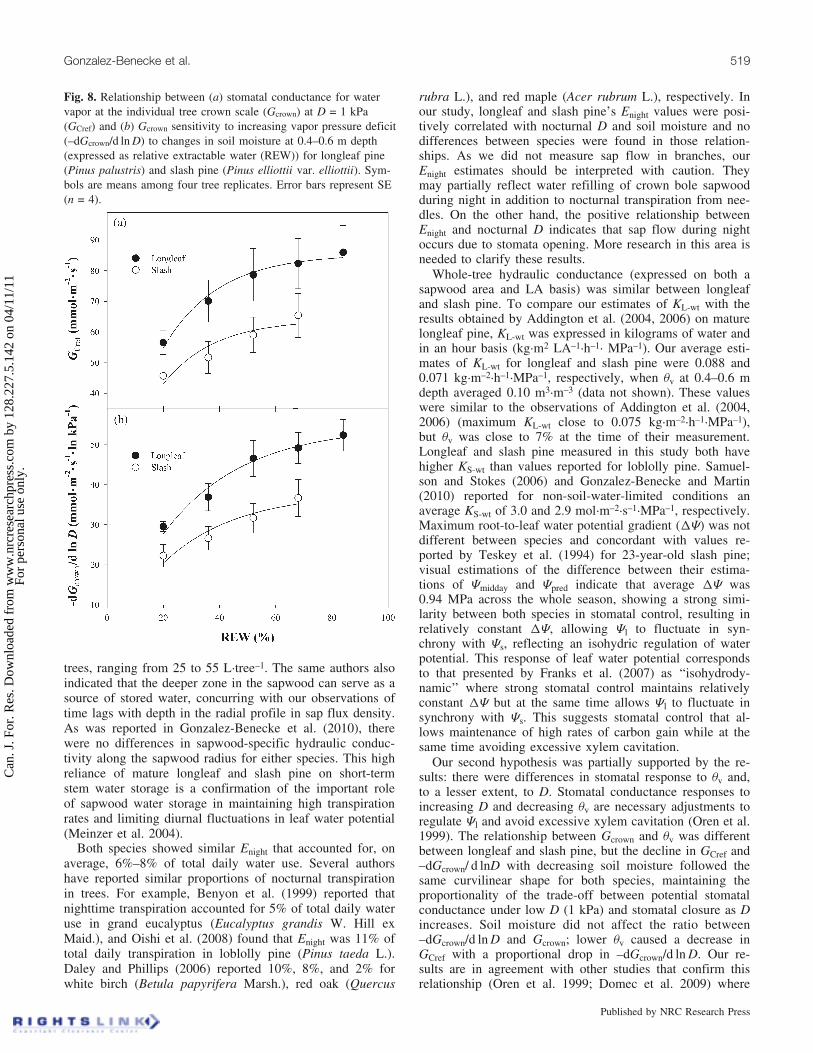
The relationship between Gcrown and qv at 0.4–0.6 m depthwas different between longleaf and slash pine (Fig. 7). Anexponential saturation curve was fit separately for each spe-cies (P < 0.05 for curve parameters; longleaf: GCday =42.424 � e�0:0591�qv ; slash: GCday = 30.466 � e�0:0744�qv).Under well-watered conditions (e.g., REW > 40%), GCday oflongleaf pine was larger than that of slash pine (P < 0.001),averaging 35.8 and 25.5 mmol�m–2�s–1, respectively; on theother hand, when REW was lower than 30% (thresholdvalue corresponding to qv = 0.11 m3�m–3, approximately),there was no difference between species in average GCday(P = 0.45), averaging 25.8 and 23.6 mmol�m–2�s–1 for long-leaf and slash pine, respectively. Lower minimum values ofqv at 0.4–0.6 m depth were observed in longleaf pine com-pared with slash pine; this can be related to lower extractionrate at that depth on slash pine due to higher water availabil-ity at deeper profiles in slash pine due to the proximity ofthe water table (Fig. 3c). The effect of soil moisture onGcrown was similar for GCref and –dGcrown/d ln D. DecreasingREW reduced proportionally both Gcrown at D = 1 kPa andthe sensitivity of Gcrown to increasing D (Fig. 8).
DiscussionLongleaf and slash pine co-occur on many sites through-
out their ranges and demonstrate noticeable habitat pattern-ing where they grow together, with longleaf pine occupyingthe higher and better-drained microsites and slash pine pre-dominantly found on more poorly drained microsites such asdepressions and pond margins. These apparent micrositepreferences are also reflected in the species’ broader toleran-ces for site water availability: longleaf pine tolerates verydry, excessively well-drained sandhill soils, while slash pineis generally found on relatively poorly drained sites where
the water table can remain close to the surface for most ofthe year (Ewel 1990; Peet 2006). These patterns in micrositepreference suggested that differences in water relations traitsbetween the species might be associated with the relativedominance of the two species across the landscape. Ourmeasurements were carried out in the natural habitat/micro-site mosaic of the stand. Differences between the two spe-cies may reflect genetic differences and also may beexplained by differences in water availability due to watertable depth; therefore, the species and site effects can beconfounded. We predicted that slash pine trees would havehydraulic architecture adjustments that favor higher hy-draulic conductance and higher water use than longleaf pinetrees. Instead, we found notable similarities between bothspecies in water storage use, nocturnal transpiration rate,and whole-tree hydraulic conductance.
Species differences in daily water use were principally de-termined by differences in LA, but the greater plasticity oflongleaf pine stomatal regulation partially compensated forLA differences. The differences in crown conductance ad-justments to decreasing soil moisture enabled longleaf pineto function similarly to slash pine. On the other hand, thetendency of slash pine to occupy wetter zones, close to oron the fringe of small ponds, may also be related to the de-velopment of aerenchyma tissues (Fisher and Stone 1990),which enables taproot and sinkers to be submerged forweeks or even months, and perhaps to differences in rootvulnerability to cavitation rather than stomatal regulationdifferences between species.
Our first hypothesis was not sustained by the results. Re-markable similarities were found between longleaf and slashpine in use of stored water, nocturnal transpiration, andwhole-tree hydraulic conductance. Daily transpiration ofslash pine was higher than that of longleaf pine only ondays with decreasing soil moisture. This last result is relatedto the fact that slash pine has a larger LA and a lower sto-matal sensitivity to reducing qv.
Daily tree transpiration rates were comparable in similar-sized longleaf and slash pine evaluated in other studies.Vose et al. (2003) reported mean sap flow between 30 and80 L�tree–1for longleaf and slash pine trees ranging from
Fig. 5. (a) Nocturnal transpiration per tree and (b) the relationship between average nocturnal vapor pressure deficit (Dn) and nocturnaltranspiration during the measurement period including the exponential saturation curve fitted (Enight ¼ 3:51� ð1� e�3:18�DnÞ) for longleafpine (Pinus palustris) and slash pine (Pinus elliottii var. elliottii). Symbols are means among four tree replicates. Error bars represent SE(n = 4).
Gonzalez-Benecke et al. 517
Published by NRC Research Press
Can
. J. F
or. R
es. D
ownl
oade
d fr
om w
ww
.nrc
rese
arch
pres
s.co
m b
y 12
8.22
7.5.
142
on 0
4/11
/11
For
pers
onal
use
onl
y.

350 to 450 mm diameter at breast height (DBH). In a 14-year-old slash pine plantation, Martin (2000) determinedaverage and maximum winter daily transpiration rate of28.3 and 71.6 L�tree–1, respectively, for 240 mm averageDBH trees. On a natural regenerated longleaf pine savanna,Ford et al. (2004) reported average daily water use from36.8 to 218.3 L�tree–1 for trees ranging between 190 and1180 mm DBH for longleaf pine and 99.3 L�tree–1 for a sin-gle slash pine tree of 700 mm DBH.
Our estimates of SWU are based on the lag between bolesap flow at the crown base and bole sap flow at 1.8 mheight; this rationale is in agreement with Cermak et al.(2007), who concluded that the xylem sapwood below the
most active portion of the crown is the most importantsource of free stored water, accounting for 91.1% of the to-tal free water volume. Cermak et al. (2007) carried out thatstudy in old-growth Douglas-fir (Pseudotsuga menziesii(Mirb.) Franco) with a large living crown of 31 m. In con-trast, the pine trees in our study had crown lengths that aver-aged 7.1 and 11.1 m for longleaf and slash pine,respectively. Stem volume without bark above the Scrownprobes averaged only 10.4% and 11.7% of the total stemvolume for longleaf and slash pine, respectively; therefore,it is highly unlikely that the sapwood above the Scrownprobes had a significant impact on total daily SWU com-pared with the sapwood volume below the live crown. Theuse of water stored in stem averaged across time and species1.7% of sapwood volume, so the larger the tree, the largerthe SWU.
SWU was not different between species and accounted for24%–34% of total daily water use. The larger LA of slashpine does not affect daily bole water recharge cycles. Ourresults demonstrated that SWU depended on bole size ratherthan on LA of the tree. Meinzer et al. (2004, 2006), workingwith different species of angiosperms and gymnosperms,concluded that storage characteristics were species inde-pendent and linearly related to tree size. In our study, aver-age SWU was 8.84 and 9.62 L�tree–1 for longleaf and slashpine, respectively. Phillips et al. (2003) reported mean SWUof 6.5 and 16.7 L�tree–1 for 25 and 36 m tall Garry oak(Quercus garryana Dougl.) and ponderosa pine (Pinus pon-derosa P. & C. Lawson), respectively, averaging up to 20%of daily sap flow. In angiosperm tropical tress, Goldstein etal. (1998) reported average daily SWU between 4.0 and 8.7L�tree–1 for trees between 160 and 270 mm DBH, pointingout a common relationship between sapwood area or treeheight and diurnal storage capacity independent of taxa.Cermak et al. (2007) also found that about 20% of daily sapflow came from stored water in old-growth Douglas-fir
Fig. 6. Example of the relationship between vapor pressure deficit(D) and stomatal conductance for water vapor at the individual treecrown scale (Gcrown) for (a) nocturnal and diurnal periods and (b)the relationship between the reference Gcrown at D = 1 kPa (GCref)and Gcrown sensitivity to increasing vapor pressure deficit (–dGcrown/d ln D) for nighttime and daytime and different conditions of soilmoisture (REW, relative extractable soil water). In Fig. 6a, the datacorrespond to a slash pine (Pinus elliottii var. elliottii) tree of493 mm DBH and 29.4 m height. The upper lines represent bound-ary line analysis fitting for nighttime and daytime Gcrown and thevertical dashed line at D = 1 kPa intersects the boundary line atGCref, which was 24.4 and 85.3 mmol�m–2�s–1 for nighttime anddaytime, respectively.
Fig. 7. Average daily crown conductance (GCday) and volumetricsoil water content (qv) at 0.4–0.6 m depth for longleaf pine (Pinuspalustris) and slash pine (Pinus elliottii var. elliottii) including ex-ponential saturation curves fitted for both species (longleaf pine:GCday = 42.424 � e�0:0591�qv ; slash pine: GCday = 30.466 �e�0:0744�qv . Symbols are means among four tree replicates. Errorbars represent SE (n = 4).
518 Can. J. For. Res. Vol. 41, 2011
Published by NRC Research Press
Can
. J. F
or. R
es. D
ownl
oade
d fr
om w
ww
.nrc
rese
arch
pres
s.co
m b
y 12
8.22
7.5.
142
on 0
4/11
/11
For
pers
onal
use
onl
y.
trees, ranging from 25 to 55 L�tree–1. The same authors alsoindicated that the deeper zone in the sapwood can serve as asource of stored water, concurring with our observations oftime lags with depth in the radial profile in sap flux density.As was reported in Gonzalez-Benecke et al. (2010), therewere no differences in sapwood-specific hydraulic conduc-tivity along the sapwood radius for either species. This highreliance of mature longleaf and slash pine on short-termstem water storage is a confirmation of the important roleof sapwood water storage in maintaining high transpirationrates and limiting diurnal fluctuations in leaf water potential(Meinzer et al. 2004).
Both species showed similar Enight that accounted for, onaverage, 6%–8% of total daily water use. Several authorshave reported similar proportions of nocturnal transpirationin trees. For example, Benyon et al. (1999) reported thatnighttime transpiration accounted for 5% of total daily wateruse in grand eucalyptus (Eucalyptus grandis W. Hill exMaid.), and Oishi et al. (2008) found that Enight was 11% oftotal daily transpiration in loblolly pine (Pinus taeda L.).Daley and Phillips (2006) reported 10%, 8%, and 2% forwhite birch (Betula papyrifera Marsh.), red oak (Quercus
rubra L.), and red maple (Acer rubrum L.), respectively. Inour study, longleaf and slash pine’s Enight values were posi-tively correlated with nocturnal D and soil moisture and nodifferences between species were found in those relation-ships. As we did not measure sap flow in branches, ourEnight estimates should be interpreted with caution. Theymay partially reflect water refilling of crown bole sapwoodduring night in addition to nocturnal transpiration from nee-dles. On the other hand, the positive relationship betweenEnight and nocturnal D indicates that sap flow during nightoccurs due to stomata opening. More research in this area isneeded to clarify these results.
Whole-tree hydraulic conductance (expressed on both asapwood area and LA basis) was similar between longleafand slash pine. To compare our estimates of KL-wt with theresults obtained by Addington et al. (2004, 2006) on maturelongleaf pine, KL-wt was expressed in kilograms of water andin an hour basis (kg�m2 LA–1�h–1� MPa–1). Our average esti-mates of KL-wt for longleaf and slash pine were 0.088 and0.071 kg�m–2�h–1�MPa–1, respectively, when qv at 0.4–0.6 mdepth averaged 0.10 m3�m–3 (data not shown). These valueswere similar to the observations of Addington et al. (2004,2006) (maximum KL-wt close to 0.075 kg�m–2�h–1�MPa–1),but qv was close to 7% at the time of their measurement.Longleaf and slash pine measured in this study both havehigher KS-wt than values reported for loblolly pine. Samuel-son and Stokes (2006) and Gonzalez-Benecke and Martin(2010) reported for non-soil-water-limited conditions anaverage KS-wt of 3.0 and 2.9 mol�m–2�s–1�MPa–1, respectively.Maximum root-to-leaf water potential gradient (DJ) was notdifferent between species and concordant with values re-ported by Teskey et al. (1994) for 23-year-old slash pine;visual estimations of the difference between their estima-tions of Jmidday and Jpred indicate that average DJ was0.94 MPa across the whole season, showing a strong simi-larity between both species in stomatal control, resulting inrelatively constant DJ, allowing Jl to fluctuate in syn-chrony with Js, reflecting an isohydric regulation of waterpotential. This response of leaf water potential correspondsto that presented by Franks et al. (2007) as ‘‘isohydrody-namic’’ where strong stomatal control maintains relativelyconstant DJ but at the same time allows Jl to fluctuate insynchrony with Js. This suggests stomatal control that al-lows maintenance of high rates of carbon gain while at thesame time avoiding excessive xylem cavitation.
Our second hypothesis was partially supported by the re-sults: there were differences in stomatal response to qv and,to a lesser extent, to D. Stomatal conductance responses toincreasing D and decreasing qv are necessary adjustments toregulate Jl and avoid excessive xylem cavitation (Oren et al.1999). The relationship between Gcrown and qv was differentbetween longleaf and slash pine, but the decline in GCref and–dGcrown/ d lnD with decreasing soil moisture followed thesame curvilinear shape for both species, maintaining theproportionality of the trade-off between potential stomatalconductance under low D (1 kPa) and stomatal closure as Dincreases. Soil moisture did not affect the ratio between–dGcrown/d ln D and Gcrown; lower qv caused a decrease inGCref with a proportional drop in –dGcrown/d ln D. Our re-sults are in agreement with other studies that confirm thisrelationship (Oren et al. 1999; Domec et al. 2009) where
Fig. 8. Relationship between (a) stomatal conductance for watervapor at the individual tree crown scale (Gcrown) at D = 1 kPa(GCref) and (b) Gcrown sensitivity to increasing vapor pressure deficit(–dGcrown/d ln D) to changes in soil moisture at 0.4–0.6 m depth(expressed as relative extractable water (REW)) for longleaf pine(Pinus palustris) and slash pine (Pinus elliottii var. elliottii). Sym-bols are means among four tree replicates. Error bars represent SE(n = 4).
Gonzalez-Benecke et al. 519
Published by NRC Research Press
Can
. J. F
or. R
es. D
ownl
oade
d fr
om w
ww
.nrc
rese
arch
pres
s.co
m b
y 12
8.22
7.5.
142
on 0
4/11
/11
For
pers
onal
use
onl
y.

Gcrown sensitivity to D was attributable to the variation inGCref. Domec et al. (2009) reported, for loblolly pine, asteep decline in GCref and –dGcrown/d ln D up to 30% oftheir maximum value when REW declined from 80% to10%; in our study, when REW declined up to 21% and26% (average REW at GCref (‘‘dry’’) for longleaf and slashpine sites, respectively), GCref declined up to 37% and 29%of maximum GCref. We found that the sensitivity of GCrefto increasing D was not increased at night, as Daley andPhillips (2006) reported for white birch. The slope of therelationship between GCref and –dGcrown/d ln D, which wasnot different between species and daylight and soil mois-ture conditions, was concordant with the theoretical slopeof 0.6 proposed by Oren et al. (1999). This relationshipimplies that trees with overall high stomatal (crown) con-ductance will tend to be more sensitive to D, showinghigher stomatal closure as D increases.
Under well-watered conditions, El of longleaf pine washigher than that of slash pine, but as the soil dried, this trendwas reversed. This response can be related to species differ-ences in Gcrown sensitivity to qv and D. Our results agreewith those of Addington et al. (2006) who concluded thathydraulic adjustment of longleaf pine enables it to maintainlarge hydraulic conductance when soil moisture conditionsare adequate in xeric sites. The differences in water relation-ship traits per unit LA are largely compensated for by thelarger LA per unit sapwood area of slash pine. Our resultssuggest that whole-plant hydraulic adjustments are well co-ordinated with one another and with the environment.
ConclusionWe found remarkable similarities between longleaf and
slash pine in use of stored water, nocturnal transpiration,and whole-tree hydraulic conductance but differences inother important traits including leaf to sapwood area ratio,stomatal response to qv, and, to a lesser extent, stomatal re-sponse to D. Differences in leaf to sapwood area ratio,where slash pine produces much more LA per unit basalsapwood than longleaf, are partially compensated for by thelarge plasticity of Gcrown response to qv and to some extentto D in longleaf pine. More research is needed to betterunderstand microsite preferences of each species, such as re-lationships between hydraulic architecture and tracheid anat-omy traits, and more integrated traits such as crownconductance and whole-tree hydraulic conductance of eachspecies.
AcknowledgementsThe authors thank Mr. Fabian Hergenreder, Mr. Cristobal
Gonzalez, and Mr. Andres Susaeta for their help in fieldsampling. Funding was provided by National Science Foun-dation award No. 0344029 and the Forest Biology ResearchCooperative at the University of Florida.
ReferencesAbrahamson, W.G., and Hartnett, D.C. 1990. Pine flatwoods and
dry prairies. In Ecosystems of Florida. Edited by R.L. Myersand J.J. Ewel. University of Central Florida Press, Orlando, Fla.pp. 103–149.
Addington, R.N., Mitchell, R.J., Oren, R., and Donovan, L.A. 2004.Stomatal sensitivity to vapor pressure deficit and its relationship
to hydraulic conductance in Pinus palustris. Tree Physiol. 24:561–569.
Addington, R.N., Donovan, L.A., Mitchell, R.J., Vose, J.M., Pecot,S.D., Jack, S.B., Hacke, U.G., Sperry, J.S., and Oren, R. 2006.Adjustments in hydraulic architecture of Pinus palustris main-tain similar stomatal conductance in xeric and mesic habitats.Plant Cell Environ. 29(4): 535–545. doi:10.1111/j.1365-3040.2005.01430.x.
Alavalapati, J.R.R., Stainback, G.A., and Carter, D.R. 2002. Re-storation of the longleaf pine ecosystem on private lands in theUS South: an ecological economic analysis. Ecol. Econ. 40(3):411–419. doi:10.1016/S0921-8009(02)00012-5.
Baraloto, C., Morneau, F., Bonal, D., Blanc, L., and Ferry, B.2007. Seasonal water stress tolerance and habitat associationswithin four neotropical tree genera. Ecology, 88(2): 478–489.doi:10.1890/0012-9658(2007)88[478:SWSTAH]2.0.CO;2.
Benyon, R.G., Marcar, N.E., Crawford, D.F., and Nicholson, A.T.1999. Growth and water use of Eucalyptus camaldulensis andE. occidentalis on a saline discharge sitenear Wellington, NSW,Australia. Agric. Water Manag. 39(2–3): 229–244. doi:10.1016/S0378-3774(98)00080-8.
Braun, P., and Schmid, J. 1999. Sap flow measurements in grape-vines (Vitisvinifera L.) 2. Granier measurements. Plant Soil,215(1): 47–55. doi:10.1023/A:1004708119821.
Cavender-Bares, J., Kitajima, K., and Bazzaz, F.A. 2004. Multipletrait associations in relation to habitat differentiation among 17Floridian oak species. Ecol. Monogr. 74(4): 635–662. doi:10.1890/03-4007.
Cermak, J., Kucera, J., Bauerle, W.L., Phillips, N., and Hinckley,T.M. 2007. Tree water storage and its diurnal dynamics relatedto sap flow and changes of stem volume in old-growth Douglas-fir trees. Tree Physiol. 27: 181–198.
Clearwater, M.J., Meinzer, F.C., Andrade, J.L., Goldstein, G., andHolbrook, N.M. 1999. Potential errors in measurement of nonuniform sap flow using heat dissipation probes. Tree Physiol.19: 681–687.
Cohen, S., Braham, R., and Sanchez, F. 2004. Seed bank viabilityin disturbed longleaf pine sites. Restor. Ecol. 12(4): 503–515.doi:10.1111/j.1061-2971.2004.00382.x.
Cruiziat, P., Cochard, H., and Ameglio, T. 2002. Hydraulic archi-tecture of trees: main concepts and results. Ann. For. Sci. 59(7):723–752. doi:10.1051/forest:2002060.
Daley, M.J., and Phillips, N.G. 2006. Interspecific variation innighttime transpiration and stomatal conductance in a mixedNew England deciduous forest. Tree Physiol. 26: 411–419.
Domec, M.J., Noormets, A., King, J.S., Sun, G., McNulty, S.G.,Gavazzi, M.J., Boggs, J.L., and Treasure, E.A. 2009. Decouplingthe influence of leaf and root hydraulic conductances on stoma-tal conductance and its sensitivity to vapour pressure deficit assoil dries in a drained loblolly pine plantation. Plant Cell En-viron. 32(8): 980–991. doi:10.1111/j.1365-3040.2009.01981.x.
Ewel, J.J. 1990. Introduction. In Ecosystems of Florida. Edited byR.L. Myers and J.J. Ewel. University of Central Florida Press,Orlando, Fla. pp. 3–10.
Ewers, B.E., and Oren, R. 2000. Analysis of assumptions and er-rors in the calculation of stomatal conductance from sap fluxmeasurements. Tree Physiol. 20: 579–589.
Ewers, B.E., Oren, R., Johnsen, K.H., and Landsberg, J.J. 2001. Es-timating maximum mean canopy stomatal conductance for usein models. Can. J. For. Res. 31(2): 198–207. doi:10.1139/cjfr-31-2-198.
Fisher, H.M., and Stone, E.L. 1990. Air-conducting porosity inslash pine roots from saturated soils. For. Sci. 36: 18–33.
Ford, C.R., and Brooks, J.R. 2003. Hydrological and climatic re-
520 Can. J. For. Res. Vol. 41, 2011
Published by NRC Research Press
Can
. J. F
or. R
es. D
ownl
oade
d fr
om w
ww
.nrc
rese
arch
pres
s.co
m b
y 12
8.22
7.5.
142
on 0
4/11
/11
For
pers
onal
use
onl
y.
sponses of Pinus elliottii var. densa in mesic pine flatwoodsFlorida, USA. Ann. For. Sci. 60(5): 385–392. doi:10.1051/forest:2003030.
Ford, C.R., McGuire, M.A., Mitchell,R.J., and Teskey, R.O. 2004.Assessing variation in the radial profile of sap flux density inPinus species and its effect on daily water use. Tree Physiol.24: 241–249.
Franks, P.J., Drake, P.L., and Froend, R.H. 2007. Anisohydric butisohydrodynamic: seasonally constant plant water potential gra-dient explained by a stomatal control mechanism incorporatingvariable plant hydraulic conductance. Plant Cell Environ. 30(1):19–30. doi:10.1111/j.1365-3040.2006.01600.x.
Gaston, L., Nkedi-Kizza, P., Rao, P.S.C., and Sawka, G. 1990. Spa-tial variability of morphological properties at a Florida flat-woods site. Soil Sci. Soc. Am. J. 54(2): 527–533. doi:10.2136/sssaj1990.03615995005400020040x.
Gee, G.W., and Bauder, J.W. 1986. Particle-size analysis. In Meth-ods of soil analysis. Part 1. 2nd ed. Edited by A. Klute et al.Agron. Mongr. 9. American Society of Agronomy and SoilScience Society of America, Madison, Wis. pp. 383–411.
Glitzenstein, J.S., Platt, W.J., and Streng, D.R. 1995. Effects of fireregime and habitat on tree dynamics in north Florida longleafpine savannas. Ecol. Monogr. 65(4): 441–476. doi:10.2307/2963498.
Goldstein, G., Andrade, J.L., Meinzer, F.C., Holbrook, N.M., Cave-lier, J., Jackson, P.A., and Celis, A. 1998. Stem water storageand diurnal patterns of water use in tropical forest canopy trees.Plant Cell Environ. 21(4): 397–406. doi:10.1046/j.1365-3040.1998.00273.x.
Gonzalez-Benecke, C.A., and Martin, T.A. 2010. Water availabilityand genetic effects on water relations of loblolly pine (Pinustaeda) stands. Tree Physiol. 30(3): 376–392. doi:10.1093/treephys/tpp118.
Gonzalez-Benecke, C.A., Martin, T.A., and Peter, G.F. 2010. Hy-draulic architecture and tracheid allometry in mature Pinus pa-lustris and Pinus elliottii trees. Tree Physiol. 30(3): 361–375.doi:10.1093/treephys/tpp129.
Granier, A. 1985. Une nouvelle methode pour la mesure du flux desevebrute dans le tronc des arbres. Ann. For. Sci. 42(2): 193–200. doi:10.1051/forest:19850204.
Granier, A., and Loustau, D. 1994. Measuring and modeling thetranspiration of a maritime pine canopy from sap-flow data. Ag-ric. For. Meteorol. 71(1–2): 61–81. doi:10.1016/0168-1923(94)90100-7.
Granier, A., Biron, P., Breda, N., Pontailler, J.Y., and Saugier, B.1996. Transpiration of trees and forest stands: short and long-term monitoring using sapflow methods. Glob. Change Biol.2(3): 265–274. doi:10.1111/j.1365-2486.1996.tb00078.x.
Hatton, T.J., Moore, S.J., and Reece, P.H. 1995. Estimating standtranspiration in a Eucalyptus populnea woodland with the heatpulse method: measurement errors and sampling strategies. TreePhysiol. 15: 219–227.
James, S.A., Clearwater, M.J., Meinzer, F.C., and Goldstein, G.2002. Heat dissipation sensors of variable length for the mea-surement of sap flow in trees with deep sapwood. Tree Physiol.22: 277–283.
Johnson, R., and Gjerstad, D. 2006. Restoring the overstory oflongleaf pine ecosystems. In The longleaf pine ecosystem: ecol-ogy, silviculture, and restoration. Edited by S. Jose, E.J. Jokela,and D.L. Miller. Springer, New York. pp. 271–295.
Littell, R., Milliken, G., Stroup, W., Wolfinger, R., and Schaben-berger, O. 2006. SAS system for mixed models. SAS InstituteInc., Cary, N.C. pp. 814.
Lu, P., Muller, W.J., and Chacko, E.K. 2000. Spatial variations in
xylem sap flux density in the trunk of orchard-grown, maturemango trees under changing soil water conditions. Tree Physiol.20: 683–692.
Martin, T.A. 2000. Winter season tree sap flow and stand transpira-tion in an intensively-managed loblolly and slash pine planta-tion. J. Sustain. For. 10: 155–163.
Martin, T.A., Brown, K.J., Cermak, J., Ceulemans, R., Kucera, J.,Meinzer, F.C., Rombold, J.S., Sprugel, D.G., and Hinckley,T.M. 1997. Crown conductance and tree and stand transpirationin a second-growth Abies amabilis forest. Can. J. For. Res.27(6): 797–808. doi:10.1139/cjfr-27-6-797.
McNab, W.H., and Avers, P.E. 1994. Ecological subregions of theUnited States: section descriptions. Administrative PublicationWO-WSA-5. U.S. Department of Agriculture, Forest Service,Washington, D.C.
Meinzer, F.C., James, S.A., and Goldstein, G. 2004. Dynamics oftranspiration, sap flow and use of stored water in tropical forestcanopy trees. Tree Physiol. 24: 901–909.
Meinzer, F.C., Brooks, J.R., Domec, J.C., Gartner, B.L., Warren,J.L., Woodruff, D., Bible, K., and Shaw, D.C. 2006. Dynamicsof water transport and storage in conifers studied with deuteriumand heat tracing techniques. Plant Cell Environ. 29(1): 105–114.doi:10.1111/j.1365-3040.2005.01404.x.
Niinemets, U., Ellsworth, D.S., Lukjanova, A., and Tobias, M.2001. Site fertility and the morphological and photosynthetic ac-climation of Pinus sylvestris needles to light. Tree Physiol. 21:1231–1244.
Oishi, A.C., Oren, R., and Stoy, P.C. 2008. Estimating componentsof forest evapotranspiration: a footprint approach for scaling sapflux measurements. Agric. For. Meteorol. 148(11): 1719–1732.doi:10.1016/j.agrformet.2008.06.013.
Oren, R., Sperry, J.S., Katul, C.G., Pataki, D.E., Ewers, B.E., Phil-lips, N., and Schafer, K.V.R. 1999. Survey and synthesis of in-tra- and interspecific variation in stomatal sensitivity to vapourpressure deficit. Plant Cell Environ. 22(12): 1515–1526. doi:10.1046/j.1365-3040.1999.00513.x.
Peet, R.K. 2006. Ecological classification of longleaf pine wood-lands. In The longleaf pine ecosystem: ecology, silviculture,and restoration. Edited by S. Jose, E.J. Jokela, and D.L. Miller.Springer, New York. pp. 51–94.
Pessin, L.J. 1933. Forest associations in the uplands of the lowerGulf Coastal Plain (longleaf pine belt). Ecology, 14(1): 1–14.doi:10.2307/1932571.
Phillips, N.G., Ryan, M.G., Bond, B.J., McDowell, N.G., Hinckley,T.M., and Cermak, J. 2003. Reliance on stored water increaseswith tree size in three species in the Pacific Northwest. TreePhysiol. 23: 237–245.
Powell, T.L., Starr, G., Clark, K.L., Martin, T.A., and Gholz, H.L.2005. Ecosystem and understory water and energy exchange fora mature, naturally regenerated pine flatwoods forest in northFlorida. Can. J. For. Res. 35(7): 1568–1580. doi:10.1139/x05-075.
Powell, T.L., Gholz, H.L., Clark, K.L., Starr, G., Cropper, W.P.,Jr., and Martin, T.A. 2008. Carbon exchange of a mature natu-rally-regenerated pine forest in north Florida. Global ChangeBiol. 14: 2523–2538.
Ritchie, J.T. 1981. Soil water availability. Plant Soil, 58(1–3): 327–338. doi:10.1007/BF02180061.
Samuelson, L.J., and Stokes, T.A. 2006. Transpiration and canopystomatal conductance of 5-year-old loblolly pine in response tointensive management. For. Sci. 52: 313–323.
Schaap, M.G., Leij, F.J., and Van Genuchten, M.Th. 2001. RO-SETTA: a computer program for estimating soil hydraulic para-meters with hierarchical pedotransfer functions. J. Hydrol.
Gonzalez-Benecke et al. 521
Published by NRC Research Press
Can
. J. F
or. R
es. D
ownl
oade
d fr
om w
ww
.nrc
rese
arch
pres
s.co
m b
y 12
8.22
7.5.
142
on 0
4/11
/11
For
pers
onal
use
onl
y.
(Amst.), 251(3–4): 163–176. doi:10.1016/S0022-1694(01)00466-8.
Sperry, J.S., Adler, F.R., Campbell, G.S., and Comstock, J.C. 1998.Limitation of plant water use by rhizosphere and xylem conduc-tance: results from a model. Plant Cell Environ. 21(4): 347–359.doi:10.1046/j.1365-3040.1998.00287.x.
Teskey, R.O., Gholz, H.L., and Cropper, W.P., Jr. 1994. Influenceof climate and nutrient availability on net photosynthesis of ma-ture slash pine. Tree Physiol. 14: 1215–1227.
Van De Gevel, S.L., Hart, J.L., Grissino-Mayer, H.D., and Robin-son, K.W. 2009. Tree-ring dating of old-growth longleaf pine(Pinus palustris Mill.) logs from an exposed timber crib dam,Hope Mills, North Carolina, U.S.A. Tree-Ring Res. 65(1): 69–80. doi:10.3959/2007-14.1.
Vose, J.M., Harvey, G.J., Elliott, K.J., and Clinton, B.D. 2003.Measuring and modeling tree and stand level transpiration. InPhytoremediation: transformation and control of contaminants.Edited by S.C. McCutcheon and J.L. Schnoor. Wiley, NewYork. pp. 263–282.
Wullschleger, S.D., Meinzer, F.C., and Vertessy, R.A. 1998. A re-view of whole-plant water use studies in trees. Tree Physiol. 18:499–512.
Appendix ATable A1 appears on the following page.
522 Can. J. For. Res. Vol. 41, 2011
Published by NRC Research Press
Can
. J. F
or. R
es. D
ownl
oade
d fr
om w
ww
.nrc
rese
arch
pres
s.co
m b
y 12
8.22
7.5.
142
on 0
4/11
/11
For
pers
onal
use
onl
y.

Table A1. Biometric parameters of measured longleaf pine (Pinus palustris) and slash pine (Pinus elliottii var. elliottii) trees.
SpeciesDBH(mm) H (m) Hcrown (m) LA (m2) Vol (m3)
SLA(cm2�g–1) SVol (m3) NM (kg)
SAbase
(m2)SAcrown
(m2)STbase
(mm)STcrown
(mm)Longleaf pine 198 22.76 14.85 28.9 0.398 119.3 0.191 8.45 0.0191 0.0066 4.42 3.95
308 25.03 19.35 45.1 0.954 105.1 0.564 15.96 0.0392 0.0192 5.45 6.27370 23.04 16.85 37.6 1.203 133.4 0.528 12.79 0.0432 0.0194 5.00 6.30418 24.87 15.32 95.1 1.840 119.3 0.723 31.02 0.0589 0.0355 5.97 5.92
Slash pine 204 22.64 10.40 42.2 0.346 110.2 0.146 11.58 0.0181 0.0102 4.22 3.45320 26.01 17.38 110.1 1.151 110.2 0.693 35.63 0.0550 0.0250 9.15 7.57390 29.5 17.50 169.4 1.844 114.7 0.802 56.49 0.0607 0.0312 6.85 5.67453 30.95 18.75 97.6 2.452 105.7 1.092 35.41 0.0753 0.0413 7.47 6.75
Note: DBH, stem diameter at breast height; H, total tree height; Hcrown, stem height at 0.2 m below crown base; LA, projected leaf area; Vol, total stem volume over bark; SLA, all-sided specific leaf area;SVol, stem sapwood volume; NM, needle mass; SAbase, sapwood area at 1.8 m stem height; SAcrown, sapwood area at 0.2 m below crown base; STbase, sapwood thickness at 1.8 m stem height; STcrown,sapwood thickness at 0.2 m below crown base.
Gonzalez-B
eneckeet
al.523
Publishedby
NR
CR
esearchPress
Can
. J. F
or. R
es. D
ownl
oade
d fr
om w
ww
.nrc
rese
arch
pres
s.co
m b
y 12
8.22
7.5.
142
on 0
4/11
/11
For
pers
onal
use
onl
y.