why a "c"?
TRANSCRIPT

8/9/2019 Why a "C"?
http://slidepdf.com/reader/full/why-a-c 1/12
AN ANALYSIS OF THE PS150 “C”By Mitchell Cohen, Parent PS150
December 2007
Table of ContentsIntroduction...................................................................................................................................... 1 Methodological Considerations ....................................................................................................... 1 Data Analysis................................................................................................................................... 3
Math........ ................ ................ ................ ................ ................ ................ ................. ................... ................. ................ ..... 3 English ................ ................ ................ ............... ................ ................ ................ .................... ................ ................ ........... 6
Conclusion....................................................................................................................................... 9
Introduction
This paper addresses the representativeness and validity of the “C” grade given to PS 150in their Progress Report 2006-07 by the New York City Department of Education.
Without doubt, the “C” is not representative of the school because:• 85% of the score is based on proficiency scores from the NYS standardized math
and English Language Arts tests given in third, fourth, and fifth grade, and the progress scores from fourth and fifth graders at PS150, and sixth graders whograduated from PS150.
• The “C” does not include any assessment of pre-K through second grade, and saysnothing about the social science, arts, enrichment programs, and other curriculum atPS 150. The overall grade is based on standardized test results from less that halfthe students on a fraction of the curriculum.
• The high scores from the NY State report card and by NYC DOE’s own qualitativeassessment are at odds with the “C” grade and this lack of agreement with othermeasures of quality suggest the “C” lacks credibility as an indicator of the overallquality of PS150.
That being said, the “C” grade does indicate that the fourth and fifth graders’ progress inMath and English between 2006 and 2007 compared unfavorably to forty “peer” schoolsand, more generally, to all city elementary schools. The remainder of this report 1)explores methodological reasons for the score, 2) presents a data analysis of the testscores, and 3) offers some conclusions drawn from the author -- a parent without day-to-day knowledge of the curriculum or administration of PS150.
Methodological Considerations

8/9/2019 Why a "C"?
http://slidepdf.com/reader/full/why-a-c 2/12
based on similar economic status of families attending the school and demographicsof students. The criteria could be refined to include student size and other factors, butit is unlikely that any refinement of the peer definition would change the overallfinding. When compared to Manhattan peers 1 PS150 is in the upper tier in terms of
performance, but near the bottom in terms of progress on the standardized tests.When compared to all 40 peers, PS150 is in the upper third in terms of performancein Math and English but in the bottom third in terms of progress.
2. PS150’s small size skewed the score. PS150 is, by far, the smallest school amongits peer schools and is one of the smallest elementary schools in the city. This means
that any single student or teacher has a larger impact on the overall score. Any oneteacher or student may have a “bad day” and the school may be more prone to highervariability if it has a few very high or very low scores. Empirically, however, overallsize of the school is not statistically related to the overall score. For PS150, the scoreis not explained by extreme scores. There is a reasonable range of scores that makecalculated differences and “averages” meaningful measures. In short, the findings arenot significantly skewed by school size.
3. PS150 already had high scores resulting in a “ceiling effect”. PS150 scores arehigh, but there is considerable room for improvement. Several of the schools withhigher performance scores showed improvement. On a scale of 1 to 4.5, PS150’saverage English proficiency level in 2007 was 3.63 and in 2006 it was 3.68. For mathit was 3.84 in 2007 and 3.81 in 2006.
4. The change in progress scores was so small as to be insignificant. A fair number
of students had reasonably small changes in score between 2006 and 2007 and itworked in PS150’s favor in some cases and against it in others – largely cancellingout a systematic bias. In addition, in math about a quarter of the students (about 18students out of 71) had significant decreases in math scores while nearly a fifth (about15 students) had significant improvement in math scores. In English, about a third ofthe students had significantly lower scores while about a 30% had significantly higherscores.
5. Most of the students who did poorly were graduates and do not reflect thecurrent study body. This is not the case. For math, fourth graders had the worst
progress scores. In English about 12% of the fifth graders and 17% of the sixthgraders did not progress from “meeting learning standards” to “meeting them withdistinction.”

8/9/2019 Why a "C"?
http://slidepdf.com/reader/full/why-a-c 3/12
Data Analysis
Math
There is some indication that classes have slipped in their overall math proficiency between 2006 and 2007. Classes have between 23 and 25 students who took the test.Figure 1 shows the number of fourth, fifth and sixth grades who were classified as 1) notmeeting learning standards, 2) partially meeting learning standards, 3) meeting learningstandards, and 4) meeting learning standards with distinction . Note that none of PS150students fell into the bottom category, and 3 students in 2007 and 2 students in 2006“partially” met standards.
Fourth graders did the best in 2006 with 57% achieving “distinction”, but in 2007, sixthgraders did the best with 54% achieving “distinction”. While PS150 is doing very well athaving students meet learning standards or meet them with distinction, there continues to
be significant room for improvement.
Figure 1 Math Proficiency Ratings by Grade (Total Students=72)Cells represent number of students NOT percent
Gr 6Gr 5Gr 4 100%
80%
60%
40%
20%
0% 070607060706
Partial 220010
91016131210Meeting 13129121013Distinction
Figure 1 suggests that changes in scores occurred among those either meeting orexceeding State learning standards. Table 1 , below, indicates how many students tied orimproved their last year’s proficiency score and how many students received a lower
proficiency score. It is a more sensitive measure of progress than the classificationscheme shown in Figure 1 .
8/9/2019 Why a "C"?
http://slidepdf.com/reader/full/why-a-c 4/12
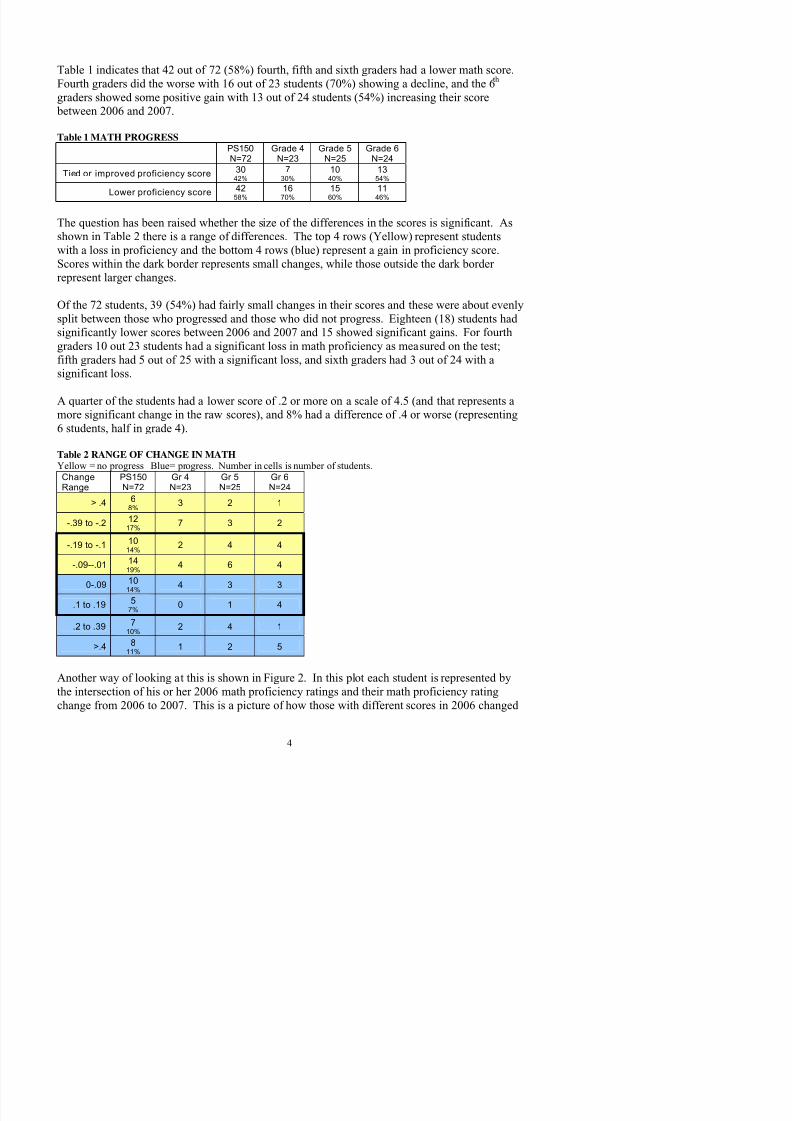
Table 1 indicates that 42 out of 72 (58%) fourth, fifth and sixth graders had a lower math score.Fourth graders did the worse with 16 out of 23 students (70%) showing a decline, and the 6 th graders showed some positive gain with 13 out of 24 students (54%) increasing their score
between 2006 and 2007.
Table 1 MATH PROGRESSPS150N=72
Grade 4N=23
Grade 5N=25
Grade 6N=24
Tied or improved proficiency score 3042%
730%
1040%
1354%
Lower proficiency score 4258%
1670%
1560%
1146%
The question has been raised whether the size of the differences in the scores is significant. Asshown in Table 2 there is a range of differences. The top 4 rows (Yellow) represent studentswith a loss in proficiency and the bottom 4 rows (blue) represent a gain in proficiency score.Scores within the dark border represents small changes, while those outside the dark borderrepresent larger changes.
Of the 72 students, 39 (54%) had fairly small changes in their scores and these were about evenly
split between those who progressed and those who did not progress. Eighteen (18) students hadsignificantly lower scores between 2006 and 2007 and 15 showed significant gains. For fourthgraders 10 out 23 students had a significant loss in math proficiency as measured on the test;fifth graders had 5 out of 25 with a significant loss, and sixth graders had 3 out of 24 with asignificant loss.
A quarter of the students had a lower score of .2 or more on a scale of 4.5 (and that represents amore significant change in the raw scores), and 8% had a difference of .4 or worse (representing6 students, half in grade 4).
Table 2 RANGE OF CHANGE IN MATHYellow = no progress Blue= progress. Number in cells is number of students.
ChangeRange
PS150N=72
Gr 4N=23
Gr 5N=25
Gr 6N=24
> .4 68% 3 2 1
-.39 to -.2 1217% 7 3 2
-.19 to -.1 1014%
2 4 4
-.09--.01 1419% 4 6 4
0-.09 1014% 4 3 3
.1 to .19 5 0 1 4

8/9/2019 Why a "C"?
http://slidepdf.com/reader/full/why-a-c 5/12
in 2007. Of the quarter of the students with significantly lower scores, 4 had very high mathscores to begin with and, as might be expected, their scores declined, and this represents the“ceiling effect” mentioned earlier. The reason for the other 12 students’ decline should befurther queried. Observe in this graph that many students with already high scores, managed toscore higher in 2007.
Figure 2 Change in Math Proficiency Rating by 2006 Proficiency RatingEach triangle represents a student. Those inside the shaded area did considerably worse in their proficiency scores
between 2006 and 2007.
-1
-0.8
-0.6
-0.4
-0.2
0
0.2
0.4
0.6
0.8
1
2 2.5 3 3.5 4 4.5
2006 Math Proficiency Rating
M a
t h P r o
f i c i e n c y
R a
t i n g
C h a n g e f r o m
2 0 0 6 t o 2 0 0

8/9/2019 Why a "C"?
http://slidepdf.com/reader/full/why-a-c 6/12
English
The average of 3.7 out of 4.5 for PS150 English proficiency, as measured on thestandardized ELA exams, places PS150 in the 90th percentile in terms of proficiencycompared to our peers schools. It is, however, slightly lower, than the average mathscore of 3.8. Figure 3 shows the percentage of fourth, fifth and sixth grades who areclassified as 1) not meeting learning standards, 2) partially meeting learning standards, 3) meeting learning standards, and 4) meeting learning standards with distinction .
In contrast to the math proficiency, English fourth graders are doing the best, althoughnot progressing from 2006 to 2207. All classes had more students measured at“distinction” in 2006 than 2007. Note that only 1 PS150student fell into the bottomcategory, and 4 students in 2007 and 3 students in 2006 “partially” met standards. Whilethe scores are good, there is ample room for improvement in ELA scores.
Figure 3 ELA Proficiency Ratings by GradeCells represent number of students NOT percent
Figure 3 shows that the majority of PS150 fourth, fifth and sixth grader are meeting the
learning standard of English, but less than 20% are “meeting learning standard withdistinction”. While Figure 3 shows the categorization of PS150 students into four tiers,Table 3 shows how many PS150 students increased or decreased their proficiency scores
between 2006 and 2007. It indicates that 36 out of 71 students (51% of all fourth, fifthand sixth graders) had a lower English score in 2007 than they did in 20006. In contrastto the math scores, in English, fourth graders did the best with 13 our to 23 students
Gr 5 Gr 6Gr 4 100%
80% 60%
40%
20%
0% 070607060706
010000Not Meeting 212101Partial
171320181614Meeting 592578Distinction
8/9/2019 Why a "C"?
http://slidepdf.com/reader/full/why-a-c 7/12
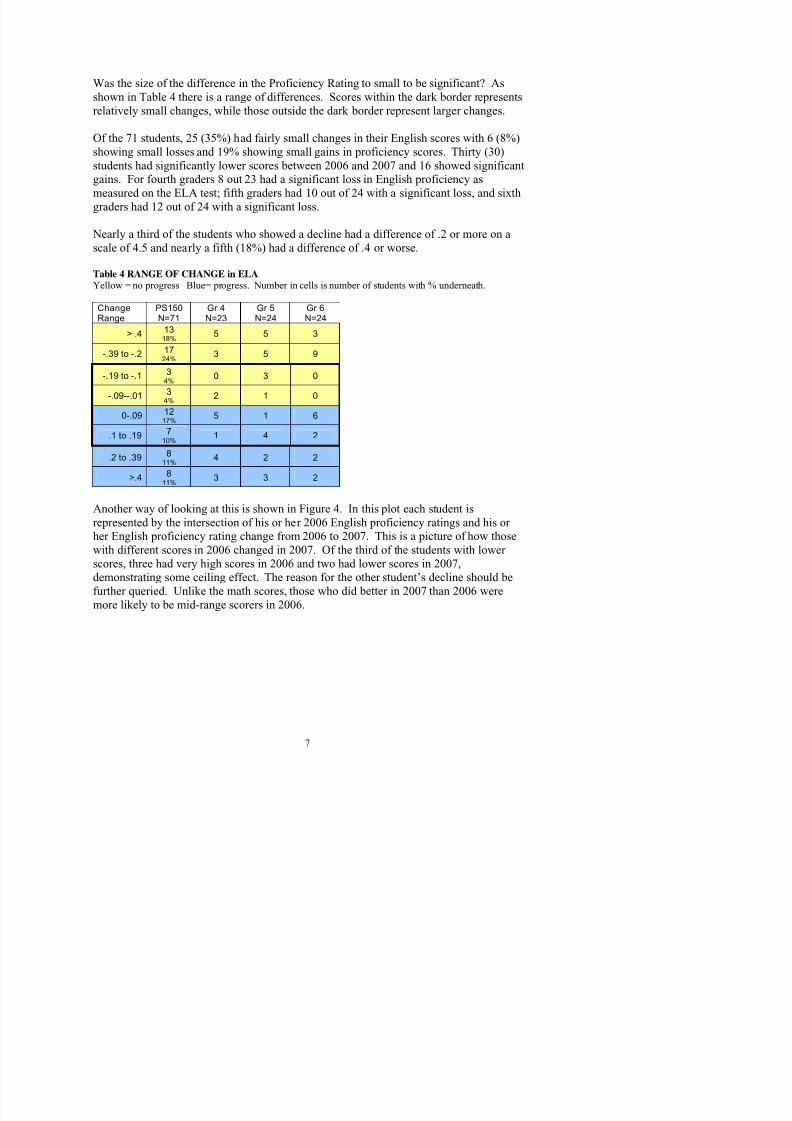
Was the size of the difference in the Proficiency Rating to small to be significant? Asshown in Table 4 there is a range of differences. Scores within the dark border representsrelatively small changes, while those outside the dark border represent larger changes.
Of the 71 students, 25 (35%) had fairly small changes in their English scores with 6 (8%)showing small losses and 19% showing small gains in proficiency scores. Thirty (30)students had significantly lower scores between 2006 and 2007 and 16 showed significantgains. For fourth graders 8 out 23 had a significant loss in English proficiency asmeasured on the ELA test; fifth graders had 10 out of 24 with a significant loss, and sixthgraders had 12 out of 24 with a significant loss.
Nearly a third of the students who showed a decline had a difference of .2 or more on ascale of 4.5 and nearly a fifth (18%) had a difference of .4 or worse.
Table 4 RANGE OF CHANGE in ELAYellow = no progress Blue= progress. Number in cells is number of students with % underneath.
Change
Range
PS150
N=71
Gr 4
N=23
Gr 5
N=24
Gr 6
N=24> .4 13
18% 5 5 3
-.39 to -.2 1724% 3 5 9
-.19 to -.1 34%
0 3 0
-.09--.01 34% 2 1 0
0-.09 1217% 5 1 6
.1 to .19 710% 1 4 2
.2 to .39 811% 4 2 2
>.4 811% 3 3 2
Another way of looking at this is shown in Figure 4 . In this plot each student isrepresented by the intersection of his or her 2006 English proficiency ratings and his orher English proficiency rating change from 2006 to 2007. This is a picture of how thosewith different scores in 2006 changed in 2007. Of the third of the students with lowerscores, three had very high scores in 2006 and two had lower scores in 2007,demonstrating some ceiling effect. The reason for the other student’s decline should befurther queried. Unlike the math scores, those who did better in 2007 than 2006 weremore likely to be mid-range scorers in 2006

8/9/2019 Why a "C"?
http://slidepdf.com/reader/full/why-a-c 8/12
Figure 4 Change in English Proficiency Rating by 2006 Proficiency RatingEach triangle represents a student. Those inside the shaded area did considerably worse in their proficiency scores
between 2006 and 2007.
-1
-0.8
-0.6
-0.4
-0.2
0
0.2
0.4
0.6
0.8
1
2 2.5 3 3.5 4 4.5
2006 ELA Proficiency Rating
E L A P r o
f i c i e n c y
R a
t i n g
C h a n g e
f r o m
2 0 0 6 t o 2 0 0 7

8/9/2019 Why a "C"?
http://slidepdf.com/reader/full/why-a-c 9/12
Conclusion
The “C” is not representative of PS150. The “C” does not include any assessment of pre-K through second grade, and says nothing about the social science, arts, enrichment
programs, and other curriculum at PS 150. Eighty-five percent (85%) of the overall gradeis based on standardized math and English test results from less that half the students on afraction of the curriculum. PS150 parents and administration should express ourdiscontent with the inappropriate label of PS150’s quality.
Another issue is the weight that should be applied to standardized math and Englishscores. How valid are the scores in measuring the aptitude and progress of students atPS150? Given the array of other assessment tools used by PS150, how much weightshould be given to these standardized tests? Assessing the validity of the tests inmeasuring the aptitude of PS150 students and determining how the standardized scorescompares to other assessment tools at PS150 is beyond the scope of this report.However, it is a topic worthy of review and discussion.
Given that the “C” is not a valid measure of the overall school quality, and that it is avalid measure of English and math skills, the “C” does indicate that PS 150 hassubstantial room to improve math and English skills of its students. The progress scoresare not spurious and while there are several methodological issues, none appear toexplain the unexpected lack of progress shown by students in math and ELA standardizedscores.
What would it take for students to improve their scores from year-to-year? For the most part, this would mean increasing the scores of students who already meet the statestandards and working with individuals or classes to “meet standards with distinction”. Afurther item analysis of the tests could reveal areas where PS150 lags and where it excels.Tests questions are designed to measure different skills, and student scores can bemapped to see if there are areas where PS150 students have scored particularly well or
poorly. If it is decided that the tests are useful indicators for PS150 then providingadditional support in areas where PS150 did not show progress will help the students and,coincidentally, the test scores. For example the recent decision to work oncomprehension in reading at PS150 is the type of activity that could improve skills thatare needed to excel on the standardized tests.
The scoring data can be used to identify individual students who did not progress in math,English, or both and determine if they need targeting for additional support. The analysis

8/9/2019 Why a "C"?
http://slidepdf.com/reader/full/why-a-c 10/12
English that need special attention. Notably, PS150 has many other assessment toolsused to track and identify specific areas of need among students. Using the standardizedscores as a tool may not warrant the effort and not be a particularly effective tool.
The lower than expected overall progress scores for PS150 may reflect some systematicissues with test preparation and test execution. While the data suggest that no singleteacher or grade cohort is responsible for the trend, the fact that 4 th graders had lowerimprovement scores in math and 5 th graders in English, suggest that there may be somespecific issues with the way the test was given. The administration currently is
conducting test preparation and altering some methods, such as providing scrap paper forthe math tests. The considerable experience of administration, teachers, and parentsmight be used to identify other areas where small changes in implementation could yieldmore accurate testing results.
PS150 does not “teach to the test” and place undue stress on the students. At the sametime, students and parents should be aware that the tests have meaning and deserve theirattention.
Parents might be given specific exercises for their children with an explanation of whatareas of math and English they address that are measured on the standardized tests.These could be incorporated into homework and be voluntary. The website would be
particularly usefully in reducing administrative burden in the distribution of theseexercises.
Case studies sponsored by the school or PTA where PS150 compares itself to otherschools could be a vehicle to share information and open possible areas of collaborationwith peer schools.
Like the grade itself, this report focuses on the standardized math and English tests. Alarger and worthy discussion for the school and parents is the degree to which thestandardized tests are used as a tool to assist the school in identifying students andadjusting curriculum.
As this report is being finalized, students at PS150 are preparing for the 2008 Englishtest. There is little additional to be done in preparing students for those tests. It will betelling to compare the 2008 to 2007 scores to help understand the dynamic of the scoresand the “progress” of the students.

8/9/2019 Why a "C"?
http://slidepdf.com/reader/full/why-a-c 11/12
Attachment 1 PS 150 & Peer Schools 1 Ranked by Performanc e with Overall Score & Grade
Among PS150 peers34% got A’s, 27% B’s,34% C’s, and 5% D’sand F’s.
A’s were from Manhattanand Queens. B’s werewell dispersed. C’s, D’s,and F’s aredisproportionately fromStaten Island.
Table Rank or dered byPerformance (scores onStandardized math and
English tests)
PS 150 is in the topquartile in performancebut lags in the overallscore.
Key:Green = A schoolsPink = B schools
Blue = C schoolsYellow = D, F schools
Peer Observation s: PS150 peers include 3Brooklyn Schools, 10Manhattan schools, 17Queens schools, and 11Staten Island schools.Queens
Brooklyn
Staten Island
PS Name of Peer school BoroughPerform-
ance 2 Overa3lScore 2
LetterGrade G&T
205 Alexander Graham Bell Queens 0.939 67.91 A 203 Oakland Gardens Queens 0.901 61.63 B
77 Lower Lab School Manhattan 0.894 74.08 A 196 Grand Central Pkwy Queens 0.862 78.88 A221 North Hills Queens 0.854 69.09 A 162 John Golden Queens 0.826 73.56 A 094 David D Porter Queens 0.820 71.01 A 213 The Carl Ullman School Queens 0.794 75.5 A 101 School In The Gardens Queen 0.766 76.91 A 128 Juniper Valley Queens 0.762 45.45 C 209 Clearview Gardens Queens 0.760 71.73 A
150 Tribeca Learning Center Manhattan 0.741 44.1 C
173 Fresh Meadows Queens 0.738 46.91 C 195 Manhattan Beach Brooklyn 0.733 51.3 B321 William Penn Brooklyn 0.729 55.35 B290 Manhattan New School Manhattan 0.727 73.01 A 041 Crocheron Queens 0.724 53.29 B053 Bay Terrace Staten Island 0.722 48.37 C 041 Greenwich Village Manhattan 0.716 58.63 B199 Jessie Isador Straus Manhattan 0.706 72.93 A 158 Bayard Taylor Manhattan 0.697 59.15 B159 Queens 0.695 46.21 C 040 Augustus St-Gaudens Manhattan 0.663 64.11 A 030 Westerleigh Staten Island 0.619 49.61 C89 Manhattan 0.610 42.29 C 185 Walter Kassenbrock Brooklyn 0.610 40.92 C 169 Bay Terrace Queens 0.609 45.04 C
56 Louis Desario School Staten Island 0.590 41.01 C 023 Richmondtown Staten Island 0.579 40.17 C 184 Flushing Manor Queens 0.558 68.27 A 032 The Gifford School Staten Island 0.549 51.55 B079 F i L i Q 0 529 59 31 B

8/9/2019 Why a "C"?
http://slidepdf.com/reader/full/why-a-c 12/12
At tachment 2 Relat ionship between ELA and Math Changes in Prof ic iency Ratings from 2006 to 2007
Relationship between ELA and Math Changes in ProficiencyRatings from 2006 to 2007
-1
-0.8
-0.6
-0.4
-0.2
0
0.2
0.4
0.6
0.8
1
-1 -0.8 -0.6 -0.4 -0.2 0 0.2 0.4 0.6 0.8 1
ELA Change in Prof iciency Rating from 2006 to 2007
M a
t h C h a n g e
i n P r o
f i c i e n c y
R a
t i n g
f r o m
2 0 0 6 t o
2 0 0 7
12