why aerospace and defense programs are late and over-budget in ?
TRANSCRIPT

Can we afford our own future?Why A&D programs are late and over-budget — and what can be done to fix the problem
Aerospace & Defense

Contents
1 Introduction
2 Cost overruns and schedule delays are getting worse
3 Understanding the root causes
4 Technical complexity
8 Talent shortage
12 Supply chain challenges
14 Politics
17 Program management challenges
21 Conclusion: Protecting the industry’s future
22 Contact
23 Endnotes

Aerospace & Defense Can we afford our own future? 1
Introduction
As used in this document, “Deloitte” means Deloitte Consulting LLP, a subsidiary of Deloitte LLP. Please see www.deloitte.com/us/about for a detailed description of the legal structure of Deloitte LLP and its subsidiaries.
Program management and execution in the Aerospace & Defense (A&D) industry has always been an important critical success factor, but the stakes are getting higher. U.S. defense spending climbed over 60 percent during the Bush administration, and will total at least $612.5 billion in fiscal 2009, including $542.5 billion for the basic defense budget and $70 billion for the wars in Iraq and Afghanistan1. In March 2008, the Government Accountability Office (GAO) issued a study of 95 weapons systems programs that showed an average schedule delay of 21 months and average budget overrun of 26 percent for 20072. In dollar terms, the combined cost overrun for all studied programs was $295 billion, up from $42 billion for a similar study conducted seven years earlier.
To gain a deeper understanding of the problem, Deloitte conducted an extensive analysis of Major Defense Acquisition Programs (MDAPs) using cost and unit data published in the Department of Defense’s Selected Acquisition Reports going back to the early 1990s. The data shows that over the past 15 years the problem has steadily gotten worse. At the current pace, unless game changing mitigations are implemented to address the root causes, the analysis forecasts that in 10 years the average cost overrun may exceed 46 percent, up from 26 percent today.
Recent media reports have also shone a bright light on acquisition problems in A&D. For example, budget overruns for a European military transport, a U.S. next generation fighter jet and an Asian space launch vehicle,
have been widely publicized. Commercial aircraft program delays have also made headlines – and elicited a strong reaction from the capital markets. This problem appears to span commercial aircraft, defense and space sectors, without regard to country boundaries.
In a recent Deloitte survey to support this study, 43.6 percent of participating government and A&D executives and professionals reported they believe the A&D program execution problem is at least as serious as the current crises in housing and banking3. It should also be noted that the unprecedented government expenditures required to shore up the financial system and economy are likely to increase the pressure on defense contractors and the Department of Defense (DoD) to reduce costs and improve efficiency. Prior to the election, the Pentagon’s acquisitions chief said the department was close to finishing its updated six-year budget plan, which included “painful” cuts for all the services4.
Earlier this year, Defense Secretary Robert Gates acknowledged that DoD has been “adding layer upon layer of cost and complexity onto fewer and fewer platforms that take longer and longer to build” and that this trend “must come to an end.5”
But how? What is behind this troubling pattern of cost overruns and schedule delays – and what can be done to address it? This study examines five root causes – technology complexity, talent, supply chain, politics, and program management – and offers specific solutions and practices that we believe can help tackle the problem.

2
Cost overruns and schedule delays are getting worse
As previously cited, the GAO reported acquisition costs for major weapons systems programs were over budget by an average of 26 percent in 2007 with cost overruns totaling $295 billion, up from $42 billion for a similar study conducted in 2000.
Our analysis of the major programs cost data shows that cost overruns are increasing by an average of 1.86 percentage points per year. If this trend is allowed to continue, the analysis suggests that in 10 years the average overrun will exceed 46 percent as illustrated on the following chart (Figure 1).
(Note: analysis based on real baseline year dollars)
Figure 1: Budget overruns continue to accelerate 6
-10.0%
0.0%
10.0%
20.0%
30.0%
40.0%
50.0%
1993 1998 2003 2008 2013 2018
Year
Perc
ent
over
run
rela
tive
to
base
line
y = 0.018595x - 37.055931R 2 = 0.821929
Figure 2: Schedule delays 7
Note: This reflects planned or actual delivery of initial capabilities for programs with comparable schedule data.
Source: GAO analysis of DCO data.
Programs 1 to 24 months late
Programs 25 to 48 months late
Programs more than 48 months late
Programs on time
38%
33%
14%
15%
38%
33%
14%
15%
The GAO report indicated that the average schedule delay was 21 months, with 33 percent on schedule, 38 percent 1 to 24 months late, and 29 percent more than two years behind (Figure 2).

Aerospace & Defense Can we afford our own future? 3
Understanding the root causes
Delays and overruns for DoD programs are not without precedent. In 1986, the Packard Commission report found that DoD weapons systems development “takes too long and costs too much.” In the 1990s, Congress passed several laws designed to improve acquisition performance: the Federal Acquisition Streamlining Act of 1994; the Federal Acquisition Reform Act of 1996; the Defense Reform Act of 1997, and the Federal Activities Inventory Reform Act of 1998. Yet, in 2005, a series of Senate Armed Services Committee hearings concluded that although some improvements had been made, the same basic problems existed.
In his opening statement at the Senate Armed Services Committee Hearing on DoD Acquisition of Major Weapons Systems, June 3, 2008, Senator Carl Levin said, “These cost overruns happen because of fundamental flaws that are built into our acquisition system. DoD acquisition programs:
Fail because the Department continues to •rely on unreasonable cost and schedule estimates
Establish unrealistic performance •expectations
Insist on the use of immature technologies•
Costly changes to program requirements, •production quantities and funding levels in the middle of ongoing programs.”
Our in-depth analysis and experience suggests that the underlying causes for cost overruns and schedule delays in A&D fall into five major categories (Figure 3).
Figure 3: Root causes
Costoverruns
andscheduledelays
Programmanagement
challenges
Technicalcomplexity
Talent shortage
Politics
Supply chainchallenges
The remainder of this study takes a detailed look at each of these root causes, and offers solutions and practices we believe can help address the problem.

4
Technical complexity
The aerospace industry has made great technological advances in functionality and performance over the past 50 years. Digital product definition, computational fluid dynamics, and sophisticated engineering analysis have enabled vast improvements in materials, propulsion, communications and avionics. These advances, in turn, have resulted in important contributions to society and history, including the moon landing, the end of the Cold War, and ubiquitous and affordable global freight and passenger jet transportation.
For the defense industry, technology advances make it possible to develop weapons systems that are more powerful and sophisticated than ever before. However, this increased functionality – combined with ever-increasing precision, tighter tolerances, and increasing complexity – make it extraordinarily difficult to manage the
product development process. Unpredictable interface errors, integration challenges, difficult cost/functionality tradeoffs, and variability can challenge even the best managed programs, resulting in schedule misses and cost overruns.
The challenges associated with technical complexity continue to grow over time. Deloitte’s analysis of DoD data from 1997 to 2007 shows that technical complexity accounts for an ever-increasing percentage of DoD cost overruns (Figure 4). In 2007, technical complexity on average produced an
8.7 percent overrun relative to the baseline budget; this represented roughly a third of the total budget overrun of 26 percent. Our analysis shows a very high correlation of the data over the last 10 years, suggesting the problem will get worse unless the industry addresses this crucial root cause.
-2.0%
0.0%
2.0%
4.0%
6.0%
8.0%
10.0%
1993 1995 1997 1999 2001 2003 2005 2007
Year
Per
cent
ove
rrun
rel
ativ
e to
bas
elin
e at
trib
utab
le t
o t
echnic
al c
om
ple
xit
y
y = 0.006228x -12.414211R 2 = 0.796186
Note: Analysis based on real baseline year dollars
Figure 4: Technical complexity increases overruns8

Aerospace & Defense Can we afford our own future? 5
One reason for this growing trend is that many A&D programs rely on leading edge technologies that are still maturing. Today’s programs often include sophisticated software and other advanced technologies that deliver greater functionality, but require a much higher level of integration and interoperability. To illustrate how far we have advanced, one needs only to recall the fascinating CNN live footage from the first Gulf War that showed GPS precision-guided missiles launched at sea 200 miles away from Baghdad striking the vent on the roof of Saddam Hussein’s Presidential Palace – an unimaginable precision that seemed like something right out of a Star Wars movie. Also, consider the evolution of the jet fighter (Figure 5). A fifth generation aircraft with multi-targeting, stealth, and net-centric warfare capabilities is clearly superior to a Vietnam-era aircraft such as the F-4 Phantom. Yet it is also far more complex and must be rigorously designed and tested to ensure the various sub-systems work together.
Generation Characteristics Armaments
1st Generation Mig 15, F-86 Sabre
Basic turbojet, less than Mach 1, no radar
Dumb bombs, rockets, and guns
2nd Generation F-100
Efficient turbojet, supersonic speeds, basic radar
Basic air-to-air missiles
3rd Generation F-4 Phantom II
Multi-purpose fighters with relatively advanced radars
Air defense and ground attack weapons
4th Generation Mig 29, F-16
Increasingly sophisticated avionics with more emphasis on maneuverability than speed
Weapons supporting multirole ability of fighter such as long-range air-to-air missiles
4.5th Generation F-18 E/F Super Hornet
Limited stealth characteristics, advanced AESA radars and vastly improved electronics; Use of composites in the structure
Smart munitions
5th Generation F-22
Ability to operate in a net-centric system, digital cockpit, and stealth features
Smart munitions
This phenomenon of increased complexity is even evident within a single integrated system. For example, advances in jet engine technology have delivered remarkable improvements in thrust and reliability. Through the use of advanced materials and design tools, fuel efficiency has improved by more than 90 percent10. However, the downside is that today’s jet engines must be designed and built to much tighter tolerances and require more time to develop, test, and manufacture.

6
When weapons systems were less complex, the development cycle was much shorter. For example, the Manhattan project created the most advanced and powerful weapon of its time (the atomic bomb) and was completed in less than three years. In contrast, a modern bomber or jet fighter – with all of its complex subsystems and avionics – generally takes at least 10-15 years to design and produce. (Figure 6)
As the timeline increases, so does the number of technology developments that occur during the course of the program. After all, technology doesn’t stand still while complex weapons systems are being developed.
Parts and subsystems continually evolve and their designs continue to change and improve after they are sourced to suppliers, which means they are often obsolete before the first unit rolls off the production line. Customers naturally want the latest subsystem technology advances incorporated into their products – even for products they ordered years earlier. Unfortunately, designs that continue to evolve once the product definition is “frozen” can become a root-cause problem. With the increased inter-connectivity of designs, a change to one part often affects other parts in unpredictable ways – creating a ripple effect that can have serious consequences for the overall cost and schedule. The recent Deloitte survey of
Program and year of first use Years to 1st use from contractor start
Historical Programs
Manhattan Project (1945) 2.5
F-104 (1958) 5
Intercontinental Ballistic Missile (1958) 3.5
SR-71 (1962) 3
Apollo (1967) 8
Recent Programs
Bomber Program (1993) 11
Satellite Program (2009 expected) 10
Satellite System (to be determined) >20
Jet Fighter A (2005) 14
Jet Fighter B (2009 expected) 13
Figure 6: Today’s complex projects take longer than ever 11

Aerospace & Defense Can we afford our own future? 7
10
100
1,000
10,000
0 0.1 0.2 0.3 0.4 0.5 0.6 0.7 0.8 0.9 1
Complexity Index
Co
st (
FY0
5$
M)
Successful
Failed
Impaired
To-be-determined
Development cost as function of complexity for NASA programs
- -
Figure 7: High complexity, low budgets projects are riskier 13
Solutions and recommended practices
Both industry and government have a shared role in tackling the issue of technical complexity. Key activities:
• Dividingprogramsintolesscomplexworkpackageswithshorterdurations.Timeisaclearpredictorofbudgetandschedule risk. The longer the program, the greater the risk.
• Notapprovingcontractsforsystemdevelopmentanddemonstration(SDD)untiltheunderlyingtechnologyisproven.Technology maturity is critical to program success, and should therefore be required prior to committing billions of dollars to development contracts.
• RequiringtheDoDandarmedservicestosetaprogram’scriticaldesignrequirementsandpriorities.Defensecontractorscannot be expected to make the appropriate affordability trade-offs and “stand-in” for the customer.
• Improvingdefensecontractorcapabilitiesinsystemsengineering,integration,andtesting.Providingmoreslacktimeinthe schedule to react to unanticipated technical challenges.
• Creatingbudgetsthatreflecttechnicalcomplexityriskandrealisticassumptions.
government and A&D professionals showed that one of the main problems related to technical complexity was “configuration changes made [without] enough attention to interoperability, interface integration, and test requirements12.”
The riskiest programs are generally those that combine high complexity with tight budgets (Figure 7). According to the data, the risk of program failure (or significant impairment) generally rises with increased complexity – especially for programs that may have been under-funded to begin with.

8
Talent shortage
In Deloitte’s recent survey, one third of participants called the current A&D talent shortage a “crisis” and a “root cause of the $295 billion cost overrun cited by the GAO.” Another 30 percent predicted that a talent crisis is “right around the corner14.”
Numerous studies suggest that the A&D talent shortage is likely to get worse before it gets better. According to a study by the Defense Manpower Data Center, baby boomers and older workers comprise more than 70 percent of the DoD and civilian AT&L (acquisition, technology & logistics) workforce, while people under the age
“NASA has three times as many technicians over the age of sixty as under the age of thirty”
Sean O’Keefe Former NASA Administrator18
of 30 comprise less than 10 percent15. Another study estimates that by the end of 2008, 27 percent of our nation’s A&D manufacturing workforce will be eligible for retirement16. And according to the National Science Foundation, the number of science, technology, and engineering retirements will increase dramatically over the next 15 years17.
One of the biggest challenges is that the educational system in the United States is producing fewer qualified scientists and engineers, a long-term trend that threatens to undermine the competitiveness of our defense industry. Between the years 1997 and 2002, the percentage of college students pursuing science, technology, engineering and math (STEM) degrees in the United States declined significantly, while the percentage in Asia and Europe continued to rise (Figure 8).
0
200
400
600
800
1,000
1,200
1,400
1997 2002 1997 2002 1997 2002 1997 2002 1997 2002
NorthAmerica
Asia Europe Africa Central/South America
Degrees (thousands)
The gap in the number of technicallyqualified professionals between Asiaand the U.S. has increased considerably primarily owing to theincreasing number of graduates incountries like China and India.
United States
Europe
AsiaEngineering
Natural sciences
Social/behavorial sciences
United States
Europe
Asia
Figure 8: Asia and Europe are producing far more science and engineering graduates 19
Source: National Science Board, Science and Engineering Indicators 2006

Aerospace & Defense Can we afford our own future? 9
And, we could find no evidence that this trend has abated in the last six years.
This widening gap creates tremendous challenges for our A&D industry and puts our nation’s security at risk. To make matters worse, many of the students in U.S. universities are foreign nationals who may have trouble qualifying for key security clearances, or who plan to return to their home country after graduation. In light of these trends, Nobel laureate Richard Smalley predicts that by 2010, 90% of all scientists and engineers with PhDs will be living in Asia20.
0
5
10
15
20
25
30
35
40
Finan
ce
Man
agem
ent C
onsu
lting
Softw
are an
d Inf
o Serv
ices
Aeros
pace
and D
efen
se
Other
Engin
eerin
g
Compu
ter H
ardwar
e and
Elec
tronic
s
Biolog
ical S
cienc
es
Univer
sities
and
Colleg
es
Phar
maceu
ticals
and
biotec
h
Busin
ess
Trans
porta
tion
Law
Sector
Perc
ent
ente
ring
sec
tor
Undergrad
Masters
PhD
Top sectors for working June 2007 students by degree level
Figure 9: Top graduates shy away from A&D 21
Another problem is that many qualified students do not seem particularly interested in working in aerospace and defense. A 2007 survey of MIT undergraduates showed 28.7 percent going into finance, 13.7 percent into management consulting, and just 7.5 percent into A&D (Figure 9). Employers with the largest number of hires included McKinsey, Google, Morgan Stanley, and Oracle. No A&D contractor or government office was in the top 10.
These trends may lead to a “hollowing out” of core talent in defense contractors, NASA, and the DoD. To make matters worse,
10
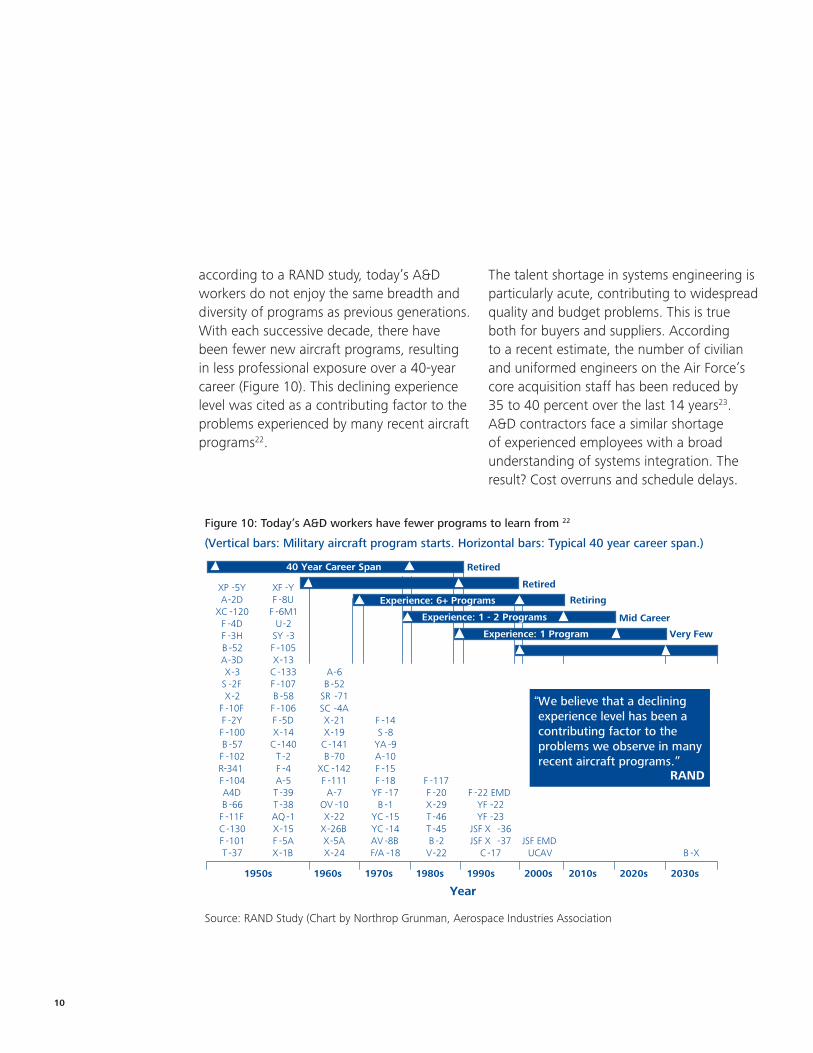
according to a RAND study, today’s A&D workers do not enjoy the same breadth and diversity of programs as previous generations. With each successive decade, there have been fewer new aircraft programs, resulting in less professional exposure over a 40-year career (Figure 10). This declining experience level was cited as a contributing factor to the problems experienced by many recent aircraft programs22.
The talent shortage in systems engineering is particularly acute, contributing to widespread quality and budget problems. This is true both for buyers and suppliers. According to a recent estimate, the number of civilian and uniformed engineers on the Air Force’s core acquisition staff has been reduced by 35 to 40 percent over the last 14 years23. A&D contractors face a similar shortage of experienced employees with a broad understanding of systems integration. The result? Cost overruns and schedule delays.
(Vertical bars: Military aircraft program starts. Horizontal bars: Typical 40 year career span.)
2030s2020s2010s2000s1990s1980s1970s1960s1950s
B -XJSF EMD
UCAV
F -22 EMDYF -22YF -23
JSF X -36JSF X -37
C -17
F -117F -20X-29T -46T -45B -2
V-22
F -14S -8
YA -9A-10F -15F -18
YF -17B -1
YC -15YC -14AV -8BF/A -18
A-6B -52
SR -71SC -4AX-21X-19
C -141B -70
XC -142F -111A-7
OV -10X-22
X-26BX-5AX-24
XF -YF -8U
F -6M1U-2
SY -3F -105X-13
C -133F -107B -58F -106F -5DX-14
C -140T -2F -4A-5T -39T -38AQ -1X-15F -5AX-1B
XP -5YA-2D
XC -120F -4DF -3HB -52A-3DX-3
S -2FX-2
F -10FF -2YF -100B -57F -102R-341F -104A4DB -66
F -11FC -130F -101T -37
Year
40 Year Career Span
Experience: 6+ Programs
Experience: 1 - 2 Programs
Experience: 1 Program
Retired
Retired
Retiring
Mid Career
Very Few
“We believe that a decliningexperience level has been acontributing factor to theproblems we observe in manyrecent aircraft programs.”
RAND
Figure 10: Today’s A&D workers have fewer programs to learn from 22
Source: RAND Study (Chart by Northrop Grunman, Aerospace Industries Association
Aerospace & Defense Can we afford our own future? 11
Solutions and recommended practices
The DoD and armed services have begun to implement a number of resolutions designed to address the talent problem. Defense companies are also beginning to take action, and more success is anticipated. Key activities to continue are:
• Retainingmuchneededexperiencebycreatingfinancialincentivesfor“babyboomer”engineers and technicians.
• Establishingmentorshipprogramstoacceleratedevelopmentforyoungerworkers.
• Fosteringinterestinmathandscienceamongmiddleschoolandhighschoolstudents.Establishing programs to generate excitement, identify promising talent, develop potential, and create a recruiting pipeline for future talent. As it stands, fewer than 15 percent of U.S. high-school graduates have sufficient training in math and science to even begin pursuing an engineering degree.
• ModernizingHRprogramsandlaunching“totalrewards”initiativesthatprovideemployeeswith a comprehensive and balanced package that includes compensation, benefits, career development, and work environment.
• DoDshouldconsiderrestoringhigherallowablecostsforindependentresearchanddevelopment, enabling A&D companies to cultivate “sandbox” talent. This talent could be called upon to solve thorny development and production challenges.
12
Supply chain challenges
A&D supply chains have undergone a major transformation in recent years. Original equipment manufacturers (OEMs) and large platform contractors are shedding more and more of their manufacturing and subsystem assembly work. At the same time, OEMs are streamlining their base of suppliers in order to create greater economies of scale. For example, a major aircraft OEM reduced its supplier base from 350 in 1999 to only 38 in 2004. Tier one suppliers are increasingly
being asked to invest in technology development in exchange for incumbent positions on platforms. Lower tier suppliers are taking on increasingly complex design and manufacturing tasks, including activities such as requirements definition, systems engineering, and configuration management.
These shifts have made OEMs and large platform contractors increasingly dependent on their suppliers – increasing overall risk. In fact, some key tier two and tier three suppliers are becoming critical bottlenecks and wielding significant power over much larger prime contractors.
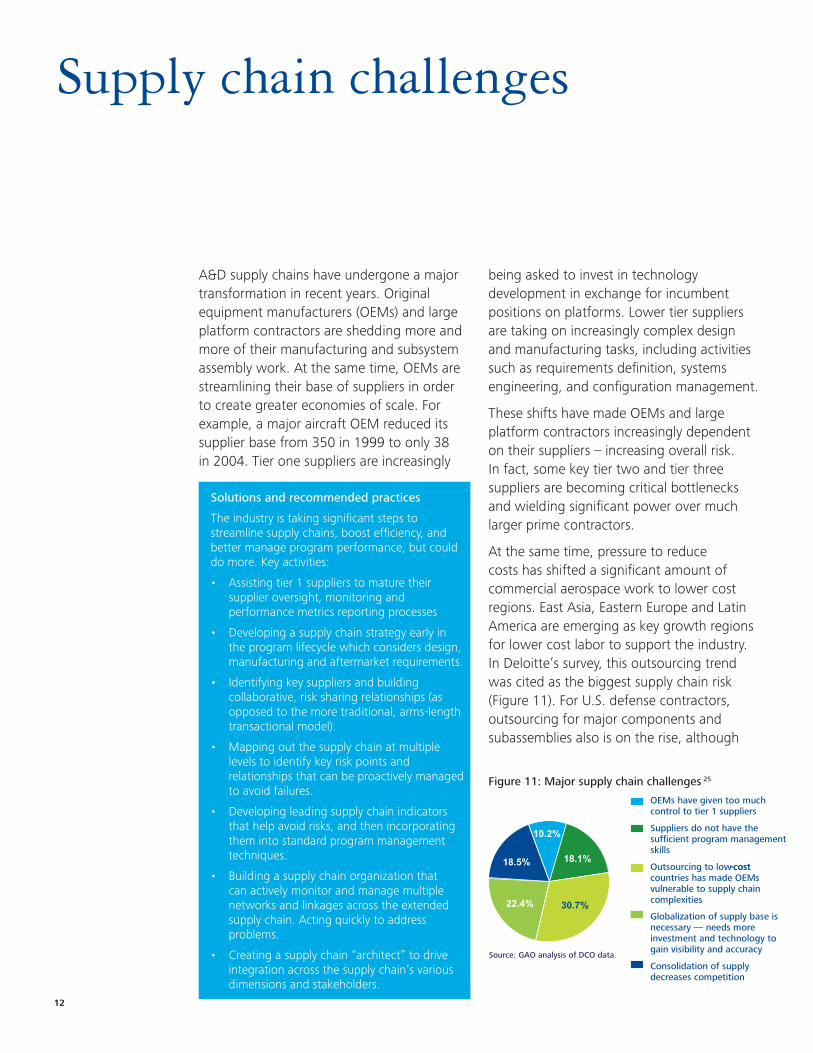
At the same time, pressure to reduce costs has shifted a significant amount of commercial aerospace work to lower cost regions. East Asia, Eastern Europe and Latin America are emerging as key growth regions for lower cost labor to support the industry. In Deloitte’s survey, this outsourcing trend was cited as the biggest supply chain risk (Figure 11). For U.S. defense contractors, outsourcing for major components and subassemblies also is on the rise, although
Solutions and recommended practices
The industry is taking significant steps to streamline supply chains, boost efficiency, and better manage program performance, but could do more. Key activities:
• Assistingtier1supplierstomaturetheirsupplier oversight, monitoring and performance metrics reporting processes
• Developingasupplychainstrategyearlyinthe program lifecycle which considers design, manufacturing and aftermarket requirements.
• Identifyingkeysuppliersandbuildingcollaborative, risk sharing relationships (as opposed to the more traditional, arms-length transactional model).
• Mappingoutthesupplychainatmultiplelevels to identify key risk points and relationships that can be proactively managed to avoid failures.
• Developingleadingsupplychainindicatorsthat help avoid risks, and then incorporating them into standard program management techniques.
• Buildingasupplychainorganizationthatcan actively monitor and manage multiple networks and linkages across the extended supply chain. Acting quickly to address problems.
• Creatingasupplychain“architect”todriveintegration across the supply chain’s various dimensions and stakeholders.
Source: GAO analysis of DCO data.
OEMs have given too much control to tier 1 suppliers
Suppliers do not have the sufficient program management skills
Outsourcing to low-cost countries has made OEMs vulnerable to supply chain complexities
Globalization of supply base is necessary — needs more investment and technology to gain visibility and accuracy
Consolidation of supply decreases competition
-cost 18.1%18.5%
22.4% 30.7%
10.2%
Figure 11: Major supply chain challenges 25

Aerospace & Defense Can we afford our own future? 13
Traditional view
Tier 3 Tier 2 Tier 1 OEM Customer
Information flow
Traditional view
Product flow
Integrated view
Tier 3 Tier 2 Tier 1 OEM Customer
Information flow
Info
rmat
ion
flo
w
Product flow
Supply Chain characteristics
Linear•
Power concentrated within one key node •(e.g., OEM)
Distinct roles/business models for each player•
Distinctive tradeoff between cost and service levels•
Sequential/hierarchical management•
Supply Network characteristics
Multi-dimensional•
OEM has multiple chains-product, experimental and •aftermarket
Power unevenly distributed across network nodes•
Multiple roles/business models for each player•
Simultaneous service/cost improvement•
Multi-tier interaction, points of flexibility•
Figure 12: Today’s supply chains are multi-dimensional and complex
the work is contracted to U.S. suppliers due to security requirements.
Under the traditional supply chain model, the OEM was at the center of the action and every supplier had a distinct and narrowly defined role. But in today’s multi-dimensional supply chain, suppliers play a much larger role and often interact directly with each other (Figure 12).
This new supply chain model has the potential to be more efficient; however, it is also more complex and harder to control. Increased reliance creates greater risk, which requires greater oversight and program management. Yet the necessary oversight and management does not always happen. Also, lower tier suppliers tend to have less robust capabilities for managing programs and risk.

14
Politics
The aerospace industry is synonymous with prestige, power and politics. Nations compete hard to win manufacturing contracts in order to increase their industrial base and create high tech employment. At the same time, individual politicians lobby for factories in their local districts. Although the resulting decisions might be politically expedient, they often fail to produce the most efficient results. For example, a European next-generation fighter program has multiple locations for parts production, subassembly, and final assembly – an approach that has more to do with the politics of where jobs are located, rather than trying to optimize supply chain performance. Similarly, schedule delays for
“DoD’s flawed funding process is largely driven by decision makers’ willingness to accept unrealistic cost estimates and DoD’s commitment to more programs than it can support.” – GAO 26
a large commercial aircraft program were at least partly caused by the fact that factories in Germany and France were using different parts design and software tools.
One of the biggest problems is a flawed funding process based on unrealistic cost estimates. Most programs are funded and launched while there is still significant uncertainty about everything from systems and technologies to integration, interoperability, and supply chain requirements. This lack of certainty and knowledge makes it difficult or impossible to make informed funding decisions, which often leads to cost overruns and schedule delays.
Figure 13: Quantity reductions lead to sharply higher unit costs 27
Baseline # units
Adjusted # units
% Change
Baseline unit cost ($M)
Adjusted unit cost ($M)
Unit cost increase ($M)
Unit cost increase %
1980’s
Strategic missile 845 561 (34) 31.4 47.0 15.6 50
Helicopter 578 382 (34) 2.9 5.8 2.9 100
1990s
Launch vehicle 181 138 (24) 72.5 186.0 113.5 157
Helicopter 758 671 (11) 7.5 14.6 7.1 95
2000s
Satellite 6 4 (33) 923.0 2,340.8 1,471.8 154
Transport aircraft modernization
519 222 (57) 6.4 20.3 13.9 217
(All $ figures are in constant baseline year dollars. Program status based on most recent or final reports as published in “Selected Acquisition
Reports.”)

Aerospace & Defense Can we afford our own future? 15
Another problem is that DoD programs generally span multiple years, yet congressional budgets are approved annually. As a consequence, approved programs are forced to re-justify themselves every year. In the process, Congress often decides to cut the number of program units in order to control the program budget. This reduced order volume sends unit costs spiraling higher
0.0%
5.0%
10.0%
15.0%
20.0%
25.0%
30.0%
35.0%
40.0%
45.0%
1993 1998 2003 2008 2013 2018
Year
Ave
rag
e p
erce
nt
incr
ease
in
real
un
it c
ost
rel
ativ
e to
bas
elin
e
y = 0.005926x – 11.546899R2 = 0.421306
Figure 14: Unit costs are rising 28
(Note: analysis based on real baseline year dollars)
because upfront development costs are now spread across fewer units (Figure 13). In cases like these, if Congress had known how high the final cost-per-unit would be, it might not have funded the programs in the first place.
Based on Deloitte’s analysis of DoD data (Figure 14), the average percentage increase in unit cost relative to baseline jumped from 28.4% in 1993 to the current 31.2% in 2007 and is projected to reach 41.2% by 2018.

16
Solutions and recommended practices
Over the past three years, Congress has enacted legislation which, if followed, could instill more discipline into the front-end of the acquisition process. One key element of this legislation requires that specific levels of knowledge be demonstrated at critical decision points early in the acquisition process – before programs enter the technology or system development phase. Another key element requires DoD to report on strategies for balancing allocation of funds and other resources among major programs, and to identify strategies for enhancing the role of program managers in carrying out programs.
GAO reports state that improved weapon program outcomes require discipline, accountability, and fundamental changes in the acquisition environment. The reports indicate that DoD does not commit full funding to develop major weapon systems when the programs are initiated, despite a policy to do so. The GAO believes that a knowledge-based approach could improve major weapon system program outcomes. Key activities to help improve the situation are as follows:
• DevelopingandimplementingastrategytobringDoD’scurrentportfoliointobalancebyaligning the number of programs – and the cost and schedule of these programs – with available resources.
• Requiringthatallnewprogramshavemanageabledevelopmentcycles,realisticcostestimates,and planned and programmed full funding for the entire development cycle.
• Requiringallprogramcostestimatesatkeyfundingmilestonesbereportedasarangeoflikelycosts that include the associated levels of risk and uncertainty.
In addition to the GAO recommendations, the Acquisition Reform Working Group has provided Congress with a wish list to help guide lawmakers as they draft defense authorization legislation for fiscal years to come. One of their recommendations is to develop a “new management frame of reference” for creating “synergy rather than friction” in the blended government/contractor workforce. They believe this frame of reference should account for the “new realities of Government procurement and the role that both contractors and civilian employees must play to achieve the Government’s mission.”Government’s mission.”
According to former U.S. Comptroller General David M. Walker: “At this time DoD is simply not positioned to deliver high quality products in a timely and cost-efficient fashion. DoD starts more weapons programs than it can afford and sustain, creating a competition for funding that encourages low-cost estimating, optimistic scheduling, over promising, and suppressing of bad
news. Invariably, with too many programs in its portfolio, DoD and the Congress are forced to continually shift funds to and from programs – undermining well-performing programs to pay for poorly performing ones29.”

Aerospace & Defense Can we afford our own future? 17
Program management challenges
The A&D industry has turned in spectacular program management performance in the past. For example, President Kennedy announced that, within a decade, the United States would land a man on the moon – a program that was able to meet its goal by July 1969. However, the aforementioned challenges – technology complexity, talent shortages, supply chain diseconomies, and political factors – make the task of managing program budgets and schedules extraordinarily difficult.
Moreover, our detailed analysis of DoD data shows that the program management problem is getting worse. Since 1989, program management activities such as planning, sourcing, assurance, staffing, finance and integration have played an increasing role in driving budget overruns (Figure 15).
Figure 15: Inadequate program management contributes to overruns 30
(Note: analysis based on real baseline year dollars)
0.0%
2.0%
4.0%
6.0%
8.0%
10.0%
12.0%
14.0%
16.0%
18.0%
1993 1995 1997 1999 2001 2003 2005 2007
Year
Per
cen
t o
verr
un
rel
ativ
e to
bas
elin
e at
trib
uta
ble
to
pro
gra
m m
anag
emen
t
y = 0.006982x – 13.852200R 2 = 0.709526

18
Figure 16: A vicious cycle of budget overruns 31
Budget andProgram Instability
UnpredictableProgram Cost,
Schedule,Performance
Leadership Loses
Confidence inAcquisition
System
MoreIntervention
More OversightApplied
Budget, Schedule
RequirementsAdjustments
Made
1. Unstable funding
2. Optimistic planning
3. Conflicting priorities
4. Limited foresight
Programs often run into trouble when optimistic scenarios are used as baselines in order to win approval. In addition, technical, functional and financial risks may not be identified, integrated into schedules and managed effectively. These challenges create a vicious cycle of sub-par program performance that costs shareholders and tax-payers dearly (Figure 16).
DoD program management is a complex problem with many dimensions. Specific challenges include32:
DoD relies heavily on outside contractors •to perform roles that have in the past been performed by government employees. This raises questions about DoD’s capability to manage the affordability requirement.
Frequent program manager turnover •occurs during the system development and demonstration (SDD) phase. Since March 2001, the average program manager tenure on 39 major acquisition programs was 17 months – less than half of what is prescribed by DoD policy. This creates problems with learning curve, continuity and accountability.
Unsettled program requirements create •significant turbulence. Managers rely heavily on assumptions about system requirements, technology, and design maturity, which are consistently too optimistic.
DoD program managers are not •empowered to make go/no-go decisions. Program managers generally have little control over funding, cannot veto new requirements, and have only minimal authority over staffing.

Aerospace & Defense Can we afford our own future? 19
Funding constraints contribute to cost •overruns. Schedules are extended and quantities are reduced, which drives unit costs higher, as described earlier.
Risk management of regulatory compliance is key. Defense contractors are already subject to numerous regulatory, legal, and contractual requirements. However, Congress is providing increased oversight and requiring greater accountability in contracting. It is also increasing the disclosure requirements for overpayment and fraud. Pentagon auditors continue to increase their focus on cost and financial reporting systems, and are swift to suspend unsupported costs from billings. They are also placing increased emphasis on fraud indicators. These changes have
Figure 17: Matching costs with value received (Earned Value Management) 34
Reportingcut - off date
Total budgeted costMgt resBudget atcompletion
Projectedoverrun
ProjectedSlippage
Actuals
Plan
Earnedvalue
Reschedulevariance
Costvariance
Estimated costat completion
Do
llars
Time
consequences for program management throughout the entire contract life cycle.
Looking ahead, the Director of Defense Procurement recently published a memo promoting the use of earned value measurement requirements and reporting33. Earned Value Management (EVM) provides program managers with accurate, reliable, and timely feedback on cost and schedule performance throughout the lifecycle of their program (Figure 17). This would enable program managers to resolve issues before they become major problems.
This earned value approach is one of the defense industry’s most useful program management tools, and is now mandatory for cost and incentive contracts of $20 million or more.

20
Solutions and recommended practices
Defense contractors can create more value and manage risk more effectively by becoming “risk intelligent”. Key activities include:
• Defenseacquisitionauthoritiesneedtounderstandandguardagainst“lowbid”scenarios,where due to immature requirements specifications or lack of skill and talent, source selection awards turn out to be “change order” problems
• Budgetsandschedulesneedtocontainandbecertifiedas“risktolerant”;i.e.,enoughslackand contingency time is included to mitigate financial, operational, funding and human resource risks
• Establishingclearperformancegoalspriortoprogramstartup.Applyingappropriatemonitoring processes to report effectiveness and efficiency.
• Establishinganenterprise-widedefinitionofrisk.Designing,implementingandmaintainingan effective risk management program. Top executives set the tone, design, direction, and metrics; however, risk management should permeate all layers of the organization.
• Definingclearrolesandresponsibilities,accountability,andauthorityformanagingprogramcosts and schedules. Inside the organization, establishing close coordination between multiple supporting functions, executive management, and the board. Outside the organization, being sure to involve government customers and subcontractors.
• Implementingacommonriskframeworkthatisconsistentwiththeorganization’sriskobjectives and strategies.
• Owningtheriskatthebusinessunitand/ordepartmentlevel.Businessunitsandfunctionsshould use the framework to decide which opportunities to pursue – and which hazards to avoid – rather than unilaterally “betting the farm”.
• Providingmanagementandgoverningbodieswithimprovedtransparencyintotheorganization’s risk management practices. Executives and the Board should keep risk on the agenda and require timely information from operations and other supporting functions for critical decisions.
• Ensuringtheoverallriskprogramhasadequatesupport.Certainfunctions(e.g.,legal,IT,HR, Finance) should not just own risk, but also help other parts of the business manage risk effectively. Some organizations are using their internal auditors and compliance functions not just for assurance, but also for anticipating future risks, identifying inefficiencies, and finding ways to use risk management to improve profitability.
In addition, section 853 of the Defense Authorization Act for 2007 addresses the issues of program manager empowerment and accountability. The act requires the Secretary of Defense to develop a strategy for enhancing the role of program managers in developing and carrying out defense
acquisition programs. Key focus areas for improvement include: training, career development, program management resources and support, and awards for successful accomplishment of program objectives. Such improvements are essential for improving program management effectiveness.

Aerospace & Defense Can we afford our own future? 21
Conclusion: Protecting the industry’s future
Program management and execution in the A&D industry is becoming a problem that is simply too big to ignore. Business as usual will contribute to a fundamental breakdown of the integrity of the defense acquisition process that is so vital to maintaining global security. The GAO reports average cost overruns of 26 percent, and our analysis suggests that if significant action is not taken that figure could exceed 46 percent in ten years.
Acquisition problems in A&D are nothing new. Over the years, countless reports, policy studies, Congressional hearings, and legislative initiatives have tried to address the problem. But given the current economic crisis – and our nation’s competing budget priorities – it is very likely that the DoD and
A&D industry will be forced to set priorities and make difficult trade-offs about what they can really afford. What is needed is not more of the same, but nothing less than a transformational change.
Tackling this challenge will require a shared effort from everyone involved. As noted earlier, the DoD, armed services, defense contractors, and Congress all have specific opportunities to improve the acquisition process and keep budget overruns in check. Unless all parties work together to address the root causes of the problem, the A&D industry may be unable to afford its own future. Given our historic achievements in aerospace and defense, we are comforted that this is a challenge the industry can tackle successfully.

22
For more information, contact:
Tom Captain
Vice Chairman, Global and U.S. Aerospace & Defense Leader
Deloitte LLP
+1 206 716 6452
This publication contains general information only and is based on the experiences and research of Deloitte practitioners. Deloitte is not, by means of this publication, rendering business, financial, investment, or other professional advice or services. This publication is not a substitute for such professional advice or services, nor should it be used as a basis for any decision or action that may affect your business. Before making any decision or taking any action that may affect your business, you should consult a qualified professional advisor. Deloitte, its affiliates, and related entities shall not be responsible for any loss sustained by any person who relies on this publication.

Aerospace & Defense Can we afford our own future? 23
Endnotes
1 “U.S. defense market seen facing rising protectionism”, Reuters, November 3, 2008
2 GAO Report to Congressional Committees (GAO-08-467SP), “Defense Acquisitions: Assessments of Selected Weapon Programs”, March 2008
3 Deloitte webcast, “Why are Aerospace Programs Over Budget and Behind Schedule – and What Can Be Done?”, October 9, 2008
4 Associated Press, 10/30/08, “Pentagon Acquisition Chief: Budget Cuts “Painful”
5 American Forces Press Service, 6/3/08, “Pentagon Seeks to Limit Procurement Cost Growth, Official Says”
6 Selected Acquisition Reports (DoD), Deloitte Analysis
7 GAO Report to Congressional Committees (GAO-08-467SP), “Defense Acquisitions: Assessments of Selected Weapon Programs”, March 2008
8 Selected Acquisition Reports (DoD), Deloitte Analysis. The percent overrun in the chart is relative to the total baseline budget. It does not refer to a percentage of the overrun, itself.
9 Various Sources, Deloitte Analysis
10 NASA: Aerospace Commission: FINAL REPORT OF THE COMMISSION ON THE FUTURE OF THE UNITED STATES AEROSPACE INDUSTRY, 2002, Ch. 8, Workforce:Launch the Future
11 “Is America Falling Off the Flat Earth?”, Norman R. Augustine, Chair, Rising Above the Gathering Storm Committee, National Academy of Sciences, National Academy of Engineering, and Institute of Medicine of the National Academies, 2007
12 Deloitte webcast, “Why are Aerospace Programs Over Budget and Behind Schedule – and What Can Be Done?”, October 9, 2008
13 The Aerospace Corp. 2008 publication. “Perspectives on NASA Mission Cost and Schedule Performance Trends” (note: Complexity Index is composite based on performance, mass, power and technology choices)
14 Deloitte webcast, “Why are Aerospace Programs Over Budget and Behind Schedule – and What Can Be Done?”, October 9, 2008
15 Department of Defense Acquisition, Technology and Logistics, “AT&L Human Capital Strategic Plan v 3.0”, 2007
16 U.S. Congress, Interagency Aerospace Revitalization Task Force, Public Law 109-420—Dec. 20, 2006
17 National Science Foundation, “Science and Engineering Workforce”, 2002
18 International Trade Administration, Commission on the Future of the United States Aerospace Industry Final Report, 2002
19 National Science Board, Science and Engineering Indicators 2006

24
20 “Is America Falling Off the Flat Earth?”, Norman R. Augustine, Chair, Rising Above the Gathering Storm Committee, National Academy of Sciences, National Academy of Engineering, and Institute of Medicine of the National Academies, 2007
21 MIT Careers Office Annual Graduating Student Survey Report, 2007
22 RAND, “Maintaining Future Military Aircraft Design Capability” 2006
23 New York Times, “Pentagon Battles a Brain Drain”, June 25, 2008
24 “Is America Falling Off the Flat Earth?”, Norman R. Augustine, Chair, Rising Above the Gathering Storm Committee, National Academy of Sciences, National Academy of Engineering, and Institute of Medicine of the National Academies, 2007
25 ibid
26 GAO Report to the Committee Services, U.S. Senate, “Defense Acquisitions: A Knowledge-Based Funding Approach Could Improve Major Weapon System Program Outcomes”, GAO-08-619, July 2008
27 Selected Acquisition Reports (DoD), Deloitte Analysis
28 Selected Acquisition Reports (DoD), Deloitte Analysis
29 GAO Report, “Actions Needed to Get Better Results on Weapons Systems Investments”, GAO-06-585T, April 2006
30 Selected Acquisition Reports (DoD), Deloitte Analysis. The percent overrun in the chart is relative to the total baseline budget. It does not refer to a percentage of the overrun, itself.
31 Defense Acquisition Performance Assessment Report, January 2006, GAO, “Defense Acquisitions: Risk of Annual Assessment of DoD Weapon Programs” GAO-08-674T, April 29, 2008;
32 GAO, “Defense Acquisitions: Better Weapon Program Outcomes Require Discipline, Accountability, and Fundamental Changes in the Acquisition Environment” GAO-08-782T, June 3, 2008; GAO “Best Practices: Increased Focus on Requirements and Oversight Needed to Improve DoD’s Acquisition Environment and Weapon System Quality” GAO-08-294 February 2008; GAO: “Defense Acquisitions: A Knowledge-Based Funding Approach Could Improve Major Weapon System Program Outcomes” GAO-08-619, July 2008
33 “DoD struggles with early warning”, Matthew Weigelt, Federal Computer Week, August 29, 2008
34 NASA - Earned Value Management Chart: evm.nasa.gov/images/key_data.gif

Aerospace & Defense Can we afford our own future? 25

Copyright © 2009 Deloitte Development LLC. All rights reserved.Member of Deloitte Touche Tohmatsu