why are many co-ops failing? - commonwealth fund...why are many co-ops failing? how new nonprofit...
TRANSCRIPT
Why Are Many CO-OPs Failing?
How New Nonprofit Health Plans Have Responded to Market Competition
Sabrina Corlette, Sean Miskell, Julia Lerche, and Justin Giovannelli
DECEMBER 2015
TheCOMMONWEALTH FUND

The Commonwealth Fund, among the first private foundations started by a woman philanthropist—Anna M. Harkness—was established in 1918 with the broad charge to enhance the common good.
The mission of The Commonwealth Fund is to promote a high-performing health care system that achieves better access, improved quality, and greater efficiency, particularly for society’s most vulnerable, including low-income people, the uninsured, minority Americans, young children, and elderly adults.
The Fund carries out this mandate by supporting independent research on health care issues and making grants to improve health care practice and policy. An international program in health policy is designed to stimulate innovative policies and practices in the United States and other industrialized countries.
TheCOMMONWEALTH FUND
Why Are Many CO-OPs Failing? How New Nonprofit Health Plans Have Responded to Market CompetitionSabrina Corlette, Sean Miskell, Julia Lerche, and Justin Giovannelli
DECEMBER 2015
ABSTRACTThe Affordable Care Act (ACA) created the Consumer Operated and Oriented Plan (CO-OP) Program to provide
consumer-focused health insurance options. But the CO-OP experience to date reveals factors that limit market
competition. This report considers the challenges that CO-OPs have faced through analysis of plan, pricing, and
enrollment data for six CO-OPs. We also interviewed CO-OP executives and experts to better understand the market
assumptions and strategies of these new companies. We describe how CO-OPs responded to the prohibition on using
federal loans for marketing, problems associated with outsourcing health plan functions, CO-OP plan design and
pricing strategies, dynamics of both high and low enrollment, and challenges related to the ACA’s premium stabilization
programs. We conclude by highlighting the role of federal and state policy decisions in adding to rather than reducing
barriers to market entry for CO-OPs.
Support for this research was provided by The Commonwealth Fund. The views presented here are those of the authors and not necessarily those of The Commonwealth Fund or its directors, officers, or staff. To learn more about new publications when they become available, visit the Fund’s website and register to receive email alerts. Commonwealth Fund pub. 1847.
CONTENTS
LIST OF EXHIBITS 5
ABOUT THE AUTHORS 6
ACKNOWLEDGMENTS 6
EXECUTIVE SUMMARY 7
BACKGROUND 9
Beginnings: From Concept to Federal Program 9
Bumps in the Road: Policy Barriers to Competition 9
Revised Expectations 10
About This Study 11
RESEARCH FINDINGS 12
Preparing to Launch: Key Start-up Challenges and Early Decisions 12
Outsourcing Key Services: A Blessing and a Curse 12
Marketing: Getting Creative 13
Lessons of Benefit Design: Good Guys Finish Last 13
Market Dynamics and Pricing Strategies: The Goldilocks Problem 14
The Enrollment Roller Coaster: The Risks of High vs. Low Enrollment 16
The ACA’s Premium Stabilization Programs 16
Adjusting to Market Conditions: Recalibrating in 2015 and 2016 18
POLICY DISCUSSION 20
APPENDIX A. 2014 CO-OP Enrollment: Actual vs. Projected 21
LIST OF EXHIBITS
Exhibit 1 Key Federal Policy Choices Affecting the CO-OPs’ Odds of Success
Exhibit 2 Status of CO-OPs Launched Under the Affordable Care Act, October 2015
Exhibit 3 Study State CO-OPs Offering a Platinum-Level Plan, 2014–16
Exhibit 4 Premiums for Lowest-Cost Silver Plan Compared to Lowest-Cost CO-OP Plan
Exhibit 5 Actual vs. Projected CO-OP Individual and Group Enrollment as of Dec. 31, 2014
Exhibit 6 The ACA’s Premium Stabilization Programs
Exhibit 7 2014 Benefit Year Receivables and Payments for Six CO-OPs under the ACA’s Premium Stabilization Programs
Exhibit 8 Change in Premiums for Lowest-Priced CO-OP Plan, by Metal Level, 2014–15
Exhibit 9 Total Enrollment in CO-OP Plans, On and Off the Marketplaces, 2014–15
Exhibit 10 2016 Proposed Rate Increases
Appendix A 2014 CO-OP Enrollment: Actual vs. Projected
6 Why Are Many Co-Ops Failing? How New Nonprofit Health Plans Have Responded to Market Competition
ABOUT THE AUTHORS
Sabrina Corlette, J.D., is a research professor and project director at Georgetown University’s Center on Health Insurance Reforms. She studies health insurance and health insurance markets. Previously, she was director of health policy at the National Partnership for Women & Families and served as a health care attorney at the law firm Hogan Lovells. She received her J.D. with high honors from the University of Texas at Austin and her A.B. from Harvard University.
Sean Miskell, M.A., M.P.A., is a research fellow at both Georgetown University’s Center on Health Insurance Reforms and the Center for Children and Families, where he conducts research on public and private health coverage and their intersection. Sean is also a Ph.D. candidate in political science at the Maxwell School at Syracuse University. In addi-tion to his doctoral work, Sean earned a master’s degree in political science at Syracuse, as well as a master’s in public administration from Cornell University.
Julia Lerche, FSA, MAAA, M.S.P.H., was formerly a senior consulting actuary at Wakely Consulting Group with a focus on assisting public-sector clients with implementation of the Affordable Care Act. She has since returned to the North Carolina Department of Health and Human Services, where she previously worked. Immediately prior to joining Wakely, Julia was a health actuary at the North Carolina Department of Insurance. Julia also holds a master’s degree in public health from University of North Carolina-Chapel Hill and has worked for the North Carolina Institute of Medicine on issues related to access to care for underserved populations.
Justin Giovannelli, J.D., M.P.P., is an associate research professor at the Georgetown University Health Policy Institute’s Center on Health Insurance Reforms. His research focuses primarily on the implementation of the Affordable Care Act’s market reforms and health insurance exchanges at the federal and state levels. Giovannelli received his law degree from the New York University School of Law and his master’s degree in public policy from Georgetown’s Public Policy Institute.
ACKNOWLEDGMENTS
The authors thank the CO-OP executives and health policy experts who participated in this study by sharing their insights and experiences. We also thank Allen Feezor, Stephen Ringlee, and Barbara Yondorf for their thoughtful review and comments and Emily Curran for her research support.
Editorial support was provided by Martha Hostetter.
www.commonwealthfund.org 7
EXECUTIVE SUMMARY
In addition to instituting sweeping reforms designed to improve consumers’ access to affordable, comprehensive health insurance, the Affordable Care Act (ACA) created the Consumer Operated and Oriented Plan (CO-OP) Program to give consumers the option to choose a nonprofit insurer with a strong consumer focus. Of 23 CO-OPs launched, all but two have fallen short of their enrollment or profitability projections. Twelve plans have or are about to shut down, and two more have capped enrollment for 2016. The experiences of these fledgling companies reveal the many factors that limit market competition. We examined plan, pricing, and enrollment data for six CO-OPs located in Iowa and Nebraska (IA/NE), Kentucky, Maine, Maryland, Montana, and Tennessee. We supplemented this review with struc-tured interviews of senior CO-OP executives and other experts to gain insights on the market assumptions and strate-gies of these new companies.
Research FindingsCritical health plan functions. To meet the very short deadlines for filing rates and plans with state departments of insurance, CO-OPs were forced to outsource critical functions such as network design and claims processing. For example, among the six CO-OPs we studied, Maine’s CO-OP was the only one that did not “rent” all or part of a provider network from another insurance carrier. This kind of outsourcing limits CO-OPs’ ability to control costs and manage service quality. Renegotiating vendor contracts and building their own networks are top priorities for CO-OP leaders.
Marketing. The ACA prohibits CO-OPs from using federal start-up loans for marketing. Most CO-OP executives reported that the statutory restriction was a hindrance but not an insurmountable barrier. CO-OPs were creative with their marketing campaigns, raising funds from partners and taking advantage of community events to educate the public about the new marketplaces and their products.
Benefit design. A critical early decision for the CO-OPs was whether to offer the richest (platinum) level of coverage on the marketplaces. Of the six CO-OPs studied, half offered a platinum plan in their first year. But because their lower out-of-pocket costs make platinum plans attractive to consumers with significant health needs, these CO-OPs concluded that they attracted a sicker mix of enrollees than other plans. Of the three CO-OPs we studied that offered platinum plans in 2014, all subsequently reversed that decision.
Pricing strategies. Setting the initial and subsequent prices of their products may have been the most important deci-sions CO-OPs faced. However, unlike their competitors, CO-OPs lacked historical claims and market data to help them estimate their costs. The outcome of the CO-OPs’ pricing strategy often depended on the pricing behavior of their largest competitor, usually the Blue Cross Blue Shield (BCBS) plan. CO-OPs that priced their plans gener-ally lower than the BCBS carrier gained significant market share; those with plans generally priced higher than the BCBS carrier had significantly less enrollment than projected.
High vs. low enrollment. Over half of the CO-OPs fell short of their enrollment targets in 2014, making it difficult for them to cover fixed costs and ultimately to generate the premium revenue to pay back their federal loan obliga-tions. However, CO-OPs with higher than expected enrollment faced grave challenges, too, as they struggled to build capacity under time pressure and manage cash flow.

8 Why Are Many Co-Ops Failing? How New Nonprofit Health Plans Have Responded to Market Competition
The ACA’s premium stabilization programs. The ACA includes three programs designed to help keep premiums sta-ble. These programs are particularly critical to the viability of new carriers with limited capital such as the CO-OPs. Yet the delays and lower-than-expected payments under these programs have worked against small insurers. For example, companies had to wait 21 months before receiving a payment.
Adjusting to market conditions. CO-OPs recalibrated pricing to reflect market positioning and enrollees’ health needs. Those with low enrollment in 2014 cut prices to capture market share in 2015; those with high enrollment—and higher than expected costs—increased premiums. By contrast, Maine’s CO-OP kept premiums relatively stable, reflecting their belief that they priced their plans appropriately in year one.
Policy DiscussionTwo years into the CO-OP program, more than half of these new nonprofit insurers have shut their doors. Eleven remain, and it is likely that some of these will continue to struggle. Even the most optimistic CO-OP executives acknowledge numerous challenges to their sustainability as a nonprofit coverage alternative for consumers. Some of these challenges are inherent to the health insurance industry and confront any new company looking to enter the market. However, other obstacles—resulting from policy decisions made during implementation of the ACA—have made business harder for CO-OPs. Policymakers often talk about how important it is to encourage greater com-petition in health insurance markets and provide consumers with more choices. But actually delivering on that goal requires a much greater investment of financial resources and political capital than has been made to date.
www.commonwealthfund.org 9
Why Are Many CO-OPs Failing? How New Nonprofit Health Plans Have Responded to Market Competition
BACKGROUND Beginnings: From Concept to Federal ProgramThe Affordable Care Act (ACA) made dramatic reforms of insurance markets designed to improve consumers’ access to affordable, comprehensive health coverage. The law also included provisions intended to enhance the competitive-ness of health insurance markets. The Consumer Operated and Oriented Plan (CO-OP) Program sought to increase competition among health plans and give consumers the option of a nonprofit insurer obligated to maintain “a strong consumer focus.”1 Proponents pointed to successful health insurance CO-OPs such as Group Health of Puget Sound and Health Partners in Minnesota as models. Both of these health plans offer consumers local, nonprofit insurance options and generally receive high marks for providing high-quality care through integrated service delivery.2
The ACA dedicated $6 billion in loans to facilitate the creation of nonprofit health insurers. To ensure the plans’ consumer orientation, the law requires a majority of each CO-OP’s board to be composed of plan members and for profits to be reinvested to the benefit of members. The program also sought to promote greater coordination of patient care by requiring that the U.S. Department of Health and Human Services (HHS) give priority for loan funds to CO-OPs with integrated care models.3
The program’s loan funds were critical for these start-up health plans to compete with established insurance carriers. Historically, the individual health insurance markets in most states have been highly concentrated, with just one or two insurers covering the majority of enrollees.4 One of the primary barriers to competition is the need for new companies to raise sufficient capital to meet state solvency standards. The law thus included two loan programs: start-up loans to help CO-OPs create the infrastructure necessary to operate an insurance company and solvency loans designed to meet state licensing standards.5
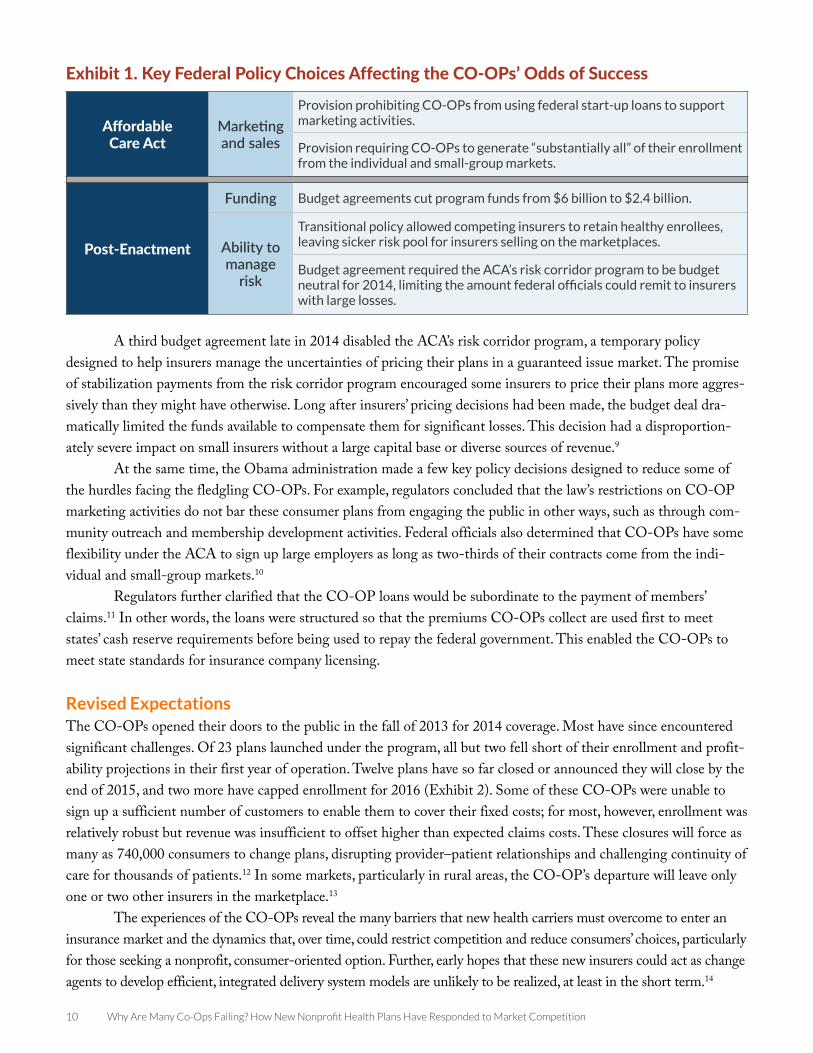
Bumps in the Road: Policy Barriers to CompetitionProvisions included in the ACA, as well as subsequent policy decisions made during implementation, erected barri-ers to the CO-OPs’ ability to compete (Exhibit 1). The law prohibits CO-OPs from using federal funds for market-ing and requires that “substantially all” business be derived from the individual and small-group markets.6 This latter requirement makes it harder for the CO-OPs to enter the large employer market, which tends to be a bigger and more stable source of revenue for insurers.7
During implementation of the program, federal policymakers made three key decisions that increased the chances that some CO-OPs would fail. First, two separate budget agreements with Congress slashed the program’s $6 billion allotment by almost two-thirds. This reduction both limited the total number of nonprofits in the pro-gram and the ability of HHS to support CO-OPs through early cash flow challenges.
Second, the administration allowed states to permit individuals and small employers to remain enrolled, for a transitional period, in the health insurance policies they had before the ACA reforms took effect. A great majority of states opted to allow these transitional policies.8 Many major insurers were thus able to retain members that had been screened based on their health status, making the risk pool for the new ACA-compliant plans offered by the CO-OPs sicker than expected. This policy was not implemented until after 2014 rates were set; for many companies that meant their rates would no longer be sufficient to cover claims.
10 Why Are Many Co-Ops Failing? How New Nonprofit Health Plans Have Responded to Market Competition
A third budget agreement late in 2014 disabled the ACA’s risk corridor program, a temporary policy designed to help insurers manage the uncertainties of pricing their plans in a guaranteed issue market. The promise of stabilization payments from the risk corridor program encouraged some insurers to price their plans more aggres-sively than they might have otherwise. Long after insurers’ pricing decisions had been made, the budget deal dra-matically limited the funds available to compensate them for significant losses. This decision had a disproportion-ately severe impact on small insurers without a large capital base or diverse sources of revenue.9
At the same time, the Obama administration made a few key policy decisions designed to reduce some of the hurdles facing the fledgling CO-OPs. For example, regulators concluded that the law’s restrictions on CO-OP marketing activities do not bar these consumer plans from engaging the public in other ways, such as through com-munity outreach and membership development activities. Federal officials also determined that CO-OPs have some flexibility under the ACA to sign up large employers as long as two-thirds of their contracts come from the indi-vidual and small-group markets.10
Regulators further clarified that the CO-OP loans would be subordinate to the payment of members’ claims.11 In other words, the loans were structured so that the premiums CO-OPs collect are used first to meet states’ cash reserve requirements before being used to repay the federal government. This enabled the CO-OPs to meet state standards for insurance company licensing.
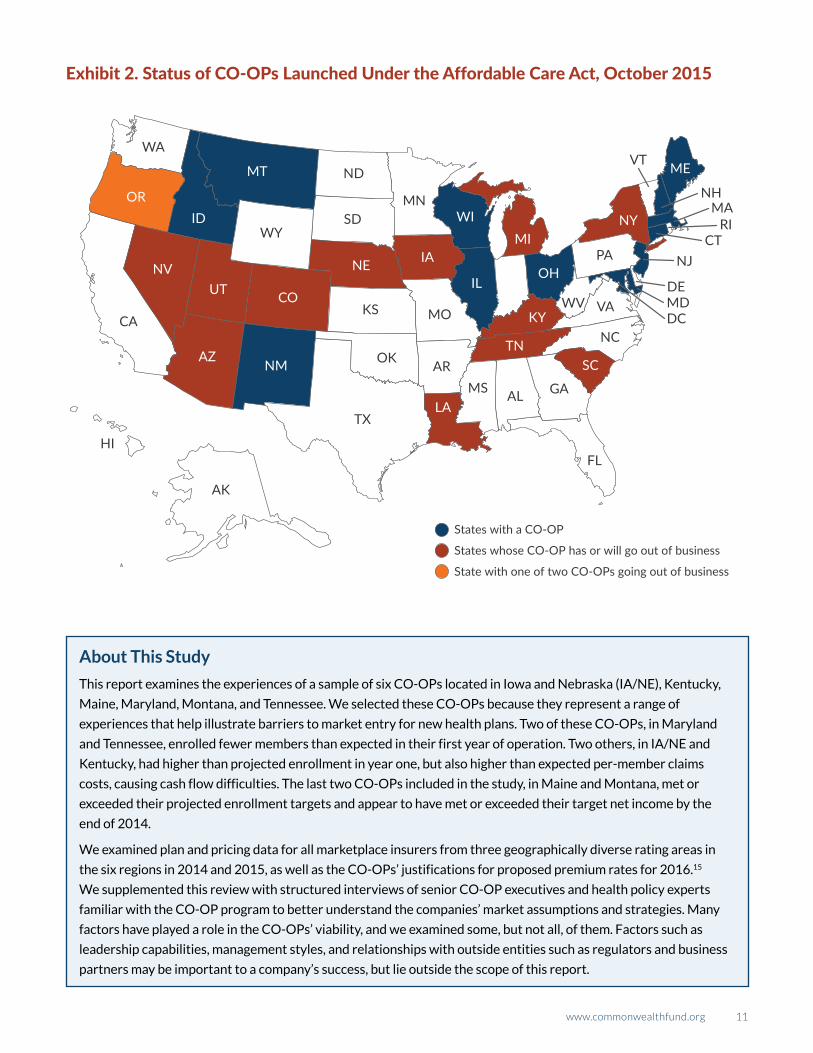
Revised ExpectationsThe CO-OPs opened their doors to the public in the fall of 2013 for 2014 coverage. Most have since encountered significant challenges. Of 23 plans launched under the program, all but two fell short of their enrollment and profit-ability projections in their first year of operation. Twelve plans have so far closed or announced they will close by the end of 2015, and two more have capped enrollment for 2016 (Exhibit 2). Some of these CO-OPs were unable to sign up a sufficient number of customers to enable them to cover their fixed costs; for most, however, enrollment was relatively robust but revenue was insufficient to offset higher than expected claims costs. These closures will force as many as 740,000 consumers to change plans, disrupting provider–patient relationships and challenging continuity of care for thousands of patients.12 In some markets, particularly in rural areas, the CO-OP’s departure will leave only one or two other insurers in the marketplace.13
The experiences of the CO-OPs reveal the many barriers that new health carriers must overcome to enter an insurance market and the dynamics that, over time, could restrict competition and reduce consumers’ choices, particularly for those seeking a nonprofit, consumer-oriented option. Further, early hopes that these new insurers could act as change agents to develop efficient, integrated delivery system models are unlikely to be realized, at least in the short term.14
Exhibit 1. Key Federal Policy Choices Affecting the CO-OPs’ Odds of Success
Affordable Care Act
Marketing and sales
Provision prohibiting CO-OPs from using federal start-up loans to support marketing activities.
Provision requiring CO-OPs to generate “substantially all” of their enrollment from the individual and small-group markets.
Post-Enactment
Funding Budget agreements cut program funds from $6 billion to $2.4 billion.
Ability to manage
risk
Transitional policy allowed competing insurers to retain healthy enrollees, leaving sicker risk pool for insurers selling on the marketplaces.
Budget agreement required the ACA’s risk corridor program to be budget neutral for 2014, limiting the amount federal officials could remit to insurers with large losses.
www.commonwealthfund.org 11
Exhibit 2. Status of CO-OPs Launched Under the Affordable Care Act, October 2015
States with a CO-OP
States whose CO-OP has or will go out of business
State with one of two CO-OPs going out of business
WA
WY
ND
MN
MO
ARMS AL GA
NC
VAWV
PA
VT
NHMA
RICT
NJ
DEMDDC
FL
SD
KS
TX
OK
CA
AK
HI
ORID
MT
NVUT
AZ
CO
NE IAMI
KY
SCTN
WI
ILOH
NY
ME
LA
NM
About This Study
This report examines the experiences of a sample of six CO-OPs located in Iowa and Nebraska (IA/NE), Kentucky,
Maine, Maryland, Montana, and Tennessee. We selected these CO-OPs because they represent a range of
experiences that help illustrate barriers to market entry for new health plans. Two of these CO-OPs, in Maryland
and Tennessee, enrolled fewer members than expected in their first year of operation. Two others, in IA/NE and
Kentucky, had higher than projected enrollment in year one, but also higher than expected per-member claims
costs, causing cash flow difficulties. The last two CO-OPs included in the study, in Maine and Montana, met or
exceeded their projected enrollment targets and appear to have met or exceeded their target net income by the
end of 2014.
We examined plan and pricing data for all marketplace insurers from three geographically diverse rating areas in
the six regions in 2014 and 2015, as well as the CO-OPs’ justifications for proposed premium rates for 2016.15
We supplemented this review with structured interviews of senior CO-OP executives and health policy experts
familiar with the CO-OP program to better understand the companies’ market assumptions and strategies. Many
factors have played a role in the CO-OPs’ viability, and we examined some, but not all, of them. Factors such as
leadership capabilities, management styles, and relationships with outside entities such as regulators and business
partners may be important to a company’s success, but lie outside the scope of this report.
12 Why Are Many Co-Ops Failing? How New Nonprofit Health Plans Have Responded to Market Competition
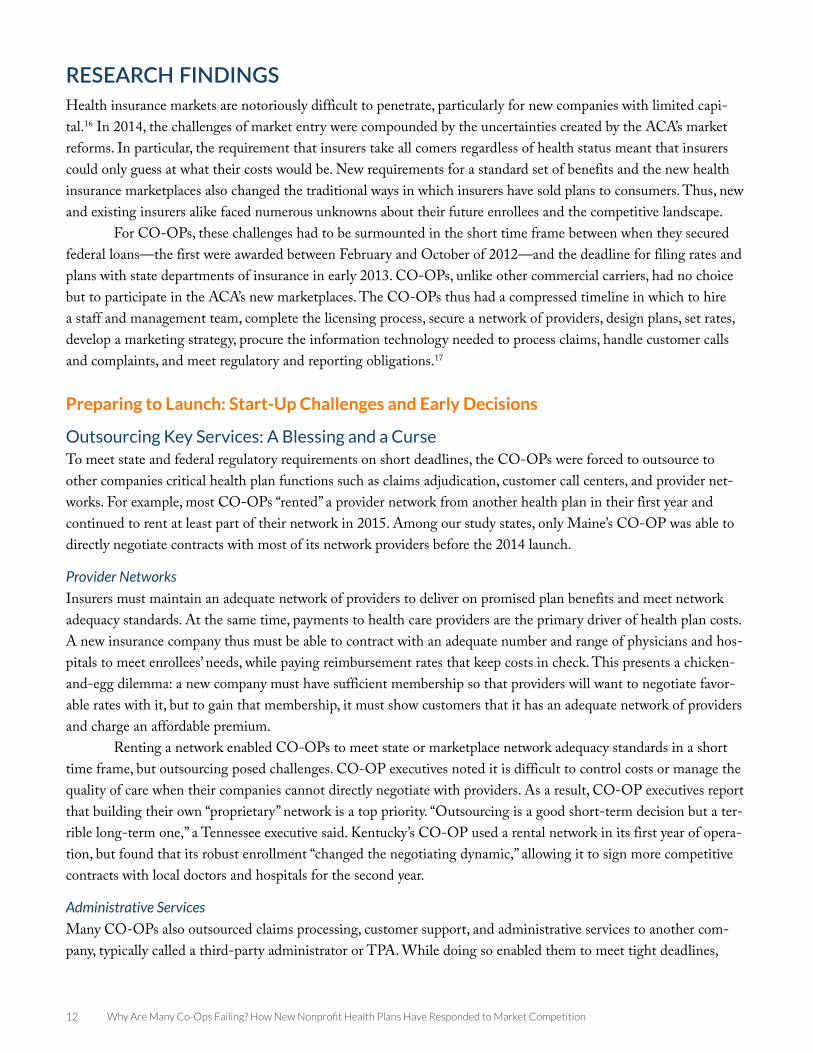
RESEARCH FINDINGSHealth insurance markets are notoriously difficult to penetrate, particularly for new companies with limited capi-tal.16 In 2014, the challenges of market entry were compounded by the uncertainties created by the ACA’s market reforms. In particular, the requirement that insurers take all comers regardless of health status meant that insurers could only guess at what their costs would be. New requirements for a standard set of benefits and the new health insurance marketplaces also changed the traditional ways in which insurers have sold plans to consumers. Thus, new and existing insurers alike faced numerous unknowns about their future enrollees and the competitive landscape.
For CO-OPs, these challenges had to be surmounted in the short time frame between when they secured federal loans—the first were awarded between February and October of 2012—and the deadline for filing rates and plans with state departments of insurance in early 2013. CO-OPs, unlike other commercial carriers, had no choice but to participate in the ACA’s new marketplaces. The CO-OPs thus had a compressed timeline in which to hire a staff and management team, complete the licensing process, secure a network of providers, design plans, set rates, develop a marketing strategy, procure the information technology needed to process claims, handle customer calls and complaints, and meet regulatory and reporting obligations.17
Preparing to Launch: Start-Up Challenges and Early Decisions
Outsourcing Key Services: A Blessing and a CurseTo meet state and federal regulatory requirements on short deadlines, the CO-OPs were forced to outsource to other companies critical health plan functions such as claims adjudication, customer call centers, and provider net-works. For example, most CO-OPs “rented” a provider network from another health plan in their first year and continued to rent at least part of their network in 2015. Among our study states, only Maine’s CO-OP was able to directly negotiate contracts with most of its network providers before the 2014 launch.
Provider NetworksInsurers must maintain an adequate network of providers to deliver on promised plan benefits and meet network adequacy standards. At the same time, payments to health care providers are the primary driver of health plan costs. A new insurance company thus must be able to contract with an adequate number and range of physicians and hos-pitals to meet enrollees’ needs, while paying reimbursement rates that keep costs in check. This presents a chicken-and-egg dilemma: a new company must have sufficient membership so that providers will want to negotiate favor-able rates with it, but to gain that membership, it must show customers that it has an adequate network of providers and charge an affordable premium.
Renting a network enabled CO-OPs to meet state or marketplace network adequacy standards in a short time frame, but outsourcing posed challenges. CO-OP executives noted it is difficult to control costs or manage the quality of care when their companies cannot directly negotiate with providers. As a result, CO-OP executives report that building their own “proprietary” network is a top priority. “Outsourcing is a good short-term decision but a ter-rible long-term one,” a Tennessee executive said. Kentucky’s CO-OP used a rental network in its first year of opera-tion, but found that its robust enrollment “changed the negotiating dynamic,” allowing it to sign more competitive contracts with local doctors and hospitals for the second year.
Administrative ServicesMany CO-OPs also outsourced claims processing, customer support, and administrative services to another com-pany, typically called a third-party administrator or TPA. While doing so enabled them to meet tight deadlines,

www.commonwealthfund.org 13
CO-OPs that did not pay close attention to contract terms later found that they had relinquished control over criti-cal plan functions for which they were ultimately accountable.
The CO-OPs we studied reported numerous challenges with their TPAs. One key problem was that while many TPAs have experience working with self-funded employer plans, they are less familiar with the fully insured market and the many regulatory requirements and compliance needs specific to those products. CO-OPs also reported that TPAs were overwhelmed during their first year of operation, causing high-profile delays in provider payments and customer service challenges. While several CO-OPs have hired, or are working toward hiring, a new TPA, respondents noted that many of their peers are in the middle of three-year contracts with their vendors, mak-ing a near-term transition difficult.
Marketing: Getting CreativeOne of the first hurdles CO-OPs had to overcome was their inability to use federal start-up funds to support mar-keting activities. This restriction was potentially quite significant. For any new company, but particularly for one try-ing to break into oligopolistic health insurance markets, developing and marketing a brand identity and convincing consumers to buy your product instead of your well-known competitor’s is essential to survival. In practice, however, most CO-OP executives with whom we spoke reported that the statutory prohibition was a hindrance but not an insurmountable barrier to success. One CO-OP official said that it forced his company to “get more creative” in its marketing campaigns. At least two CO-OPs were able to raise money for marketing from business affiliates, while all capitalized on flexibility in federal rules allowing them to spend start-up loans on “community and prospective member education” initiatives.18
A number of CO-OPs concluded that they needed to differentiate themselves from the dominant insurer in the market. Without a distinct brand, suggested one official, low prices would not be enough to compete. Therefore, the IA/NE CO-OP played up its “quirkiness” and highlighted its consumer-centric governance. Tennessee and Maine took similar tacks, emphasizing their consumer-focused missions and local roots. Maryland highlighted its unique delivery system model, built around concierge-style primary care. On the other hand, officials with Kentucky and Montana’s CO-OPs focused on the “basics” of launching an insurance company and chose not to dedicate time and resources to brand differentiation. “We just needed to turn the lights on and survive—we’re not going to be change agents in phase I,” an executive with Montana’s CO-OP told us.
Several CO-OPs acknowledged a need to develop better relationships with insurance brokers, who can help steer consumers and businesses to their health plans. While competitors leverage long-standing broker relationships to market their products, many CO-OPs relied primarily on the ACA’s health insurance marketplaces to sell plans. This put them at a disadvantage when many marketplaces had early glitches with their information technology sys-tems. It also limited their ability to penetrate the group market because most employers, including small businesses, use brokers to purchase their health plans.
Lessons of Benefit Design: Good Guys Finish LastIn addition to price and network, many consumers choose a plan based on the benefits it offers. While the ACA standardized important elements of benefit design, others remain subject to the discretion of insurers. For example, while all carriers participating in the marketplaces must offer plans at “silver” and “gold” levels, insurers can choose whether to sell additional plans that cover more of enrollees’ costs (platinum) or less (bronze).19 Similarly, while the ACA requires insurers to cover a prescribed set of benefit categories, insurers in most states have discretion over the enrollee cost-sharing associated with those benefits.
A critical early decision for the CO-OPs was whether to offer platinum-level coverage on the marketplaces. Because their lower out-of-pocket costs make platinum plans attractive to consumers with significant health needs,
14 Why Are Many Co-Ops Failing? How New Nonprofit Health Plans Have Responded to Market Competition
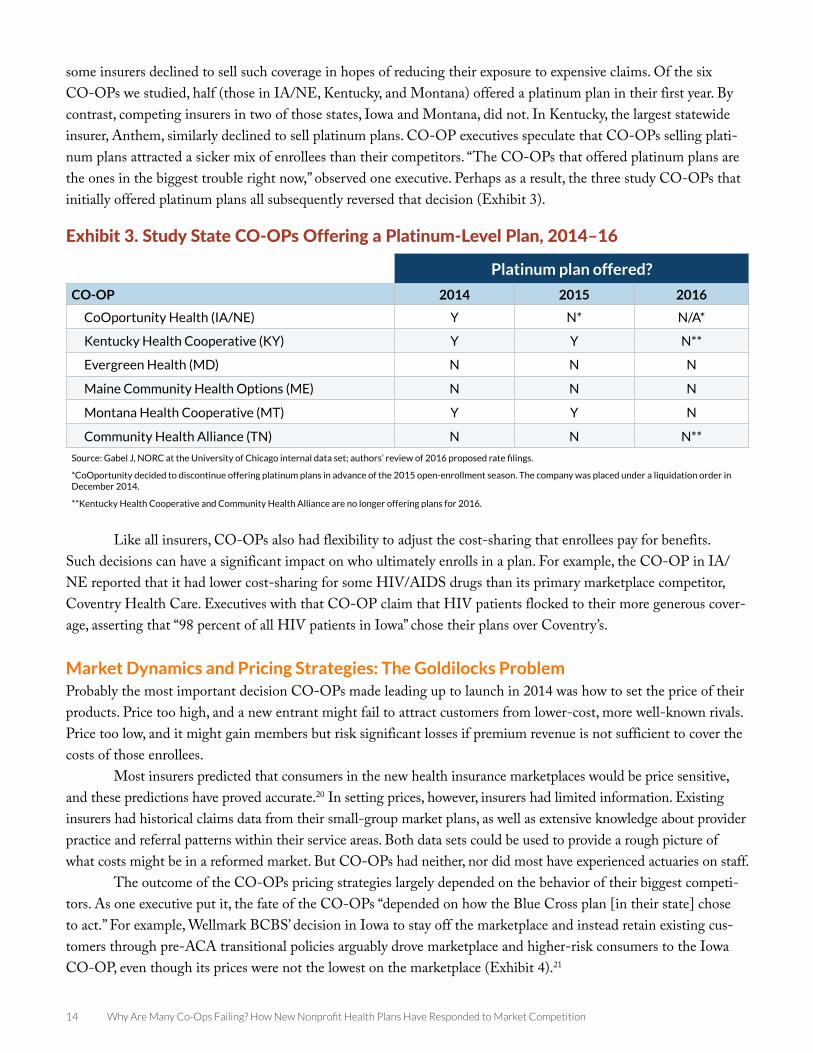
some insurers declined to sell such coverage in hopes of reducing their exposure to expensive claims. Of the six CO-OPs we studied, half (those in IA/NE, Kentucky, and Montana) offered a platinum plan in their first year. By contrast, competing insurers in two of those states, Iowa and Montana, did not. In Kentucky, the largest statewide insurer, Anthem, similarly declined to sell platinum plans. CO-OP executives speculate that CO-OPs selling plati-num plans attracted a sicker mix of enrollees than their competitors. “The CO-OPs that offered platinum plans are the ones in the biggest trouble right now,” observed one executive. Perhaps as a result, the three study CO-OPs that initially offered platinum plans all subsequently reversed that decision (Exhibit 3).
Like all insurers, CO-OPs also had flexibility to adjust the cost-sharing that enrollees pay for benefits. Such decisions can have a significant impact on who ultimately enrolls in a plan. For example, the CO-OP in IA/NE reported that it had lower cost-sharing for some HIV/AIDS drugs than its primary marketplace competitor, Coventry Health Care. Executives with that CO-OP claim that HIV patients flocked to their more generous cover-age, asserting that “98 percent of all HIV patients in Iowa” chose their plans over Coventry’s.
Market Dynamics and Pricing Strategies: The Goldilocks ProblemProbably the most important decision CO-OPs made leading up to launch in 2014 was how to set the price of their products. Price too high, and a new entrant might fail to attract customers from lower-cost, more well-known rivals. Price too low, and it might gain members but risk significant losses if premium revenue is not sufficient to cover the costs of those enrollees.
Most insurers predicted that consumers in the new health insurance marketplaces would be price sensitive, and these predictions have proved accurate.20 In setting prices, however, insurers had limited information. Existing insurers had historical claims data from their small-group market plans, as well as extensive knowledge about provider practice and referral patterns within their service areas. Both data sets could be used to provide a rough picture of what costs might be in a reformed market. But CO-OPs had neither, nor did most have experienced actuaries on staff.
The outcome of the CO-OPs pricing strategies largely depended on the behavior of their biggest competi-tors. As one executive put it, the fate of the CO-OPs “depended on how the Blue Cross plan [in their state] chose to act.” For example, Wellmark BCBS’ decision in Iowa to stay off the marketplace and instead retain existing cus-tomers through pre-ACA transitional policies arguably drove marketplace and higher-risk consumers to the Iowa CO-OP, even though its prices were not the lowest on the marketplace (Exhibit 4).21
Exhibit 3. Study State CO-OPs Offering a Platinum-Level Plan, 2014–16
Platinum plan offered?
CO-OP 2014 2015 2016
CoOportunity Health (IA/NE) Y N* N/A*
Kentucky Health Cooperative (KY) Y Y N**
Evergreen Health (MD) N N N
Maine Community Health Options (ME) N N N
Montana Health Cooperative (MT) Y Y N
Community Health Alliance (TN) N N N**
Source: Gabel J, NORC at the University of Chicago internal data set; authors’ review of 2016 proposed rate filings.
*CoOportunity decided to discontinue offering platinum plans in advance of the 2015 open-enrollment season. The company was placed under a liquidation order in December 2014.
**Kentucky Health Cooperative and Community Health Alliance are no longer offering plans for 2016.

www.commonwealthfund.org 15
Exhibit 4. Premiums for Lowest-Cost Silver Plan Compared to Lowest-Cost CO-OP Plan*
$0
$50
$100
$150
$200
$250
$300
$350
Iowa Kentucky Maryland Maine Montana Tennessee
Lowest cost available plan Lowest cost co-op plan
Source: J. Gabel, NORC at the University of Chicago internal data set.
*Premiums are for a 40-year-old nontobacco user from the largest urban rating area in each state.
The BCBS companies in Maine, Montana, and Kentucky participated in the marketplaces, but their plans on average were more expensive than the CO-OPs’ in 2014.22 As a result, the CO-OPs gained a significant share of the individual market. Kentucky’s CO-OP had 56,680 enrollees in 2014, almost double its projection, while Maine’s CO-OP picked up 39,742 enrollees, beating its estimate by over 250 percent.23 Conversely, BCBS plans in Maryland and Tennessee chose to participate in the marketplace and priced their plans to be among the low-est available. Faced with stiff price competition (and in the case of Maryland, a dysfunctional marketplace website), both CO-OPs attracted significantly fewer sign-ups than expected in 2014 (Exhibit 5).
Exhibit 5. Actual vs. Projected CO-OP Individual and Group Enrollment as of Dec. 31, 2014
CO-OPActual
enrollmentProjected
enrollmentPercentage of
projected enrollment
CoOportunity (IA/NE)79,762
(as of 6/30/14)*11,142 N/A
Kentucky Health Cooperative 56,680 30,929 183%
Evergreen Health Cooperative (MD) 11,694 32,556 36%
Maine Community Health Options 39,742 15,486 257%
Montana Health Cooperative 13,160 11,250 117%
Community Health Alliance (TN) 2,287 25,082 9%
Source: U.S. Department of Health and Human Services Office of Inspector General, Actual Enrollment and Profitability was Lower than Projections Made by the Consumer Operated and Oriented Plans and Might Affect their Ability to Repay Loans Provided under the Affordable Care Act, July 2015.
* In December 2014, the IA/NE CO-OP, CoOportunity Health, was placed under a liquidation order.
16 Why Are Many Co-Ops Failing? How New Nonprofit Health Plans Have Responded to Market Competition
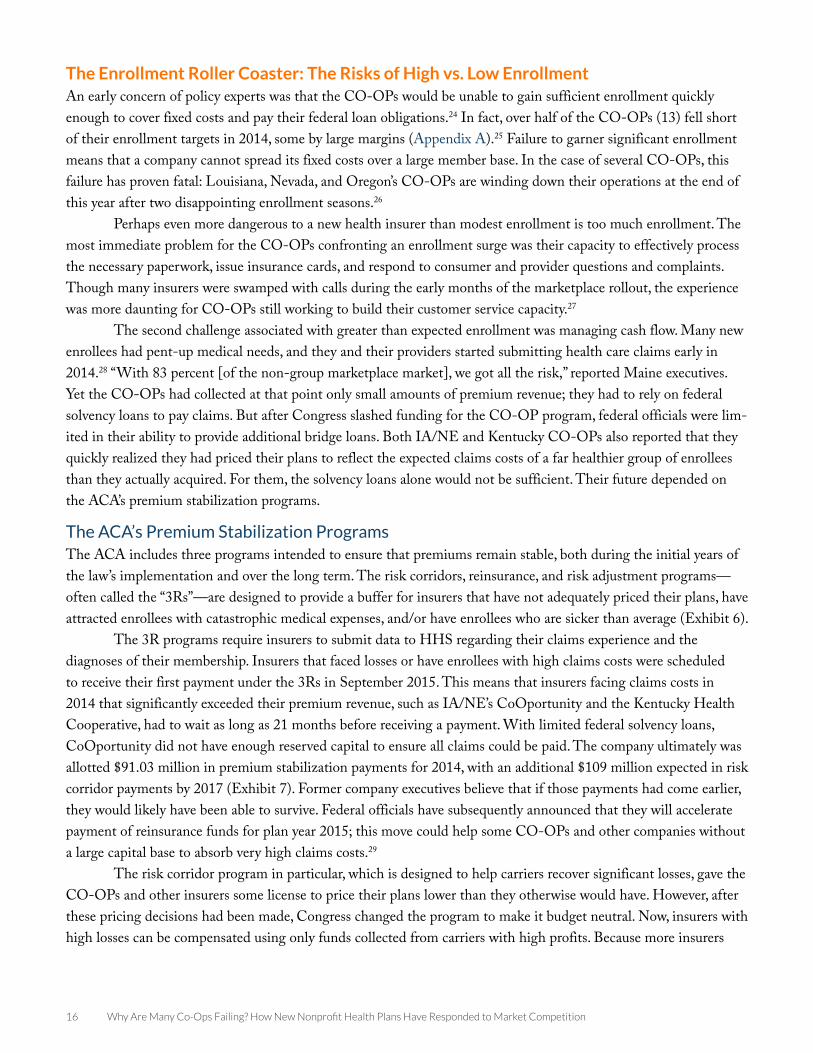
The Enrollment Roller Coaster: The Risks of High vs. Low EnrollmentAn early concern of policy experts was that the CO-OPs would be unable to gain sufficient enrollment quickly enough to cover fixed costs and pay their federal loan obligations.24 In fact, over half of the CO-OPs (13) fell short of their enrollment targets in 2014, some by large margins (Appendix A).25 Failure to garner significant enrollment means that a company cannot spread its fixed costs over a large member base. In the case of several CO-OPs, this failure has proven fatal: Louisiana, Nevada, and Oregon’s CO-OPs are winding down their operations at the end of this year after two disappointing enrollment seasons.26
Perhaps even more dangerous to a new health insurer than modest enrollment is too much enrollment. The most immediate problem for the CO-OPs confronting an enrollment surge was their capacity to effectively process the necessary paperwork, issue insurance cards, and respond to consumer and provider questions and complaints. Though many insurers were swamped with calls during the early months of the marketplace rollout, the experience was more daunting for CO-OPs still working to build their customer service capacity.27
The second challenge associated with greater than expected enrollment was managing cash flow. Many new enrollees had pent-up medical needs, and they and their providers started submitting health care claims early in 2014.28 “With 83 percent [of the non-group marketplace market], we got all the risk,” reported Maine executives. Yet the CO-OPs had collected at that point only small amounts of premium revenue; they had to rely on federal solvency loans to pay claims. But after Congress slashed funding for the CO-OP program, federal officials were lim-ited in their ability to provide additional bridge loans. Both IA/NE and Kentucky CO-OPs also reported that they quickly realized they had priced their plans to reflect the expected claims costs of a far healthier group of enrollees than they actually acquired. For them, the solvency loans alone would not be sufficient. Their future depended on the ACA’s premium stabilization programs.
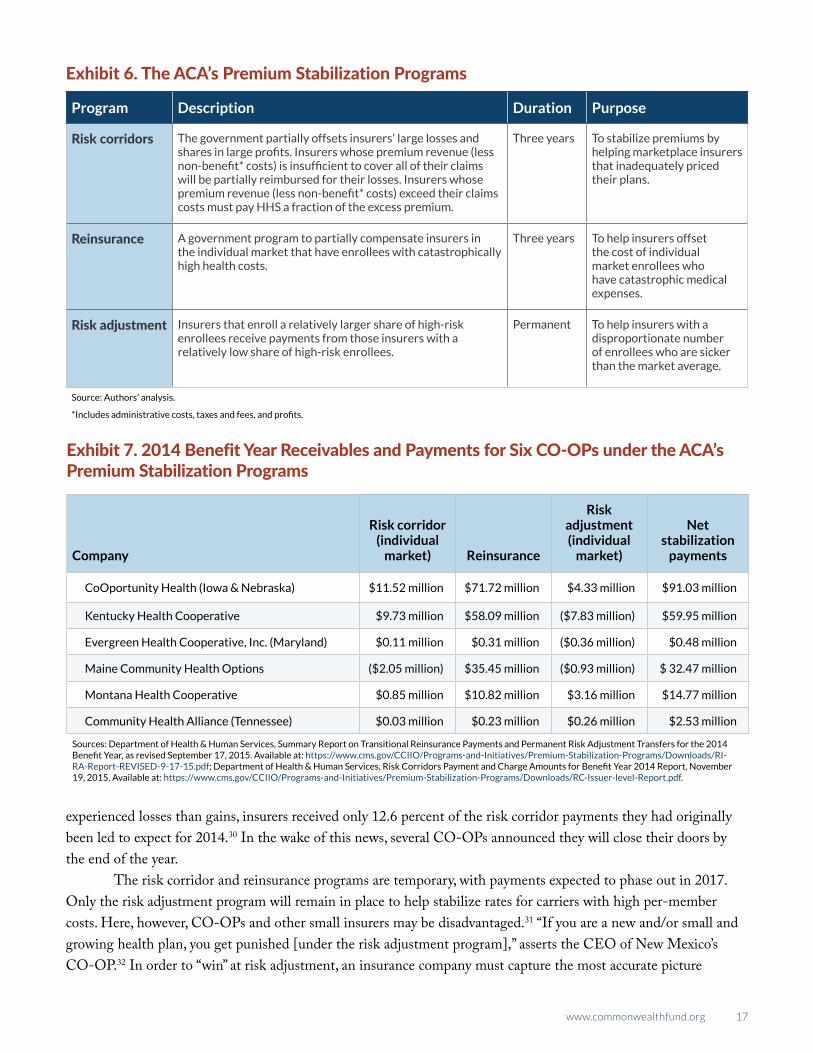
The ACA’s Premium Stabilization Programs The ACA includes three programs intended to ensure that premiums remain stable, both during the initial years of the law’s implementation and over the long term. The risk corridors, reinsurance, and risk adjustment programs—often called the “3Rs”—are designed to provide a buffer for insurers that have not adequately priced their plans, have attracted enrollees with catastrophic medical expenses, and/or have enrollees who are sicker than average (Exhibit 6).
The 3R programs require insurers to submit data to HHS regarding their claims experience and the diagnoses of their membership. Insurers that faced losses or have enrollees with high claims costs were scheduled to receive their first payment under the 3Rs in September 2015. This means that insurers facing claims costs in 2014 that significantly exceeded their premium revenue, such as IA/NE’s CoOportunity and the Kentucky Health Cooperative, had to wait as long as 21 months before receiving a payment. With limited federal solvency loans, CoOportunity did not have enough reserved capital to ensure all claims could be paid. The company ultimately was allotted $91.03 million in premium stabilization payments for 2014, with an additional $109 million expected in risk corridor payments by 2017 (Exhibit 7). Former company executives believe that if those payments had come earlier, they would likely have been able to survive. Federal officials have subsequently announced that they will accelerate payment of reinsurance funds for plan year 2015; this move could help some CO-OPs and other companies without a large capital base to absorb very high claims costs.29
The risk corridor program in particular, which is designed to help carriers recover significant losses, gave the CO-OPs and other insurers some license to price their plans lower than they otherwise would have. However, after these pricing decisions had been made, Congress changed the program to make it budget neutral. Now, insurers with high losses can be compensated using only funds collected from carriers with high profits. Because more insurers
www.commonwealthfund.org 17
experienced losses than gains, insurers received only 12.6 percent of the risk corridor payments they had originally been led to expect for 2014.30 In the wake of this news, several CO-OPs announced they will close their doors by the end of the year.
The risk corridor and reinsurance programs are temporary, with payments expected to phase out in 2017. Only the risk adjustment program will remain in place to help stabilize rates for carriers with high per-member costs. Here, however, CO-OPs and other small insurers may be disadvantaged.31 “If you are a new and/or small and growing health plan, you get punished [under the risk adjustment program],” asserts the CEO of New Mexico’s CO-OP.32 In order to “win” at risk adjustment, an insurance company must capture the most accurate picture
Exhibit 6. The ACA’s Premium Stabilization Programs
Program Description Duration Purpose
Risk corridors The government partially offsets insurers’ large losses and shares in large profits. Insurers whose premium revenue (less non-benefit* costs) is insufficient to cover all of their claims will be partially reimbursed for their losses. Insurers whose premium revenue (less non-benefit* costs) exceed their claims costs must pay HHS a fraction of the excess premium.
Three years To stabilize premiums by helping marketplace insurers that inadequately priced their plans.
Reinsurance A government program to partially compensate insurers in the individual market that have enrollees with catastrophically high health costs.
Three years To help insurers offset the cost of individual market enrollees who have catastrophic medical expenses.
Risk adjustment Insurers that enroll a relatively larger share of high-risk enrollees receive payments from those insurers with a relatively low share of high-risk enrollees.
Permanent To help insurers with a disproportionate number of enrollees who are sicker than the market average.
Source: Authors’ analysis.
*Includes administrative costs, taxes and fees, and profits.
Exhibit 7. 2014 Benefit Year Receivables and Payments for Six CO-OPs under the ACA’s Premium Stabilization Programs
Company
Risk corridor (individual
market) Reinsurance
Risk adjustment (individual
market)
Net stabilization
payments
CoOportunity Health (Iowa & Nebraska) $11.52 million $71.72 million $4.33 million $91.03 million
Kentucky Health Cooperative $9.73 million $58.09 million ($7.83 million) $59.95 million
Evergreen Health Cooperative, Inc. (Maryland) $0.11 million $0.31 million ($0.36 million) $0.48 million
Maine Community Health Options ($2.05 million) $35.45 million ($0.93 million) $ 32.47 million
Montana Health Cooperative $0.85 million $10.82 million $3.16 million $14.77 million
Community Health Alliance (Tennessee) $0.03 million $0.23 million $0.26 million $2.53 million
Sources: Department of Health & Human Services, Summary Report on Transitional Reinsurance Payments and Permanent Risk Adjustment Transfers for the 2014 Benefit Year, as revised September 17, 2015. Available at: https://www.cms.gov/CCIIO/Programs-and-Initiatives/Premium-Stabilization-Programs/Downloads/RI-RA-Report-REVISED-9-17-15.pdf; Department of Health & Human Services, Risk Corridors Payment and Charge Amounts for Benefit Year 2014 Report, November 19, 2015. Available at: https://www.cms.gov/CCIIO/Programs-and-Initiatives/Premium-Stabilization-Programs/Downloads/RC-Issuer-level-Report.pdf.
18 Why Are Many Co-Ops Failing? How New Nonprofit Health Plans Have Responded to Market Competition
possible of the risk profile of their enrollees. This means building the data capacity to track and record every diagno-sis of every member of the company’s plans. Health plans with limited data on their members will appear to have a healthier profile than they actually have. Building that data capacity is resource intensive and expensive.
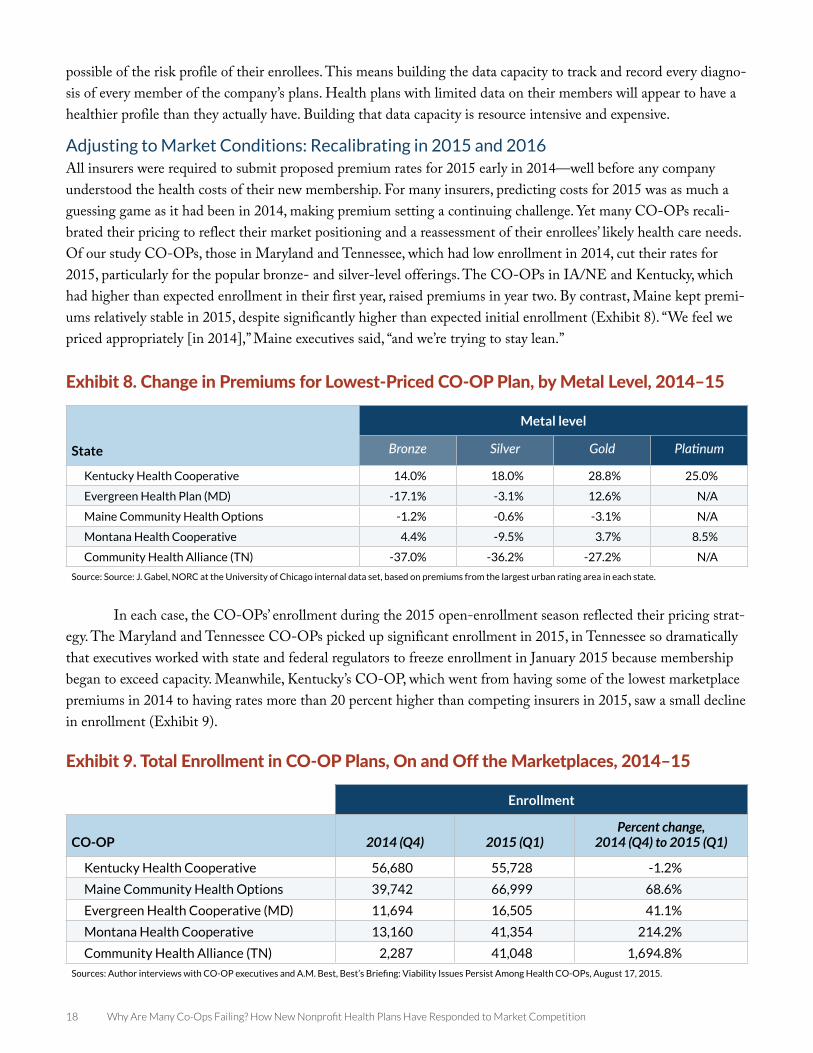
Adjusting to Market Conditions: Recalibrating in 2015 and 2016All insurers were required to submit proposed premium rates for 2015 early in 2014—well before any company understood the health costs of their new membership. For many insurers, predicting costs for 2015 was as much a guessing game as it had been in 2014, making premium setting a continuing challenge. Yet many CO-OPs recali-brated their pricing to reflect their market positioning and a reassessment of their enrollees’ likely health care needs. Of our study CO-OPs, those in Maryland and Tennessee, which had low enrollment in 2014, cut their rates for 2015, particularly for the popular bronze- and silver-level offerings. The CO-OPs in IA/NE and Kentucky, which had higher than expected enrollment in their first year, raised premiums in year two. By contrast, Maine kept premi-ums relatively stable in 2015, despite significantly higher than expected initial enrollment (Exhibit 8). “We feel we priced appropriately [in 2014],” Maine executives said, “and we’re trying to stay lean.”
In each case, the CO-OPs’ enrollment during the 2015 open-enrollment season reflected their pricing strat-egy. The Maryland and Tennessee CO-OPs picked up significant enrollment in 2015, in Tennessee so dramatically that executives worked with state and federal regulators to freeze enrollment in January 2015 because membership began to exceed capacity. Meanwhile, Kentucky’s CO-OP, which went from having some of the lowest marketplace premiums in 2014 to having rates more than 20 percent higher than competing insurers in 2015, saw a small decline in enrollment (Exhibit 9).
Exhibit 8. Change in Premiums for Lowest-Priced CO-OP Plan, by Metal Level, 2014–15
State
Metal level
Bronze Silver Gold Platinum
Kentucky Health Cooperative 14.0% 18.0% 28.8% 25.0%
Evergreen Health Plan (MD) -17.1% -3.1% 12.6% N/A
Maine Community Health Options -1.2% -0.6% -3.1% N/A
Montana Health Cooperative 4.4% -9.5% 3.7% 8.5%
Community Health Alliance (TN) -37.0% -36.2% -27.2% N/A
Source: Source: J. Gabel, NORC at the University of Chicago internal data set, based on premiums from the largest urban rating area in each state.
Exhibit 9. Total Enrollment in CO-OP Plans, On and Off the Marketplaces, 2014–15
Enrollment
CO-OP 2014 (Q4) 2015 (Q1)Percent change,
2014 (Q4) to 2015 (Q1)
Kentucky Health Cooperative 56,680 55,728 -1.2%
Maine Community Health Options 39,742 66,999 68.6%
Evergreen Health Cooperative (MD) 11,694 16,505 41.1%
Montana Health Cooperative 13,160 41,354 214.2%
Community Health Alliance (TN) 2,287 41,048 1,694.8%
Sources: Author interviews with CO-OP executives and A.M. Best, Best’s Briefing: Viability Issues Persist Among Health CO-OPs, August 17, 2015.
www.commonwealthfund.org 19
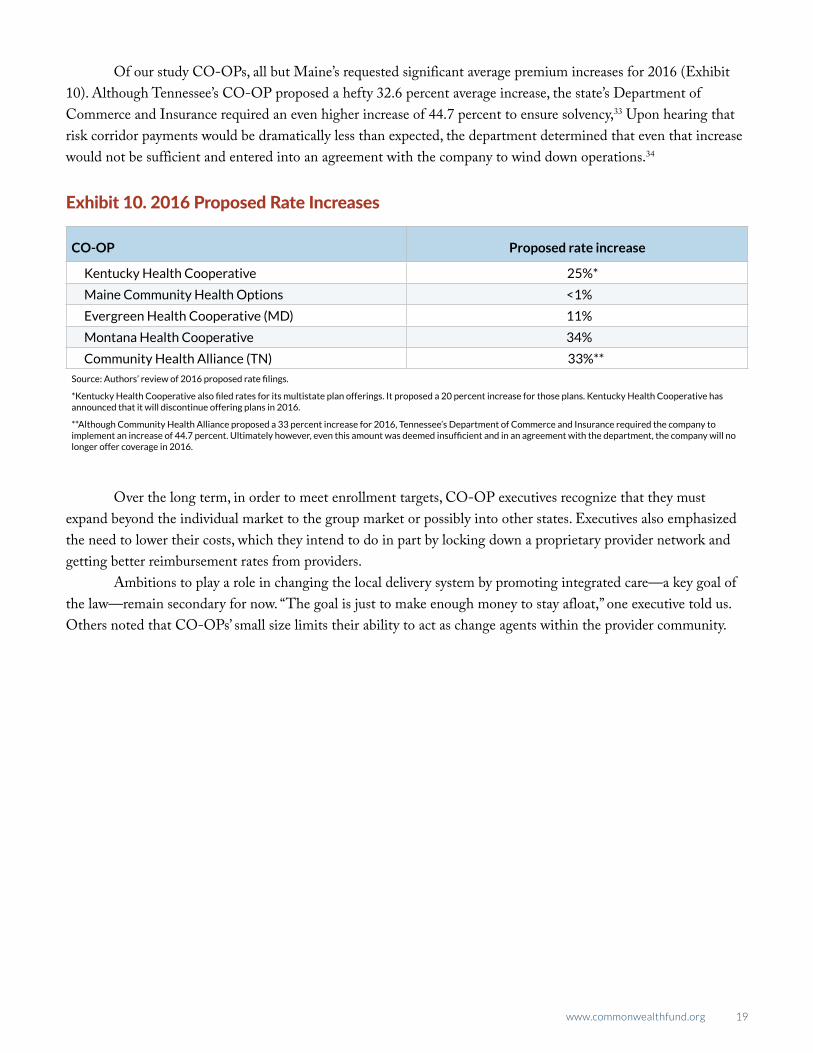
Of our study CO-OPs, all but Maine’s requested significant average premium increases for 2016 (Exhibit 10). Although Tennessee’s CO-OP proposed a hefty 32.6 percent average increase, the state’s Department of Commerce and Insurance required an even higher increase of 44.7 percent to ensure solvency,33 Upon hearing that risk corridor payments would be dramatically less than expected, the department determined that even that increase would not be sufficient and entered into an agreement with the company to wind down operations.34
Over the long term, in order to meet enrollment targets, CO-OP executives recognize that they must expand beyond the individual market to the group market or possibly into other states. Executives also emphasized the need to lower their costs, which they intend to do in part by locking down a proprietary provider network and getting better reimbursement rates from providers.
Ambitions to play a role in changing the local delivery system by promoting integrated care—a key goal of the law—remain secondary for now. “The goal is just to make enough money to stay afloat,” one executive told us. Others noted that CO-OPs’ small size limits their ability to act as change agents within the provider community.
Exhibit 10. 2016 Proposed Rate Increases
CO-OP Proposed rate increase
Kentucky Health Cooperative 25%*
Maine Community Health Options <1%
Evergreen Health Cooperative (MD) 11%
Montana Health Cooperative 34%
Community Health Alliance (TN) 33%**
Source: Authors’ review of 2016 proposed rate filings.
*Kentucky Health Cooperative also filed rates for its multistate plan offerings. It proposed a 20 percent increase for those plans. Kentucky Health Cooperative has announced that it will discontinue offering plans in 2016.
**Although Community Health Alliance proposed a 33 percent increase for 2016, Tennessee’s Department of Commerce and Insurance required the company to implement an increase of 44.7 percent. Ultimately however, even this amount was deemed insufficient and in an agreement with the department, the company will no longer offer coverage in 2016.
20 Why Are Many Co-Ops Failing? How New Nonprofit Health Plans Have Responded to Market Competition
POLICY DISCUSSIONTwo years after the CO-OPs began enrolling consumers, 12 of these nonprofit insurers have shut their doors. Eleven remain, and it is likely that some of these will continue to struggle. And even for those that ultimately survive, it may be several years before they gain a firm footing. As one industry expert noted, “It’s a minimum 10-year process to build an insurance company.” Among the CO-OP executives we interviewed, even the most optimistic acknowledge numerous challenges to their long-term financial sustainability and viability as a nonprofit coverage alternative.
Some of these challenges are inherent to the health insurance industry and confront any new company look-ing to enter the market. All new entrants must muster significant start-up capital to meet state licensing require-ments, build networks, and develop pricing strategies that grow enrollment at a manageable pace.
Other obstacles, however, resulted from federal and state policy decisions during implementation of the ACA that have made business harder for CO-OPs. Congress’ decision to cut funding for the program by two-thirds curtailed HHS’ ability to help CO-OPs manage short-term cash flow problems. Provisions prohibiting CO-OPs from using federal start-up funds for marketing and limiting their large-group market sales were designed to inhibit CO-OPs’ ability to grow enrollment.
Other policy choices were unrelated to the CO-OP program but have had significant consequences for it. The decision to allow existing insurers to maintain enrollees on transitional policies, for example, reduced the pool of customers for the CO-OPs and led to a sicker than expected risk pool. Additionally, the risk corridor program was originally designed to cushion the blow to insurers that enrolled a sicker population than their pricing had anticipated. However, because a congressional budget agreement required the program to be budget neutral for 2014, federal officials were able to deliver just 12.6 percent of the payments insurers had been led to expect. This had a disproportionate impact on small insurers that lacked a large capital base or diverse revenue streams. CO-OPs also find themselves at a relative disadvantage navigating the ACA’s risk adjustment program, the structure of which has favored larger, more established insurers.
Policymakers often talk about how important it is to encourage greater competition in health insurance markets and provide consumers with more choices. But actually delivering on that goal requires a much greater investment of financial resources and political capital than has been made to date.
CO-OP executives noted that they or their founders were driven to start a CO-OP because of their strong belief that there are better ways to manage and pay for health care and serve consumers than are currently provided by traditional insurers. The experiences of successful health insurance cooperatives such as Group Health of Puget Sound and Health Partners suggest that CO-OPs have the potential to provide a community-based, nonprofit option for consumers. Should any of these companies survive and come to thrive in the new marketplaces created by the ACA, however, they will have done so against substantial odds.
www.commonwealthfund.org 21
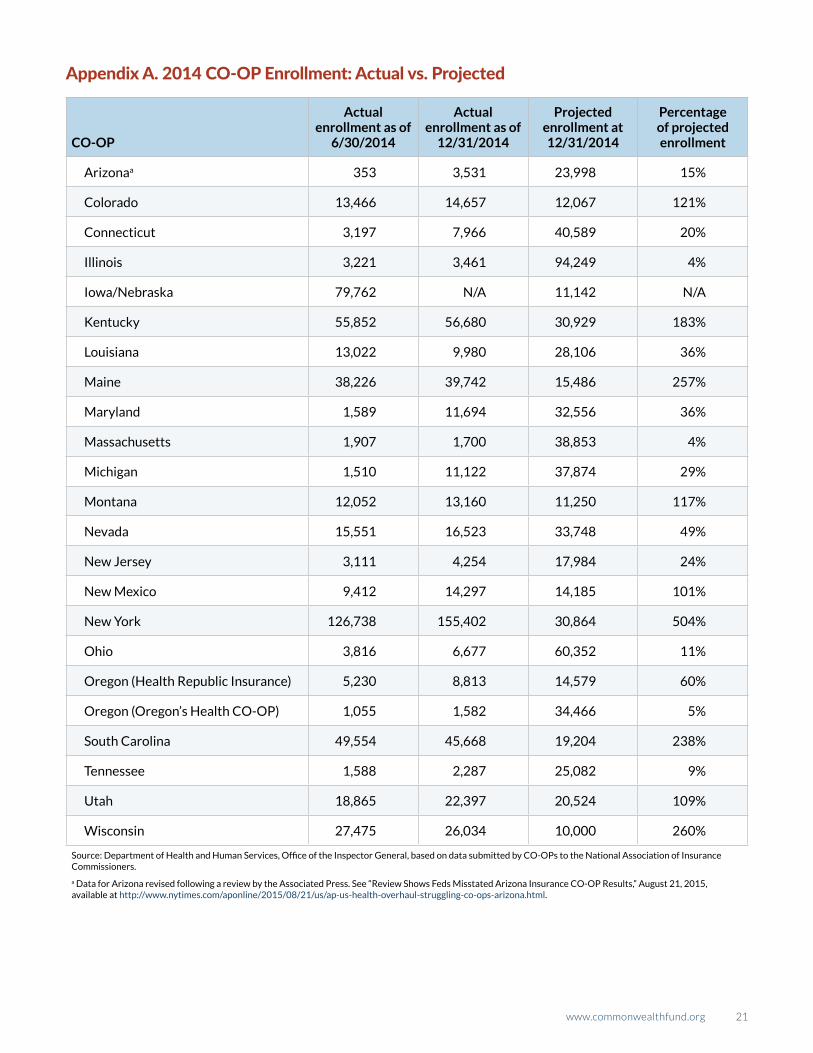
Appendix A. 2014 CO-OP Enrollment: Actual vs. Projected
CO-OP
Actual enrollment as of
6/30/2014
Actual enrollment as of
12/31/2014
Projected enrollment at 12/31/2014
Percentage of projected enrollment
Arizonaa 353 3,531 23,998 15%
Colorado 13,466 14,657 12,067 121%
Connecticut 3,197 7,966 40,589 20%
Illinois 3,221 3,461 94,249 4%
Iowa/Nebraska 79,762 N/A 11,142 N/A
Kentucky 55,852 56,680 30,929 183%
Louisiana 13,022 9,980 28,106 36%
Maine 38,226 39,742 15,486 257%
Maryland 1,589 11,694 32,556 36%
Massachusetts 1,907 1,700 38,853 4%
Michigan 1,510 11,122 37,874 29%
Montana 12,052 13,160 11,250 117%
Nevada 15,551 16,523 33,748 49%
New Jersey 3,111 4,254 17,984 24%
New Mexico 9,412 14,297 14,185 101%
New York 126,738 155,402 30,864 504%
Ohio 3,816 6,677 60,352 11%
Oregon (Health Republic Insurance) 5,230 8,813 14,579 60%
Oregon (Oregon’s Health CO-OP) 1,055 1,582 34,466 5%
South Carolina 49,554 45,668 19,204 238%
Tennessee 1,588 2,287 25,082 9%
Utah 18,865 22,397 20,524 109%
Wisconsin 27,475 26,034 10,000 260%
Source: Department of Health and Human Services, Office of the Inspector General, based on data submitted by CO-OPs to the National Association of Insurance Commissioners.
a Data for Arizona revised following a review by the Associated Press. See “Review Shows Feds Misstated Arizona Insurance CO-OP Results,” August 21, 2015, available at http://www.nytimes.com/aponline/2015/08/21/us/ap-us-health-overhaul-struggling-co-ops-arizona.html.
22 Why Are Many Co-Ops Failing? How New Nonprofit Health Plans Have Responded to Market Competition
NOTES1 Pub. L. 111-148, 124 Stat. 782 (2010) § 18042 (codified at 42 U.S.C. § 18042).2 K. Sack, “Health CO-OP Offers Model for Overhaul,” New York Times, July 6, 2009, http://www.nytimes.
com/2009/07/07/health/policy/07coop.html?_r=0; A. Coburn, J. Talbot, E. Ziller et al., “CO-OP Health Plans: Can They Help Fix Rural America’s Health Insurance Markets?” State Health Access Data Assistance Center, June 2011, http://www.shadac.org/sites/default/files/Old_files/shadac/publications/CO-OPsInRuralMarkets.pdf.
3 Pub. L. 111-148, 124 Stat. 782.4 “Individual Insurance Market Competition,” Kaiser Family Foundation, accessed Sept. 15, 2015, http://kff.org/other/
state-indicator/individual-insurance-market-competition/. 5 The loans provided under the program were originally intended to be direct grants. Instead, early opposition from
established insurers resulted in several changes to the CO-OP provision before it was enacted, including a require-ment that the CO-OPs pay back the federal funds within a few years (within five years for the start-up loans and 15 years for solvency loans).
6 According to congressional observers, insurance industry stakeholders argued during the ACA’s passage that it would be unfair competition to allow CO-OPs to use federal funds for marketing, when other insurance companies could not access those funds.
7 J. Markon, “Health CO-OPs, Created to Foster Competition and Lower Insurance Costs, Are Facing Danger,” Washington Post, Oct. 22, 2013, http://www.washingtonpost.com/politics/health-co-ops-created-to-foster-competi-tion-and-lower-insurance-costs-are-facing-danger/2013/10/22/e1c961fe-3809-11e3-ae46-e4248e75c8ea_story.html.
8 K. Lucia, S. Corlette, and A. Williams, “The Extended ‘Fix’ for Canceled Health Insurance Policies: Latest State Action,” The Commonwealth Fund Blog, Nov. 21, 2014, http://www.commonwealthfund.org/publications/blog/2014/jun/adoption-of-the-presidents-extended-fix.
9 A. Bell, “PPACA Risk Corridors Gap Rocks More Carriers,” LifeHealthPro, Oct. 13, 2015, http://www.lifehealthpro.com/2015/10/13/ppaca-risk-corridors-gap-rocks-more-carriers.
10 45 C.F.R. § 156.515(c)(1) (2011).11 45 C.F.R. § 156.520(2) (2011).12 A. Goldstein, “More Than Half of ACA CO-OPs Now Out of Insurance Marketplaces,” The Washington Post, Nov.
3, 2015, https://www.washingtonpost.com/national/health-science/more-than-half-of-aca-co-ops-now-out-of-insur-ance-marketplaces/2015/11/03/5ba95b86-824b-11e5-9afb-0c971f713d0c_story.html.
13 See, for example, K. Moulton, “Utah Shuts Down Arches, the State’s Non-Profit Insurance CO-OP,” The Salt Lake Tribune, Oct. 27, 2015, http://www.sltrib.com/home/3108049-155/utah-shuts-down-arches-utahs-nonprofit.
14 S. R. Collins, “The Consumer Oriented and Operated Plan (CO-OP) Program Under the Affordable Care Act: Potential and Options for Spreading Mission-Driven Integrated Delivery Systems,” Invited testimony before the Federal Advisory Board on the Affordable Care Act’s CO-OP Program, Jan. 13, 2011, http://www.commonwealth-fund.org/~/media/files/publications/testimony/2011/jan/collins_coop-testimony_11311.pdf.
15 Plan and pricing data derived from J. Gabel, NORC, at the University of Chicago internal data set. For more on methodology behind NORC data see http://www.commonwealthfund.org/~/media/files/publications/blog/2014/dec/gabel_premiums_blog_post_dec_2014_appendix_with_slide_v2.pdf?la=en.
16 J. C. Robinson, “Consolidation and the Transformation of Competition in Health Insurance,” Health Affairs, Nov. 2004 23(6):11–24, http://content.healthaffairs.org/content/23/6/11.full.pdf.

www.commonwealthfund.org 23
17 Two were unable to meet the deadlines. Ohio’s CO-OP did not offer plans for sale on the marketplace in 2014. Vermont’s CO-OP could not overcome the concerns of that state’s Department of Insurance about its long-term solvency and ability to gain enrollees. It was denied a license in 2013. See C. Ghose, “InHealth Mutual Ready for Debut on Federal Health Insurance Marketplace,” Columbus Business First, Nov. 16, 2014, http://www.bizjournals.com/columbus/news/2014/11/06/inhealth-mutual-ready-for-debut-on-federal-health.html; Vermont Department of Financial Regulation, “Vermont Health CO-OP Fails State Insurance Standards,” May 22, 2013, http://www.dfr.ver-mont.gov/press-release/vermont-health-co-op-fails-state-insurance-standards.
18 U.S. Department of Health and Human Services, “Amended Funding Opportunity Announcement: OO-COO-11-001,” Sept. 16, 2011.
19 The ACA requires insurers in the individual and small-group markets to sell plans at four distinct, standardized value levels: bronze, silver, gold, and platinum. These levels are set based on actuarial value (AV), or the percentage of total average costs for covered benefits that a plan will cover. For example, a silver-level plan has an AV of 70 percent, meaning that the plan covers, on average, 70 percent of the cost of covered benefits and the enrollee is responsible for 30 percent. Under the law, bronze plans have an AV of 60 percent, silver 70 percent, gold 80 percent, and platinum 90 percent.
20 U.S. Department of Health and Human Services, “Health Plan Choice and Premiums in the 2015 Health Insurance Marketplace, Assistant Secretary for Planning and Evaluation Research Brief,” Jan. 8, 2015, http://aspe.hhs.gov/sites/default/files/pdf/77176/healthPremium2015.pdf. See also L. Blumberg, S. Long, G. Kenney et al., “Factors Influencing Health Plan Choice Among the Marketplace Target Population on the Eve of Health Reform,” The Urban Institute, Dec. 2013, http://hrms.urban.org/briefs/hrms_decision_factors.pdf.
21 Although the Iowa CO-OP’s 2014 plan prices were generally slightly higher than its marketplace competitor, Coventry, it also offered platinum plans and a more generous formulary, making it appealing to people who use more health care.
22 Maine’s CO-OP did not adjust members’ rates based on tobacco use, but Anthem did. Price comparisons are between Anthem’s nonsmoking rates and Maine Community Health Options’ generalized rates.
23 U.S. Department of Health and Human Services Office of Inspector General, “Actual Enrollment and Profitability Was Lower Than Projections Made by the Consumer Operated and Oriented Plans and Might Affect Their Ability to Repay Loans Provided Under the Affordable Care Act,” July 2015, http://oig.hhs.gov/oas/reports/region5/51400055.pdf.
24 Center for Consumer Information and Insurance Oversight, “Report of the Federal Advisory Board on the Consumer Operated and Oriented Plan (CO-OP) Program,” April 15, 2011, https://www.cms.gov/CCIIO/Resources/Files/Downloads/coop_faca_finalreport_04152011.pdf.
25 U.S. Department of Health and Human Services Office of Inspector General, July 2015.26 Nevada Health Cooperative, “Nevada Health CO-OP in Receivership,” http://nevadahealthcoop.org/; Louisiana
Health Cooperative, “News Release: LAHC Forgoes Participation in Open Enrollment,” July 24, 2015, http://www.mylahc.org/news/NEWS-RELEASE---LAHC-forgoes-participation-in-Open-Enrollment. The Louisiana CO-OP had an administrative expense ratio of 35 percent. The average administrative expense ratio for the industry is 15 per-cent. See also A. M. Best, “Best’s Briefing: Viability Issues Persist Among the Health CO-OPs,” August 17, 2015.
27 Maine executives report that they had to expand their customer service infrastructure six times in the first year.28 C. Cox, R. Ma, G. Claxton et al., “Analysis of 2016 Premium Changes and Insurer Participation in the Affordable
Care Act’s Health Insurance Marketplaces,” Kaiser Family Foundation, June 24, 2015, http://kff.org/health-reform/issue-brief/analysis-of-2016-premium-changes-and-insurer-participation-in-the-affordable-care-acts-health-insurance-marketplaces/.

24 Why Are Many Co-Ops Failing? How New Nonprofit Health Plans Have Responded to Market Competition
29 Center for Consumer Information and Insurance Oversight, “Early Reinsurance Payments for the 2015 Benefit Year,” Oct. 9, 2015, https://www.cms.gov/CCIIO/Programs-and-Initiatives/Premium-Stabilization-Programs/Downloads/Early-Reinsurance-Guidance-FInal-10-09-15.pdf.
30 Department of Health and Human Services, Risk Corridors Payment Proration Rate for 2014, Oct. 1, 2015, https://www.cms.gov/CCIIO/Programs-and-Initiatives/Premium-Stabilization-Programs/Downloads/RiskCorridorsPaymentProrationRatefor2014.pdf.
31 D. M. Liner and J. Siegel, “ACA Risk Adjustment: Special Considerations for New Health Plans,” Milliman, July 2, 2015, http://www.milliman.com/insight/2015/ACA-risk-adjustment-Special-considerations-for-new-health-plans/.
32 S. Davis, “CMS Says Risk Mitigation Plans Work; Others Aren’t So Sure,” Inside Health Insurance Exchanges, July 2015.33 H. Fletcher, “ACA Rate Hikes May Not Cover Losses,” The Tennessean, Aug. 21, 2015, http://www.tennessean.com/
story/money/industries/health-care/2015/08/21/aca-health-insurance-rate-decision/32059577/. 34 Tennessee Department of Commerce and Insurance, “Tennessee CO-OP Community Health Alliance Voluntarily
Enters Run-Off,” Oct. 14, 2015, https://tn.gov/commerce/news/18562.


TheCOMMONWEALTH FUND