why constrain your mutual fund manager? - home | the university of
TRANSCRIPT
Journal of Financial Economics 73 (2004) 289–321
Why constrain your mutual fund manager?$
Andres Almazana, Keith C. Browna, Murray Carlsonb,David A. Chapmanc,*
aUniversity of Texas at Austin, Austin, TX 78712, USAbUniversity of British Columbia, Vancouver, BC, Canada V6T 1Z2
cBoston College, Chestnut Hill, MA 02467, USA
Received 5 September 2000; accepted 16 May 2003
Abstract
We examine the form, adoption rates, and economic rationale for various mutual fund
investment restrictions. A sample of U.S. domestic equity funds from 1994 to 2000 reveals
systematic patterns in investment constraints, consistent with an optimal contracting
equilibrium in the fund industry. Restrictions are more common when (i) boards contain a
higher proportion of inside directors, (ii) the portfolio manager is more experienced, (iii) the
fund is managed by a team rather than an individual, and (iv) the fund does not belong to a
large organizational complex. Low- and high-constraint funds produce similar risk-adjusted
returns, also consistent with an optimal contracting equilibrium.
r 2003 Elsevier B.V. All rights reserved.
JEL classification: G23; G32
Keywords: Mutual funds; Corporate governance; Investment restrictions
ARTICLE IN PRESS
$We would like to thank seminar participants at Dartmouth College, the University of Texas at Austin,
the European Financial Management Association meetings in Edinburgh, Scotland, and the 2001 Western
Finance Association meetings in Tucson, Arizona, as well as John Chalmers, Diego Garcia, Laura Starks,
Sheridan Titman, an anonymous referee, and in particular, Jeff Pontiff for helpful comments on earlier
versions of the paper. Robert Prentice and Robert Rodriguez gave us invaluable insights into the
regulation and practices of mutual funds. Satyajit Chandrashekar, Olivia Lian, Saumya Mohan, Carlos
Molina, Jose Olivares, Lorenzo Preve, Johan Sulaeman, and Omer Yamacoguz provided very able
research assistance.
*Corresponding author. Tel.: 1-617-552-3989; fax: 1-617-552-0431.
E-mail address: [email protected] (D.A. Chapman).
0304-405X/$ - see front matter r 2003 Elsevier B.V. All rights reserved.
doi:10.1016/j.jfineco.2003.05.007

1. Introduction
The money management industry has often been used as a laboratory forexploring issues of general interest in corporate finance. For example, Starks (1987)examines the effect of incentive compensation on a portfolio manager’s risk-takingdecisions, while Khorana (1996) and Chevalier and Ellison (1999) consider the‘‘career concerns’’ of mutual fund managers. The availability of detailed data and,perhaps more important, the fact that the investment opportunity set and the rangeof managerial decisions are more prescribed in the fund industry than for a generalindustrial corporation constitute compelling reasons to study contracting in thisindustry.
Although much has been written about the return performance andinvestment styles of professional asset managers, the academic literature hasdevoted surprisingly little attention to the restrictions commonly found in theinvestment policies that define the contracts between investors andmanagers. Mutual fund constraints are widespread and restrict the investmentpolicy of a portfolio in various ways. Managers might be prohibitedfrom taking short positions in stocks, from borrowing to finance the portfolio,or from holding positions in a variety of securities, including equityoptions, index futures, and restricted stock. Simply put: Why do investorstrust their funds to professional managers but then place constraints on theiractions?
The purpose of this study is to provide a detailed examination of the motivationfor and economic impact of the kinds of constraints that are most commonly foundin mutual fund investment policy statements. We will proceed along three main linesof inquiry. First, we document the type of constraints adopted in practice, thefrequency of their use, and how those adoption practices have changed over time.We examine the investment restrictions adopted by a large sample of U.S. domesticequity funds over the period from 1994 to 2000. We report evidence on prohibitionsagainst six specific investment practices: borrowing, purchasing securities on margin,short-selling, holding individual equity options, trading in equity index futures, orpurchasing restricted securities. Our results indicate that the adoption patterns forthese restrictions – considered on both an individual and an aggregate basis – areneither random nor uniform, but rather demonstrate significant cross-sectional andtime-series variation.
The second part of our investigation relates the presence of investment restrictionsto other fund characteristics in an effort to establish an economic rationale for suchconstraints. We view investment restrictions as one component of the set ofmonitoring mechanisms that reduce the costs arising from frictions in the principal-agent relation. In this regard, investment constraints are analogous to protectivecovenants used to mitigate the agency problems inherent in their relation with thefirm’s bondholders; see Smith and Warner (1979). In order to organize our empiricalanalysis, we consider the following control mechanisms as alternatives to explicitinvestment restrictions: (i) direct monitoring and the role of fund directors, (ii) labormarket monitoring and managerial career concerns, (iii) peer monitoring and the
ARTICLE IN PRESSA. Almazan et al. / Journal of Financial Economics 73 (2004) 289–321290

role of mutual fund complexes, and (iv) product market monitoring and thestructure of fund sales charges.
In support of the view that explicit constraints are substitutes for these othermeans of monitoring, we find that investment restrictions are more likely: (i) whenboards contain a higher proportion of inside directors, (ii) when fund managers aremore experienced and funds are team-managed rather than run by an individualmanager, and (iii) when the fund does not belong to a large organizational complex(i.e., a fund family). On the other hand, we find no evidence that the adoption ofinvestment restrictions is related to the presence of fund load charges or to thestructure of those fees.
We interpret these results as evidence of optimal contracting in the mutual fundindustry. Our results on boards are in line with previous findings in the corporatefinance literature that outsider-dominated boards are more effective monitors ofinvestors’ interests. For a recent survey of the role that boards play in solving agencyproblems, see Hermalin and Weisbach (2003). Our results on career concernscorroborate the findings in Chevalier and Ellison (1999) on manager age andcomplement them with the additional finding that team-managed funds, where theteam members have less of their reputation at stake than would an individualmanager, are constrained relatively more frequently. Finally, our finding that largefund complexes use relatively fewer constraints is consistent with the existence ofpeer monitoring to preserve fund reputational capital.
Having addressed the issues of how and why investment restrictions are used, wefinish the study by examining the impact of these constraints on fund performance.We consider two types of return-based evidence. First, we perform a series ofmatched-fund analyses by forming zero-investment portfolios consisting of longpositions in relatively unconstrained funds financed by short positions inrelatively constrained ones. Second, we also estimate various multiple linearregressions of fund return and risk measures on a policy constraint index andother fund characteristics. Both approaches produce similar findings, supportingthe conclusion that differences in the level of investment policy restriction do notaffect fund performance in either an economically or statistically significantmanner. We view this evidence as consistent with the idea that mutual fundsadopt the set of constraints necessary to produce an optimal contract with theirinvestors.
To the best of our knowledge, this is the first paper to examine portfolio policyconstraints in a comprehensive way. Koski and Pontiff (1999) and Deli and Varma(2002) concentrate on the ability of funds to use derivative securities, while Clarkeet al. (2002) consider the narrower conceptual question of how investmentrestrictions on position size and portfolio turnover impact a manager’s ability toproduce superior risk-adjusted returns. By focusing on a broader set of constraintsand by relating the use of direct restrictions to alternative monitoring mechanisms,we offer a more complete perspective on the trade offs involved in monitoring amanaged portfolio. We report new facts about the cross-sectional determinants ofthe fuller range of investment restrictions used in practice and the consequences ofthose decisions on portfolio performance.
ARTICLE IN PRESSA. Almazan et al. / Journal of Financial Economics 73 (2004) 289–321 291
The remainder of the paper is organized as follows. In Section 2, after discussingthe potential impact of the regulatory environment on constraint adoption practices,we describe our fund sample and data sources, define the individual and aggregaterestriction measures we employ, and catalog their use during our sample period.Section 3 offers more detailed explanations for the various monitoring hypothesesthat motivate the use of investment restrictions, while Section 4 describes thevariables in our empirical tests of those hypotheses and summarizes the findings.Section 5 examines the relation between constraints and fund returns. Our overallconclusions are in Section 6.
2. Mutual fund investment constraints: adoption and use patterns
2.1. Regulation and constraint
Not all of the investment restrictions that mutual funds face are necessarily theresult of voluntary contracting between investors and managers. Starting in the1930s, the U.S. Congress has enacted a series of regulations that define the generalway in which mutual funds can conduct their operations. These regulations coverpractices such as how funds can issue shares, how and when they must distributedividends and capital gains, and how they must report their policies andperformance to investors.
The Investment Company Act of 1940 restricts the investment activities of thefunds.1 However, the restrictions are often broadly worded or otherwise subject tointerpretation. For example, the legislation authorizes the SEC to regulate bothshort sales and margin trading, but the Commission has chosen not to impose anyspecial regulations on these activities. Furthermore, many of its provisions have beenmodified considerably over the past 60 years. A good example involves the statutoryability of a mutual fund manager to use traditional forms of leverage. Section 13(a)of the Act states: ‘‘No registered investment company shall, unless authorized by thevote of a majority of its outstanding Voting Securities, borrow money.’’ However,subsequent policy has evolved to the point that funds are now routinely permitted toborrow up to 33 1/3% of their total assets in a variety of ways.
The 1940 Act requires that investment companies disclose in their statedinvestment policies the restrictions that govern their investment activities. Consistentwith the notion that the role of investment restrictions goes well beyond regulatorymandates, it is increasingly common practice for a fund to split its stated investmentpolicy into two parts: fundamental and non fundamental. The goal of thefundamental policy, which can only be altered with shareholder approval, is often
ARTICLE IN PRESS
1Provisions of the tax code may also restrict the investment activities of a fund. For example, funds that
wish to be considered ‘‘pass-through’’ entities, so that capital gains and income taxes will accrue to the
individual investor, must hold well-diversified portfolios. Another historically relevant regulation, repealed
in the Taxpayer Relief Act of 1997, was the ‘‘short-short’’ rule that indirectly limited funds’ ability to use
short sales and derivatives.
A. Almazan et al. / Journal of Financial Economics 73 (2004) 289–321292

to provide the manager with as much investment flexibility as possible, within thecontext of the restrictions dictated in the 1940 Act. On the other hand, the fund’s nonfundamental policy can be altered at the discretion of the fund’s board of directorsand includes more business-specific restrictions (e.g., no international securities heldin a domestic portfolio, even if the fund’s fundamental policy permits theirinclusion). The intention of the non-fundamental policy is to capture the richer set ofrestrictions that investors and managers feel are necessary to best define the fund’sinvestment style. Collectively, the fundamental and non fundamental policiesrepresent the effective contract between the manager and the investors.2
In summary, the regulatory environment that governs the mutual fund industryprovides the framework within which investors and managers negotiate specificinvestment policy restrictions. Certainly, the SEC makes no claim to supervise thedaily investment activities of the funds under its jurisdiction, nor does it presumethat oversight ensures any level of performance. Indeed, the cross-sectional andintertemporal variation in the pattern of how investment constraints are adopted inpractice, as reported below, strongly suggests that such restrictions are not mereregulatory prohibitions. Thus, the question remains: What role do investmentconstraints play in the contracts formed by investors and managers?
2.2. Constraint definitions and data collection
Our data on the adoption of investment restrictions are extracted from the SEC’sForm N-SAR that registered investment companies must file twice a year. Form N-SAR is short for ‘‘Form N, Semi-Annual Report.’’ A fund must file form N-SARAto cover its activities for the first half of the reporting year, while form N-SARBcovers the full year. These filings are available electronically from the SEC’s Edgardatabase starting in 1994. For each fund, we use data from one such filing in a givenyear, using the report with the latest filing date. In addition to descriptiveinformation about the management company, fees, and general financial informa-tion, the N-SAR also requires companies to answer a series of questions related totheir investment policies.
We gather data for all funds available on both the Center for Research in SecurityPrices (CRSP) Mutual Fund database and the SEC Edgar database from 1994 to2000 that satisfy the following conditions: (i) The fund is a U.S. domestic equity fundfrom one of the following objective categories: balanced (BL), income (IN), growthand income (GI), long-term growth (LG), and aggressive growth (AG); and (ii) thefund did not identify itself as an index fund on the N-SAR (question 69). Therequirement that funds be listed in both databases is necessary in order to ensure that
ARTICLE IN PRESS
2Sanctions that can be imposed by the SEC if a mutual fund violates its investment restrictions vary
depending upon the severity and duration of the violation and the actions taken by the fund’s advisor to
rectify the situation. Generally, the advisor’s compliance screening process will catch the violation and the
advisor will simply take the appropriate corrective actions, including making the fund’s investors whole if
any losses were incurred as a result of the mistake. If the SEC, which might also uncover violations in its
periodic audit of a fund, is not satisfied with the actions of the advisor, it might impose sanctions, fines, or
censure on either the company or the individual manager.
A. Almazan et al. / Journal of Financial Economics 73 (2004) 289–321 293

information on the incidence and use of contractual investment restrictions and fundcharacteristics are available for use later in our analysis. Matching funds from theCRSP database with the SEC data required matching fund names with the centralindex key (CIK) used to identify funds in the SEC database. This selection procedureyields investment constraint data for a cumulative total of 9,525 funds across theseven-year sample period. The annual sample sizes range from a low of 679 funds in1994 to a high of 1,838 funds in 2000.
Survivorship bias is an important issue for any study using mutual fundreturns. As Brown et al. (1992) demonstrate, funds that disappear from a samplefollowing a period of poor performance can generate spurious persistence inperformance for the remaining funds. We guard against this bias in two ways. First,the use of the CRSP database substantially reduces the potential for survivorshipproblems. Second, we are careful to include funds in the sample right up to the timeof their disappearance.
2.2.1. Individual constraint definitions
Question 70 on Form N-SAR solicits information from mutual fund managersabout investment practices permissible under their investment policy statements.More precisely, the form requires a manager to respond ‘‘yes’’ or ‘‘no’’ to twoquestions about each of several different practices: (i) Is the practice permitted by theinvestment policy? (ii) If permitted by the investment policy, did the fund engage inthe practice during the reporting period? The answers to these two questions definethe basic data for the adoption and use statistics that we report and discuss inSections 2.3 and 2.4.
The six specific investment practices that are relevant to the day-to-day operationsof domestic equity funds are: (i) borrowing of money, (ii) margin purchases, (iii)short selling, (iv) writing or investing in options on equities, (v) writing or investingin stock index futures, and (vi) investments in restricted securities. Restrictions(i)–(iii) affect a fund’s ability to use leverage, (iv) and (v) its ability to use derivatives,and (vi) its ability to invest in illiquid assets.
Formally, a restricted security is one that is acquired in an unregistered, privatesale from the issuer or an affiliate of the issuer. In order to resell these securities tothe public, Rule 144 defines five ‘‘safe harbor’’ conditions that could potentially limita fund manager’s ability to dispose of her shares in a timely manner and at their fairmarket value. Consequently, we interpret a limitation on the use of restrictedsecurities as a liquidity constraint.
2.2.2. Combinations of constraints
The precise meaning of whether a fund is ‘‘constrained’’ or ‘‘unconstrained’’ is nolonger clear once we consider a broad set of investment restrictions. For example, if afund manager is allowed to borrow but not allowed to invest in index futures, is thatmanager constrained? To get a better sense of the cumulative impact of theconstraints imposed by its policies, we construct a ‘‘constraint score’’ as a means ofindexing a fund’s overall restrictiveness.
ARTICLE IN PRESSA. Almazan et al. / Journal of Financial Economics 73 (2004) 289–321294

The aggregate score places an equal weight across the three economically distinctcategories described above (leverage, derivatives, and illiquid assets) and isconstructed in two steps. First, a within-category weight is assigned based on theproportion of restricted activities in that category for that fund. Second, each of thethree within-category scores receives an equal ð1=3Þ weight. For instance, if a fund isconstrained in two of the three leverage-related restrictions and one of the twoderivative-use categories, and it can hold restricted stock, the score for that fund willbe: 1=3� 2=3þ 1=3� 1=2þ 1=3� 0 ¼ 7=18 ¼ 0:389: By construction, the scores liebetween 0 and 1 and a higher score indicates a more constrained fund.3
2.3. The pattern of constraint adoption
Table 1 summarizes how the six restrictions from Form N-SAR are employedacross our fund universe, as well as how the adoption patterns of those constraintschange over time. To get a better sense of the composite level of investmentrestriction imposed on these funds, the table also reports how the sample-wide meanlevel of the constraint score changed over the 1994–2000 period.
Panel A of Table 1 lists, for each restriction, the proportion of the funds in oursample that were not permitted to engage in that particular investment practicein a given year. For instance, 73:3% of the 679 funds that filed Form N-SAR in1994 reported that their investment policies formally restricted them from sellingshort. By 2000, however, the total number of reporting funds had increasedconsiderably (to 1,838) and the proportion restricted from shorting had declined to66:1%. The growth in the fund population is somewhat inflated by the factthat not all of the equity funds had their Form N-SAR responses reportedin the SEC’s Edgar database. This omission could have been due to either thefund’s failure to report or, more likely, the SEC’s conversion to an electronicreporting system. During this same period, the score metric also declined – from0:399 in 1994 to 0:335 in 2000 – indicating that the incidence of total fundconstraint adoption roughly mirrored the pattern for short selling. Finally,the last row in Panel A lists the overall restriction proportions and the constraintscore for the 9,525 Form N-SAR filings that occurred during the sample period.These overall proportions (e.g., 68:9% for the short-selling constraint) can be viewedas weighted averages of the annual proportions reported for the seven years in thesample period.
ARTICLE IN PRESS
3As a second approach, we create an alternative score measure by relating the economic benefit of a
constraint to the extent to which funds that are permitted to use a particular investment practice actually
did so. For each restriction, we compute the number of funds that report themselves as unrestricted. Next,
among the unrestricted funds, we calculate the percentage of funds that actually used the investment
practice covered by the restriction. These use rates form the basis for assigning weights to each constraint.
High constraint scores are assigned to those funds that could not engage in apparently useful investment
techniques. The actual weights are determined by dividing each of the percentages found above by their
sum. Since the two alternative measures have a simple correlation in excess of 0.99, we only report the
results for the measure described in the text. The results with the alternative measure are available from the
authors upon request.
A. Almazan et al. / Journal of Financial Economics 73 (2004) 289–321 295

ARTICLE IN PRESS
Table 1
Incidence of constrained and unconstrained funds
This table provides summary statistics on the incidence of investment restrictions in the sample of
domestic equity funds. The table shows the proportion of funds that reported they were not permitted to
engage in the practices listed in the column heads. Options refers to the use of individual equity options,
Futures to the use of index futures contracts, Restricted to the holding of restricted stock in the fund
portfolio, and Borrow, Margin, and Short to whether or not the fund is allowed to borrow, trade on
margin, or short sell. Score is the overall investment restriction defined in Section 2.2.2. Panel A describes
the results for all funds and Panel B divides the funds into age cohorts.
Year N Borrow Margin Short Options Futures Restricted Score
Panel A: All funds, by year
1994 679 0.212 0.931 0.733 0.290 0.409 0.222 0.399
1995 1,050 0.235 0.916 0.724 0.304 0.409 0.239 0.407
1996 1,201 0.230 0.910 0.700 0.277 0.379 0.209 0.384
1997 1,411 0.219 0.915 0.671 0.247 0.357 0.187 0.364
1998 1,605 0.240 0.918 0.689 0.241 0.352 0.165 0.358
1999 1,741 0.224 0.910 0.684 0.230 0.330 0.144 0.342
2000 1,838 0.206 0.893 0.661 0.227 0.314 0.149 0.335
Overall 9,525 0.224 0.911 0.689 0.252 0.355 0.179 0.363
Panel B: Funds divided by cohort and by year
Cohort 1: Fund inception prior to 1980
1994 131 0.252 0.939 0.809 0.366 0.489 0.221 0.439
1995 187 0.310 0.941 0.775 0.388 0.487 0.235 0.450
1996 188 0.303 0.931 0.745 0.381 0.505 0.213 0.439
1997 191 0.288 0.916 0.712 0.318 0.461 0.173 0.401
1998 199 0.367 0.930 0.774 0.345 0.442 0.186 0.424
1999 193 0.337 0.912 0.725 0.258 0.373 0.130 0.368
2000 194 0.320 0.912 0.696 0.263 0.366 0.180 0.379
Overall 1,283 0.314 0.925 0.745 0.329 0.443 0.189 0.413
Cohort 2: Fund inception from 1980 to 1990
1994 224 0.192 0.960 0.749 0.304 0.478 0.259 0.429
1995 302 0.199 0.950 0.737 0.312 0.492 0.256 0.430
1996 298 0.219 0.943 0.740 0.293 0.428 0.222 0.406
1997 289 0.205 0.944 0.735 0.274 0.431 0.198 0.394
1998 298 0.243 0.946 0.740 0.250 0.395 0.182 0.383
1999 285 0.208 0.923 0.708 0.222 0.363 0.155 0.353
2000 292 0.193 0.907 0.652 0.214 0.362 0.141 0.338
Overall 1,988 0.209 0.938 0.722 0.266 0.420 0.201 0.389
Cohort 3: Fund inception after 1990
1994 324 0.210 0.907 0.691 0.250 0.330 0.198 0.364
1995 561 0.228 0.889 0.701 0.271 0.339 0.232 0.381
1996 715 0.215 0.891 0.672 0.243 0.326 0.203 0.360
1997 931 0.209 0.905 0.642 0.223 0.314 0.187 0.347
1998 1,108 0.216 0.908 0.660 0.220 0.324 0.156 0.340
1999 1,263 0.211 0.907 0.673 0.227 0.316 0.143 0.336
2000 1,352 0.192 0.888 0.659 0.225 0.296 0.146 0.328
Overall 6,254 0.209 0.899 0.666 0.232 0.317 0.170 0.345
A. Almazan et al. / Journal of Financial Economics 73 (2004) 289–321296

In Panel B of Table 1, we examine the constraints imposed on funds sortedinto three age cohorts depending on fund inception: prior to 1980, from 1980 to1990, or after 1990. This panel lists the proportion of that cohort that wasrestricted from using a particular investment practice. For example, of the 1,838funds reporting in year 2000, 1,352 were created after 1990 and 65:9% of thatnewest fund cohort (or 891 Cohort 3 funds) were not permitted to shortindividual stocks in that year. Notice that the sample is heavily weighted towardfunds that came into existence in the most recent decade; Cohort 3 representsroughly half of the total sample in 1994 and about three-quarters of the sample in2000.
There are three major conclusions that we draw from the evidence reported inTable 1. First, it is apparent that adoption practices vary widely by individualconstraint. Focusing on the overall restriction statistics listed in the last line ofPanel A, we see that the proportion of funds not permitted to use certainpractices ranges from 17.9% for the buying or selling of restricted securities to91.1% for margin purchases. Second, for a given constraint, the incidence ofadoption declines substantially during the sample period. For each of the sixindividual restrictions, the proportion of constrained funds is smaller in 2000 than itwas in 1994. Further, as noted above, the score composite measure of constraint alsodeclined during the sample period. Third, constraint adoption practices varysignificantly by fund age cohort. The evidence in Panel B indicates that this isparticularly true in comparisons of the youngest funds (Cohort 3) to the moreestablished ones (Cohorts 1 and 2). In particular, for all six individual restrictionsand the aggregate constraint score, the overall values listed for Cohort 3 are neverlarger than those for the other two subgroups, suggesting that newer funds tend to beless constrained than older ones.
2.4. Self-imposed restrictions and partial constraints
Even when a particular investment practice is permissible, a fund manager willnot necessarily choose to use it. Circumstances requiring the use of certaininvestment practices might not arise in a given reporting period (e.g., in a rapidlyincreasing market a fund might choose not to short sell). Alternatively, it ispossible for a portfolio manager to adopt a constraint on a purely voluntarybasis (e.g., a manager attempting to minimize benchmark tracking error mightprefer not to short individual securities). Table 2 reports the extent to which thefunds in our sample that can use a particular investment practice actually do use thatpractice.
The first row of Panel A shows that 11:0% of the funds that were allowed to shortstocks in 1994 actually did so. Recall, however, that 73:3% (498) of the 679 samplefunds faced a formal restriction against this practice, meaning that only 20 fundsð¼ 0:11� 0:267� 679Þ actually shorted individual securities in the management oftheir portfolios. Once again, three major conclusions can be drawn from the findingsin Table 2. First, the overall proportions reported in the last line of Panel A showthat restricted securities (which was the least constrained practice to begin with) are
ARTICLE IN PRESSA. Almazan et al. / Journal of Financial Economics 73 (2004) 289–321 297

ARTICLE IN PRESS
Table 2
Use of investment techniques by unconstrained funds
This table provides univariate summary statistics on the actual use of different investment practices by
funds that are permitted to engage in these practices. Options refers to the use of individual equity options,
Futures to the use of index futures contracts, Restricted to the holding of restricted stock in the fund
portfolio, and Borrow, Margin, and Short to whether or not the fund is allowed to borrow, trade on
margin, or short sell. Panel A describes the results for all funds and Panel B divides the funds into age
cohorts.
Year Borrow Margin Short Options Futures Restricted
Panel A: All funds, by year
1994 0.099 0.128 0.110 0.124 0.147 0.234
1995 0.076 0.056 0.102 0.118 0.130 0.227
1996 0.072 0.046 0.117 0.085 0.130 0.220
1997 0.081 0.025 0.101 0.090 0.145 0.213
1998 0.099 0.008 0.089 0.104 0.148 0.186
1999 0.113 0.013 0.089 0.089 0.142 0.153
2000 0.121 0.005 0.097 0.086 0.163 0.178
Overall 0.097 0.027 0.098 0.096 0.145 0.194
Panel B: Funds divided by cohort and by year
Cohort 1: Fund inception prior to 1980
1994 0.122 0.000 0.000 0.193 0.194 0.412
1995 0.070 0.000 0.071 0.191 0.188 0.399
1996 0.076 0.000 0.083 0.162 0.161 0.412
1997 0.081 0.000 0.109 0.176 0.223 0.418
1998 0.095 0.000 0.133 0.168 0.198 0.383
1999 0.109 0.000 0.094 0.104 0.182 0.310
2000 0.167 0.000 0.085 0.140 0.211 0.321
Overall 0.102 0.000 0.089 0.159 0.195 0.376
Cohort 2: Fund inception prior to 1980 to 1990
1994 0.127 0.111 0.107 0.115 0.120 0.283
1995 0.091 0.000 0.127 0.106 0.144 0.272
1996 0.073 0.000 0.117 0.110 0.141 0.316
1997 0.083 0.000 0.079 0.096 0.152 0.312
1998 0.089 0.000 0.065 0.131 0.134 0.248
1999 0.129 0.000 0.084 0.154 0.155 0.204
2000 0.120 0.000 0.050 0.149 0.184 0.225
Overall 0.101 0.008 0.087 0.124 0.149 0.264
Cohort 3: Fund inception after 1990
1994 0.070 0.167 0.140 0.107 0.143 0.135
1995 0.069 0.081 0.095 0.105 0.111 0.153
1996 0.071 0.064 0.124 0.059 0.120 0.132
1997 0.080 0.034 0.105 0.073 0.130 0.140
1998 0.101 0.010 0.088 0.088 0.144 0.136
1999 0.110 0.017 0.090 0.073 0.133 0.117
2000 0.116 0.007 0.108 0.065 0.153 0.148
Overall 0.095 0.035 0.103 0.077 0.136 0.136
A. Almazan et al. / Journal of Financial Economics 73 (2004) 289–321298

used by almost 20% of the funds that can do so, sharply contrasting with the lowmargin use by permitted funds ð2:7%Þ: Thus, even when permitted, the six investmentpractices defined by Form N-SAR tend to be used with different intensities, althoughnone of them appear to be employed very frequently. Second, use of the allowedinvestment practices varies over time, although there is no evidence of the cleartrends that exist in Table 1. Finally, there are apparent differences across the fundage cohorts. In particular, managers of older funds (i.e., Cohort 1), who are generallymore constrained initially, tend to use a given investment practice more often whenthey are permitted to do so.
In addition to the likelihood that managers impose constraints on them-selves when no explicit restriction exists, it is also possible that funds face partial,rather than complete, constraints on a given investment practice. An example of thismight be a fund whose policy permits the purchase of call or put options but doesnot allow the manager to write them. In such a case, the constraint adoptionstatistics reported in Table 1 would understate the true level of restriction that thefund faces.
To see why this is true, consider this question: ‘‘Is the following practicepermitted by investment policy: Writing or investing in options on equities?’’ 4
The word ‘‘ or’’ in the question dictates answering in the affirmative if themanager can, in fact, invest in equity options even if he or she cannot write them.A similar problem would arise if, say, short selling were permissible but only upto a certain percentage of the net portfolio value. Thus, given inherent limita-tions in the way that funds report investment policy information to the SEC, theconstraint proportions (as well as the constraint scores) listed in Table 1 should beviewed as a lower bound for the actual level of restriction imposed on fundmanagers.
Unfortunately, partial constraints are difficult to detect in our data. By design, theSEC requires that responses to Form N-SAR be in an electronic format, whichprecludes the sort of explanatory information that might more accurately convey thenature of the constraints funds face. The summary data in Table 1 suggest that this ismost likely to affect constraints involving more complex investment practices, likethe deployment of derivative securities. Admittedly, the potential presence of partialrestrictions can affect the interpretation of our findings. That said, we find nocompelling reason to expect that they either follow systematic patterns that explainthe previously documented empirical regularities or are systematically related toother fund characteristics. Thus, in the regression analysis below, we turn ourattention to understanding the economic determinants of constraints as defined andreported by the funds themselves, without making explicit adjustments for the effectsof partial constraints.
ARTICLE IN PRESS
4For all practical purposes, this is Question 70(b) on Form N-SAR. The following interpretation has
greatly benefited from conversations with representatives of two large fund complexes who are in charge of
filing the actual N-SAR forms (and who asked to remain unnamed) as well as with Carolyn Miller of the
SEC. We would like to thank them for their assistance.
A. Almazan et al. / Journal of Financial Economics 73 (2004) 289–321 299
3. Explaining investment constraints: conceptual framework
3.1. Agency, monitoring, and constraints
The principal-agent paradigm (Ross, 1973; Jensen and Meckling, 1976)provides a natural framework for investigating the existence and the use ofinvestment restrictions. An investor (principal) finds it desirable to contractwith a manager (agent) due to the manager’s investment skills or advantages inthe collection or processing of information. However, conflicts of interest canemerge between the investor and the manager about either the portfolio allocation(e.g., portfolio risk or asset class) or the level of effort required to find mispricedsecurities.
Perhaps the most immediate mechanism for controlling the investor-manager agency conflict is the manager’s compensation contract. Directrestrictions on investment practices can certainly play a role in such contracts.For instance, Dybvig et al. (2003) and Garcia (2001) explicitly examine fundmanager compensation in a setting where managers acquire costly privateinformation and then must be induced to reveal that information to the principal.Gomez and Sharma (2001) consider how short-selling constraints interact withincentive pay in contracts designed to induce effort-averse managers to gatherinformation. However, the lack of detailed data on compensation contracts forindividual fund managers rules out an explicit empirical examination of thismatter. Another strand of the literature (see, for example, Grinblatt andTitman, 1989; Brown et al., 1996) has explored how a convex payoff can distortthe portfolio choice of a money manager by increasing his or her appetite forrisk. Payoffs to portfolio managers can be convex due to the fund-flow/performancerelation. Chevalier and Ellison (1997) and Sirri and Tufano (1998)document nonlinear flow-for-performance relations that yield de facto convexpayoff functions. Notice, however, that the convexity induced in the relationbetween total management fees and fund performance is not necessarily passedon to fund managers. These papers suggest that risk-taking incentives canpotentially be controlled by restricting the manager’s ability to implement tradesthat increase portfolio risk and, consequently, that cross-sectional differences inconstraint adoption might be related to characteristics that proxy for managerial riskaversion.
We pursue an alternative approach by postulating that directinvestment restrictions substitute for less passive monitoring mechanisms(e.g., board or peer oversight) and that investment restrictions are morelikely to be used when these other monitoring mechanisms are relativelymore costly to use. Specifically, we examine whether the adoption ofexplicit policy constraints is related to: (i) direct monitoring by thefund’s board of directors, (ii) labor market monitoring through managerialcareer concerns, (iii) peer monitoring and the role of mutual fundcomplexes, and (iv) product market monitoring and the structure of fundcharges.
ARTICLE IN PRESSA. Almazan et al. / Journal of Financial Economics 73 (2004) 289–321300

3.2. Alternative monitoring mechanisms
3.2.1. Direct monitoring: the role of the fund’s board
Under the Investment Company Act of 1940, the board of directors of a fund mustoversee the fund’s operations and ensure that the interests of the fund’s advisor ormanagement company are aligned with the interests of the shareholders of the fund.This directive resembles the mandate on boards in public corporations, where boardsmust also represent shareholder interests and must help to solve the agency problemsinherent in managing an organization characterized by the separation of ownershipand control. The SEC has established that directors must monitor the fund to verifycompliance with stated investment policies and restrictions without, as an SEC(1992) report emphasized, micro managing a fund’s daily operations. The fund’sboard must also oversee the management of the fund’s portfolio of securities,monitoring both the liquidity of the portfolio and the ongoing composition of thefund’s investments.
The empirical literature on corporate governance has related board composition(defined as the number of outside versus inside directors on the board) and boardsize to firm decision-making and profitability. The consensus view, as reflected inJensen (1993), is that larger boards and boards with fewer independent directors areless effective in performing their monitoring duties. Hermalin and Weisbach (1991)fail to document a strong empirical connection between board composition andcorporate performance, but Yermack (1996) and Eisenberg et al. (1998) find asignificantly negative relation between board size and firm value. In the mutual fundindustry, board composition is considered of fundamental importance if the board isto perform as an effective monitor of managers.5 Evidence of the important roleplayed by outside directors in the proper governance of a mutual fund can be foundin the Investment Company Act of 1940, which requires that at least 40% of a fund’sboard consist of independent directors (i.e., directors without any significant relationwith the fund advisor or underwriter). Board composition has recently receivedintense scrutiny from representatives of the mutual fund industry as well as fromregulators. In June of 1999, an advisory group appointed by the InvestmentCompany Institute released a report on best practices for fund directors (available atwww.ici.org). Their main recommendation was ‘‘that at least two-thirds of thedirectors of all investment companies be independent directors.’’ In January 2001,the SEC strengthened the requirement for independent board members so that afterJuly 1, 2002 independent directors must constitute at least 50% (rather than at least40%) of the fund’s board.
Two studies have found economically interesting effects of board composition inthe mutual fund industry. Tufano and Sevick (1997) find that a fund’s boardcomposition affects the fees charged by the fund to its shareholders. Among otherthings, they find lower fees in the presence of smaller boards and when boards have a
ARTICLE IN PRESS
5Former SEC Chairman Arthur Levitt refers to mutual fund directors as those ‘‘ on the front line for
investors.’’ See ‘‘Understanding the Role of Mutual Fund Directors’’ edited by the Investment Company
Institute (1999) and posted on-line at www.ici.org.
A. Almazan et al. / Journal of Financial Economics 73 (2004) 289–321 301

greater fraction of independent directors. Using a sample of closed-end funds, DelGuercio et al. (2003) find that funds with smaller, more independent boards exhibitlower expense ratios and a higher likelihood of measures that enhance shareholdervalue. We hypothesize that investment restrictions are more likely to be imposed onfunds with larger boards and fewer independent directors.
3.2.2. Managerial career concerns
Fama (1980) suggests that discipline from the labor market (i.e., career concerns)can reduce agency problems. Holmstr .om (1999) confirms that, if optimal dynamicmanagerial contracts are not enforceable, career concerns affect managerialdecisions, but he also shows that labor market effects coexist with the misalignmentof incentives that commonly occur in the principal-agent setting. Chevalier andEllison (1999) further document the existence of career concern effects in the mutualfund industry. They show that the decision to terminate a young manager is moresensitive to recent performance than the termination decision for an older manager.They also establish that the portfolio holdings of younger managers contain lessunsystematic risk than the holdings of older managers.
If undereffort or excessive risk-taking are relevant issues, we would expect toobserve that explicit investment policy constraints are less prevalent in funds whosemanagers have stronger career concerns. These career concerns manifest themselvesin two distinct ways. First, as shown in Chevalier and Ellison (1999), our analysisshould account for the age of the manager. All else equal, younger managers will besubject to stronger career concerns. Second, the use of a team approach, as opposedto individual management, to manage the fund’s assets can also play a significantrole. Career concerns should be more compelling in the case of individually managedfunds, where a specific manager’s reputation will be affected more strongly by thesuccess or failure of the fund. Conversely, labor market discipline will be lesseffective for the various members of a management team, where it is difficult todetermine who is responsible for a fund’s successes or failures. Team-managed fundscan also create a free-rider problem in the provision of effort. This provides aseparate role for constraints in controlling management behavior. Holmstr .om (1982)provides a seminal analysis of the ‘‘moral hazard in teams’’ problem. We predict alower incidence of constraints in funds run by younger managers and in thosemanaged by individuals.
3.2.3. Peer monitoring: the role of mutual fund complexes
Peer monitoring has been identified as a device to control agency problems (see,for example, Arnott and Stiglitz, 1991; Armendariz de Aghion, 1999). If an agent’speers can observe the agent’s actions, then a principal can increase contract efficiencyby relating that agent’s payoffs to his or her results as well as to the results of anypeers. In a mutual fund context, peer monitoring can occur when the fund operateswithin a large fund complex. A fund complex’s reputational capital provides directincentives for the managers of other funds within the complex to have concernsabout the performance of peer funds. Mutual fund complexes frequently use apooled board structure, with the same group of individuals overseeing all the funds
ARTICLE IN PRESSA. Almazan et al. / Journal of Financial Economics 73 (2004) 289–321302

of the fund family. Pooled boards, which prevent duplication of presentation anddiscussions on issues common to many funds in a complex, constitute an importantvehicle for peer monitoring. We postulate that investment constraints will be lessprevalent, all else equal, in funds that belong to large complexes.
3.2.4. Fund charges and monitoring
Load charges can be related to the intensity of the agency problem betweenmanagers and investors through two mechanisms. The first is connected to theexistence of clientele effects in the mutual fund industry. Any fee structure thatincludes load expenses – regardless of when those fees are assessed – will tend toattract investors with longer expected holding periods, who might find it more costlyto liquidate their position quickly after the initial investment. The second mechanismapplies exclusively to back-end load fees. Regardless of the investment horizon, thesecharges discourage redemption and therefore can exacerbate the managerial agencyproblem. This is consistent with the evidence reported in Chordia (1996), who showsthat fund load fees discourage redemptions by shareholders. Notice that both ofthese arguments implicitly rely on the effect of portfolio size on a manager’scompensation. If fund manager compensation increases with the amount of assetsunder management, then early share redemption will be costly for managers, whichmakes the threat of early investor exit a means of controlling agency problems. Inany case, load charges that dissuade share redemption make constraints morevaluable. This suggests a positive association between load charges and investmentrestrictions. This hypothesized relation should be stronger in the case of funds withback loads.
3.3. Non-agency explanations for constraints
There are at least two other (non-agency-related) rationales for the existence ofinvestment restrictions. First, these constraints could be purely marketing devicesused to differentiate funds as distinct financial products. In the following section, weinvestigate this possibility by considering whether the use of investment restrictions issystematically related to Morningstar investment style categories, which arguably arethe observable variables most closely related to meaningful product differentiation inthis industry. Second, in their analysis of derivative-based constraints, Koski andPontiff (1999) and Deli and Varma (2002) argue that savings on transactions costscan provide an alternative rationale for the relaxation of these restrictions. Theirargument suggests that, all else equal, prohibiting the use of derivatives will be morecostly for a fund that faces more volatile expected net inflows and outflows and canbe extended to accommodate the broader view that a manager attempts to match theliquidity of the fund’s assets and liabilities. In such a case, funds subject to strongliquidity shocks are more likely to forbid their managers from investing in illiquidinstruments (e.g., restricted stock) and to allow them to use investment practices(e.g., derivatives) that help ameliorate the effects of such shocks. We will use fundturnover ratio as a measure of a fund’s transaction costs and examine the relation
ARTICLE IN PRESSA. Almazan et al. / Journal of Financial Economics 73 (2004) 289–321 303

between turnover and the availability of different investment practices to the fund’smanagers.
4. The determinants of constraint adoption: empirical analysis
4.1. Variable definitions
4.1.1. Monitoring hypothesis variables
The first two variables – the total number of directors on a fund’s boardðBoardSizeÞ and the proportion of those directors who are non-interested (i.e.,independent) persons ðPropIndÞ – are proxies for the intensity of direct monitoringby the board.6 We expect results consistent with the view that smaller boards andboards with a higher proportion of independent directors are more effectivemonitors of managerial actions.
The next two regressors, Team and MgrAge, are proxies for capturing potentialcareer concerns of the portfolio manager(s). The Team dummy variable equals one ifMorningstar reports the fund as being team managed (i.e., no specific manager namereported) or if there are multiple managers in charge of the fund. MgrAge proxies formanagerial age and is calculated as follows. For individually managed funds, wesubtract from the current year the earliest start date for a given manager with anyfund in the Morningstar database. For funds managed by multiple managers, weaverage the individual measure over the managers in charge of the fund. We assign azero value to MgrAge for funds managed by multiple managers whose names are notreported. Similar results were obtained from an analysis that excluded anonymousteam observations which constitute approximately 5% of the sample. We expect apositive relation between Team and MgrAge and the use of fund constraints.Although it is possible to use college graduation dates from the Morningstardatabases and calculate an alternative proxy for age, as in Chevalier and Ellison(1999), the lack of availability for that variable reduces our sample to 4,800 fund-years. (We obtained similar results to those reported in Tables 3 and 4 when runningthe models using this definition of manager age rather than experience.)
Top 10 equals one if the fund belongs to a family classified among the largest tenfund complexes. This regressor is intended to capture the peer monitoring functionperformed by other individuals from within the fund complex, an effect that wepredict will be particularly strong for large complexes where substantial reputationalcapital is at stake. The monitoring hypothesis predicts a negative relation betweenthis variable and a fund’s restrictiveness. Finally, we include two regressors thatmeasure the effects of load charges on the use of constraints. FrontLoad equals one ifthe fund charges a front-end load fee and zero otherwise, and BackLoad equals one ifthe fund charges a back-end load fee and zero otherwise. Funds classified as
ARTICLE IN PRESS
6The 1940 Act includes as ‘‘ interested’’ directors those affiliated with the investment company, its
advisor, and any other person determined by the SEC to have ‘‘ a material business or professional
relationship with the company’’ (see Pozen, 1999, p. 113 for details.)
A. Almazan et al. / Journal of Financial Economics 73 (2004) 289–321304

ARTICLE IN PRESS
Table 3
Pooled regression estimates
This table reports estimated parameters for four different pooled observation models. The dependent
variable is score, the overall measure of fund constraint constructed in Section 2.2.2. Boardsize, PropIndep,
Team, MgrAge, Backload, Frontload, and Top 10 are the explanatory variables related to the different
contracting hypotheses for the use of direct investment restrictions. LogFundAge, Turnover, and LogTNA
are control variables, and LB through SG are indicator variables for Morningstar style categories that are
also included as controls. The different columns correspond to different estimation methods based on
pooling all of the fund-year data. The first column is the pooled OLS estimator. The second column is the
random-effects (R.E.) model. The third column is the ‘‘between’’ OLS cross-sectional estimator
constructed from the time-series averages. The final column is a double-censored Tobit estimator that
explicitly accounts for the truncated nature of score and uses the information in the probability mass at 0
and 1: P-values are reported in parentheses underneath the regression coefficients. Summary statistics for
the regressions are reported in the last three rows. The F - or w2-statistic tests for the joint significance of all
the monitoring variables.
Variable Pred. sign Pooled OLS R.E. (GLS) Between-estimator Panel Tobit
Monitoring hypothesis
BoardSize + �0.003 �0.001 �0.003 �0.002(0.093) (0.419) (0.214) (0.047)
PropIndep � �0.217 �0.073 �0.239 �0.105(0.000) (0.000) (0.000) (0.000)
Team þ 0.030 0.010 0.033 0.020
(0.001) (0.047) (0.004) (0.001)
MgrAge + 0.005 0.002 0.005 0.003
(0.000) (0.007) (0.000) (0.000)
FrontLoad + �0.004 �0.015 �0.006 �0.005
(0.178) (0.060) (0.657) (0.484)
BackLoad + �0.019 �0.016 �0.017 �0.011
(0.697) (0.079) (0.306) (0.315)
Top 10 � �0.039 �0.059 �0.049 �0.063(0.009) (0.000) (0.016) (0.000)
Control variables
LogFundAge 0.060 0.002 0.066 0.023
(0.000) (0.719) (0.000) (0.000)
LogTNA �0.028 �0.012 �0.027 �0.014(0.000) (0.000) (0.000) (0.000)
Turnover �0.016 �0.005 �0.019 �0.005(0.029) (0.001) (0.000) (0.002)
LB 0.001 0.000 �0.008 �0.007
(0.932) (0.963) (0.707) (0.279)
LG �0.011 �0.005 �0.013 �0.004
(0.514) (0.577) (0.540) (0.640)
MV �0.016 0.004 �0.035 0.008
(0.309) (0.625) (0.170) (0.395)
MB �0.018 �0.008 �0.035 �0.004
(0.298) (0.409) (0.299) (0.667)
MG �0.037 �0.024 �0.036 �0.022(0.019) (0.012) (0.124) (0.032)
SV �0.015 0.010 0.009 0.023
(0.442) (0.394) (0.698) (0.045)
SB 0.008 �0.002 0.018 0.009
(0.657) (0.825) (0.592) (0.438)
A. Almazan et al. / Journal of Financial Economics 73 (2004) 289–321 305

FrontLoad (BackLoad) are those that have the majority of assets under managementassociated with share classes that charge front-end (back-end) load fees. Theinvestor-monitoring hypothesis suggests a positive relation between load fees andmeasures of investment restriction.
ARTICLE IN PRESS
Table 3 (continued)
Variable Pred. sign Pooled OLS R.E. (GLS) Between-estimator Panel Tobit
SG �0.009 �0.011 �0.020 �0.007
(0.610) (0.292) (0.427) (0.543)
Constant 0.540 0.468 0.541 0.475
(0.000) (0.000) (0.000) (0.000)
# of Funds 7; 259 7; 259 7; 259 7; 259
F or w2 9.19 (F) 65.37 ðw2Þ 9.97 (F) 91.09 ðw2Þ(0.000) (0.000) (0.000) (0.000)
R2 0:107 0:053 0:107 n.a.
Table 4
Summary tests from individual constraint pooled probits
This table reports the summary statistics for tests based on coefficients from pooled probit models of
the individual fund restrictions. There are 7; 259 funds in the samples used for each regression. The
dependent variable equals one if the particular investment practice is prohibited and zero otherwise.
Boardsize; PropIndep; Team, MgrAge, Backload; Frontload ; and Top10 are the explanatory variables
related to the different contracting hypotheses for the use of direct investment restrictions. LogFundAge,
Turnover, and LogTNA are control variables, and LB through SG are indicator variables for Morningstar
style categories that are also included as controls. P-values – based on robust standard errors – are
reported in parentheses underneath the regression coefficients. The w2-statistic tests for the joint
significance of all the monitoring variables in a given equation is reported in Panel A. Panel B reports joint
tests of the hypotheses that all of the coefficients equal zero (asymptotically distributed w2 with six degrees
of freedom) and that the average coefficient value equals zero (asymptotically distributed w2 with one
degree of freedom).
Options Futures Restricted Borrowing Margin Short
Panel A: Joint significance of coefficients by constraint type
w2 test statistic 44.32 52.77 70.39 21.65 17.43 30.26
(0.000) (0.000) (0.000) (0.003) (0.015) (0.000)
BoardSize PropIndep Team MgrAge FrontLoad BackLoad Top 10
Panel B: Joint significance of monitoring and control variables across constraints
All zero 31.28 54.11 17.53 33.11 10.39 10.90 32.25
(0.000) (0.000) (0.000) (0.000) (0.109) (0.092) (0.000)
Avg. zero 2.40 15.96 12.46 9.70 0.62 1.28 5.26
(0.121) (0.000) (0.000) (0.002) (0.429) (0.257) (0.022)
A. Almazan et al. / Journal of Financial Economics 73 (2004) 289–321306

4.1.2. Control variables
We include control variables that either account for alternative hypotheses for theuse of constraints or are unrelated to the specific hypothesis of interest, but must beincluded in the regression in order to ensure that they do not influence our results asimportant omitted variables. These controls are: (i) LogFundAge, the logarithm ofthe number of years since fund inception plus one; (ii) LogTNA; the logarithm of theamount of total net assets under management, i.e., the size of the fund; (iii) Turnover,the minimum of the fund’s dollar purchases or dollar sales for the year divided by themonthly average value of the portfolio, a variable that we use as a control forliquidity-based explanations for investment restrictions; and (iv) a set of dummies forthe fund’s investment objective as identified using the nine Morningstar stylecategories. This classification uses the median market capitalization of the stocks inthe portfolio to group funds into small-, mid-, or large-cap categories as well as theportfolio’s median price-earnings and book-to-market ratios to group funds intogrowth, blend, or value categories; in our analysis, the large-cap value style class isthe omitted category.
4.2. Collection of the data
The regressions that we present below combine information from three differentdatabases: Morningstar, CRSP, and SEC Edgar. From the Morningstar database,we construct MgrAge and Team, obtain information about investment styles, andrank fund families by assets managed to identify the top ten families and determinewhat funds belong to those families (i.e., Top 10). From the CRSP database, weobtain the load characteristics of funds (i.e., BackLoad and FrontLoad dummies),fund age, fund size, and turnover of fund assets (i.e., LogFundAge, LogTNA, andTurnover). CRSP is also the source of fund return information used in Section 5.Finally, from the SEC Edgar database, we get N-SAR electronic forms withinformation of investment restrictions. We also download and hand-collectinformation on board composition from Forms 485APOS and 485BPOS:
As a consequence of the consolidation of the three databases, the sample of fundsavailable for regression analysis shrinks from the original universe of 9,525 to 7,259fund-year observations. Information is lost for two primary reasons: (i) inability totrace board composition from Forms 485APOS and 485BPOS; particularly in 1994and 1995;7 and (ii) inability to match funds in CRSP and Morningstar databases,due to the different fund identifiers used in the two databases as well as differences innaming abbreviations, which eliminates some information on investment styles.
If the omitted firms differ from the remaining firms in important ways, then ourestimated coefficients could be biased. To explore this possibility, we perform tworobustness checks. First, we examine the available characteristics of the excluded andincluded funds and find them to be very similar. Second, we run the regressionsdescribed in the next subsection using the subsample for which board composition
ARTICLE IN PRESS
7From 1996 on, funds were required to file information on board composition every 18 months, and on
changes on board compositions if they occur in the interim period.
A. Almazan et al. / Journal of Financial Economics 73 (2004) 289–321 307

variables are not available, i.e., using all fund characteristics except BoardSize andPropIndep.8 Regression coefficients for the included variables have the same signsand similar significance levels to those described below. The findings from thesechecks suggest that sample selection biases are not likely to have an important effecton our conclusions.
Treating each fund year as an observation in our sample, fund boards have a mean(median) of 7:47ð7Þ members with 73% (75%) independent directors. In comparison,Tufano and Sevick (1997) report nine members for the median fund, with 71%independent directors for open ended funds, and Del Guercio et al. (2003) reportseven members with 71% independent directors for closed-ended ones. Half of thefunds are managed by a single manager, with average (median) experience of 6.23(5.25) years. Average (median) fund age is seven (six) years and average (median)fund size, as measured by the net value of assets under management, is $188 ($194)million. For most of the funds, no-load shares constitute the majority of assets undermanagement: 13% (27.8%) of funds have predominantly back (front) load shareclasses. Finally, of the total number of funds analyzed, 12.1% belong to a Top10fund complex.
4.3. Regression analysis of overall fund restrictiveness
Table 3 contains the results of four alternative regression models, estimated usingall of the fund-year observations. Models run by pooling fund-year observations canproduce more efficient estimators because they take advantage of the panel structureof the entire sample. In each of the four specifications, we regress score (theaggregate constraint measure) on the set of monitoring and control variables usingall available observations from the 1994–2000 period.9
The first column of results in Table 3 reports the coefficient estimates from apooled OLS equation that we use as our base case. This procedure includes acorrection to the standard error estimates that accounts for the dependenceintroduced into the errors when the same fund is present at several dates. Inparticular, this correction accounts for block-diagonal structure in the errorcovariance matrix (see Huber, 1967, or Rogers, 1993). As in the other threeregressions presented in this table, however, different funds are treated asindependent observations in the cross-section. Consistent with our first hypothesis– that managers are less likely to face active constraints if the board has a largerproportion of independent directors – we find that the coefficient on PropIndep isnegative and statistically significant. (This stands in contrast to the effect of boardsize, which does not appear to be significantly related to a fund’s overall constraintscore.) The effects of managerial career concerns are also strongly supported by thepooled OLS regression. The coefficient estimates on both Team and MgrAge are
ARTICLE IN PRESS
8These results are available from the authors.9We also estimated year-by-year cross-sectional OLS regressions of score on the monitoring and control
variables. These results are quite similar to those for the pooled regressions reported in the text, and they
are available on request.
A. Almazan et al. / Journal of Financial Economics 73 (2004) 289–321308

positive and strongly statistically significant. These results imply that funds that aremanaged by teams or by older managers tend to rely more heavily on directinvestment restrictions. In addition, there is clear evidence in favor of the peermonitoring hypothesis, in the form of a strongly significant negative coefficient onthe Top 10 variable. This finding says that funds that are a part of a prominent fundfamily are less likely to use direct restrictions.
Finally, there is also no evidence of investor monitoring. The estimated coefficientson the two load charge variables (Frontload and BackLoad) are not significantlydifferent from zero. This lack of evidence can be due to the presence of acountervailing monitoring force, namely the implicit monitoring exerted by brokers(on behalf of investors) on fund managers. As one executive with a leading mutualfund company suggested, load charges are primarily marketing fees paid to brokerswho might be monitoring the managers on the investors’ behalf. She framed therelationship between brokers and portfolio managers this way: ‘‘The intention of thenon fundamental portion of the investment policy is to create the set of business-specific restrictions that reflect what the investors expect. This is hard for theportfolio managers of a public fund to do without the input of the marketing anddistribution group, who are the ones with the direct customer contact.’’ This in turnwould suggest that funds that employ brokers (i.e., charge load fees) might be lesslikely to impose policy restrictions than those that do not. Starks et al. (2002)consider a similar argument in the context of the tax counseling that brokers couldbe giving to individual investors in municipal bond funds.
Some of the control variables are also statistically significant. Older funds aremore likely to be constrained than younger ones, as indicated by the positivecoefficient on LogFundAge. This finding is also consistent with the cohort-basedanalysis in Tables 1 and 2. The coefficient on the proxy for fund size (LogTNA) issignificantly negative, suggesting that larger funds are less likely to be constrained bydirect investment restrictions. Finally, the negative and statistically significantcoefficient on the proxy for asset turnover (Turnover) indicates that funds withinvestment strategies that have higher turnover rates tend to be the least constrained.
The pooled OLS results also document the fact that Morningstar investment styleclassifications, used as proxies for non-agency-related marketing devices, generallyhave insignificant coefficients. This suggests that there is no evidence of anyimportant cross-sectional or time-series correlations between a fund’s style and itsconstraint adoption patterns. Mid-cap growth funds appear to be the notableexception to this statement. These funds appear to be less likely to be constrainedthan other investment styles.
The second pooled model we estimate is a random-effects panel data model thatallows for a fund-specific random factor. This corresponds to a (feasible) generalizedleast square estimator (GLS). Another way to interpret this estimator is as aweighted average of two others: one that averages funds across time and then runs anOLS regression with their means (i.e., the ‘‘ between’’ estimator) and another thatlargely ignores cross-sectional information and examines how the time-series ofdeterminants affects the time-series of the dependent variable (i.e., the ‘‘within’’estimator). The results from this model, reported in the second numerical column of
ARTICLE IN PRESSA. Almazan et al. / Journal of Financial Economics 73 (2004) 289–321 309

Table 3, are virtually identical to the pooled OLS results. All of the significant(insignificant) monitoring variables in the first column remain in the random-effectscolumn. This is generally the case for the control variables as well, with LogFundAge
being the only exception. That particular result could arise if LogFundAge iscapturing two opposing effects: the presence of time trends in the use of constraints(i.e., older funds are born with more constraints) and the reduction of constraintswithin the same funds over time. The signs of the coefficients in both the pooled OLSand random-effects estimators are identical, but the absolute value of the coefficientis generally lower in the random-effects model.
The third model summarized in Table 4 is a simple between-estimator OLSregression of the average fund values across groups. By transforming the data so asto be based on the means of the respective annual observations, the between-estimator model focuses on the cross-sectional variation in the sample while stillusing all of the available observations. These results, which have been adjusted forheteroskedasticity due to the unbalanced nature of the panel, are consistent with thecoefficient estimates in the first two columns of Table 3. Further, the point estimatesare, in all cases, very close to those of the pooled OLS estimators. The onlynoteworthy difference between the between-estimator and the earlier estimators isthat the Morningstar mid-cap growth dummy is not statistically significantlydifferent from zero.
The fourth pooled model that we estimate is a double-censored panel Tobit model,and these results are reported in the last column of Table 3. This specificationinvolves the estimation of a panel regression in which we take into account that thedependent variable (score) ranges between zero and one and has positive probabilitymass in both extremes. This design explicitly recognizes potential biases that canoccur due to the censored nature of our dependent variable. For instance, when afund exhibits maximal restrictiveness, i.e., score equals one, it could be that furtherrestrictions are desirable but impossible to enact. The coefficient estimates (and theirstatistical significance) are consistent with the simpler specifications employed in theprior three columns, and these results confirm that our findings are not driven by thetruncated nature of the score measure.
Notice that the results from the between-estimator regression are very similar tothose generated by the pooled OLS model. When contrasted with the random-effectsGLS model, these findings imply that the most compelling variation in the sampleoccurs between funds rather than across time for a particular fund. This, in turn,suggests that the ‘‘true’’ model is cross-sectional in nature and that the paneldimension, by incorporating the effect of the time-series of the determinants intoaccount, tends to adds noise to the estimation process. Alternatively, the time-series ofconstraint adoption could be affected by variables that are omitted from the regressionspecification. Notice that the estimated parameters from the panel Tobit regressionshown in the final column of Table 3 are more comparable in size to those for therandom-effects GLS model, which is to say that they are smaller than the parametersfor the pooled and between-estimator OLS regressions. Nevertheless, the findings onceagain confirm that the proxies for the monitoring hypotheses are meaningfuldeterminants for understanding how mutual funds policy restrictions are set.
ARTICLE IN PRESSA. Almazan et al. / Journal of Financial Economics 73 (2004) 289–321310
We also estimate a fifth pooled model, the ‘‘within’’ (or fixed-effects) estimator,which focuses on time-series (rather than cross-sectional) variation in the variables.The results from this estimation (which are not reproduced here) confirm our earlierobservation that the random-effects GLS model can be viewed as a weighted averageof the between- and within-estimator models. More important, these findings alsocorroborate the conclusion that the economically meaningful relations we find aregenerated by the cross-sectional variation in the fund sample.
Finally, it is interesting to consider the economic effect of the relations implied bythe estimated parameters. As an example, the coefficient of �0:039 on the Top 10variable (in the pooled OLS regression) indicates that the marginal impact of afund’s belonging to one of the largest families would be to lower its overall constraintscore from, say, 0.333 to 0.294. Depending on the particular year in which such achange in the fund’s status occurred, this adjustment to the score measure couldsignificantly affect how its overall level of constraint was viewed on a relative basis.In 1996, for instance, the median score value was indeed 0.333, but a decline of 0.039would still keep a fund near the top of the third quartile of the cross-sectionaldistribution. Conversely, a decline from the 1999 median value of 0.222 to 0.183would move the fund into the least restricted quartile for that annual cross-section.Similar statements can be made about the economic impact of the other monitoringand control variables, most notably PropIndep, Team, and LogFundAge.
4.4. Regression analysis of individual fund restrictions
Having just considered explanations for overall fund restrictiveness, we nowexamine the influences of a fund’s decision to adopt a specific constraint. Toestablish the economic determinants of policy restrictions imposed on individualinvestment practices, we use panel data for the entire 1994–2000 sample period toestimate a system of six seemingly unrelated pooled probits, one for each constraint.The dependent variables in this system assume a value of one if a particular practiceis prohibited and zero otherwise. This estimation method – where standard errors areadjusted to account for dependencies in the dataset, both across time as well asacross constraints for a given fund – allows us to test hypotheses regardingcoefficients across all constraints. (In theory, one could alternatively estimate amultivariate probit but, in this case, this is impractical due to dimensionality of theproblem.) Table 4 reports summary statistics for overall coefficient significance fromthese pooled regressions.
The results in Panel A of Table 4 strongly support the conclusion that somecombination of monitoring and control variables are related to the likelihood that afund will use a specific restriction. This demonstrates that the results in Table 3 arenot an artifact of the use of an overall constraint measure. In fact, every one of thespecific investment restrictions examined in Tables 1 and 2 is strongly related to theset of regressors used in Table 3.
Panel B of Table 4 shows that the conclusions from Table 3 with respect to theindividual monitoring variables are – in almost all cases – robust to whetherconstraints are defined in the aggregate or for individual constraints. PropIndep,
ARTICLE IN PRESSA. Almazan et al. / Journal of Financial Economics 73 (2004) 289–321 311

Team, MgrAge, and Top 10 are all strongly significant in explaining the observedpatterns in the use of individual constraints, and FrontLoad and BackLoad are notstatistically significant. The noteworthy exception to the general agreement betweenthe results in Tables 3 and 4 is the significance of BoardSize. In the pooled estimatesbased on score, only the panel Tobit found a statistically significant (negative)relation between board size and overall constraint use (smaller boards use moreconstraints). In Table 4, we can reliably reject the null hypothesis that the coefficienton BoardSize is zero across all constraints, but we cannot reject the hypothesis thatthe average coefficient value across constraint types is zero.10
5. Do constraints affect fund performance?
Throughout the study, our maintained hypothesis has been that investment policyconstraints are an important part of the optimal contract between investors andmanagers. In equilibrium, explicit restrictions are substitutes for labor marketmonitoring (career concerns), peer monitoring (by complexes), and direct monitor-ing (by boards). Overall, the empirical findings in the previous section suggest thatalternative contractual arrangements between investors and managers do coexist.Managers and investors can choose a ‘‘low constraint’’ arrangement, wheremonitoring addresses agency problems, or they can use direct restrictions extensivelywith little or no explicit or implicit monitoring from other sources.
The existence of alternative arrangements leads to a natural question: Docontracting choices affect fund returns? In order to address this question, weconsider two approaches for analyzing fund returns. The first approach consists oftwo different matched-fund analyses that compare the performance of zero-investment portfolios formed on the basis of fund constraints. In one strategy, weconstruct long positions in unconstrained funds and short positions in constrainedones, based on the score measure. In an alternate strategy, we take long positions infunds that have constraint use patterns that are consistent with the regressions in theprevious section, and we take short positions in funds that deviate from theobserved contracting patterns by using either too many or too few constraints, givenother observable characteristics of the fund. In addition to these portfolioreturns, we also estimate annual cross-sectional regressions that relate risk-adjustedreturns to proxies for constraint severity and the likelihood of constraintadoption.
Before we present the analyses, a caveat is in order. The interpretation of thedifferences in the performance of constrained versus unconstrained funds is affectedin a fundamental way by the nature of the contracting equilibrium that we postulate.
ARTICLE IN PRESS
10The coefficient point estimates for BoardSize (not reported in the paper) were statistically significantly
different from zero for the futures, restricted, borrowing, and margin probits. These point estimates were
negative for futures, restricted, and margin probits, and the coefficient for BoardSize in the borrowing
probit was positive. Recall that the agency story predicts a positive relation between the probability of a
given restriction and BoardSize.
A. Almazan et al. / Journal of Financial Economics 73 (2004) 289–321312

A governance system that uses explicit constraints as part of the solution to theshareholder-manager contracting problem might be appropriate when the marginalcost of alternative constraint mechanisms is high, but it is inappropriate whenmonitoring is already provided from other sources. So, if the patterns of constraintsthat we observe in the data reflect the equilibrium outcome of an optimal contractingproblem, it is difficult to predict what systematic differences in returns – if any –should be observed across constrained versus unconstrained funds. However, ifexogenous shocks in the economic environment have rendered a sub optimal matchbetween fund characteristics and fund constraints, the effect of constraints onreturns could become apparent.
5.1. Zero-investment portfolio returns
The first investment strategy that we examine uses the information in score. Inparticular, for each of the nine Morningstar categories and for the universe of allfunds, we do the following: (i) in December of each year from 1994 to 2000 we rankall funds from the lowest to the highest score value; (ii) we form a portfolio of allfunds with score values less than the average value (in the given category), weighteach fund in this portfolio in proportion to its distance from the average value, andgo long one dollar in this portfolio; (iii) we form another portfolio from the fundsthat are above the average score value, form portfolio weights that are proportionalto the (absolute value) of the difference between the average value and a fund’s scorevalue and go short one dollar in this portfolio; and (iv) we hold these positions forthe next calendar year, and then repeat the portfolio formation in the followingDecember. We rebalance the portfolio monthly to account for funds that drop out ofand enter into the sample. Using this strategy, we construct 84 months of returns,from January 1995 through December 2001. This information comes from the CRSPMutual Fund database, which reports returns net of management fees, operatingexpenses, and 12b-1 fees.
Elton et al. (2001) note some potential biases that result from the CRSP MutualFund database. The current CRSP database addresses these issues but still indicatesthe presence of two biases. The first arises when funds have several classes of shares.Our analysis is unaffected by this problem because we calculate average returns,across share classes, for such funds. We have checked that our results are robust tovalue- and equal-weighting schemes. The second bias, which might affect ouranalysis, arises when private funds and their (presumably above-average) returnhistories are added to the database (see the CRSP manual for a description). The useof net-of-fee (rather than gross) returns allow us to capture the potential benefitsaccruing to managers who can adjust their fund positions more cheaply usingderivatives than through physical rebalancing, as suggested by Koski and Pontiff(1999).
In addition to the average returns, we also estimate the three-factor model fromFama and French (1993) over the full 84 months of returns. This estimationgenerates both a measure of abnormal returns and factor sensitivities for the strategyas it is applied to the set of funds in each of the Morningstar style categories. All
ARTICLE IN PRESSA. Almazan et al. / Journal of Financial Economics 73 (2004) 289–321 313

inference in the Fama-French regressions is done using Newey-West robust standarderrors, in order to account for both heteroskedasticity and autocorrelation in theregression residuals. The three factors from Fama and French (1993) are the excessreturn on the value-weighted market portfolio ðMF Þ; the return to a zero-investmentportfolio that goes long in a portfolio of small market capitalization stocks and shorta portfolio of large market capitalization stocks ðSMBÞ; and a zero-investmentportfolio that goes long a portfolio of high B/M stocks and short a portfolio of lowB/M stocks ðHMLÞ:11
The mean and standard deviation of the total returns to the strategy, applied to allfunds and the different Morningstar categories, are shown in the second and thirdcolumns of Table 5. The returns to the strategy are not statistically significantlydifferent from zero. This can be verified quickly by dividing the standard deviationby
ffiffiffiffiffi84
p¼ 9:17 and comparing that result with the corresponding point estimate of
the mean return. This holds for all funds and within every style category. The Fama-French alphas are also not significantly different from zero in any style category oroverall. The explanatory power of these time-series regressions, as indicated by theR2 statistic reported in the last column of the table, is larger for value as opposed togrowth funds, and the explanatory power is higher for funds holding large stockscompared to small stocks.
The long and short portfolios in the various style categories load differently on theFama-French factors. The short position in the strategy has a consistently higherexposure to the market factor, across Morningstar styles, when compared to the longposition. This is evident from the strongly statistically significant negativecoefficients in six of the nine portfolios in the column labeled bMF : Along the samelines, the bHML column reveals that the short position in the strategy generally loadsmore heavily on high B/M stocks. In this case, five of the nine coefficients aresignificant. While these risk differences are clearly statistically meaningful, they maynot be economically significant since they do not translate into measurabledifferences in realized average returns to the strategy. However, it is conceivablethat with a longer time-series of hedge portfolio returns, these same risk differencescould produce reliable return differences. Finally, the relatively low R2 levels indicatethat much of the risk in these hedge portfolios is unsystematic in nature.
As we noted earlier, the fact that there are no discernible return differences from astrategy based on raw values of score is not surprising. We do not have a theory thatsuggests that – unconditionally – the use of explicit constraints compared toalternative monitoring mechanisms is more or less efficient at controlling investor-manager conflicts of interest. An experiment that is more consistent with ourcontracting equilibrium intuition is based on a long-short strategy applied to theabsolute errors from year-by-year regressions of constraints on the monitoringvariables and controls. These errors measure the extent to which a given funddeviates from the average behavior of a fund with a given set of observablecharacteristics. The strategy based on absolute errors is constructed in a manner that
ARTICLE IN PRESS
11The factors were downloaded from Ken French’s web page at http://mba.tuck.dartmouth.edu/pages/
faculty/ken.french/data library.html
A. Almazan et al. / Journal of Financial Economics 73 (2004) 289–321314
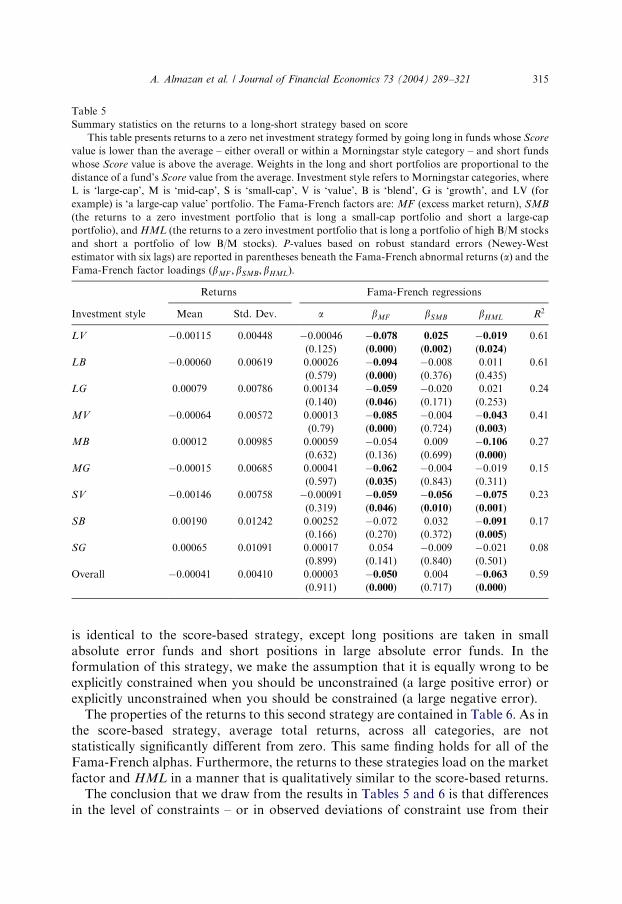
is identical to the score-based strategy, except long positions are taken in smallabsolute error funds and short positions in large absolute error funds. In theformulation of this strategy, we make the assumption that it is equally wrong to beexplicitly constrained when you should be unconstrained (a large positive error) orexplicitly unconstrained when you should be constrained (a large negative error).
The properties of the returns to this second strategy are contained in Table 6. As inthe score-based strategy, average total returns, across all categories, are notstatistically significantly different from zero. This same finding holds for all of theFama-French alphas. Furthermore, the returns to these strategies load on the marketfactor and HML in a manner that is qualitatively similar to the score-based returns.
The conclusion that we draw from the results in Tables 5 and 6 is that differencesin the level of constraints – or in observed deviations of constraint use from their
ARTICLE IN PRESS
Table 5
Summary statistics on the returns to a long-short strategy based on score
This table presents returns to a zero net investment strategy formed by going long in funds whose Score
value is lower than the average – either overall or within a Morningstar style category – and short funds
whose Score value is above the average. Weights in the long and short portfolios are proportional to the
distance of a fund’s Score value from the average. Investment style refers to Morningstar categories, where
L is ‘large-cap’, M is ‘mid-cap’, S is ‘small-cap’, V is ‘value’, B is ‘blend’, G is ‘growth’, and LV (for
example) is ‘a large-cap value’ portfolio. The Fama-French factors are: MF (excess market return), SMB
(the returns to a zero investment portfolio that is long a small-cap portfolio and short a large-cap
portfolio), and HML (the returns to a zero investment portfolio that is long a portfolio of high B/M stocks
and short a portfolio of low B/M stocks). P-values based on robust standard errors (Newey-West
estimator with six lags) are reported in parentheses beneath the Fama-French abnormal returns ðaÞ and the
Fama-French factor loadings ðbMF ; bSMB;bHMLÞ:
Returns Fama-French regressions
Investment style Mean Std. Dev. a bMF bSMB bHML R2
LV �0.00115 0.00448 �0.00046 �0.078 0.025 �0.019 0.61
(0.125) (0.000) (0.002) (0.024)
LB �0.00060 0.00619 0.00026 �0.094 �0.008 0.011 0.61
(0.579) (0.000) (0.376) (0.435)
LG 0.00079 0.00786 0.00134 �0.059 �0.020 0.021 0.24
(0.140) (0.046) (0.171) (0.253)
MV �0.00064 0.00572 0.00013 �0.085 �0.004 �0.043 0.41
(0.79) (0.000) (0.724) (0.003)
MB 0.00012 0.00985 0.00059 �0.054 0.009 �0.106 0.27
(0.632) (0.136) (0.699) (0.000)
MG �0.00015 0.00685 0.00041 �0.062 �0.004 �0.019 0.15
(0.597) (0.035) (0.843) (0.311)
SV �0.00146 0.00758 �0.00091 �0.059 �0.056 �0.075 0.23
(0.319) (0.046) (0.010) (0.001)
SB 0.00190 0.01242 0.00252 �0.072 0.032 �0.091 0.17
(0.166) (0.270) (0.372) (0.005)
SG 0.00065 0.01091 0.00017 0.054 �0.009 �0.021 0.08
(0.899) (0.141) (0.840) (0.501)
Overall �0.00041 0.00410 0.00003 �0.050 0.004 �0.063 0.59
(0.911) (0.000) (0.717) (0.000)
A. Almazan et al. / Journal of Financial Economics 73 (2004) 289–321 315

predictions based on regressions – do not affect fund returns in economically orstatistically significant ways. As a robustness check, we consider several variationson the experimental design reported above. The first variation is to add back fundexpenses and check for return differences on a gross-of-expense basis. Second, weconsider strategies in which the long and short positions are determined by the actualregression error and not the absolute value of the error. Finally, portfolios areformed using extreme constraint deciles (both overall and within Morningstarcategories) rather than weighting funds in proportion to their deviation from themean. The basic conclusions from Tables 5 and 6 are robust to all of these differentmethodologies for constructing returns.
ARTICLE IN PRESS
Table 6
Summary statistics on the returns to a long-short strategy based on absolute errors in the regression of
score on the economic determinants of constraint use
This table presents returns to a zero net investment strategy formed by going long in funds with small
absolute regression errors in the Score regressions financed by short positions in funds with large absolute
regression errors. We repeat these strategies both overall and within a Morningstar style category. Weights
in the long and short portfolios are proportional to the size of the absolute errors. Investment style refers
to Morningstar categories, where L is ‘large-cap’, M is ‘mid-cap’, S is ‘small-cap’, V is ‘value’, B is ‘blend’,
G is ‘growth’, and LV (for example) is ‘a large-cap value’ portfolio. The Fama-French factors are: MF
(excess market return), SMB (the returns to a zero investment portfolio that is long a small-cap portfolio
and short a large-cap portfolio), and HML (the returns to a zero investment portfolio that is long a
portfolio of high B/M stocks and short a portfolio of low B/M stocks). P-values based on robust standard
errors (Newey-West estimator with six lags) are reported in parentheses beneath the Fama-French
abnormal returns ðaÞ and the Fama-French factor loadings ðbMF ;bSMB; bHMLÞ:
Returns Fama-French regressions
Investment style Mean Std. Dev. a bMF bSMB bHML R2
LV �0.00143 0.00488 �0.00063 �0.091 0.018 �0.010 0.69
(0.058) (0.000) (0.005) (0.030)
LB 0.00021 0.00553 0.00071 �0.055 �0.025 0.005 0.33
(0.174) (0.005) (0.030) (0.637)
LG �0.00106 0.00945 �0.00039 �0.071 �0.016 0.067 0.42
(0.693) (0.000) (0.372) (0.000)
MV 0.00026 0.00862 0.00076 �0.055 �0.002 0.004 0.10
(0.588) (0.042) (0.929) (0.758)
MB 0.00058 0.00819 0.00071 �0.013 �0.019 0.005 0.02
(0.464) (0.890) (0.577) (0.613)
MG �0.00027 0.00886 0.00027 �0.059 �0.013 0.011 0.14
(0.788) (0.078) (0.597) (0.547)
SV 0.00039 0.00802 0.00119 �0.087 �0.040 �0.053 0.25
(0.181) (0.000) (0.032) (0.011)
SB �0.00044 0.01008 0.00019 �0.066 �0.069 �0.055 0.14
(0.820) (0.003) (0.025) (0.021)
SG 0.00223 0.01104 0.00190 0.042 �0.061 0.035 0.11
(0.255) (0.303) (0.061) (0.310)
Overall �0.00032 0.00421 0.00015 �0.052 �0.005 �0.023 0.28
(0.808) (0.000) (0.686) (0.002)
A. Almazan et al. / Journal of Financial Economics 73 (2004) 289–321316

5.2. Cross-sectional return regressions
The results just described are consistent with the conclusion that there are nosystematic, statistically significant differences in the returns to constrained versusunconstrained funds. However, it is difficult to determine whether or not fundcharacteristics that are related to both fund performance and constraint usage (e.g.,turnover) might obscure the impact of score. Cross-sectional regressions of funds’Fama-French alphas on the constraint score, both with and without controlvariables, provide an alternative, and possibly more powerful, analysis of theconstraint/performance relation.
As a first step in the analysis, we run a time-series regression of monthly returns onthe Fama-French factors. For every fund over the period from 1995 to 2001,including those which at some point drop out of the database, an alpha is calculatedfor each calendar year using (net) returns that are available in that year. For fundsthat survive the entire year, 12 monthly observations are used in the Fama-Frenchthree-factor model. Funds that disappear during the year but for which at least fiveobservations are available are included in the cross-sectional analysis. Noperformance measure is calculated for funds with fewer than five monthlyobservations. In order to explore the possibility that dropping these funds createsa look-ahead bias (see Carpenter and Lynch, 1999), we perform the analysis with theexcluded fund alphas calculated using additional returns from the preceding 12months. The inclusion of these additional alphas has no qualitative impact on theresults.
The next step is to run a cross-sectional regression, each year, relatingperformance to score. The most general form of this regression is:
#ait ¼ g0 þ dt � scoreit þ w0tYit þ eit; ð1Þ
where #ait is the estimate of fund i’s Fama-French alpha in year t; score is theconstraint score measure that applies during the year, and Yit is a vector of fund levelmonitoring and control variables. We also examine a version of Eq. (1) that omitscontrol variables and examines only the univariate relation of score and unexplainedreturn. The design of this regression explicitly assumes that the Fama-French factorsadequately control for risk. Furthermore, by using 12-month periods for estimatingthe model, we allow for the possibility that fund factor loadings change over time.
In panel A of Table 7, we present four sets of estimates of the coefficients inEq. (1), each exploiting the information available from the cross-section and time-series dimensions of the dataset in different ways. The first and second columns ofresults report coefficients from a pooled OLS estimation and a random-effectsmodel, respectively. As discussed earlier, these estimators capture the dependenciesintroduced by measuring individual fund alphas and the relation to score overseveral years. In the third column, we report findings for a between-estimator thatconsiders the average relation between alphas and score. Finally, as an alternativeapproach, we run seven separate cross-sectional regressions, one for each of the years1994 to 2000, that relate alphas to fund score measures. Then, following a Fama-MacBeth approach, we average the coefficients from seven yearly regressions and
ARTICLE IN PRESSA. Almazan et al. / Journal of Financial Economics 73 (2004) 289–321 317

report them in the last column.12 None of the four models provides evidence of asignificant relation between the score measure and Fama-French alphas.
Panel B of Table 7 reports the estimated coefficients with the full set of monitoringand control variables also included in the regression. These regressions confirm that,holding other fund characteristics constant, there is no effect of the prior level of
ARTICLE IN PRESS
Table 7
Fund level cross-sectional regressions of Fama-French a on score, monitoring, and control variables This
table reports results from the regression of the alpha from the Fama-French three-factor model, estimated
using one year of monthly observations, on Score (or Score, monitoring, and control variables) measured
at the beginning of the period. The supplementary variables are described in detail in Section 4. They
include governance measures, career concerns, load fee, peer monitoring, liquidity measures, fund size and
age, turnover, and Morningstar style categories. In the interest of saving space, the coefficient estimates for
the control variables are not reported. The omitted Morningstar category is large-cap value. The first
column is the pooled OLS estimator. The second column is the random-effects (R.E.) model. The third
column is the ‘‘between’’ OLS cross-sectional estimator constructed from the time-series averages. The
fourth column reports the average coefficient from yearly regressions. P-values are reported in
parentheses, based on robust standard errors for all the models and on the Fama-MacBeth procedure
for the averages.
Pooled OLS R.E. (GLS) Between estimator Fama-MacBeth
Panel A: Regressions with score alone
Score �0.010 �0.021 0.023 0.000
(0.819) (0.676) (0.719) (0.997)
Constant �0.089 �0.079 �0.093 �0.117
(0.000) (0.001) (0.001) (0.251)
Panel B: Regressions with score, monitoring, and control variables
Score 0.011 �0.051 0.108 0.011
(0.832) (0.402) (0.160) (0.873)
BoardSize �0.001 0.005 0.008 �0.006
(0.899) (0.373) (0.268) (0.227)
PropIndep �0.092 0.023 �0.247 �0.161
(0.359) (0.836) (0.111) (0.072)
Team 0.034 0.052 0.012 0.011
(0.173) (0.065) (0.760) (0.575)
MgrAge 0.008 0.009 0.009 0.008
(0.000) (0.007) (0.029) (0.019)
FrontLoad �0.192 �0.186 �0.241 �0.124
(0.000) (0.000) (0.000) (0.148)
BackLoad �0.166 �0.146 �0.214 �0.148
(0.000) (0.002) (0.000) (0.100)
Top 10 0.076 0.046 0.029 0.110
(0.026) (0.393) (0.676) (0.061)
Constant 0.045 0.105 �0.049 0.052
(0.639) (0.927) (0.725) (0.251)
12For each coefficient in the last column, we compute a test statistic of the form %d=s:e:ð%dÞ which is t-
distributed with 6 degrees of freedom, where %d 7�1P7
t¼1#dt; and s.e. ð%dÞ is the simple standard error of
the sample mean of the dt estimates, computed as s.e. ð%dÞ ¼ ð1=ffiffiffi7
pÞ
ffiffiffiffiffiffiffiffiffiffiffiffiffiffiffiffiffiffiffiffiffiffiffiffiffiffiffiffiffiffiffiffiffiffiffiffiffiffiffiffiffiffiffiffiffiffiffiffiffi1=ð7� 1Þ
P7t¼1 ð#dt � %dÞ2
q:
A. Almazan et al. / Journal of Financial Economics 73 (2004) 289–321318

fund constraint on subsequent performance. Note that, in contrast, severalmonitoring variables in the regression appear significant, confirming the power ofour estimation. In addition, we perform the analysis on separate subsamples (e.g.,no-load and load groups) and find consistent results.
6. Conclusion
Investment policy restrictions are a common feature of the contracts that definethe interactions between mutual fund portfolio managers and their investors. Theseconstraints assume a variety of forms, including prohibitions against short sales,borrowing, derivatives, and the holding of illiquid assets. Using a large sample ofdomestic equity mutual funds from 1994 to 2000, we demonstrate that restrictionadoption practices vary significantly across funds and that the overall level ofconstraint in the industry has changed over time. In particular, we show that olderfunds tend to face more restrictions and that fund managers in general have becomeless constrained in more recent years.
We also consider the economic determinants of constraint adoption. Our resultssupport the view that direct investment restrictions interact with a variety ofalternative monitoring mechanisms to control shareholder-manager conflicts ofinterest. These mechanisms include fund boards of directors, managerial careerconcerns, and peer monitoring through the existence of fund complexes. The datasuggest that there are two ways of controlling fund agency costs: through directinvestment policy restrictions or through a variety of competing explicit and implicitmonitoring mechanisms. Our findings are consistent with an equilibrium in whichmonitoring mechanisms and constraint use are substitutes.
We complete the study by considering whether restriction adoption practicesimpact fund performance. We compare the returns produced by otherwise similarhigh-constraint and low-constraint funds in several ways. The findings from thisinvestigation strongly indicate that, after controlling for factors such as fund size,investment style, and portfolio turnover, variations in the level of policy restrictiondo not produce economically or statistically significant return differentials. Weinterpret this evidence as supporting the notion that participants in the fund industryadopt the set of policy restrictions necessary to produce the optimal investmentcontract between investors and managers.
The evidence presented here on the use, motivation, and impact of portfolioconstraints suggests a number of directions for future research. What, for instance,are the long-term implications of investment restrictions for the performancemeasurement literature, which typically ignores the presence of constraints and theireffect on a manager’s incentive to collect and trade on information? Although fundreturns are unaffected by differences in investment restrictions in our study, suchvariations could have more subtle effects in areas such as security selection methodsor fund manager retention over an extended period of time. Further, do the set ofdirect investment restrictions commonly found in the investment policy statements ofprivate asset management firms differ substantially from the ones we examine for
ARTICLE IN PRESSA. Almazan et al. / Journal of Financial Economics 73 (2004) 289–321 319
public funds? The private contracting problem – in which a manager negotiatesdirectly with a single, well-endowed client rather than indirectly with a large numberof smaller investors – provides an alternative environment in which to study theprincipal-agent problem. Comparing the constraint-adoption practices of privatemoney managers with those obtained here is an interesting task left for futureresearch.
References
Armendariz de Aghion, B., 1999. On the design of a credit agreement with peer monitoring. Journal of
Development Economics 60, 79–104.
Arnott, R., Stiglitz, J.E., 1991. Moral hazard and nonmarket institutions: dysfunctional crowding out or
peer monitoring? American Economic Review 81, 179–190.
Brown, S.J., Goetzmann, W., Ibbotson, R.G., Ross, S.A., 1992. Survivorship bias in performance studies.
Review of Financial Studies 5, 553–580.
Brown, K.C., Harlow, W.V., Starks, L.T., 1996. Of tournaments and temptations: an analysis of
managerial incentives in the mutual fund industry. Journal of Finance 51, 85–110.
Carpenter, J.N., Lynch, A.W., 1999. Survivorship bias and attrition effects in measures of performance
persistence. Journal of Financial Economics 54, 337–374.
Chevalier, J., Ellison, G., 1997. Risk taking by mutual funds as a response to incentives. Journal of
Political Economy 105, 1167–1200.
Chevalier, J., Ellison, G., 1999. Career concerns of mutual fund managers. Quarterly Journal of
Economics 114, 389–432.
Chordia, T., 1996. The structure of mutual fund charges. Journal of Financial Economics 41, 3–39.
Clarke, R., de Silva, H., Thorley, S., 2002. Portfolio constraints and the fundamental law of active
management. Financial Analysts Journal 58, 48–66.
Del Guercio, D., Dann, L., Partch, M., 2003. Governance and boards of directors in closed-end
investment companies. Journal of Financial Economics 69, 111–152.
Deli, D.N., Varma, R., 2002. Contracting in the investment management industry: evidence from mutual
funds. Journal of Financial Economics 63, 79–98.
Dybvig, P.H., Farnsworth, H.K., Carpenter, J.N., 2003. Portfolio performance and agency. Unpublished
working paper. Washington University and New York University.
Eisenberg, T., Sundgren, S., Wells, M.T., 1998. Larger board size and decreasing firm value in small firms.
Journal of Financial Economics 48, 35–54.
Elton, E.J., Gruber, M.J., Blake, C., 2001. A first look at the accuracy of the CRSP mutual fund database
and a comparison of the CRSP and Morningstar mutual fund databases. Journal of Finance 56,
2415–2430.
Fama, E.F., 1980. Agency problems and the theory of the firm. Journal of Political Economy 88, 288–307.
Fama, E.F., French, K.R., 1993. Common risk factors in the returns on stocks and bonds. Journal of
Financial Economics 33, 3–56.
Garcia, D., 2001. Incomplete contracts in investment models. Unpublished working paper, Dartmouth
College.
Gomez, J.P., Sharma, T., 2001. Providing managerial incentives: do benchmarks matter? Unpublished
working paper, Norwegian School of Management and Instituto Tecnol !ogico Aut !onomo de M!exico.
Grinblatt, M., Titman, S., 1989. Adverse risk incentives and the design of performance-based contracts.
Management Science 35, 807–822.
Hermalin, B., Weisbach, M., 1991. The effects of board composition and direct incentives of firm
performances. Financial Management 20, 101–112.
Hermalin, B., Weisbach, M., 2003. Board of directors as an endogenously determined institution: a survey
of the economic literature. Federal Reserve Bank of New York Economic Policy Review 9, 7–26.
Holmstr .om, B., 1982. Moral hazard in teams. Bell Journal of Economics 13, 324–340.
ARTICLE IN PRESSA. Almazan et al. / Journal of Financial Economics 73 (2004) 289–321320
Holmstr .om, B., 1999. Managerial incentive problems: a dynamic perspective. Review of Economic Studies
66, 169–182.
Huber, P.J., 1967. The behavior of maximum likelihood estimates under non-standard conditions. In
Proceedings of the Fifth Berkeley Symposium on Mathematical Statistics and Probability, Vol. 1.
University of California Press, Berkely, CA, pp. 221–233.
Investment Company Institute, 1999. Understanding the Role of Mutual Fund Directors. Washington,
DC.
Jensen, M.C., 1993. The modern industrial revolution, exit, and the failure of internal control systems.
Journal of Finance 48, 831–880.
Jensen, M.C., Meckling, W.H., 1976. Theory of the firm: managerial behavior, agency costs, and
ownership structure. Journal of Financial Economics 3, 305–360.
Khorana, A., 1996. Top management turnover: an empirical investigation of mutual fund managers.
Journal of Financial Economics 40, 403–427.
Koski, J.L., Pontiff, J., 1999. How are derivatives used? Evidence from the mutual fund industry. Journal
of Finance 54, 791–816.
Pozen, R.C., 1999. The Mutual Fund Business. The MIT Press, Cambridge.
Rogers, W.H., 1993. Regression standard errors in clustered samples. Stata Technical Bulletin 13, 19–23.
Ross, S.A., 1973. The economic theory of agency: the principal’s problem. American Economic Review 63,
134–139.
Sirri, E.R., Tufano, P., 1998. Costly search and mutual fund flows. Journal of Finance 53, 1589–1622.
Smith, C., Warner, J.B., 1979. On financial contracting: an analysis of bond covenants. Journal of
Financial Economics 7, 117–162.
Starks, L.T., 1987. Performance incentive fees: an agency theoretic approach. Journal of Financial and
Quantitative Analysis 22, 17–32.
Starks, L.T., Yong, L., Zheng, L., 2002. Tax-loss selling and the January effect: Evidence from municipal
bond closed-end funds. Unplublished working paper, University of Texas.
U.S. Securities and Exchange Commission, 1992. Protecting Investors: A Half Century of Investment
Company Regulation, Washington DC.
Tufano, P., Sevick, M., 1997. Board structure and fee-setting in the U.S. mutual fund industry. Journal of
Financial Economics 46, 321–355.
Yermack, D., 1996. Higher valuation of companies with a small board of directors. Journal of Financial
Economics 40, 185–212.
ARTICLE IN PRESSA. Almazan et al. / Journal of Financial Economics 73 (2004) 289–321 321