why diamonds?
TRANSCRIPT
1 18 October 2013 |
WHY DIAMONDS? AN INDUSTRY VIEW FOR INVESTORS OCTOBER 2013
2 18 October 2013 |
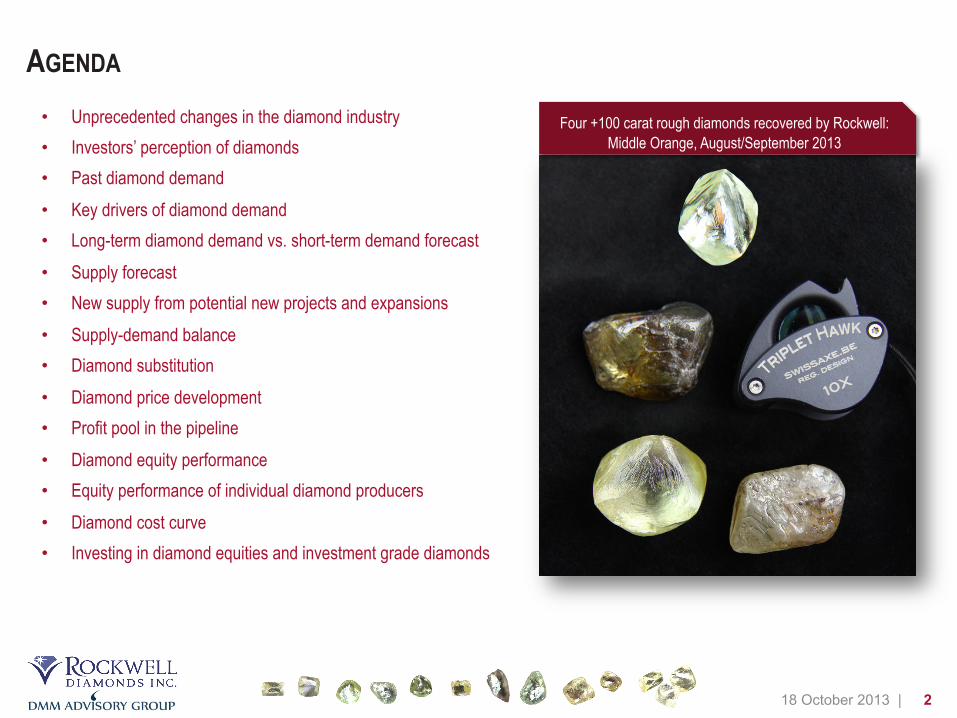
AGENDA • Unprecedented changes in the diamond industry • Investors’ perception of diamonds • Past diamond demand • Key drivers of diamond demand • Long-term diamond demand vs. short-term demand forecast • Supply forecast • New supply from potential new projects and expansions • Supply-demand balance • Diamond substitution • Diamond price development • Profit pool in the pipeline • Diamond equity performance • Equity performance of individual diamond producers • Diamond cost curve • Investing in diamond equities and investment grade diamonds
Four +100 carat rough diamonds recovered by Rockwell: Middle Orange, August/September 2013
3 18 October 2013 |
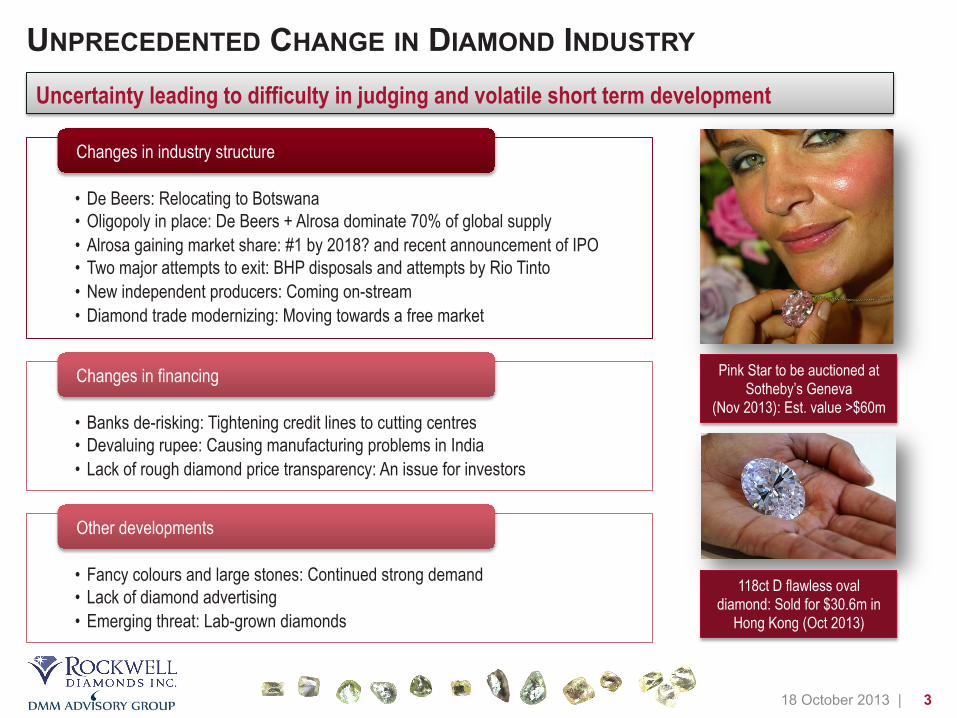
UNPRECEDENTED CHANGE IN DIAMOND INDUSTRY
• De Beers: Relocating to Botswana • Oligopoly in place: De Beers + Alrosa dominate 70% of global supply • Alrosa gaining market share: #1 by 2018? and recent announcement of IPO • Two major attempts to exit: BHP disposals and attempts by Rio Tinto • New independent producers: Coming on-stream • Diamond trade modernizing: Moving towards a free market
Changes in industry structure
• Banks de-risking: Tightening credit lines to cutting centres • Devaluing rupee: Causing manufacturing problems in India • Lack of rough diamond price transparency: An issue for investors
Changes in financing
• Fancy colours and large stones: Continued strong demand • Lack of diamond advertising • Emerging threat: Lab-grown diamonds
Other developments
2
Helena�Christensen�showing�the�diamond�in�2003�
©�Getty�Images�Entertainment�
Not�only�has�The�Pink�Star� received� the�highest�colour1�and�clarity� grades� from� the� GIA� for� pink� diamonds,� it� has� also�been� found� to�be�part�of� the� rare�subgroup�comprising� less�than�2�%�of�all�gem�diamonds���known�as�Type�IIa:�stones� in�this�group�are� chemically� the�purest�of�all�diamond� crystals�and� often� have� extraordinary� optical� transparency.� In�addition,� this� extraordinarily� important� gem� is� more� than�twice�the�size�of�the�magnificent�!Graff�PinkF�G�the�24.78�carat�fancy� intense� pink� diamond� which� established� a� world�auction�record� for�a�diamond�and�any�gemstone�or� jewel�at�$46.2� million� at� SothebyFs� Geneva� in� 2010.� The� current�record�price�per� carat� for�a�pink�diamond� ($2,155,332)�was�set�by�a�5�carat�fancy�vivid�pink�diamond2.��SThe�occurrence�of�pink�diamonds�in�nature�is�extremely�rare�in� any� sizeT,� said� Tom�Moses,� senior� vice�president� of� the�Gemological� Institute� of� America.� SItFs� our� experience� that�large�polished�pink�diamonds�G�over�ten�carats�G�very�rarely�occur�with�an�intense�colour�(V)�The�GIA�Laboratory�has�been�issuing�grading� reports� for� fifty�years�and� this� is� the� largest�pink�diamond�with� this�depth�of� colour� [vivid�pink]� that�we�have�ever�characterisedT*.��The� 132.5� carat� rough� diamond�was�mined� by�De� Beers� in�Africa� in�1999�and�painstakingly�cut�and�polished�by�Steinmetz�Diamonds�over�a�period�of� two�years�and�transformed�into�this�stunning�gemstone.�Unveiled�to�the�press�and�public�as�the�_Steinmetz�PinkF�in�Monaco�in�2003,�the�stone�was�first�sold�in�2007�and�subsequently�renamed�_The�Pink�StarF.��In� 2003,� the� diamond� was� shown� at� the� Smithsonian� Institution,� Washington,� DC,� in� the� Splendor� of�Diamonds�exhibition,�along�with� seven�of� the�worldFs� rarest�diamonds� including� the�De�Beers�Millennium�Star,�the�Allnatt�diamond,�and�the�Moussaieff�Red.�In�2005�2006,�it�was�the�star�attraction�of�the�Diamonds�exhibition�at�the�Natural�History�Museum,�London.�The�stone�also�features�in�all�authoritative�books�on�the�subject.��Ever�since�they�were�first�discovered�in�the�mines�of�India�centuries�ago,�pink�diamonds�have�been�coveted�by� rulers�and�prized�by�connoisseurs.�They�are�probably� the�most�desirable�of�all� the�coloured�diamonds.�Many�of�the�great�gems�of�history�happen�to�be�pink�diamonds,� including�the�!Williamson',�the�!Hortense',�the�!Darya�i�Nur'�and�the�!Agra'.��The�sale�of�The�Pink�Star�continues�SothebyFs�tradition�of�bringing�some�of�the�rarest�and�most�extraordinary�objects� to�market.�SothebyFs�Geneva�has� sold�a�number�of� the�most�valuable�diamonds� in� the�world�and�holds�the�current�world�auction�record�for�a�diamond�and�any�gemstone�or�jewel�since�the�sale�of�the�_Graff�PinkF� ��an�exceptionally�rare�and� truly�magnificent�Fancy� Intense�Pink�diamond�of� the�purest,�vibrant�hue,�weighing�24.78�carats�for�CHF�45.4�million�($46.2�million)2.��Given�the�global� interest� in�a�treasure�of�this�nature,�The�Pink�Star�will�be�showcased�on�a�worldwide�tour,�travelling�to�cities�including�Hong�Kong,�New�York,�London,�Zurich�and�Geneva.�
��
*�Tom�Moses�quoted�in�Mike�Duff,�SThe�Sharpest�CutT�in�Financial�Times,�31�May�2003.�
Pink Star to be auctioned at Sotheby’s Geneva
(Nov 2013): Est. value >$60m
118ct D flawless oval diamond: Sold for $30.6m in
Hong Kong (Oct 2013)
Uncertainty leading to difficulty in judging and volatile short term development
4 18 October 2013 |
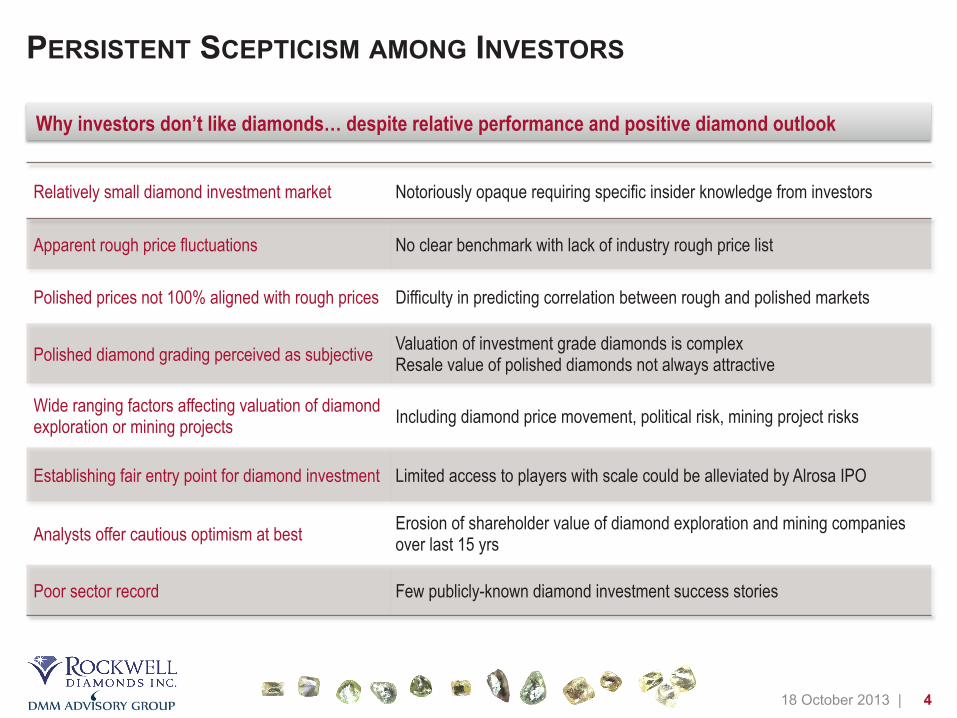
PERSISTENT SCEPTICISM AMONG INVESTORS
Why investors don’t like diamonds… despite relative performance and positive diamond outlook
Relatively small diamond investment market Notoriously opaque requiring specific insider knowledge from investors
Apparent rough price fluctuations No clear benchmark with lack of industry rough price list
Polished prices not 100% aligned with rough prices Difficulty in predicting correlation between rough and polished markets
Polished diamond grading perceived as subjective Valuation of investment grade diamonds is complex Resale value of polished diamonds not always attractive
Wide ranging factors affecting valuation of diamond exploration or mining projects Including diamond price movement, political risk, mining project risks
Establishing fair entry point for diamond investment Limited access to players with scale could be alleviated by Alrosa IPO
Analysts offer cautious optimism at best Erosion of shareholder value of diamond exploration and mining companies over last 15 yrs
Poor sector record Few publicly-known diamond investment success stories
5 18 October 2013 |
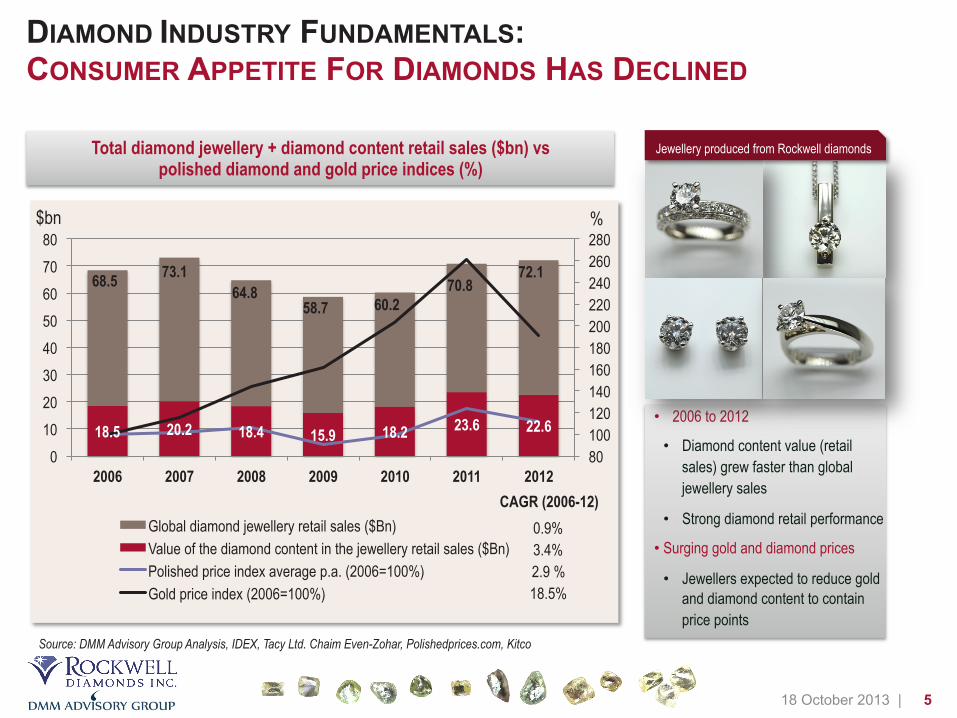
DIAMOND INDUSTRY FUNDAMENTALS: CONSUMER APPETITE FOR DIAMONDS HAS DECLINED
• 2006 to 2012
• Diamond content value (retail sales) grew faster than global jewellery sales
• Strong diamond retail performance
• Surging gold and diamond prices
• Jewellers expected to reduce gold and diamond content to contain price points
Source: DMM Advisory Group Analysis, IDEX, Tacy Ltd. Chaim Even-Zohar, Polishedprices.com, Kitco
Total diamond jewellery + diamond content retail sales ($bn) vs polished diamond and gold price indices (%)
18.5 20.2 18.4 15.9 18.2 23.6 22.6
80 100 120 140 160 180 200 220 240 260 280
0 10 20 30 40 50 60 70 80
2006 2007 2008 2009 2010 2011 2012
Global diamond jewellery retail sales ($Bn) Value of the diamond content in the jewellery retail sales ($Bn) Polished price index average p.a. (2006=100%) Gold price index (2006=100%)
68.5 73.1 64.8
58.7 60.2 70.8
72.1
0.9% 3.4% 2.9 % 18.5%
CAGR (2006-12)
$bn %
Jewellery produced from Rockwell diamonds

6 18 October 2013 |
KEY DRIVERS OF FUTURE DIAMOND DEMAND: HIGH NET WORTH INDIVIDUALS (HNWI) AND CHINESE ENGAGEMENT RINGS
Source: DMM Advisory Group Analysis, CapGemini
• ±5% historic growth p.a.: Number + average wealth of HNWIs
• Trend anticipated to persist to 2015
• Industry challenge: Maintain share of increased wealth spent on
diamonds and diamond jewellery
0
10
20
30
40
50
60
0
2
4
6
8
10
12
14
1999 2000 2001 2002 2003 2004 2005 2006 2007 2008 2009 2010 2011 2012F 2013F 2014F 2015F
Number of HNWIs (M)
HNWI Wealth ($Tr)
Number (m) and wealth ($tr) of HNWI
m
CAGR (1999-2011): 5.1%
CAGR (1999-2011): 5.8%
Source: DMM Advisory Group Analysis, De Beers
$tr
First time brides receiving a diamond engagement ring
• 40 yrs to reach 80% penetration in USA • Japan needed ±30yrs to reach 77% • Significant headroom in China: 10-20 yrs until saturation • Millions of additional Chinese brides receiving diamond
engagement rings in the future
0% 10% 20% 30% 40% 50% 60% 70% 80% 90%
1940
1950
1960
1970
1980
1990
2000
2010
2020
2030
USA
Japan China
Possible saturation level
80% 77%
1% 10% 5%
31%
7 18 October 2013 |
0
5
10
15
20
25
30
35
40
2003
20
04
2005
20
06
2007
20
08
2009
20
10
2011
20
12
2013
F 20
14F
2015
F 20
16F
2017
F 20
18F
2019
F 20
20F
2021
F 20
22F
2023
F
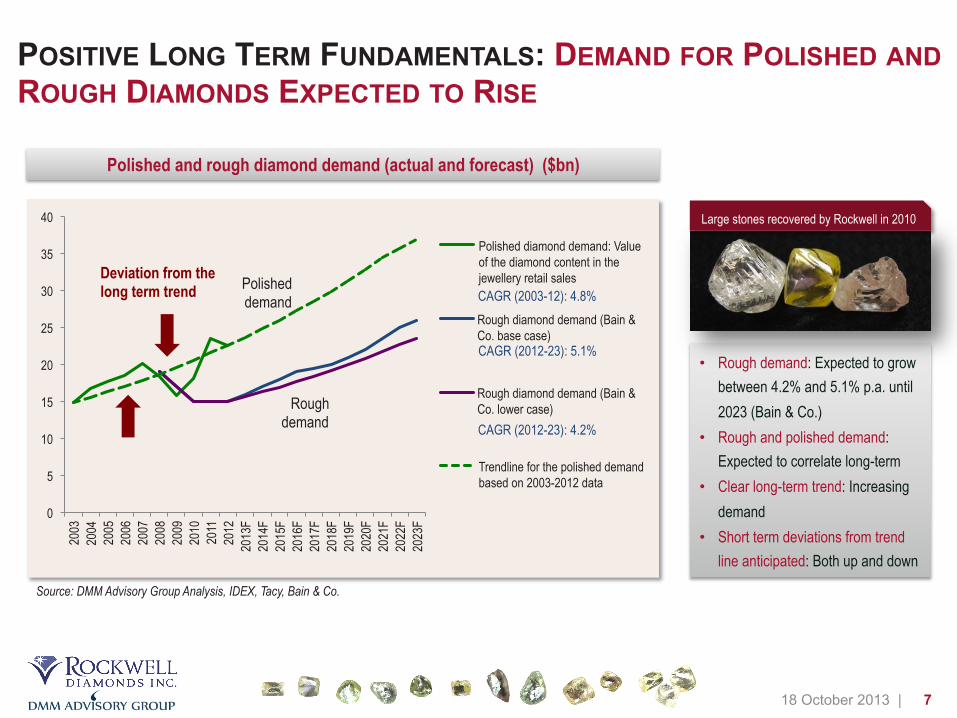
Polished diamond demand: Value of the diamond content in the jewellery retail sales
Rough diamond demand (Bain & Co. base case)
Rough diamond demand (Bain & Co. lower case)
Trendline for the polished demand based on 2003-2012 data
POSITIVE LONG TERM FUNDAMENTALS: DEMAND FOR POLISHED AND ROUGH DIAMONDS EXPECTED TO RISE
CAGR (2003-12): 4.8%
CAGR (2012-23): 5.1%
CAGR (2012-23): 4.2%
Source: DMM Advisory Group Analysis, IDEX, Tacy, Bain & Co.
Polished and rough diamond demand (actual and forecast) ($bn)
• Rough demand: Expected to grow between 4.2% and 5.1% p.a. until 2023 (Bain & Co.)
• Rough and polished demand: Expected to correlate long-term
• Clear long-term trend: Increasing demand
• Short term deviations from trend line anticipated: Both up and down
Deviation from the long term trend Polished
demand
Rough demand
Large stones recovered by Rockwell in 2010
8 18 October 2013 |
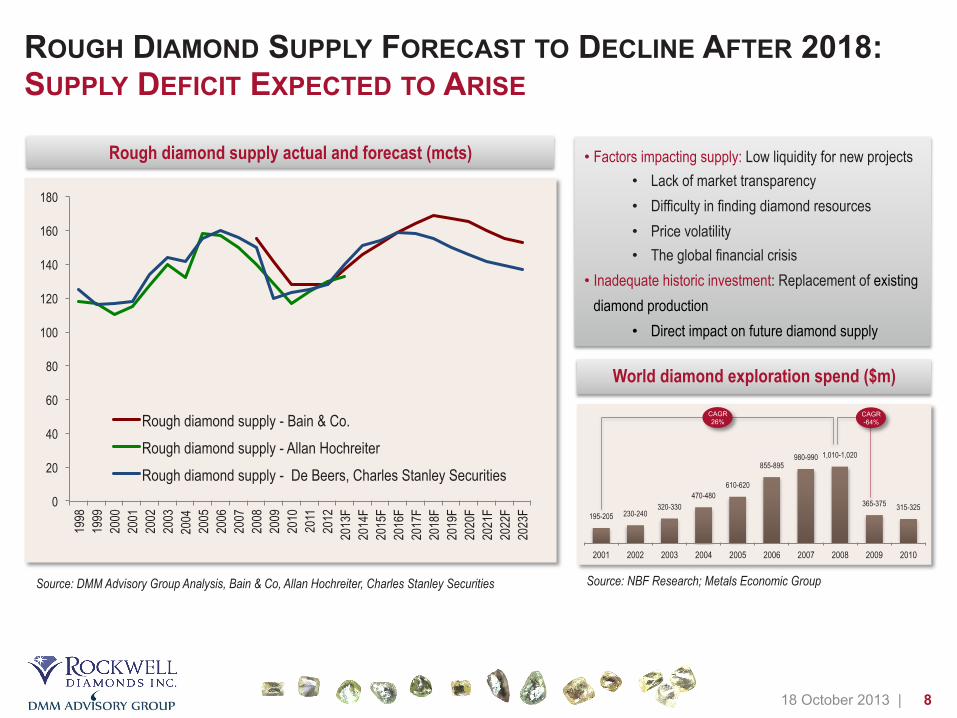
195-205 230-240 320-330
470-480 610-620
855-895 980-990 1,010-1,020
365-375 315-325
2001 2002 2003 2004 2005 2006 2007 2008 2009 2010
World diamond exploration spend ($m)
Source: NBF Research; Metals Economic Group
CAGR 26%
CAGR -64%
ROUGH DIAMOND SUPPLY FORECAST TO DECLINE AFTER 2018: SUPPLY DEFICIT EXPECTED TO ARISE
• Factors impacting supply: Low liquidity for new projects • Lack of market transparency • Difficulty in finding diamond resources • Price volatility • The global financial crisis
• Inadequate historic investment: Replacement of existing diamond production
• Direct impact on future diamond supply
Rough diamond supply actual and forecast (mcts)
Source: DMM Advisory Group Analysis, Bain & Co, Allan Hochreiter, Charles Stanley Securities
0
20
40
60
80
100
120
140
160
180
1998
19
99
2000
20
01
2002
20
03
2004
20
05
2006
20
07
2008
20
09
2010
20
11
2012
20
13F
2014
F 20
15F
2016
F 20
17F
2018
F 20
19F
2020
F 20
21F
2022
F 20
23F
Rough diamond supply - Bain & Co. Rough diamond supply - Allan Hochreiter Rough diamond supply - De Beers, Charles Stanley Securities
9 18 October 2013 |
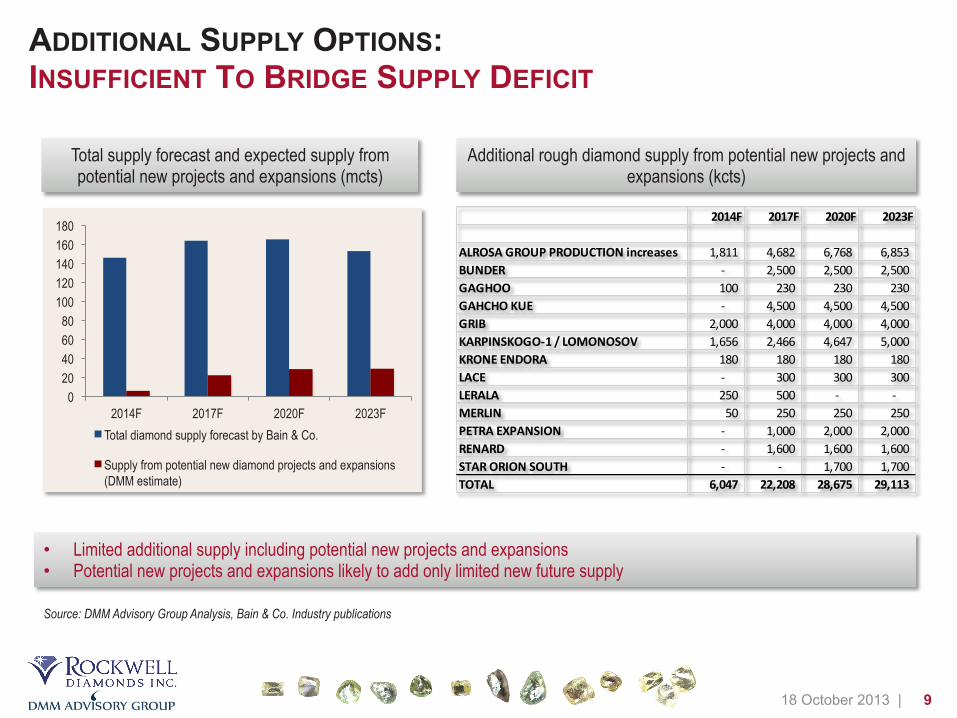
ADDITIONAL SUPPLY OPTIONS: INSUFFICIENT TO BRIDGE SUPPLY DEFICIT
Source: DMM Advisory Group Analysis, Bain & Co. Industry publications
Additional rough diamond supply from potential new projects and expansions (kcts)
2014F 2017F 2020F 2023F
ALROSA GROUP PRODUCTION increases 1,811 4,682 6,768 6,853 BUNDER -‐ 2,500 2,500 2,500 GAGHOO 100 230 230 230 GAHCHO KUE -‐ 4,500 4,500 4,500 GRIB 2,000 4,000 4,000 4,000 KARPINSKOGO-‐1 / LOMONOSOV 1,656 2,466 4,647 5,000 KRONE ENDORA 180 180 180 180 LACE -‐ 300 300 300 LERALA 250 500 -‐ -‐ MERLIN 50 250 250 250 PETRA EXPANSION -‐ 1,000 2,000 2,000 RENARD -‐ 1,600 1,600 1,600 STAR ORION SOUTH -‐ -‐ 1,700 1,700 TOTAL 6,047 22,208 28,675 29,113
• Limited additional supply including potential new projects and expansions • Potential new projects and expansions likely to add only limited new future supply
Total supply forecast and expected supply from potential new projects and expansions (mcts)
0 20 40 60 80
100 120 140 160 180
2014F 2017F 2020F 2023F Total diamond supply forecast by Bain & Co.
Supply from potential new diamond projects and expansions (DMM estimate)
10 18 October 2013 |
10
12
14
16
18
20
22
24
26
28
2012 2013F 2014F 2015F 2016F 2017F 2018F 2019F 2020F 2021F 2022F 2023F
Rough diamond demand forecast - Bain & Co. base case for demand forecast Rough diamond demand - Bain & Co. lower case for demand forecast Rough diamond supply forecast - Bain & Co. base production forecast Rough diamond supply forecast - Bain & Co. including production increase
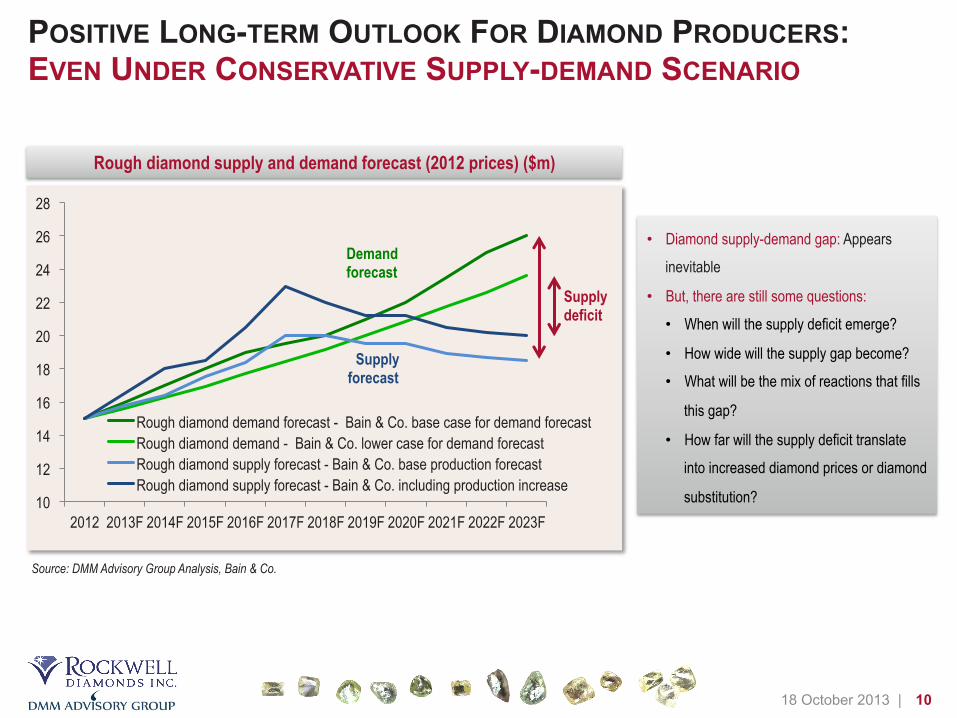
POSITIVE LONG-TERM OUTLOOK FOR DIAMOND PRODUCERS: EVEN UNDER CONSERVATIVE SUPPLY-DEMAND SCENARIO
Demand forecast
Rough diamond supply and demand forecast (2012 prices) ($m)
Source: DMM Advisory Group Analysis, Bain & Co.
• Diamond supply-demand gap: Appears
inevitable
• But, there are still some questions:
• When will the supply deficit emerge?
• How wide will the supply gap become?
• What will be the mix of reactions that fills
this gap?
• How far will the supply deficit translate
into increased diamond prices or diamond
substitution?
Supply forecast
Supply deficit
11 18 October 2013 |
SUPPLY SIDE GAP: LONG TERM IMPACT OF RECYCLING AND LAB-GROWN DIAMONDS
• Catalyst for significant polished diamond recycling: More established polished diamond investment market • Impediment for recycling: Difficulty evaluating polished diamonds and low liquidity in investment diamonds • Still more attractive to keep diamonds: Sale to retailers generally at deep discounts
Recycling: Not new to the industry but gaining ground
• Technology developed some time ago: Technological improvements enabled higher volume / lower cost production of high-quality diamonds
• Misperception among natural diamond stakeholders: Selling lab-grown diamonds for jewellery more profitable than industrial end-uses
• Fact: Industrial application for optical, electrical and cutting tool applications more lucrative • High production costs for jewellery-grade synthetics: Synthetic producers likely to remain focused on industrial sector • Production of jewellery-grade lab-grown diamonds in 2012 estimated 50-100k carats vs 130mcts of natural
diamonds: Few synthetics actually used in jewellery • Rapid advances expected for lab-grown diamond production technology: Jewellery application will become more
attractive for producers
Lab-grown (synthetic) diamonds: Jewellery end use still low
12 18 October 2013 |
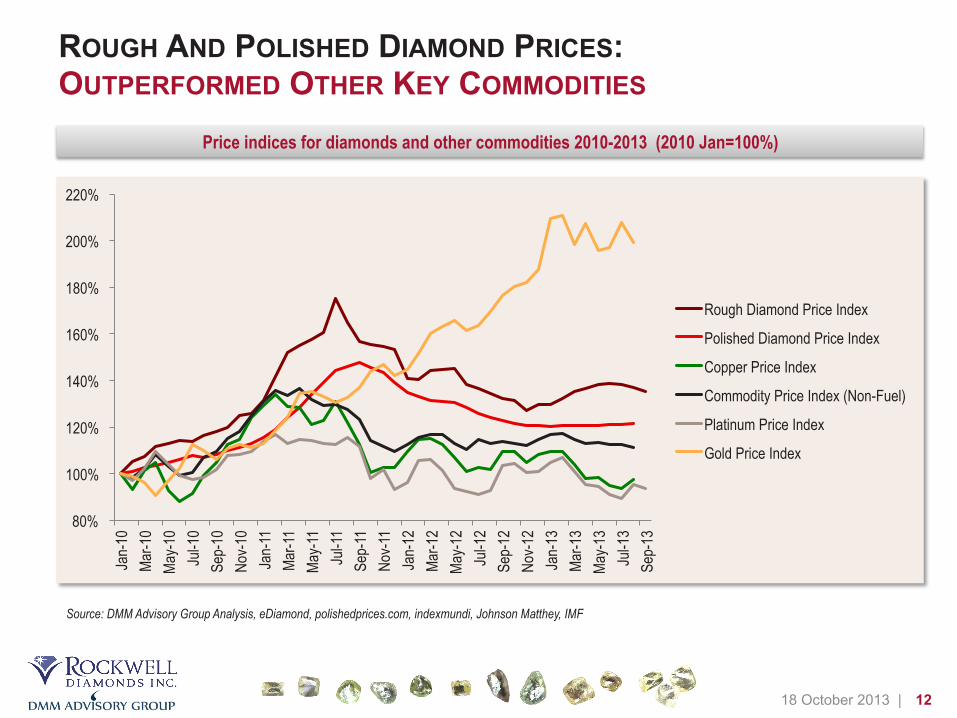
ROUGH AND POLISHED DIAMOND PRICES: OUTPERFORMED OTHER KEY COMMODITIES
Price indices for diamonds and other commodities 2010-2013 (2010 Jan=100%)
Source: DMM Advisory Group Analysis, eDiamond, polishedprices.com, indexmundi, Johnson Matthey, IMF
80%
100%
120%
140%
160%
180%
200%
220%
Jan-
10
Mar-1
0 Ma
y-10
Jul-1
0 Se
p-10
No
v-10
Jan-
11
Mar-1
1 Ma
y-11
Jul-1
1 Se
p-11
No
v-11
Jan-
12
Mar-1
2 Ma
y-12
Jul-1
2 Se
p-12
No
v-12
Jan-
13
Mar-1
3 Ma
y-13
Jul-1
3 Se
p-13
Rough Diamond Price Index
Polished Diamond Price Index
Copper Price Index
Commodity Price Index (Non-Fuel)
Platinum Price Index
Gold Price Index
13 18 October 2013 |
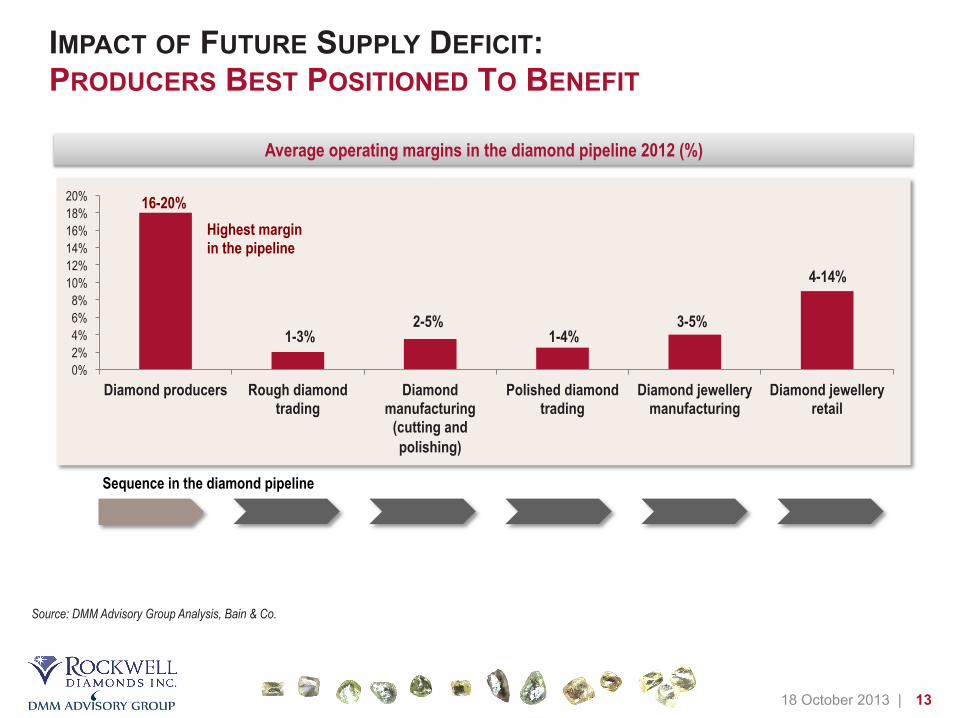
IMPACT OF FUTURE SUPPLY DEFICIT: PRODUCERS BEST POSITIONED TO BENEFIT
0% 2% 4% 6% 8%
10% 12% 14% 16% 18% 20%
Diamond producers Rough diamond trading
Diamond manufacturing
(cutting and polishing)
Polished diamond trading
Diamond jewellery manufacturing
Diamond jewellery retail
Average operating margins in the diamond pipeline 2012 (%)
16-20%
1-3%
Sequence in the diamond pipeline
2-5% 1-4%
3-5%
4-14%
Highest margin in the pipeline
Source: DMM Advisory Group Analysis, Bain & Co.
14 18 October 2013 |
50%
70%
90%
110%
130%
150%
170%
190%
210%
230%
250% HSBC Global Mining Diamonds Index S&P/TSX Capped Diversified Metals & Mining Index Anglo American Share Price Indexed S&P 500 Indexed
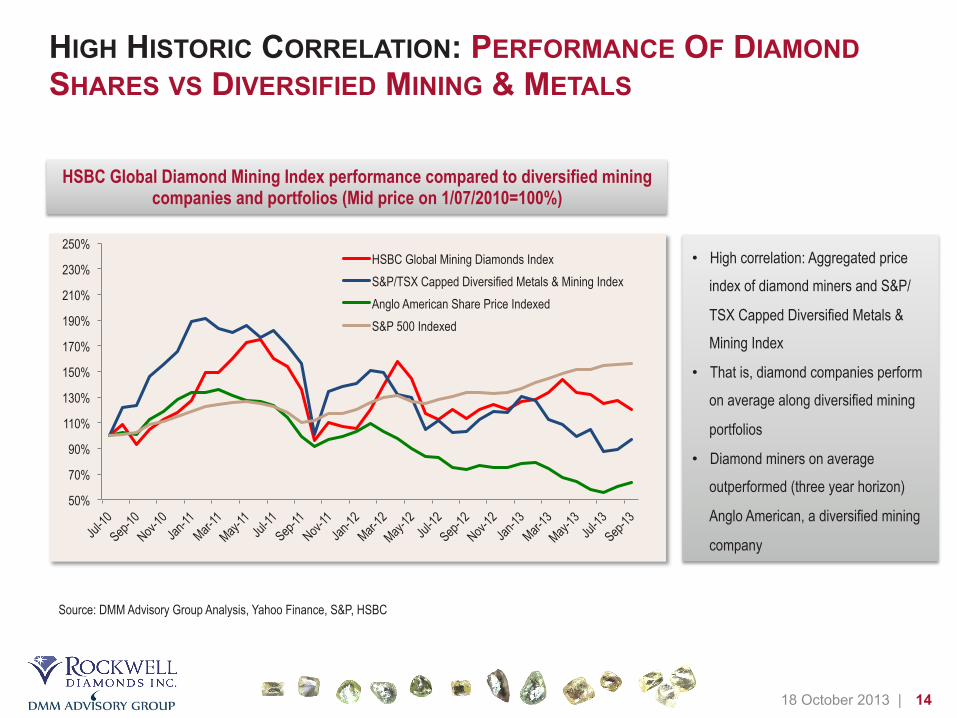
HIGH HISTORIC CORRELATION: PERFORMANCE OF DIAMOND SHARES VS DIVERSIFIED MINING & METALS
HSBC Global Diamond Mining Index performance compared to diversified mining companies and portfolios (Mid price on 1/07/2010=100%)
• High correlation: Aggregated price
index of diamond miners and S&P/
TSX Capped Diversified Metals &
Mining Index
• That is, diamond companies perform
on average along diversified mining
portfolios
• Diamond miners on average
outperformed (three year horizon)
Anglo American, a diversified mining
company
Source: DMM Advisory Group Analysis, Yahoo Finance, S&P, HSBC
15 18 October 2013 |
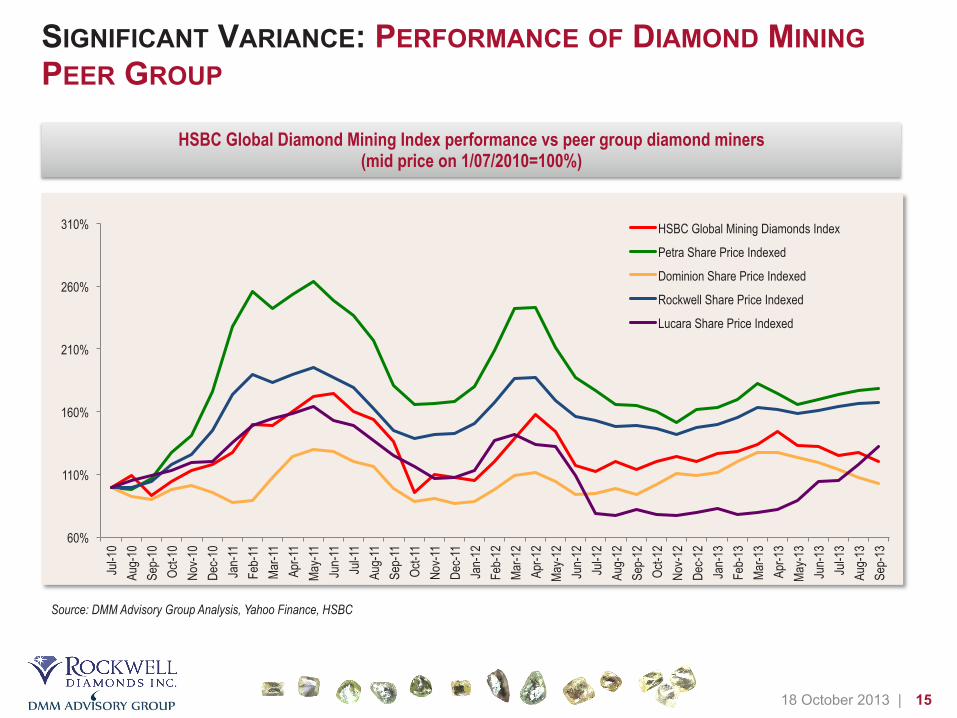
SIGNIFICANT VARIANCE: PERFORMANCE OF DIAMOND MINING PEER GROUP
Source: DMM Advisory Group Analysis, Yahoo Finance, HSBC
HSBC Global Diamond Mining Index performance vs peer group diamond miners (mid price on 1/07/2010=100%)
60%
110%
160%
210%
260%
310%
Jul-1
0 Au
g-10
Se
p-10
Oc
t-10
Nov-1
0 De
c-10
Jan-
11
Feb-
11
Mar-1
1 Ap
r-11
May-1
1 Ju
n-11
Ju
l-11
Aug-
11
Sep-
11
Oct-1
1 No
v-11
Dec-1
1 Ja
n-12
Fe
b-12
Ma
r-12
Apr-1
2 Ma
y-12
Jun-
12
Jul-1
2 Au
g-12
Se
p-12
Oc
t-12
Nov-1
2 De
c-12
Jan-
13
Feb-
13
Mar-1
3 Ap
r-13
May-1
3 Ju
n-13
Ju
l-13
Aug-
13
Sep-
13
HSBC Global Mining Diamonds Index
Petra Share Price Indexed
Dominion Share Price Indexed
Rockwell Share Price Indexed
Lucara Share Price Indexed
16 18 October 2013 |
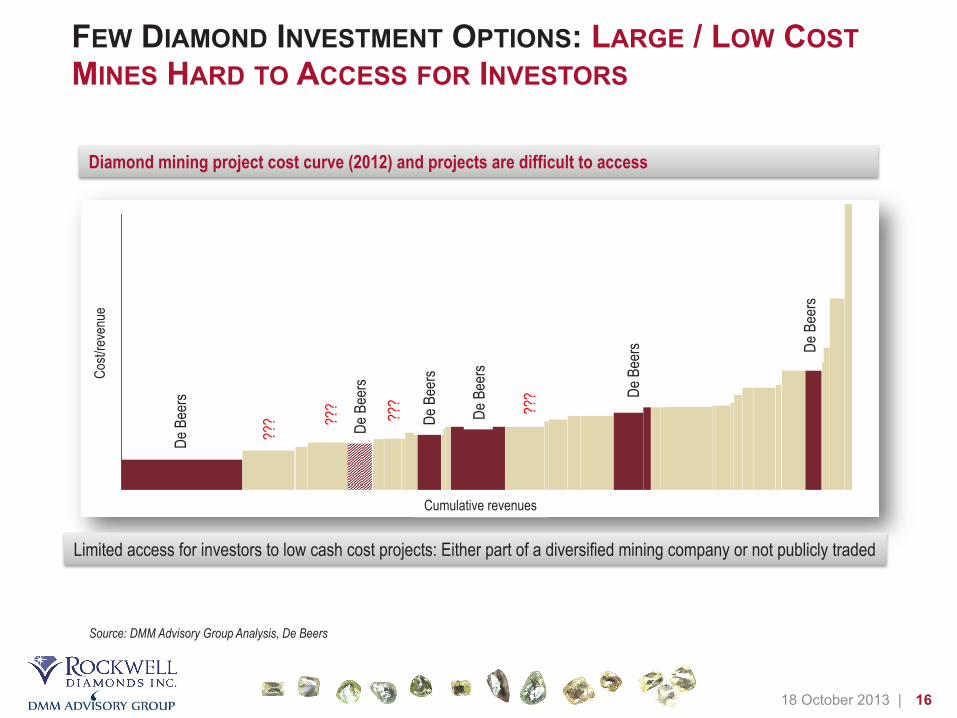
FEW DIAMOND INVESTMENT OPTIONS: LARGE / LOW COST MINES HARD TO ACCESS FOR INVESTORS
Source: DMM Advisory Group Analysis, De Beers
More than 70% of De Beers production is located on the lower half of the cost curve
28
Higher margin assetsJw
anen
g
Gahc
ho K
ue (p
rojec
t)
Vene
tia
Orap
a
Nam
deb
oper
ation
sDa
mtsh
aa
Snap
lake
Cost/
reve
nue
Cumulative revenue
Source: De Beers
Diamond mining project cost curve (2012) and projects are difficult to access De
Bee
rs
Limited access for investors to low cash cost projects: Either part of a diversified mining company or not publicly traded
Cumulative revenues
De B
eers
De B
eers
De B
eers
De B
eers
De B
eers
??? ??
? ???
???
Cost/
reve
nue
17 18 October 2013 |
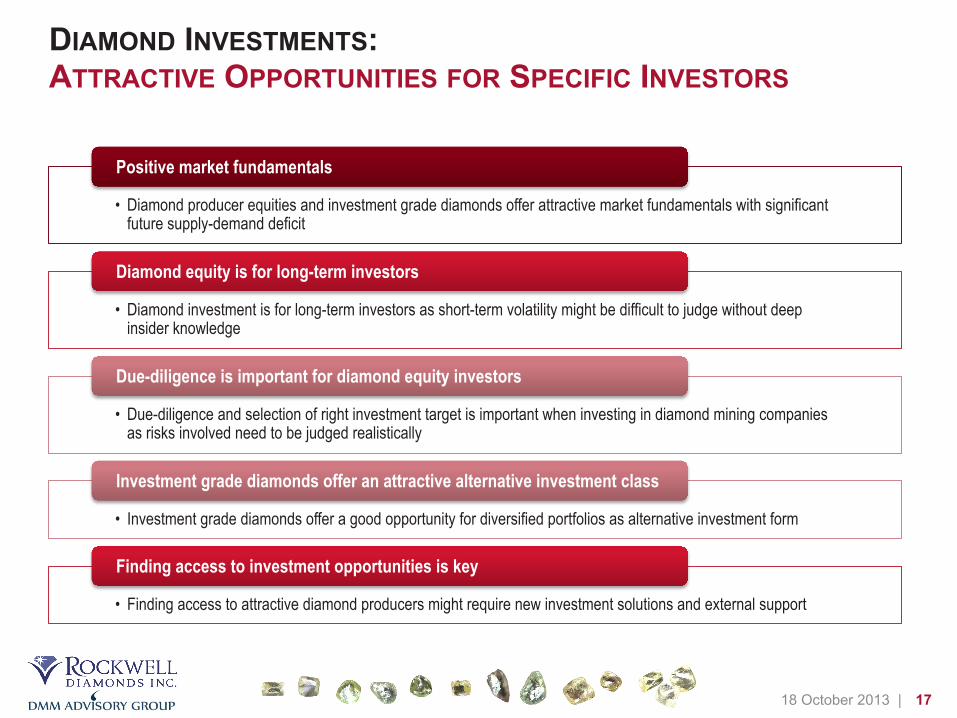
DIAMOND INVESTMENTS: ATTRACTIVE OPPORTUNITIES FOR SPECIFIC INVESTORS
• Diamond producer equities and investment grade diamonds offer attractive market fundamentals with significant future supply-demand deficit
Positive market fundamentals
• Diamond investment is for long-term investors as short-term volatility might be difficult to judge without deep insider knowledge
Diamond equity is for long-term investors
• Due-diligence and selection of right investment target is important when investing in diamond mining companies as risks involved need to be judged realistically
Due-diligence is important for diamond equity investors
• Investment grade diamonds offer a good opportunity for diversified portfolios as alternative investment form
Investment grade diamonds offer an attractive alternative investment class
• Finding access to attractive diamond producers might require new investment solutions and external support
Finding access to investment opportunities is key
18 18 October 2013 |
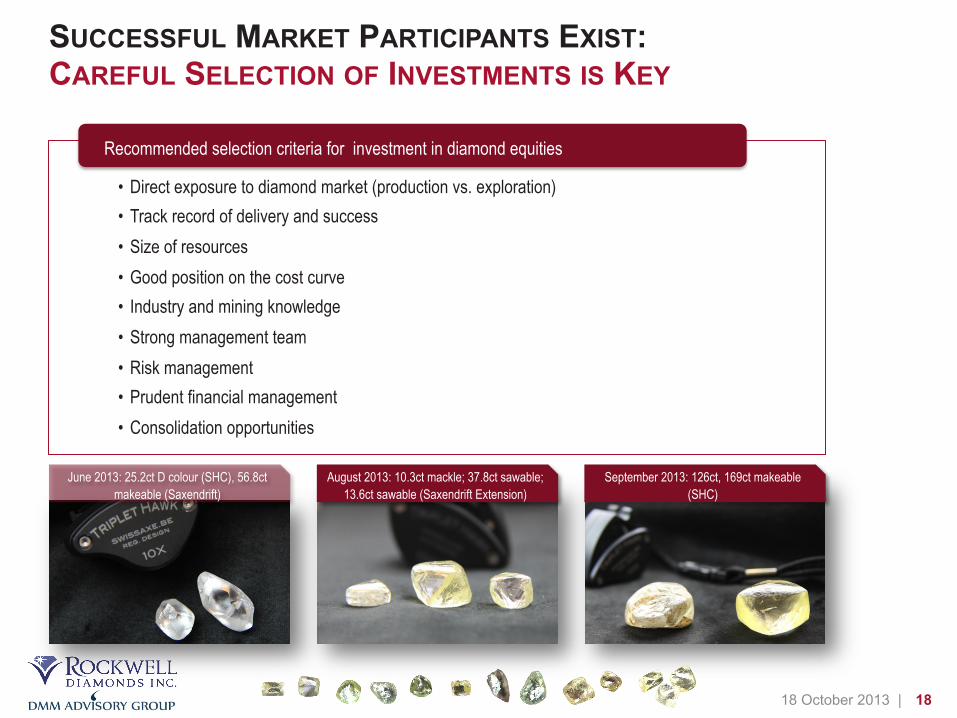
SUCCESSFUL MARKET PARTICIPANTS EXIST: CAREFUL SELECTION OF INVESTMENTS IS KEY
• Direct exposure to diamond market (production vs. exploration) • Track record of delivery and success • Size of resources • Good position on the cost curve • Industry and mining knowledge • Strong management team • Risk management • Prudent financial management • Consolidation opportunities
Recommended selection criteria for investment in diamond equities
August 2013: 10.3ct mackle; 37.8ct sawable; 13.6ct sawable (Saxendrift Extension)
June 2013: 25.2ct D colour (SHC), 56.8ct makeable (Saxendrift)
September 2013: 126ct, 169ct makeable (SHC)

19 18 October 2013 |
FEW EXPLORATION / DEVELOPMENT COMPANIES: CONSOLIDATION POTENTIAL IN CANADA & SOUTHERN AFRICA
Alrosa
De Beers/MPV Dianor
Dominion Grizzly Discoveries Kennady Diamonds
Metalex Ventures North Arrow
Peregrine Rio Tinto
Shore Gold Stornoway
Alrosa De Beers
Gem Itm
Lucapa Mwana
Sml Transhex
Alrosa Botswana Diamonds
Debswana Gem Diamonds
Kimberley Diamond Petra Diamonds
Tsodilo Pangolin
CNK
Rio Tinto De Beers
Lucara Paragon Firestone
Namakwa Diamonds
Karelian Mantle Sunrise
Res.
True North Gems
Stellar
Sunrise
Delrand
Blue Rock Diamcor
Diamondcorp
Alrosa Lukoil
Alrosa
• Numerous single project companies � Financing challenges
20 18 October 2013 |
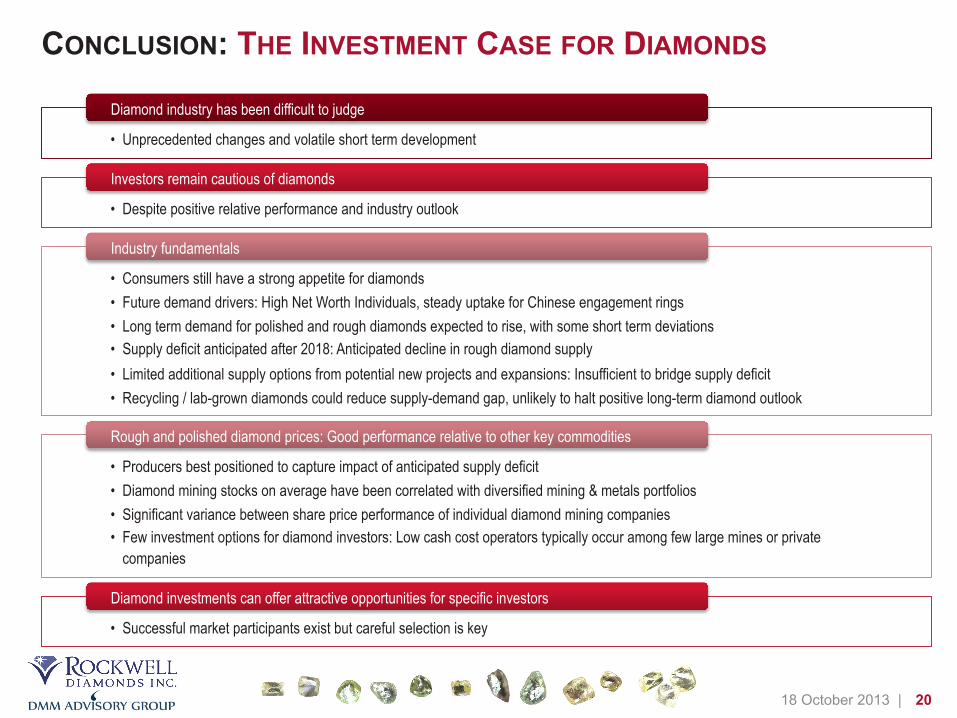
CONCLUSION: THE INVESTMENT CASE FOR DIAMONDS
• Unprecedented changes and volatile short term development
Diamond industry has been difficult to judge
• Despite positive relative performance and industry outlook
Investors remain cautious of diamonds
• Consumers still have a strong appetite for diamonds • Future demand drivers: High Net Worth Individuals, steady uptake for Chinese engagement rings • Long term demand for polished and rough diamonds expected to rise, with some short term deviations • Supply deficit anticipated after 2018: Anticipated decline in rough diamond supply • Limited additional supply options from potential new projects and expansions: Insufficient to bridge supply deficit • Recycling / lab-grown diamonds could reduce supply-demand gap, unlikely to halt positive long-term diamond outlook
Industry fundamentals
• Producers best positioned to capture impact of anticipated supply deficit • Diamond mining stocks on average have been correlated with diversified mining & metals portfolios • Significant variance between share price performance of individual diamond mining companies • Few investment options for diamond investors: Low cash cost operators typically occur among few large mines or private
companies
Rough and polished diamond prices: Good performance relative to other key commodities
• Successful market participants exist but careful selection is key
Diamond investments can offer attractive opportunities for specific investors
21 18 October 2013 |
THANK YOU FOR YOUR ATTENTION: QUESTIONS?
116.3 carat sawable, recovered at Saxendrift plant from Saxendrift Extension gravels (August 2013)
22 18 October 2013 |
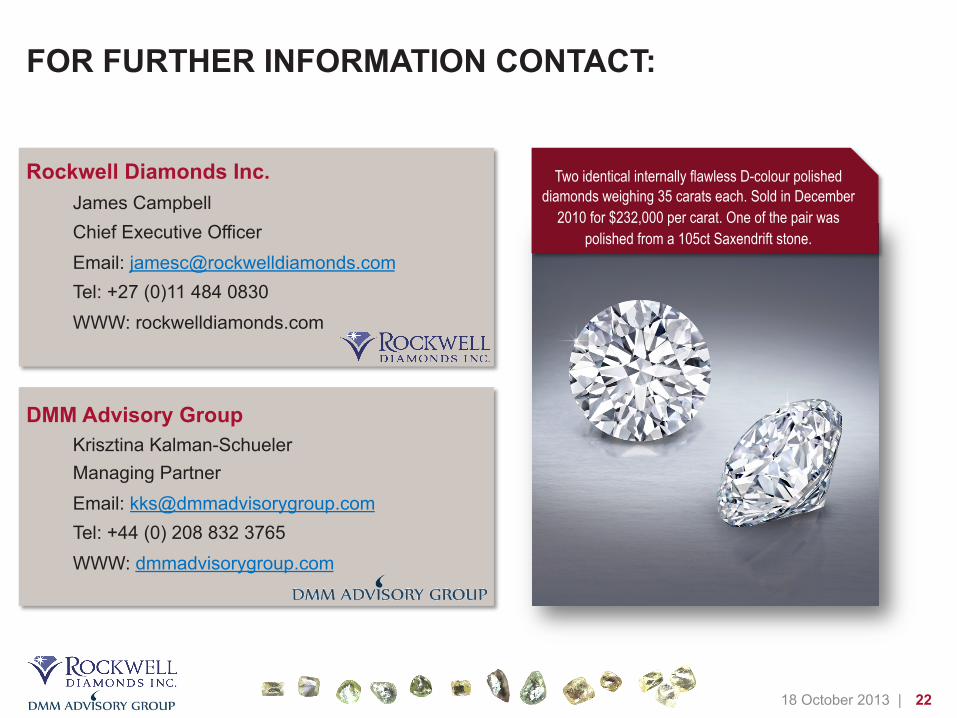
FOR FURTHER INFORMATION CONTACT:
Rockwell Diamonds Inc. James Campbell Chief Executive Officer Email: [email protected] Tel: +27 (0)11 484 0830 WWW: rockwelldiamonds.com
DMM Advisory Group Krisztina Kalman-Schueler Managing Partner Email: [email protected] Tel: +44 (0) 208 832 3765 WWW: dmmadvisorygroup.com
Two identical internally flawless D-colour polished diamonds weighing 35 carats each. Sold in December
2010 for $232,000 per carat. One of the pair was polished from a 105ct Saxendrift stone.