why distributed? - ieee · in addition, improved power electronics and commu-nication and control...
TRANSCRIPT

16 ieee power & energy magazine march/april 20191540-7977/19©2019IEEE
Why Distributed?
A Critical Review of the Tradeoffs Between Centralized and Decentralized Resources
By Scott P. Burger, Jesse D. Jenkins, Samuel C. Huntington, and Ignacio J. Pérez-Arriaga
©ISTOCKPHOTO.COM/DRAFTER123

T
march/april 2019 ieee power & energy magazine 17
THE RECENT PROLIFERATION OF DISTRIBUTED energy resources (DERs) is creating new options for the delivery of key electricity services, including energy, firm capacity, operating reserves, and even alternatives to transmis-sion or distribution network investments. Rooftop solar photo-voltaics (PVs) have the highest profile of these resources, but DERs include any generator or energy-storage device connected at distribution voltage levels and characterized by relatively small capacities (e.g., a few kilowatts to a few mega-watts). In addition, improved power electronics and commu-nication and control technologies enable more efficient and
dynamic electricity consumption as well as the ability for flexible demand (demand response) to serve as a DER in
many contexts.DERs have the ability to deliver the same elec-
tricity services provided by centralized resources, including large-scale generators and transmission and distribution network assets. However, because of their distributed and modular nature, DERs are capable of providing these services at locations in power grids where they are most valuable. If sited at the right locations and operated at the right times, DERs can deliver more locational value than more centralized resources. However, DERs also tend to cost more on a per-unit basis than their central-ized counterparts, which is due to economies of unit scale.
DERs offer new options and tradeoffs for power system planners, policy makers, and regulators. How
should decision makers weigh the additional value and additional costs of DERs when considering how to
deploy them in the most societally beneficial manner? This article addresses this question and provides a simple frame-
work for understanding the tradeoffs between distributed resources and their more centralized counterparts and assess-ing the optimal scale and location for DERs, including solar PVs and energy-storage devices.
Regulators and policy makers are increasingly debating the value of DERs and, in particular, whether they deserve additional policy and regulatory support above and beyond generalized support for low-carbon energy technologies. In many jurisdictions, DERs currently receive robust policy and regulatory support that gives them advantages relative to cen-tralized competitors. In Europe, for example, feed-in tariffs are typically larger for distributed solar than for centralized solar. In the United States, net-metering policies, (explicit carve-outs for distributed solar in state renewable portfolio standards) and favorable taxation policies provide signifi-cantly more support for distributed than centralized solar. Similarly, support policies often favor distributed storage over centralized storage. The public costs of these policies can be substantial. For example, the Go Solar California program
provided US$3.35 billion in support for distributed solar between 2007 and 2016. Under Massachusetts’ distributed solar support scheme, termed SMART, the net present value of all payments to solar PV systems under 25 kW is roughly 3.5 times the net present value of all payments to solar PV systems above 6 MW in size (including the value of renew-able energy credits, payments under SMART, net metering, and payments from the wholesale electricity market). Is this additional support justified by the additional locational value that DERs deliver?
The potential for distributed resources to deliver addi-tional value relative to centralized solutions has led many power system stakeholders to proclaim the eminent and potentially disruptive proliferation of DERs. This opinion is best epitomized by Audrey Zibelman, the former chair of the New York Public Service Commission and current chief executive officer of the Australian Energy Market Operator, who recently wrote that “rooftop solar, energy storage (from household batteries to electric vehicles), smart energy man-agement technology, and the aggregation of demand are all areas where demand, rather than generation, can become [New York’s] primary energy resource” (Zibelman, 2016). She is not alone in her vision of a world where DERs provide most power system services.
To understand the potential of DERs, it is important to consider the costs and benefits. Academic and indus-try analysts have developed a significant body of research identifying the costs and benefits of DER integration, and they have analyzed issues like hosting capacity in detail. This research tends to focus on the impacts of DERs on dis-tribution network costs, resistive losses, voltage, reliability, and resiliency.
Many DERs can be deployed at different scales and exhibit economies of unit scale (i.e., declining costs per unit of capac-ity as the unit size increases). Energy-storage devices, solar PVs, and other distributed generators all fall into this cate-gory. For example, solar PVs can be deployed at the kilowatt scale on residential rooftops, the scale of several hundred kilo-watt to 10 MW on commercial rooftops or ground-mounted arrays, or the scale of tens to hundreds of megawatts in so-called utility-scale solar farms. Significant cost differences exist between smaller- and larger-scale PV installations, with rooftop solar projects in the United States costing anywhere from 150 to 300% of the equivalent capacity of utility-scale solar. Although researchers have studied the impact of DERs on a variety of technical aspects of the power system, their incremental capital costs relative to larger-scale resources are often ignored. Simply studying the net costs and benefits of a particular technology in a particular location ignores two key facts:
1) The same resource may be more efficiently deployed elsewhere in the system at lower cost.
2) Other resources, for example, flexible and price-re-sponsive demand, may be able to provide the same service with greater net benefit to society.
Digital Object Identifier 10.1109/MPE.2018.2885203
Date of publication: 20 March 2019

18 ieee power & energy magazine march/april 2019
The latter point is particularly critical because many DERs, e.g., electric vehicles and flexible loads, are inher-ently distributed and do not face the same tradeoffs with economies of scale. In many cases, locational value can be entirely tapped by better leveraging existing resources, obviating the need for investing in new power system infrastructure.
This article demonstrates that discerning the optimal size and location at which to deploy technologies that can be installed at multiple scales requires analyzing tradeoffs between economies of unit scale and locational value. The value of some electricity services changes depending on where they are provided in the grid. We argue that the addi-tional locational value obtained by deploying a technology at a distributed scale must outweigh the opportunity cost of not capitalizing fully on economies of unit scale, which we call the incremental unit costs. Where incremental unit costs exceed locational value, society incurs an important and often overlooked distributed opportunity cost when-ever distributed resources are deployed in lieu of more affordable, larger-scale options. Additionally, we argue that the nonlocational value associated with electricity ser-vices that can be equivalently provided by centralized and decentralized units, such as operating reserves or emis-sions avoidance, should not factor into the economics of deciding whether to preferentially support the deployment of DERs.
Much of the following analysis, including many of the original graphics, stems from The Utility of the Future: An MIT Energy Initiative Response to an Industry in Transition (see Pérez-Arriaga et al., in the “For Further Read-ing” section, which provides a deeper methodologi -cal explanation).
Understanding Locational and Nonlocational ValueDERs compete with conventional generation and network assets to provide electricity services. In this sense, they are no dif-ferent from other options for electricity service provision. What distinguishes DERs is their ability to deploy these resources closer to the point of electricity consumption and in locations inaccessible to more centralized resources.
This capability is important because the value of some elec-tricity services changes with the location of provision. This dif-ference in locational value emerges from the physical character-istics of electricity networks, including resistive losses, capacity limits of network components, voltage limits at network nodes, and the potential for network failures that may disrupt delivery of electricity services. Three primary electricity services con-stitute the bulk of locational value: electrical energy, network capacity (or nonwire alternatives to network capacity), and enhanced reliability or resilience.
Power quality management and black start provide loca-tional value. However, because the cost for these services typi-cally makes up less than 1% of the total cost of electricity in a given system, these values will not be discussed in detail.
The Locational Value of EnergyBecause of the impact of network losses and congestion on electricity networks, the value of electrical energy consump-tion or injection varies at different points in the power system. DERs have the potential to create significant value by sup-plying energy (or reducing net withdrawals) at locations where networks are frequently constrained and marginal losses on transmission and distribution systems are large.
As Figure 1 illustrates, the 2015 average locational marginal prices at the transmission level in the PJM Interconnection
0.1% 0.1%
8.4%
50.4%
26.2%
7.3%
2.3% 0.9% 0.4% 0.4% 0.5%2.9%
<1 1–10 11–20 21–30 31–40 41–50 51–60 61–70 71–80 81–90 91–100 >100US$ (MWh)
More Than Three Quarters ofNodes Between US$21 and 40/MWh
Approximately3% of Nodes With
Very High Locational Value,3–10 Times the Average
figure 1. The distribution of the annual average locational marginal prices at each node in the PJM Interconnection in 2015. (Data from PJM Interconnection.)
march/april 2019 ieee power & energy magazine 19
(the largest electricity market in the United States, by volume of electricity generated and sold) primarily varied between US$21 and US$40 per megawatt hour (MWh), exhibiting up to a 100% difference in value. Furthermore, roughly 3% of nodes in PJM exhibit average prices 3–10 times higher than the PJM mean.
The largest differences in locational value at transmission voltages reflect persistent transmission constraints that prevent delivery of less expensive energy to these locations. Resources located downstream of these constraints and capable of sup-plying energy or reducing consumption during periods of net-work congestion could, therefore, create much greater value than could be achieved by selling energy at an average node. To capture locational value due to network constraints, DERs must be able to operate both where and when these constraints are binding. To capture greater value than their larger-scale counterparts, DERs must be able to provide energy in locations where more centralized solutions cannot (e.g., in a constrained, dense urban area where a large-scale solution is infeasible).
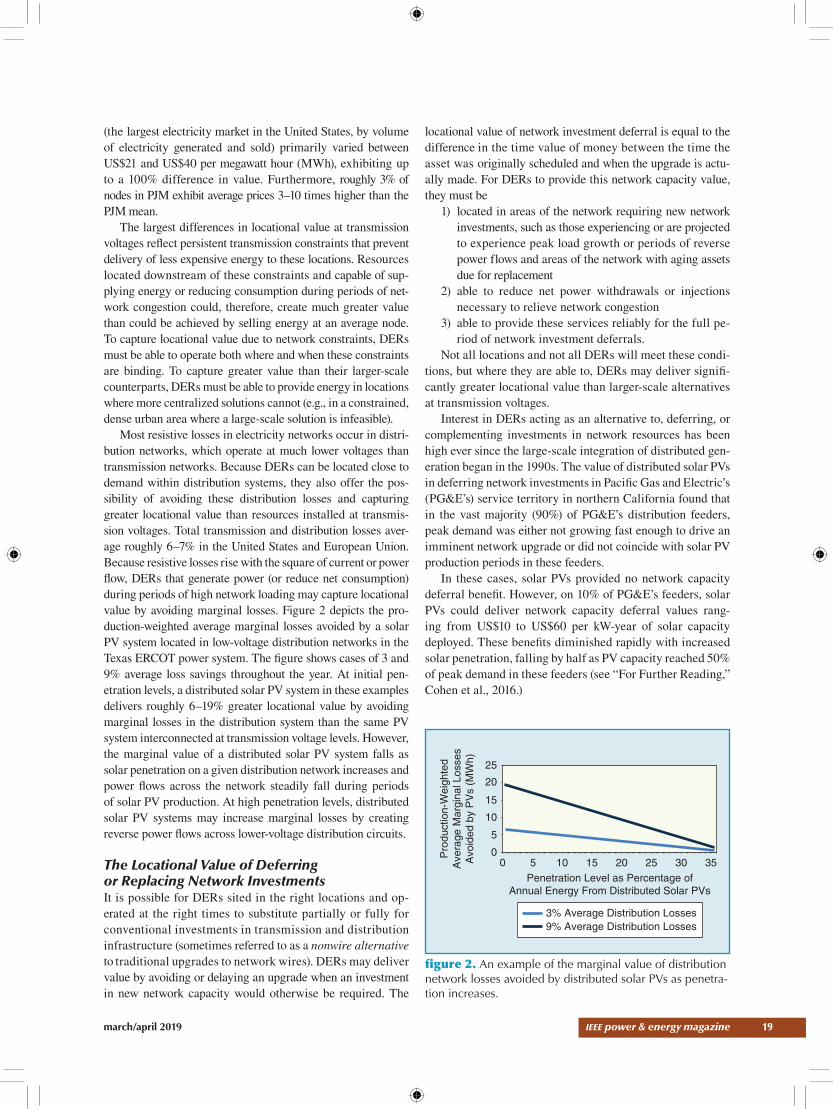
Most resistive losses in electricity networks occur in distri-bution networks, which operate at much lower voltages than transmission networks. Because DERs can be located close to demand within distribution systems, they also offer the pos-sibility of avoiding these distribution losses and capturing greater locational value than resources installed at transmis-sion voltages. Total transmission and distribution losses aver-age roughly 6–7% in the United States and European Union. Because resistive losses rise with the square of current or power flow, DERs that generate power (or reduce net consumption) during periods of high network loading may capture locational value by avoiding marginal losses. Figure 2 depicts the pro-duction-weighted average marginal losses avoided by a solar PV system located in low-voltage distribution networks in the Texas ERCOT power system. The figure shows cases of 3 and 9% average loss savings throughout the year. At initial pen-etration levels, a distributed solar PV system in these examples delivers roughly 6–19% greater locational value by avoiding marginal losses in the distribution system than the same PV system interconnected at transmission voltage levels. However, the marginal value of a distributed solar PV system falls as solar penetration on a given distribution network increases and power flows across the network steadily fall during periods of solar PV production. At high penetration levels, distributed solar PV systems may increase marginal losses by creating reverse power flows across lower-voltage distribution circuits.
The Locational Value of Deferring or Replacing Network InvestmentsIt is possible for DERs sited in the right locations and op -erated at the right times to substitute partially or fully for conventional investments in transmission and distribution infrastructure (sometimes referred to as a nonwire alternative to traditional upgrades to network wires). DERs may deliver value by avoiding or delaying an upgrade when an investment in new network capacity would otherwise be required. The
locational value of network investment deferral is equal to the difference in the time value of money between the time the asset was originally scheduled and when the upgrade is actu-ally made. For DERs to provide this network capacity value, they must be
1) located in areas of the network requiring new network investments, such as those experiencing or are projected to experience peak load growth or periods of reverse power flows and areas of the network with aging assets due for replacement
2) able to reduce net power withdrawals or injections necessary to relieve network congestion
3) able to provide these services reliably for the full pe-riod of network investment deferrals.
Not all locations and not all DERs will meet these condi-tions, but where they are able to, DERs may deliver signifi-cantly greater locational value than larger-scale alternatives at transmission voltages.
Interest in DERs acting as an alternative to, deferring, or complementing investments in network resources has been high ever since the large-scale integration of distributed gen-eration began in the 1990s. The value of distributed solar PVs in deferring network investments in Pacific Gas and Electric’s (PG&E’s) service territory in northern California found that in the vast majority (90%) of PG&E’s distribution feeders, peak demand was either not growing fast enough to drive an imminent network upgrade or did not coincide with solar PV production periods in these feeders.
In these cases, solar PVs provided no network capacity deferral benefit. However, on 10% of PG&E’s feeders, solar PVs could deliver network capacity deferral values rang-ing from US$10 to US$60 per kW-year of solar capacity deployed. These benefits diminished rapidly with increased solar penetration, falling by half as PV capacity reached 50% of peak demand in these feeders (see “For Further Reading,” Cohen et al., 2016.)
25
20
15
10
5
0Pro
duct
ion-
Wei
ghte
dA
vera
ge M
argi
nal L
osse
sA
void
ed b
y P
Vs
(MW
h)
0 5 10 15 20 25 30 35Penetration Level as Percentage of
Annual Energy From Distributed Solar PVs
3% Average Distribution Losses9% Average Distribution Losses
figure 2. An example of the marginal value of distribution network losses avoided by distributed solar PVs as penetra-tion increases.
20 ieee power & energy magazine march/april 2019
More dispatchable DERs (e.g., energy storage, gas-fired dis-tributed generation, or demand response) could deliver network capacity values higher than that of solar PVs, as these resources could better meet the three criteria outlined previously.
The Locational Value of ReliabilityDERs may be able to increase the reliability or resilience of power systems by providing power during network outages. The locational value of DERs in these cases is equal to the value that customers place on avoiding service interruptions. The locational value of increased reliability depends on the frequency and duration of service outages experienced at a particular location and consumers’ willingness to pay to avoid such outages. Reliability in developed power systems is gener-ally quite high, with customers experiencing only a few hours of service disruption per year. However, a small number of utilities experience average outages of much longer duration, and individual customers experience additional variation in outage duration and frequency.
Based on a meta-survey of estimated willingness to pay for avoided outages by different customer classes and the distribution of average outage durations (from EIA Form 861 data, Table 1 presents an estimate of the cost of outages for several classes of customers and different cumulative annual outage durations (see “For Further Reading,” Sullivan et al., 2015). The locational value of preventing outages will be approximately equal to these values. Table 1 presents average values, and DERs may provide the greatest locational value by delivering reliability services in locations with much-greater-than-average supply disruptions and to customers who value reliability more than average.
In all of these cases, the increased reliability that DERS supply to individual customers is a private value. Unless DERs provide enhanced reliability to multiple customers (e.g., by enabling islanding of a portion of the distribution network dur-ing broader network outages), this increase in private value should not justify increased public expenditures because this would imply that some network users pay for increased pri-vate value for other network users. Rather, this value should be reflected in an increased willingness to pay for behind-the-meter DERs, relative to their larger-scale counterparts.
Summarizing Locational ValueThe previous sections highlight the main sources of locational value: energy, network capacity, and reliability. DERs may be able to deliver greater locational value than their larger, utility-scale counterparts that are unable to site within distri-bution networks by
✔ delivering energy in areas that experience high mar-ginal losses
✔ providing reliable power injections that reduce net load consumption in areas of the distribution network otherwise requiring network upgrades
✔ supplying energy to load during network failures.However, as is illustrated in this section, locational value
is neither universal nor constant. The effects of losses, con-gestion, and network reliability on locational value differ dramatically across a given power system region and even within a single distribution network. Additionally, the mar-ginal value of these services diminishes as more DERs pro-vide the same services within a given portion of the grid.
As introduced in the beginning of the article, and will be described in the “Economies of Unit Scale” section, regulators and policy makers considering additional sup-port for distributed solar must weigh the marginal loca-tional value of DERs at specific locations against the incremental costs of providing services in a more expen-sive and distributed fashion. Before describing the magni-tude and nature of these incremental unit costs, it is worth exploring what services do not exhibit locational value. That is, which values or services can be provided equally well by both centralized and decentralized resources?
Clarifying Nonlocational Values and the Value of Emissions ReductionMany services, including firm-generating capacity, fre-quency regulation, and reserve and price-hedging services, are typically broadly fungible commodities with the same value across the entire power system or across wide-area zones of the system. For these services, DERs cannot pro-vide additional locational value relative to more central-ized solutions, i.e., they exhibit nonlocational value. Where DERs deliver services with nonlocational value, they are in direct competition with other conventional resources with-out the advantage of increased locational value.
This important distinction extends beyond electricity ser-vices to the public good or reduced externalities associated with many DERs. For example, stakeholders frequently high-light the emissions (CO2 and other air pollutants) mitigation value of distributed solar or other low-emissions resources when arguing for DER support policies. However, the value of reducing emissions does not usually vary significantly within a relatively wide geography; i.e., distributed solar or wind power does not usually provide any additional emissions mitigation value relative to more centralized solar or wind resources in the same broad region. Therefore, while the clean nature of certain technologies justifies policy intervention (such as the
table 1. Estimated reliability value for different customer classes in the United States
given different cumulative annual outage durations (2017 US$/firm kW/year).
Cumulative Annual Outage Duration Residential
Small Commercial or Industrial
Large Commeçrcial or Industrial
2 h (median U.S. utility)
7 642 47
4 h (mean U.S. utility)
14 1,284 95
16 h (extreme U.S. utility)
57 5,135 379

march/april 2019 ieee power & energy magazine 21
imposition of a carbon price and associated alternative poli-cies), the clean nature of any given DER does not justify addi-tional policy support relative to its larger-scale counterparts.
A major exception is the magnifying effect of losses on the emissions reduction of a kilowatthour of clean electricity gen-erated in a more decentralized fashion. As discussed in “The Locational Value of Energy” section, a kilowatthour generated in distribution systems is often equivalent to roughly 1.05–1.15 kWh generated at the transmission level because of the impact of marginal losses. Similarly, a kilowatthour generated in distri-bution may avoid slightly more emissions than a kilowatthour generated at transmission voltages. Under a carbon-pricing scheme, the societal costs of these emissions would be factored into the energy price, making this point moot.
Economies of Unit ScaleAlthough DERs may be sited in the power system to capture additional locational value, there are economic tradeoffs asso-ciated with the smaller scale of these distributed resources. The unit costs of energy technologies typically fall as the tech-nology is installed at larger scales. Therefore, a 500-MW sys-tem of a given technology will typically cost less per megawatt than a 5-MW system of the same type, which, in turn, will cost less per megawatt than a 5-kW system. Many technologies suitable for distributed deployment, including solar PVs, elec-trochemical energy storage, and fuel cells, harness modular technologies that can enable them to be deployed across a wide range of scales. Nonetheless, these technologies exhibit clear economies of unit scale. By failing to exhaust economies of unit scale, smaller-scale deployments of these resources result in higher incremental unit costs than larger-scale installations.
Figures 3 and 4 illustrate the economies of unit scale exhib-ited by solar PVs and lithium-ion battery systems, respectively. Although they have the same components (e.g., solar PV or battery cells), the installed costs of distributed solar and bat-tery storage systems increase substantially as unit size falls. Cost increases reflect decreased economies of scale in instal-lation labor; project development; and customer acquisition, interconnection, and system balance (inverters, racking, and so on) costs. As these figures show, the cost of deploying a solar PV or battery storage system at the residential kilowatt scale can be roughly twice the cost (or more) of deploying these same resources at the megawatt scale. Solar PVs and storage costs are rapidly decreasing, and the costs in Figures 3 and 4 will probably be outdated by the time this article is published. However, despite the dramatic cost reductions seen in recent years, the relative cost gaps between centralized and decen-tralized solar PVs and energy storage have remained more or less constant throughout time, and the tradeoffs between incremental unit costs and locational value that we describe will remain relevant as costs decrease.
When incremental unit costs exceed incremental locational value, society incurs distributed opportunity costs if small-scale DERs are deployed in lieu of more cost-effective, larger-scale installations of the same resource. In other words, distributed
opportunity costs are equal to the locational value that a distrib-uted installation of a technology can capture, minus the incre-mental costs of a distributed system relative to a larger-scale installation of the same type of technology. Understanding trad-eoffs between locational value and incremental unit costs due to economies of unit scale is critical to identifying when and where DER deployment increases or decreases social welfare relative to centralized resource deployment.
The rate at which economies of scale are exhausted var-ies significantly among technologies. Traditional nuclear, hydroelectric, natural gas, and coal-fired power plants typi-cally exhaust economies of scale between several hundred megawatts and more than 1,000 MW. In contrast, economies of scale for solar PV units appear to diminish much more rapidly; indeed, systems installed on a scale of one to tens of megawatts often cost roughly the same per unit as systems installed on a scale of tens to hundreds of megawatts.
US$2.16
US$2.70
US$3.60 US$4
US$4.56
0
0.5
1.0
1.5
2
2.5
3
3.5
4
4.5
5
Utility Scale:>5
0.5–5 0.1–0.5 0.01–0.1 ResidentialScale:
0.001–0.01
+25%
+33%+11%
+14%(U
S$/
kW)
(MW)
figure 3. The economies of unit scale and incremental unit costs for solar PV systems (2018 US$/kW-ac). (Data courtesy of Feldman et al., 2018.)
US$440
US$620
US$850
US$1,160
0
200
400
600
800
1,000
1,200
1,400
UtilityScale:
>100–500
1–10 0.1–0.5 ResidentialScale:
0.001–0.1
+41%
+37%
+36%
(US
$/kW
)
(MWh)
figure 4. The economies of unit scale and incremental unit costs for lithium-ion battery systems (2017 US$/kWh). (Data courtesy of Lazard, 2017.)

22 ieee power & energy magazine march/april 2019
Solar PVs: An Illustrative ExampleTo provide a concrete example of the tradeoffs between loca-tional value and incremental unit costs, we present updates of a case study of distributed solar PVs in the state of New York. The example in this article has been updated to reflect more recent cost estimates and the nature of this article. (See “For Further Reading,” Pérez-Arriaga et al., 2016, for the original study, which includes descriptions of the methodology.) Many of the assumptions for our case are based on actual data from NYISO, the independent system operator for New York, and for the Long Island and Mohawk Valley areas.
We provide an example to illustrate the tradeoffs between locational value and economies of scale for solar PVs by study-ing high-value and average-value cases using assumptions grounded in empirical data. We used data from Long Island for our high-value case, which represents locational value on the high end of the possible value range. By contrast, we used data from Mohawk Valley to represent an average-value case, with values more typical of average locations in the NYISO system. Although these examples are case specific and are not intended to be generalized to actual power systems, the conceptual trad-eoffs we highlight are relevant for all system contexts.
Long Island experiences the highest average wholesale elec-tricity prices in the NYISO system because of frequent con-gestion and relatively high transmission losses, while Mohawk Valley has relatively average wholesale prices. We calculated the locational energy value of PVs as the difference between the production-weighted average marginal cost of energy at the Long Island or Mohawk Valley zones and the average NYISO production-weighted average marginal price. We assumed that the average transmission and distribution losses were 9% in our high-value case and 5% in our average-value case.
We based the distribution network capacity benefit val-ues (or network investment deferral values) on a study of the
benefits of distributed solar PVs in California. (See “For Fur-ther Reading,” Cohen et al., 2016, which studied the Califor-nia system.) In the high-value case, we assumed a network capacity value of US$60/kW-year of solar capacity deployed. In the average-value case, we assigned an average network capacity value of US$6/kW-year. Both the US$60/kW-year and the US$6/kW-year values are taken from the Cohen et al. study. This average value likely overstates the locational value that distributed solar PVs can create in most locations, because distributed solar provided no network benefit for 90% of the feeders in the Cohen et al. study. Finally, we assigned no reliability value in either case because grid-connected solar PV systems power down during network failures, when absent energy storage and electronics capable of islanding.
In both cases, we calculate levelized incremental unit costs using a 25-year asset life and a 7.68% after-tax weighted aver-age cost of capital. We used the National Renewable Energy Laboratory’s PV Watts calculator to calculate solar production in both Long Island and Mohawk Valley, assuming fixed-tilt PV systems, pointed at azimuth and tilted at latitude. We used the PV system costs in Figure 3 for the high- and average-value cases. Table 2 shows the assumptions and the resultant PV-levelized costs of energy expressed as US$/kWh production for various sizes of PVs. Figures 5 and 6 show the incremental unit costs of a 1–2-MW system and a 1–10-kW system relative to a 30-MW system in the high and low cases, respectively. By design, the scenarios show significantly greater locational benefits for the high-value case than the average-value case.
These case studies highlight how the locational value that DERs provide can vary by an order of magnitude within a given power system. In the high-value case, distributed PVs provide locational value of US$70.8/MWh, roughly a 200% premium over the wholesale price of energy. In the average-value case, distributed PVs provide a much more modest
table 2. PV example assumptions, levelized costs of energy, and diseconomies of scale versus the utility-scale system.
PV Example Assumptions
Value Case
Installed Cost (US$/kW)
Lifespan (Years)
Discount Rate (%)
Annual O&M (US$/kW-Year)
Annual Generation (kWh/kW)
Levelized Costs of Energy (US$/kWh)
Diseconomies of Scale Versus Utility-Scale (US$/kWh)
30-MW crystalline utility-scale PVs, fixed tilt
High 2,160 25 7.68 13 1,458 0.144 N/A
1.5-MW community PVs
High 2,700 25 7.68 13 1,458 0.178 0.034
5-kW residential scale High 4,560 25 7.68 13 1,458 0.294 US$0.150
30-MW crystalline utility-scale PVs, fixed tilt
Low 2,160 25 7.68 13 1,376 0.153 N/A
1.5-MW community PVs
Low 2,700 25 7.68 13 1,376 0.188 0.036
5-kW residential scale Low 4,560 25 7.68 13 1,376 0.311 0.159
N/A: not applicable.

march/april 2019 ieee power & energy magazine 23
but nonnegligible locational value of US$9.5/MWh. This is roughly a 33% premium over the wholesale price of energy.
As this example highlights, even in high-value locations, DERs may not always provide net benefits to society. In the high-value case, the locational value provided by distributed PVs justifies deploying solar PVs within distribution networks at the 1–2-MW scale, rather than at the 30-MW utility scale (Figure 5), that is, the locational value outweighs incremental costs, resulting in distributed value (represented in green in Fig-ure 5). More inherently distributed resources, like flexible and price-responsive demand, do not face the same tradeoffs with economies of scale. These resources may be better used to pro-vide locational value as alternatives to investments in the more capital-intensive DERs.
This dramatic difference in locational value reinforces the importance of a system of prices and charges for electricity services, e.g., improved electricity rate design, that signals the locations where DERs can and cannot add value. It also clearly highlights the futility of defining a single value of solar, storage, or being distributed that holds across an entire state or regional power system. Rather, the value of each DER depends on the value of the specific services it provides at a specific time and in a specific location.
These case studies highlight how, even in cases with sub-stantial locational value, smaller is not always better. Although the high-value example demonstrates that DERs can deliver net value relative to utility-scale solutions, even the substan-tial locational value calculated in this example does not justify deploying distributed solar at the 1–10-kW scale. In this case, the incremental unit costs for residential scale solar are sim-ply too large relative to the locational value. Furthermore, in the average-value case, we find that the incremental unit costs
outweigh the locational benefits for distributed solar systems at all scales (Figure 6). In other words, in the average-value case presented here, utility-scale solar will deliver greater net benefits to society than a distributed system.
Summary and DiscussionDERs can deliver value to power systems where and when they are able to mitigate high marginal network losses, relieve net-work congestion or defer impending upgrades, and enhance reliability. However, the magnitude of this locational value must be weighed against incremental unit costs incurred by investing in systems that fail to exhaust economies of unit scale. Where incremental unit costs exceed incremental locational value, soci-ety incurs a distributed opportunity cost when small-scale DERs are deployed in lieu of more cost-effective, larger-scale installa-tions of the same resource.
To capture the potential value of DERs without incurring substantial social costs, power system planning, policy, and regulation must become more sophisticated. Different areas within a power system show a wide range of locational values. Policies, regulations, and electricity markets should ideally cre-ate price signals or incentives that clearly present the specific value of locational benefits at each location. Such price signals would enable competition between centralized and distributed resources, allowing society to maximize social welfare by find-ing the optimal tradeoff between economies of unit scale and locational benefits.
Although many challenges to the implementation of better price signals remain, the structure of these price signals is not a mystery. Time- and location-varying, marginal-cost energy pricing is the hallmark of many wholesale power systems glob-ally. With smart metering, such pricing signals could be passed
0
20
40
60
80
100
120
140
160
0
20
40
60
80
100
120
140
160
LocationalEnergy Value:Transmission
LocationalEnergy Value:
DistributionLosses
NetworkInvestment
Deferral
Reliability TotalLocational
Value
1–2-MWSystem
1–10-kWSystem
Leve
lized
Incr
emen
tal U
nit C
osts
Rel
ativ
e to
30-
MW
Sca
le (
US
$/M
Wh)
Leve
lized
Loc
atio
nal V
alue
(U
S$/
MW
h)
245.6
041.2
Distributed Value (1–2-MW case): 36.8 US$/MWh
Distributed Opportunity Cost (1–10-kW case): 79.3 US$/MWh
70.8
LocationalValue
IncrementalUnit Costs
figure 5. A comparison of the locational value and incremental unit costs for solar PVs in the high-value example (Long Island, New York).

24 ieee power & energy magazine march/april 2019
on to users at the distribution level; over time, the methods used to calculate these marginal cost prices could be extended to the distribution system as well. Similarly, more cost-reflective network pricing schemes have long been used at the transmis-sion level. Residual distribution network costs can be recovered through intelligently designed, nondistorting fixed charges; with thoughtful, targeted policy, residual cost recovery through fixed charges need not be punitive to vulnerable customers. Forward-looking, peak-coincident charges can help signal a network user’s contribution to incremental network costs. Such charges can help unlock the network investment deferral capa-bilities of DERs and flexible demand. Phasing in these pricing mechanisms would benefit all customers by enabling DERs to thrive when and where they can provide value while limiting investment in unnecessarily costly or redundant infrastructure.
Finally, policy support targeted at DERs should also be designed in a manner that accounts for both the temporal and locational variation in value and the rate at which mar-ginal locational value declines. Where locational value does not outweigh incremental unit costs, regulators and policy makers must carefully consider whether the additional costs of DER support are justified.
For Further ReadingM. A. Cohen, P. A. Kauzmann, and D. S. Callaway, “Effects of distributed PV generation on California’s distribution sys-tem, part 2: Economic analysis,” Solar Energy, vol. 128, pp. 139–152, Apr. 2016. doi: 10.1016/J.SOLENER.2016.01.004.
I. J. Pérez-Arriaga et al., Utility of the Future: An MIT En-ergy Initiative Response to an Industry in Transition. Cam-bridge, MA: MIT, 2016. [Online]. Available: http://energy.mit .edu/research/utility-future-study/.
M. J. Sullivan, J. Schellenberg, and M. Blundell, “Updated value of service reliability estimates for electric utility custom-ers in the United States,” Ernest Orlando Lawrence Berkeley National Laboratory, Berkeley, CA, Rep. LBNL-6941E, 2015.
P. Vaishnav, N. Horner, and I. L. Azevedo, “Was it worth-while? Where have the benefits of rooftop solar photovoltaic generation exceeded the cost?” Environmental Res. Lett., vol. 12, no. 9, pp. 1–13, Sept. 2017. doi: 10.1088/1748-9326/aa815e.
A. Zibelman, “REVing up the energy vision in New York: Seizing the opportunity to create a cleaner, more resilient, and af-fordable energy system,” IEEE Power Energy Mag., vol. 14, no. 3, pp. 18–24, May–June 2016. doi: 10.1109/MPE.2016.2524967.
D. Feldman, J. Hoskins, and R. Mango, “Q4 2017/Q1 2018 solar industry update,” National Renewable Energy Labora-tory Golden, CO, Rep. NREL/PR-6A20-71493, 2018. [Online]. Available: https://www.nrel.gov/docs/fy18osti/71493.pdf
Lazard, “Lazard’s levelized cost of storage analysis—version 3.0,” New York, 2017. [Online]. Available: https://www .lazard.com/media/450338/lazard-levelized-cost-of-storage-version-30.pdf
BiographiesScott P. Burger is with the Massachusetts Institute of Tech-nology Energy Initiative, Cambridge, Massachusetts.
Jesse D. Jenkins is with the Harvard Kennedy School, Cambridge, Massachusetts.
Samuel C. Huntington is with IHS Markit, Boston, Mas-sachusetts.
Ignacio J. Pérez-Arriaga is with the Massachusetts Institute of Technology Sloan School of Management, the Institute for Research in Technology at Comillas University, and the Flor-ence School of Regulation, Cambridge, Massachusetts.
p&e
0
20
40
60
80
100
120
140
160
0
20
40
60
80
100
120
140
160
Leve
lized
Incr
emen
tal U
nit C
osts
Rel
ativ
e to
30-
MW
Sca
le (
US
$/M
Wh)
Leve
lized
Loc
atio
nal V
alue
(U
S$/
MW
h)
Distributed Opportunity Cost (1–10-kW case): 149.5 US$/MWh
Distributed Opportunity Cost (1–2-MW case): 26.5 US$/MWh
9.52.3 3.1 4.1 0
LocationalValue
IncrementalUnit Costs
LocationalEnergy Value:Transmission
LocationalEnergy Value:
DistributionLosses
NetworkInvestment
Deferral
Reliability TotalLocational
Value
1–2-MWSystem
1–10-kWSystem
figure 6. A comparison of the locational value and incremental unit costs for solar PVs in the average-value example (Mohawk Valley, New York).