why do planes not fly the shortest routes? a review
TRANSCRIPT
Contents lists available at ScienceDirect
Applied Geography
journal homepage: www.elsevier.com/locate/apgeog
Why do planes not fly the shortest routes? A reviewFrédéric DobruszkesUniversité libre de Bruxelles (ULB), Faculty of Sciences, DGES-IGEAT, Av. F. D. Roosevelt 50, box 130/03, 1050, Brussels, Belgium
A R T I C L E I N F O
Keywords:Air transport geographyAirline routesDetoursDistance flownGreat-circle distance
A B S T R A C T
Scholars and experts in air transport generally assume the distance flown between airports is the shortest route(also known as the great-circle distance or the orthodromic route). However, in the real world, planes followlonger itineraries. This paper reviews the factors of detours, based on interviews with pilots and experts in airnavigation. Factors relate to (1) technical constraints, (2) natural processes (including meteorological condi-tions) and obstacles, (3) geopolitical factors and (4) social factors, which are all explored in this paper. Theirtemporary vs. permanent and spatial impact (small vs. long detours) varies significantly among factors andamong cases, as well as their avoidable nature. Appropriate policies could lower detours. In addition, theseresults echo academic debates on the meaning of distance.
1. Introduction
Distances flown by commercial planes are a key indicator com-monly used to rank airlines based on seat-km offered or on passenger-km carried, to feed interaction models (such as gravity models), to sortair traffic by distance classes or to compute fuel burnt and emissions ofgreenhouse gases and pollutants (e.g., Adey, Budd, & Hubbard, 2007;Duval, 2013). Most scholars, aviation experts and international orga-nisations have assumed that planes follow the shortest route, alsoknown as great-circle distance or the orthodromic route. This is possiblybecause most datasets and online aircraft trackers give only great-circledistances but not actual distance flown.
However, in the real world, virtually no flights follow the shortestroute and, very strangely, this has been largely neglected by air trans-port geographers. In most publications involving distance flown, nei-ther the factors nor the magnitude of detours are discussed. Actually,one needs to go far back – to the emergence of commercial aviation – tofind discussions on factors that shape routes (see Beaumont, 1943;Parker Van Zandt, 1944). Since then, only some authors (Dacharry,1981; Sealy, 1966) have tackled this issue, and recent books on airtransport geography (Bowen, 2010; Goetz and Budd, 2014) have ne-glected it. Navigation manuals also give some indications (e.g., U.S. AirForce, 2005) of interest in factors related to detours. All in all, theseauthors have highlighted a restricted set of factors related to naturalconstraints (physical geography and weather), technical limits relatedto aircraft ranges and some geopolitical concerns. As stated by Mason(1936), “The extension of air-routes throughout the world has been mainly
due to private enterprise and individual daring. But such enterprise can onlybe fully effective if all countries are sympathetic to intercourse by air. Whentherefore we see on such a map the lack of modern communications acrossthe northern frontiers of India, we have to take into consideration the poli-tical factor as well as the physical barrier.” However, as far as I know, noone has pursued an exhaustive review of the factors involved in detours.
In this context, the aim of this paper is to unveil the extensive rangeof factors that impose detours on commercial flights. To do so, a two-fold strategy was pursued. The first step was to scrutinise publications(academic, then not academic). It was found that most of these factorsactually focus on technological matters (e.g., Tooley & Wyatt, 2018) oron the characterisation of air navigation route networks (e.g., Ren & Li,2018; Sun, Wandelt, & Linke, 2015), but they do not focus on the veryfactors that force planes to follow given routes. As stated above, some ofthese factors can nevertheless be found in older books and in navigationmanuals. Second, two experts in air navigation (one air navigationservice provider and one consultant) and two pilots were interviewed.One pilot flies short- and medium-haul flights on Boeing narrow-bodyjets; the other flies medium- and long-haul flights on Airbus wide-bodyjet). Since publications are scarce, the interviews contributed to thelargest part of this paper. In addition, several radar traces were re-trieved from the Flightradar1 website to illustrate concrete deviationsand to compute related distances flown.
Before reviewing factors of detours, Section 2 recalls the key con-cepts needed to avoid the pitfalls of cartographic projections for map-ping air routes. Section 3 reviews the factors of detours. Section 4discusses the results and concludes.
https://doi.org/10.1016/j.apgeog.2019.06.001Received 25 January 2019; Received in revised form 24 April 2019; Accepted 3 June 2019
E-mail address: [email protected] See www.flightradar24.com/. Technically speaking, Flightradar subscribers can export selected radar traces to KML files that can then be imported into a GIS and
superimposed on other layers.
Applied Geography 109 (2019) 102033
Available online 14 June 20190143-6228/ © 2019 Elsevier Ltd. All rights reserved.
T

2. Projection, great-circle distances and mapping issues
Appropriate cartographic projections in the air age are a classicalissue that was discussed a long time ago (Moore-Brabazon, 1944; ParkerVan Zandt, 1944; Sealy, 1966; Stewart, 1943). Subsequently, airtransport geographers have tended to neglect cartographic issues, de-spite the fact that inappropriate choices lead to misrepresentations. Letus recall that flattening the earth to produce a flat map with as muchspatial continuity as possible involves stretching or shrinking the sur-face area unevenly, and this inevitably alters shapes, distances, direc-tions and possibly broad spaces, which can present a problem, subjectto projections and especially when “large” portions of the earth aremapped (Robinson, 1988). It is important to keep in mind that becausedistances are usually distorted, they are simply false compared to thereference globe, except along specific lines. Subject to the projection,these lines can be the Equator, certain or all meridians, some or allparallels, or all lines from one specific point. This means that withsmall-scale projections, the scale is not constant and is thus true onlyalong some specific lines.
All this makes mapping the shortest routes, compared to actualroutes flown, everything but neutral. One needs to guarantee that thereader will interpret distances on the map properly. In the real worldand considering “long” routes, the shortest route between two points isa curve (Fig. 1), which is a great-circle arc.2 The shortest route betweentwo points, therefore, is often called the great-circle route, and the re-lated distance is often referred to as the great-circle distance. In mostcases, flattening a curved great-circle arc can only result in a complexcurve on the map. In most projections, the shortest routes are thusanything but straight lines (Fig. 2).
All azimuthal projections have the advantage that all great circlespassing through their centre (which can be freely set) are straight lineson the map, because all directions from their centre are correct(Robinson, 1986). Among these projections, the azimuthal equidistantprojection has the merit that any great circle passing through its centrewill appear as a straight line on the map with the correct direction anddistance. Distances will be correct along the line, and the whole earthwill be visible (in contrast with other equidistant projections, such asthe gnomonic projection), although areas are not maintained andshapes are highly distorted at the edges (Gilmartin, 1991) (Fig. 3).
It is thus not surprising early scholars interested in airline networksadopted the azimuthal equidistant projection (see Parker Van Zandt,1944; Sealy, 1966), which was later confirmed by Snyder (1987), whoonly cites this projection for mapping global airline networks. As aresult, most of the following maps will consider this projection, with theairport of departure or arrival as the centre. The gnomonic projection,in which any straight line represents a great-circle arc, will also be usedin some cases that cover only restricted spaces (given the large distor-tions and the projection's restriction to areas significantly smaller than ahemisphere).
3. Why not fly the shortest route?
3.1. Technical factors
3.1.1. Air navigation networkFirstly, planes do not fly the shortest pathway because they follow
airways designed and published by the relevant authorities. These air-ways are made up of line segments between beacons or waypoints thatform a global air navigation network. This requires planes to fly frompoint to point more or less along these segments, so the pathways arebroken lines instead of complex curves. Of course, the density of
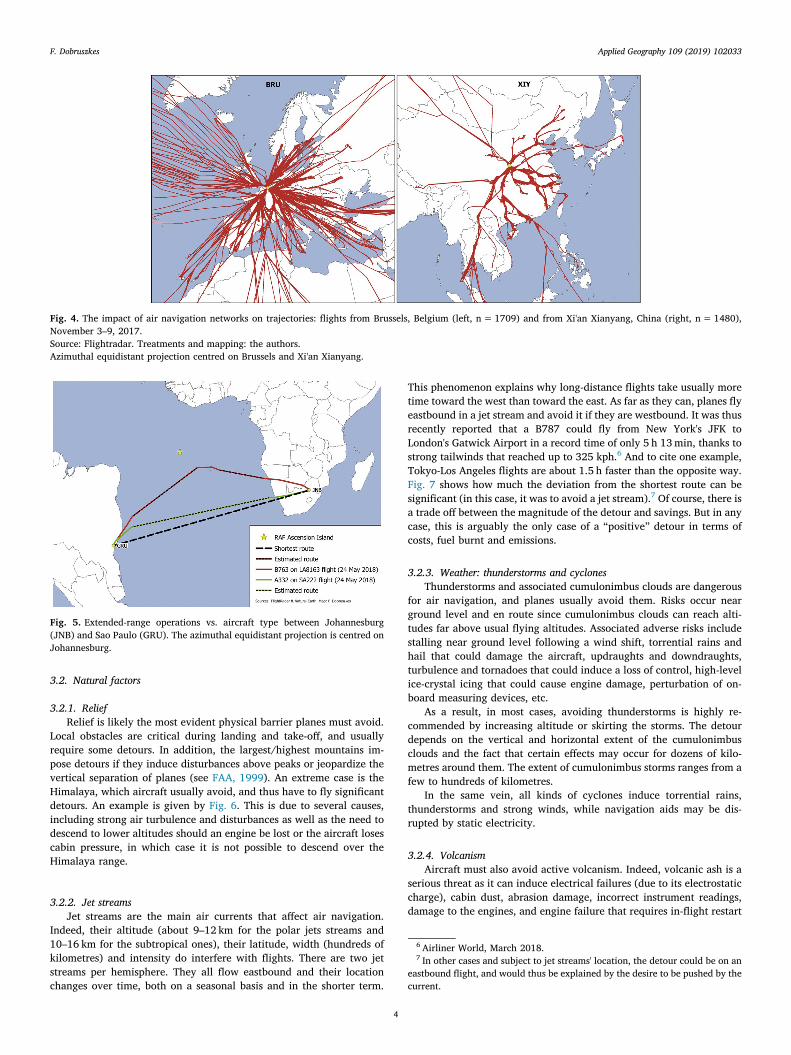
airways shapes the magnitude of detours, all other things being equal.Denser air navigation networks mean a higher probability of getting astraighter route between two airports. Fig. 4, which compares a sampleof routes from Brussels, Belgium, and from Xi'an Xianyang, China, il-lustrates this. From Brussels, the dense European air navigation net-work makes routes rather smooth. From Xi'an Xianyang, the relativeshortage of airways involves complex routes that are far from beingstraight lines, as Ren and Li (2018) found. This is due to the fact that inChina, 80% of the airspace is devoted to military uses (Hsu, 2014).
Note that subject to various factors (including traffic density), pilotsmay receive a shortcut, so some intermediate points may be bypassedand the pathway shortened to some extent. In addition to en-routecharts, procedures for take-offs and landings also impose detours,which are due to technical constraints, environmental concerns (noiseexposure) and the complexity of the airspace, especially when airportsare close to each other or affected by borders.
3.1.2. Traffic density and airport congestionIn the case of high-density en-route traffic, the capacity of existing
routes can be insufficient. In such cases, one option is to (re)routeplanes via alternative airways, which means longer journeys. In addi-tion, flights may be affected by congestion at and around the arrivalairport. Given the minimal time/distance between two landings, itcould be that planes are forced to engage a so-called holding patternprocedure, which involves following a racetrack-like (‘stack’) patternuntil the way is clear for landing. For shorter flights, the resulting extradistance flown is proportionally higher compared to the normal route.
3.1.3. Time to alternate airports and extended operations (ETOPS)Since the early days of aviation, the possibility of a technical failure
has meant planes should not move too far away from alternate air-ports,3 so they have an option to land before reaching their normaldestination. Back in the 1950s, the first regulations were quite re-strictive in this regard, considering the (lack of) reliability of pistonengines used at the time (Taylor, 1990). Both the ICAO and the USFederal Aviation Administration (FAA) adopted regulations based onflying time to suitable alternate airports. The ICAO adopted the so-called ‘90-min rules’ for twinjet operations, based on all-engine cruisingspeed. On its own, the FAA imposed a 60-min rule for two- or three-
Fig. 1. The shortest New York-Moscow route on an orthographic projection.
2 For those not familiar with geography, a great circle is a line that divides theearth into two hemispheres. The equator and any meridian are specific ex-amples of great circles; all other great circles are oblique. 3 Including certain military airports.
F. Dobruszkes Applied Geography 109 (2019) 102033
2
engine planes based on cruising speed with one engine not working.4
Hence, the strategic nature of remote islands under the sovereignty ofso-called developed countries, such as the United States, which has itsMinor Outlying Islands (e.g., Wake Island Airfield and Midway Atoll'sHenderson Field) serving trans-Pacific flights, or the British OverseasTerritories (e.g., the Ascension Island Auxiliary Field, which servesoperations via the South Atlantic) (see Jones & Mehnert, 1940; Spoehr,1946). Then, in the 1960s, three-engine planes were exempted. Theserules contributed to the success of three- and four-engine planes usedfor long-haul operations, especially over the oceans (Lin & Lin, 2010).
More reliable engines then made it possible to think about so-called‘extended-range twin-engine operation’ (ETOPS). Initial ETOPS certifi-cations were designed based on a diversion time of 90min. From 1985,initial rules were thus progressively relaxed as long as manufacturers,airlines, crews and dispatch staff met the various conditions of each
ETOPS certification (see Chiles, 2007; Lin & Lin, 2010). So came ETOPSfor 120 (e.g., A300 and B737 Classic), 180 (e.g., A320 family, B737sNG, B757s, B767s), 240 (e.g., A330s), 330 (e.g., B777s and B787s) andeven 370min (A350). Certifications can evolve over time and eitherincrease (for instance, B777s and B787s have moved from ETOPS 180to ETOPS 330) or decrease subject to technical failures. And about tenyear ago, the ETOPS acronym was refined into ‘extended operations’ bythe FAA and subsequently other authorities, so all commercial multi-engine aircraft are now affected (Chiles, 2007). Out of operations underthe ETOPS umbrella, FAA's standard diversion time has remained60min for twinjets, and has become 180min for planes with threeengines or more.
With such progress, there are fewer lands with no alternate airports.However, flying long distances over the oceans can still force airlines tofly away from the shortest routes to stay within appropriate distances toalternate airports. It is common to introduce ETOPS navigation withcircles around airports of departure as well as alternate and final air-ports. Notwithstanding the frequent misuse of map projections,5 thereality is more complex than circles because one needs to take weatherand air streams into account. Furthermore, various conditions maymake existing “nearby” en-route airports inappropriate for diversion.Runway length, opening times and available rescue and fire-fightingservices are key factors to be considered. Airlines may also favour di-verting airports that enable aircraft to avoid unfriendly countries orhave appropriate technical support (so aircraft are not grounded forunnecessarily long periods).
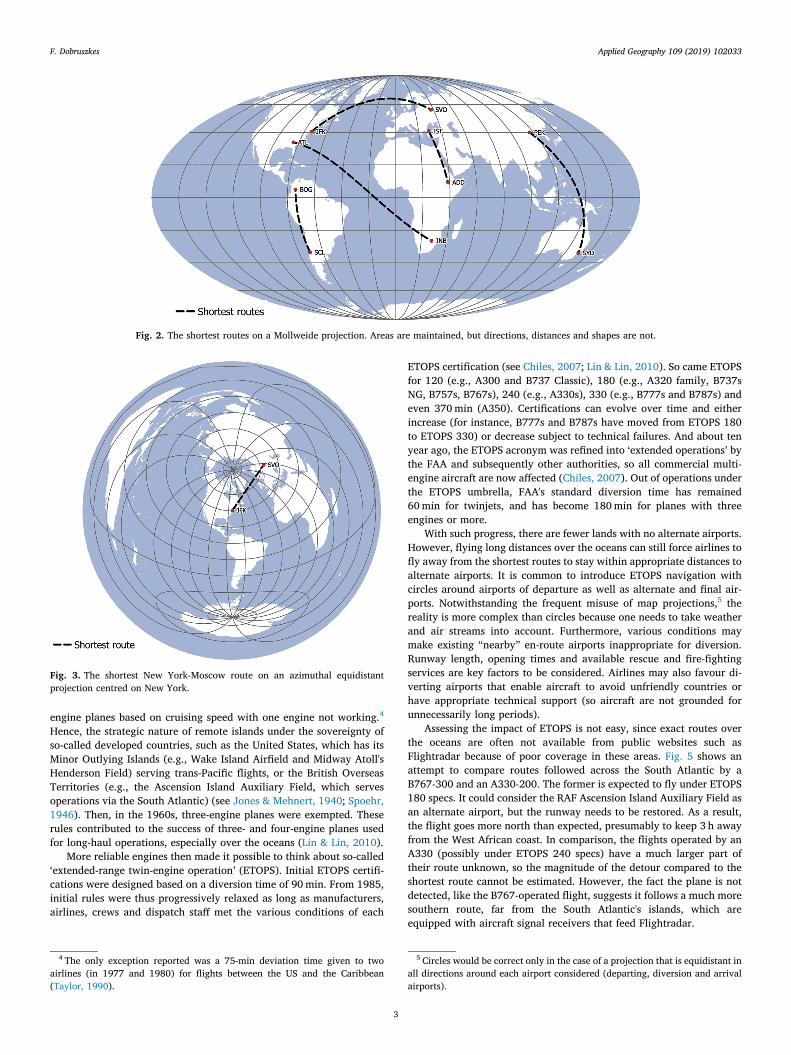
Assessing the impact of ETOPS is not easy, since exact routes overthe oceans are often not available from public websites such asFlightradar because of poor coverage in these areas. Fig. 5 shows anattempt to compare routes followed across the South Atlantic by aB767-300 and an A330-200. The former is expected to fly under ETOPS180 specs. It could consider the RAF Ascension Island Auxiliary Field asan alternate airport, but the runway needs to be restored. As a result,the flight goes more north than expected, presumably to keep 3 h awayfrom the West African coast. In comparison, the flights operated by anA330 (possibly under ETOPS 240 specs) have a much larger part oftheir route unknown, so the magnitude of the detour compared to theshortest route cannot be estimated. However, the fact the plane is notdetected, like the B767-operated flight, suggests it follows a much moresouthern route, far from the South Atlantic's islands, which areequipped with aircraft signal receivers that feed Flightradar.
Fig. 2. The shortest routes on a Mollweide projection. Areas are maintained, but directions, distances and shapes are not.
Fig. 3. The shortest New York-Moscow route on an azimuthal equidistantprojection centred on New York.
4 The only exception reported was a 75-min deviation time given to twoairlines (in 1977 and 1980) for flights between the US and the Caribbean(Taylor, 1990).
5 Circles would be correct only in the case of a projection that is equidistant inall directions around each airport considered (departing, diversion and arrivalairports).
F. Dobruszkes Applied Geography 109 (2019) 102033
3
3.2. Natural factors
3.2.1. ReliefRelief is likely the most evident physical barrier planes must avoid.
Local obstacles are critical during landing and take-off, and usuallyrequire some detours. In addition, the largest/highest mountains im-pose detours if they induce disturbances above peaks or jeopardize thevertical separation of planes (see FAA, 1999). An extreme case is theHimalaya, which aircraft usually avoid, and thus have to fly significantdetours. An example is given by Fig. 6. This is due to several causes,including strong air turbulence and disturbances as well as the need todescend to lower altitudes should an engine be lost or the aircraft losescabin pressure, in which case it is not possible to descend over theHimalaya range.
3.2.2. Jet streamsJet streams are the main air currents that affect air navigation.
Indeed, their altitude (about 9–12 km for the polar jets streams and10–16 km for the subtropical ones), their latitude, width (hundreds ofkilometres) and intensity do interfere with flights. There are two jetstreams per hemisphere. They all flow eastbound and their locationchanges over time, both on a seasonal basis and in the shorter term.
This phenomenon explains why long-distance flights take usually moretime toward the west than toward the east. As far as they can, planes flyeastbound in a jet stream and avoid it if they are westbound. It was thusrecently reported that a B787 could fly from New York's JFK toLondon's Gatwick Airport in a record time of only 5 h 13min, thanks tostrong tailwinds that reached up to 325 kph.6 And to cite one example,Tokyo-Los Angeles flights are about 1.5 h faster than the opposite way.Fig. 7 shows how much the deviation from the shortest route can besignificant (in this case, it was to avoid a jet stream).7 Of course, there isa trade off between the magnitude of the detour and savings. But in anycase, this is arguably the only case of a “positive” detour in terms ofcosts, fuel burnt and emissions.
3.2.3. Weather: thunderstorms and cyclonesThunderstorms and associated cumulonimbus clouds are dangerous
for air navigation, and planes usually avoid them. Risks occur nearground level and en route since cumulonimbus clouds can reach alti-tudes far above usual flying altitudes. Associated adverse risks includestalling near ground level following a wind shift, torrential rains andhail that could damage the aircraft, updraughts and downdraughts,turbulence and tornadoes that could induce a loss of control, high-levelice-crystal icing that could cause engine damage, perturbation of on-board measuring devices, etc.
As a result, in most cases, avoiding thunderstorms is highly re-commended by increasing altitude or skirting the storms. The detourdepends on the vertical and horizontal extent of the cumulonimbusclouds and the fact that certain effects may occur for dozens of kilo-metres around them. The extent of cumulonimbus storms ranges from afew to hundreds of kilometres.
In the same vein, all kinds of cyclones induce torrential rains,thunderstorms and strong winds, while navigation aids may be dis-rupted by static electricity.
3.2.4. VolcanismAircraft must also avoid active volcanism. Indeed, volcanic ash is a
serious threat as it can induce electrical failures (due to its electrostaticcharge), cabin dust, abrasion damage, incorrect instrument readings,damage to the engines, and engine failure that requires in-flight restart
Fig. 4. The impact of air navigation networks on trajectories: flights from Brussels, Belgium (left, n= 1709) and from Xi'an Xianyang, China (right, n= 1480),November 3–9, 2017.Source: Flightradar. Treatments and mapping: the authors.Azimuthal equidistant projection centred on Brussels and Xi'an Xianyang.
Fig. 5. Extended-range operations vs. aircraft type between Johannesburg(JNB) and Sao Paulo (GRU). The azimuthal equidistant projection is centred onJohannesburg.
6 Airliner World, March 2018.7 In other cases and subject to jet streams' location, the detour could be on an
eastbound flight, and would thus be explained by the desire to be pushed by thecurrent.
F. Dobruszkes Applied Geography 109 (2019) 102033
4

Fig. 6. Skirting around the Himalaya from Delhi to Beijing.Azimuthal equidistant projection centred on Delhi.
Fig. 7. The impact of a jet stream on the Tokyo-Los Angeles route. Azimuthal equidistant projection centred on Tokyo (HND).
Fig. 8. Signatories to the transit agreement.
F. Dobruszkes Applied Geography 109 (2019) 102033
5

(see Casadevall, 1994; Alexander, 2013). In most cases, planes makereasonable detours to avoid such dangerous areas. But subject to thelocation and intensity of the eruptions, as well as ash dispersion pat-terns, detours may be longer or planes may be grounded. The mostemblematic recent case is the 2010 Eyjafjallajökull eruption. While theeruptions occurred in Iceland, up to 75% of Europe's flights had to becancelled and millions of travellers were stuck (Alexander, 2013).
3.3. Geopolitical factors
3.3.1. First air freedomIt is well known that the International Civil Aviation Conference
held in Chicago in 1944 failed to adopt a multilateral liberal agreement.The extension of states’ sovereignty over their sky was confirmed, sointernational air traffic needs to be allowed, and this has been achieved
Fig. 9. The impact of no-overfly rights on routes from Tel Aviv.Azimuthal equidistant projection centred on Tel Aviv.
Fig. 10. Routes between Beirut and Amman Azimuthal equidistant projection centred on Beirut.
F. Dobruszkes Applied Geography 109 (2019) 102033
6
mostly through bilateral agreements negotiated by country pairs.However, an International Air Services Transit Agreement – aka IASTAor the Transit Agreement – was signed in 1944, although by fewercountries. The Transit Agreement grants rights of overfly (first airfreedom) and of technical stop (second air freedom) on a multilateralbasis to all signatories. As of mid-2018, 133 parties (including somedependencies) had signed IASTA. As evidenced by Fig. 8, there are stillvast areas that are not free for transit, including Canada, Brazil, Russia,China and roughly half of Africa.
For the rest, signatories may refuse the right of overfly to airlinesregistered in non-signatory states, and non-signatories can refuse any
airline the right of overfly. As a result, drawing air routes has to be doneunder the constraints of overfly rights, which often reflect geopoliticalpatterns. For instance, Israeli airlines cannot fly over many Muslimcountries, so significant detours appear on certain routes (Fig. 9). In-terestingly, flights operated by non-Israeli airlines also skirt around thesame countries. It is unclear whether this is a precaution or whether itsuggests that exclusion may also be based on the flight origin or des-tination, in addition to the airlines’ country of registration.
Of course, the opposite is true too, as evidenced by the very longdetours (in proportion) visible on routes between Beirut (Lebanon) andAmman (Jordan) (Fig. 10). There is no doubt Lebanon-based airlinescannot fly over Israel. In contrast, Royal Jordanian commonly flies overIsrael following the 1994 Israel-Jordan peace treaty. However, there arerestrictions based on the origin or destination of the flight. Flights to/from Europe and the US are routed via Israel, but not flights from/toLebanon. In this context, Fig. 10 shows that detours experienced di-verge based on airlines’ country of registration. Lebanon-registeredMiddle East Airlines goes via Syria, which is understandable given theproximity between President Bashar al-Assad and the Lebanese gov-ernment through Hezbollah. Conversely, Royal Jordanian has to avoidSyria and Israel in this case, so the airline routes its planes via theMediterranean and Egypt, which is a much longer detour.
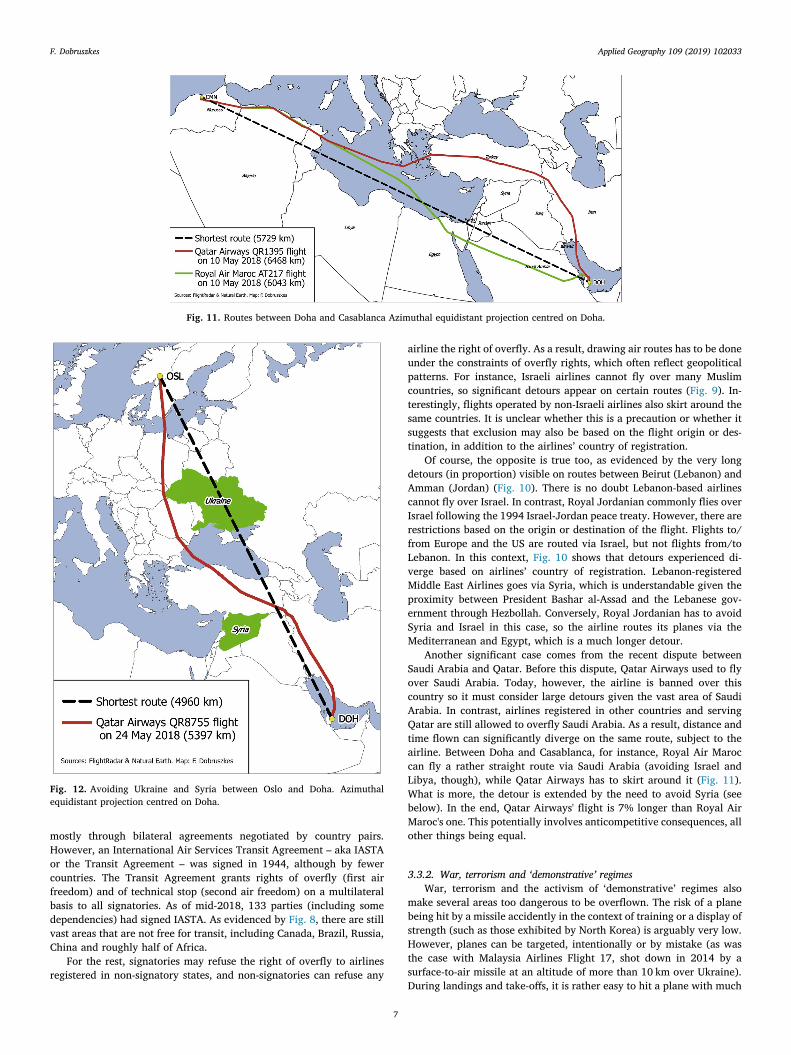
Another significant case comes from the recent dispute betweenSaudi Arabia and Qatar. Before this dispute, Qatar Airways used to flyover Saudi Arabia. Today, however, the airline is banned over thiscountry so it must consider large detours given the vast area of SaudiArabia. In contrast, airlines registered in other countries and servingQatar are still allowed to overfly Saudi Arabia. As a result, distance andtime flown can significantly diverge on the same route, subject to theairline. Between Doha and Casablanca, for instance, Royal Air Maroccan fly a rather straight route via Saudi Arabia (avoiding Israel andLibya, though), while Qatar Airways has to skirt around it (Fig. 11).What is more, the detour is extended by the need to avoid Syria (seebelow). In the end, Qatar Airways' flight is 7% longer than Royal AirMaroc's one. This potentially involves anticompetitive consequences, allother things being equal.
3.3.2. War, terrorism and ‘demonstrative’ regimesWar, terrorism and the activism of ‘demonstrative’ regimes also
make several areas too dangerous to be overflown. The risk of a planebeing hit by a missile accidently in the context of training or a display ofstrength (such as those exhibited by North Korea) is arguably very low.However, planes can be targeted, intentionally or by mistake (as wasthe case with Malaysia Airlines Flight 17, shot down in 2014 by asurface-to-air missile at an altitude of more than 10 km over Ukraine).During landings and take-offs, it is rather easy to hit a plane with much
Fig. 11. Routes between Doha and Casablanca Azimuthal equidistant projection centred on Doha.
Fig. 12. Avoiding Ukraine and Syria between Oslo and Doha. Azimuthalequidistant projection centred on Doha.
F. Dobruszkes Applied Geography 109 (2019) 102033
7
lighter missiles that can be easily carried and launched. Rebels andother armed groups in various countries carry these weapons.
All this suggests that some areas should be avoided and indeed,there is a long list of exemples. At the time of writing, most interna-tional flights not serving Syria and Ukraine were avoiding them. Fig. 12shows a very concrete case. From Oslo to Doha, the shortest routewould be via Ukraine. Bypassing this country via the West, the shortestroute for the remaining journey would cross Syria, which is alsoavoided. So, ultimately, two detours are imposed, which makes theresulting distance 8.8% longer. Similarly, recent tensions between Indiaand Pakistan have involved the closure of Pakistan's airspace overseveral weeks and restrictions at several Indian airports, notably in-volving detours for en-route traffic. Also, recent troubles in Sudan haveinduced the temporary closure of its airspace.
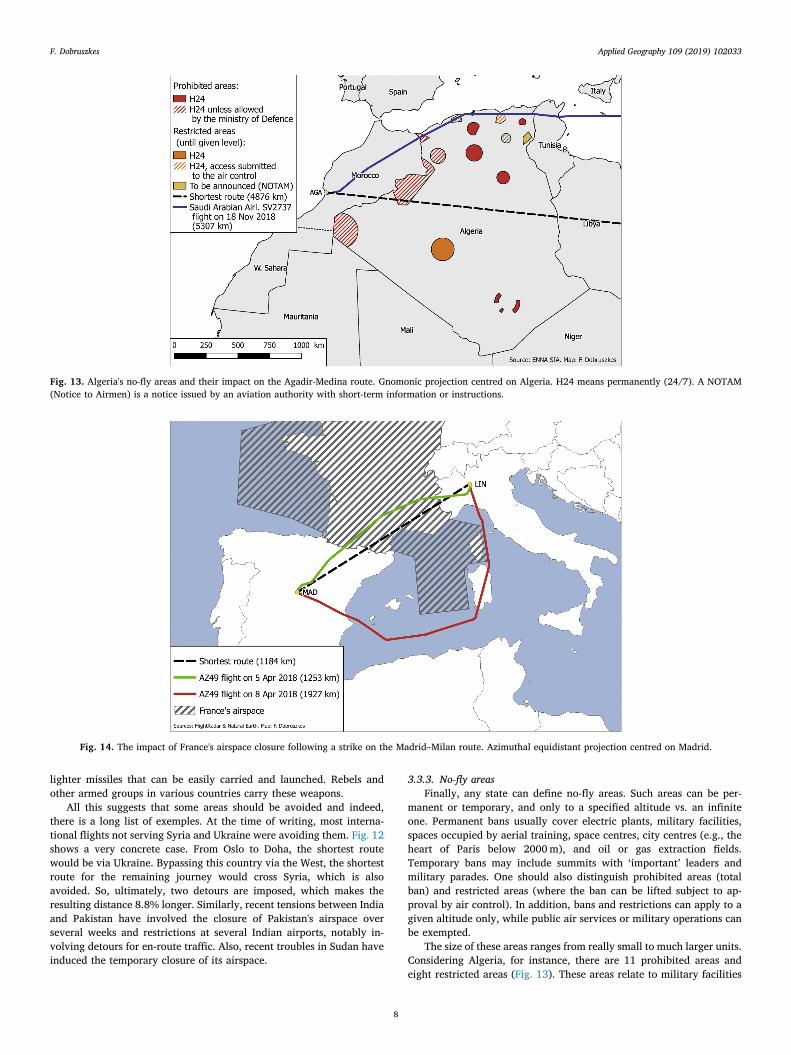
3.3.3. No-fly areasFinally, any state can define no-fly areas. Such areas can be per-
manent or temporary, and only to a specified altitude vs. an infiniteone. Permanent bans usually cover electric plants, military facilities,spaces occupied by aerial training, space centres, city centres (e.g., theheart of Paris below 2000m), and oil or gas extraction fields.Temporary bans may include summits with ‘important’ leaders andmilitary parades. One should also distinguish prohibited areas (totalban) and restricted areas (where the ban can be lifted subject to ap-proval by air control). In addition, bans and restrictions can apply to agiven altitude only, while public air services or military operations canbe exempted.
The size of these areas ranges from really small to much larger units.Considering Algeria, for instance, there are 11 prohibited areas andeight restricted areas (Fig. 13). These areas relate to military facilities
Fig. 13. Algeria's no-fly areas and their impact on the Agadir-Medina route. Gnomonic projection centred on Algeria. H24 means permanently (24/7). A NOTAM(Notice to Airmen) is a notice issued by an aviation authority with short-term information or instructions.
Fig. 14. The impact of France's airspace closure following a strike on the Madrid–Milan route. Azimuthal equidistant projection centred on Madrid.
F. Dobruszkes Applied Geography 109 (2019) 102033
8

and training spaces, one nuclear research centre, oil or gas extractionsites and undetermined sites. The military spaces also target the borderwith Morocco in the context of recurrent tensions between the twocountries in relation to the status of Western Sahara and to mutualaccusations about hosting terrorists and the drug trade, which haveresulted in the surface border being closed since 1994. Prohibited andrestricted areas are of various sizes; the largest prohibited one extendsfor about 400 km. Fig. 13 also shows their impact on a route betweenMorocco and Saudi Arabia, even though the detour is also explained bythe need to avoid Libya.
3.4. Social factors
3.4.1. StrikesAir controller strikes can temporarily mean less available capacity
and or no capacity at all in the event of airspace closure. As a result,flights that were supposed to go via the affected airspaces would eitherhave to be cancelled or rerouted so they skirt around these areas.Fig. 14 shows a concrete example of a detour imposed by a strike inFrance. The detour added no less than 54% (in kilometres) to thenormal flight path.
4. Discussion and conclusions
In his pioneer work, Parker Van Zandt (1944: 7) highlighted “themyth of great circle flying”. Three quarters of a century later, despiterapid technological progress and less global geopolitical concerns,flying the shortest routes remains somewhat hypothetical. A large set offactors involved in detours has been identified. These factors can besorted by various criteria, including their very nature, temporality,spatial pattern, airlines affected (airline-specific factors vs. universalfactors), impact on fuel burnt and thus on the environment, and whe-ther the factors can be avoided (Table 1). According to a cost per-spective, taking advantage of (or avoiding) jet streams is the only caseof a “positive” detour that makes it possible to lower fuel burnt, andthus reduce costs, despite extra kilometres. Interestingly, airline routedesigners have to consider trade offs between various parameters. De-signing and optimising airline routes is thus a very concrete case of anapplied geography exercise, made up of constraints of all kinds, tradeoffs and thresholds.
Table 1 also shows that if most factors apply to all airlines, two ofthem – namely, time to alternate airports and first air freedom – areselective. Time to alternate airport is in the hands of the airlines to someextent, subject to their fleet mix. Airlines that have invested in aircraftcertified for longer ETOPS can fly more direct routes, all other thingsbeing equal. In contrast, the first air freedom issue is out of airlines’control, because of diplomacy and international relations issues. All inall, these two factors can differentiate airlines in terms of competi-tiveness, considering that, in most cases, longer distances involvelonger travel time and higher operating costs, and that passengers aresensitive to the magnitude of the detour8 (Choi, Wang, Xia, & Zhang,2019).
Finally, Table 1 suggests that several factors relating to detourscould be avoided (or at least softened) should public authorities adoptrelevant policies and strategies. While natural factors are, of course,given in the context of actual technologies, the design of air navigationnetworks, most geopolitical factors and social factors could be lessburdensome than today, subject to policies. In other words, not alldetours are necessarily a serious impediment.
In addition, this paper paves the way for further research. Firstly,the next logical step would be to assess how long the deviations are.Given the wide range of factors and the fact they may occur at various
Table1
Factorsrelatedtodetoursandthemainattributes.
Nature
Factor
Temporality
Detourmagnitude
Airlinesaffected
Impacton
fuelburnt
Avoidable(airlineperspective)
Avoidable(governm
ent
perspective)
Technical
Routedesign
Permanent
Mixed
All
Increase
No
Yes(ifextraairwayscanbe
added)
Traffi
cdensity
Temporaryorpermanent
Mixed
All
Increase
No
Yes(ifextraairwayscanbe
added)
Timetoalternate
airports
Permanent
Mixed
Subjecttoeach
airline‘sfleetmix
Increase
No
No
Naturalfactors
Relief
Permanent
Mixed
All
Increase
No
No
Storms
Temporary
Mixed
All
Increase
No
No
Jetstreams
Permanentbutchanging
location
Large
All
Decrease(tail)or
increase(front)
No
No
Cyclones
Temporary
Small
All
Increase
No
No
Volcanism
Temporary
Mixed
All
Increase
No
No
Geopolitical
Firstairfreedom
Permanent
Mixed
Subjecttoairline's
countryofregistrationand
tointernationalrelations
Increase
No
Yes,adoptingamoreopen
policy
No-fly
zones
Temporaryorpermanent
Mixed
All
Increase
No
Yes,relaxing
non-crucial
restrictions
War,terrorism
Temporary(hopefully)
Mixed
All
Increase
No,butriskingthelifeof
passengersandcrews
No
Social
Strike
Temporary
Mixed
All
Increase
No
Seekingtolim
itstrikesby
appropriateinitiatives
8 At least in the context of selecting indirect routes with various options ofairport to transfer.
F. Dobruszkes Applied Geography 109 (2019) 102033
9

places and be of various sizes, such assessment will need to consider alarge set of flights. In addition, the quantitative importance of eachfactor should also be investigated. This would likely be a complex taskbecause of the effects of combined factors.
Finally, this paper echoes academic debates on the meaning ofdistance. Distance in all its forms (straight line distance, time distance,cognitive distance, etc.) is certainly a core dimension of geographicalsciences (Gatrell, 1983; Pirie, 2009), a fact evidenced by Knox andMarston (2007) observation that, “The importance of distance as a fun-damental factor in determining real-world relationships is a central theme ingeography”, even though its “effects are not uniform”. Distance is also keyin transport geography, both as a means to segment analyses and as afundamental factor that shapes interactions between places. AsRodrigue, Comtois, and Slack (2013) stated, distance is “the most fun-damental element of geography in general and transport geography in par-ticular.” Beyond these statements, it has been argued that, in most cases,“rather than being problematized, [distance] is taken as self-evident, albeitelastic to some extent” and that “instead of a frozen and abstract objectdetached from the experience of crossing it”, distance should also beconsidered “as relational, meaningful, social and political. Attention todistance is attention to the in-between” (Handel, 2018). An interestingpoint with the issue of detours in commercial aviation is that it builds abridge between traditional and revisited political perspectives on dis-tance. In short, this paper is certainly about the traditional issue ofactual (accurate) distance to be considered by scholars. And, in-cidentally, it shows that even in its basic physical form, distance is stillworth investigating. But understanding the factors of detours also in-volves thinking about the in-between (geo)political factors that makedistances flown longer than the shortest routes, and thus about the gapbetween travel time and physical distance.
All this poses questions about today's (air) transport geography.Various reviews or progress reports related to transport geography havebarely explicitly considered it worthy of scrutiny (e.g., Goetz, 2006;Keeling, 2007; Schwanen, 2016, 2017 and 2018). Considering airtransport geography only, recent reflections on key issues and researchperspectives have also neglected the concept of distance (e.g., Ginieis,Sánchez-Rebull, & Campa-Planas, 2012; Oum & Zhang, 2001; Vowles,2006). And, somewhat symptomatically, keywords such as “distance”and “range” are missing in the index of air transport geography re-ference books in recent times (Graham, 1995; Bowen, 2010; Goetz andBudd, 2014), even though the concept is actually consideredthroughout the whole opus.
Acknowledgments
I would like to express my gratitude to Moritz Lennert (ULB) andBernard Jouret (IGN/ULB) for their help with projections; the pilots andexperts interviewed, including Jean-Cédric Bienfait (additvalue) andMarylin Bastin (skeyes); Caralampo Focas (Woodstock Coffee Shop) forvibrant discussions; Kevin O'Connor (University of Melbourne) whocommented on a previous version in detail; and Gilbert Soglohoun, whoprovided the inspiration for some case studies in his master's disserta-tion at ULB (CIEM). Comments and suggestions made by my colleaguesat the internal lunch seminar were also much appreciated, as well asdebates at the 2018 RFTM and IGU Conferences. Thank you, too, to theQGIS community for designing, maintaining and improving this usefulopen GIS with nice projection capabilities. Any remaining errors are mysole responsibility.
References
Adey, P., Budd, L., & Hubbard, P. (2007). Flying lessons: Exploring the social and culturalgeographies of global air travel. Progress in Human Geography, 31(6), 773–791.
Alexander, D. (2013). Volcanic ash in the atmosphere and risks for Civil aviation: A studyin european crisis management. International Journal of Disaster Risk Science, 4(1),9–19.
Beaumont, K. M. (1943). Air transport in the pacific: A British view. Pacific Affairs, 16(4),461–474.
Bowen, J. (2010). The economic geography of air transportation: Space, time, and the freedomof the sky. Abington: Routledge.
Casadevall, T. (Ed.). (1994). Volcanic ash and aviation safety: Proceedings of the first in-ternational symposium on volcanic ash and aviation safety. U.S. Geological SurveyBulletin 2047.
Chiles, P. (2007). ETOPS redefined. Aero Safety World March 2007.Choi, J. H., Wang, K., Xia, W., & Zhang, A. (2019). Determining factors of air passengers'
transfer airport choice in the Southeast Asia – north America market: Managerial andpolicy implications. Transportation Research Part A, 124, 203–216.
Dacharry, M. (1981). Géographie du transport aérien. Paris: Librairie Technique.Duval, T. (2013). Critical issues in air transport and tourism, tourism geographies. An
International Journal of Tourism Space, Place and Environment, 15(3), 494–510.FAA/Federal Aviation Administration (1999). Tips on mountain flying. Aviation safety
program. Document FAA-P-8740-60 AFS-803, Washington: Federal AviationAdministration. Available at: https://www.faa.gov/regulations_policies/handbooks_manuals/aviation, Accessed date: 24 January 2019.
Gatrell, A. (1983). Distance and space. A geographical perspective. Oxford: Clarendon Press.Gilmartin, P. (1991). Showing the shortest routes—great circles. In A. Robinson, & J.
Snyder (Eds.). Matching the map projection to the need (pp. 18–19). Committee on MapProjection of the American Cartographic Association 1991.
Ginieis, M., Sánchez-Rebull, M.-V., & Campa-Planas, F. (2012). The academic journalliterature on air transport: Analysis using systematic literature review methodology.Journal of Air Transport Management, 19, 31–35.
Goetz, A. (2006). Transport Geography: Reflecting on a subdiscipline and identifyingfuture research trajectories. The insularity issue in Transport Geography. Journal ofTransport Geography, 14(3), 230–231.
Goetz, A., & Budd, L. (Eds.). (2014). Geographies of air transport. Farnham: Ashgate.Graham, B. (1985). Geography and air transport. Chichester: Wiley288.Handel, A. (2018). Distance matters: Mobilities and the politics of distance. Mobilities,
13(4), 473–487.Hsu, K. (2014). China's airspace management challenge. U.S.-China economic and se-
curity review commission, staff report. Available at: https://www.uscc.gov/Research/china%E2%80%99s-airspace-management-challenge.
Jones, S., & Mehnert, K. (1940). Hawaii and the pacific: A survey of political geography.Geographical Review, 30(3), 358–375.
Keeling, D. (2007). Transportation geography: New directions on well-worn trails.Progress in Human Geography, 31(2), 217–225.
Knox, P., & Marston, S. (2007). Places and regions in global context – human geography.Upper Saddle River: Pearson/Prentice Hall537.
Lin, C., & Lin, H.-C. (2010). Promotion on ETOPS flight operation in north pacific area.Journal of Aeronautics, Astronautics and Aviation, Series A, 42(2), 99–110.
Mason, K. (1936). The Himalaya as a barrier to modern communications. TheGeographical Journal, 87(1), 1–13.
Moore-Brabazon, J. (1944). The geography of post-war air routes. The GeographicalJournal, 103(3), 89–93 (Followed by a discussion pp. 93–100).
Oum, T. H., & Zhang, Y. (2001). Recent studies on some key issues in international airtransport. Transport Policy, 8(3), 167–169.
Parker Van Zandt, J. (1944). The geography of world air transport. Washington: TheBrookings Institution.
Pirie, G. H. (2009). Distance, international encyclopedia of human geography, Vol. 3,242–251.
Ren, P., & Li, L. (2018). Characterizing air traffic networks via large-scale aircraft trackingdata: A comparison between China and the US networks. Journal of Air TransportManagement, 67, 181–196.
Robinson, A. (1986). Which map is best? Projections for world maps. Committee on MapProjections of the American Cartographic Association.
Robinson, A. (1988). Choosing a world map: Attributes, distortions, classes, aspects.Committee on Map Projections of the American Cartographic Association.
Rodrigue, J.-P., Comtois, C., & Slack, B. (2013). The geography of transport systems (3rded.). Abingdon/New York: Routledge.
Schwanen, T. (2016). Geographies of transport I: Reinventing a field? 40(1), 126–137.Schwanen, T. (2017). Geographies of transport II: Reconciling the general and the par-
ticular. Progress in Human Geography, 41(3), 355–364.Schwanen, T. (2018). Geographies of transport III: New spatialities of knowledge pro-
duction? Progress in Human Geography, 42(3), 463–472.Sealy, K. (1966). The geography of air transport (2nd ed.). London: Hutchinson University
Library.
F. Dobruszkes Applied Geography 109 (2019) 102033
10

Snyder, J. P. (1987). Map projections: A working manual. U.S. Geological SurveyProfessional Paper 1395, Washington, United States Government Printing Office.Available at: https://pubs.er.usgs.gov/publication/pp1395, Accessed date: 30November 2018.
Spoehr, A. (1946). The Marshall Islands and transpacific aviation. Geographical Review,36(3), 447–451.
Stewart, J. (1943). The use and abuse of map projections. Geographical Review, 33(4),589–604.
Sun, X., Wandelt, S., & Linke, F. (2015). Temporal evolution analysis of the european air
transportation system: Air navigation route network and airport network.Transportmetrica B: Transport Dynamics, 3(2), 153–168.
Taylor, R. (1990). Twin-engine transports. A look at the future. AIAA/AHS/ASEE aircraftdesign, systems and operations meeting, dayton, Ohio (ref. AIAA 90-3215).
Tooley, M., & Wyatt, D. (2018). Aircraft communications and navigation systems (2nd ed.).Abingdon: Routledge.
U.S. Air Force (2005). Air navigation. Honolulu: University Press of the Pacific.Vowles, T. (2006). Geographic perspectives of air transportation. The Professional
Geographer, 58(1), 12–19.
F. Dobruszkes Applied Geography 109 (2019) 102033
11