why g matters: the complexity of everyday life · suggesting ways to reduce the risks for low-iq...
TRANSCRIPT
Why g Matters: The Complexity of Everyday Life LINDA S. GOTTFREDSON
University of Delaware
Personnel selection research provides much evidence that intelligence (g) is an important predictor of performance in training and on the job, especially in higher level work. This article provides evidence that g has pervasive utility in work settings because it is essen- tially the ability to deal with cognitive complexity, in particular, with complex information processing. The more complex a work task, the greater the advantages that higher g confers in performing it well. Everyday tasks, like job duties, also differ in their level of complexity. The importance of intelligence therefore differs systematically across differ- ent arenas of social life as well as economic endeavor. Data from the National Adult Literacy Survey are used to show how higher levels of cognitive ability systematically improve individuals’ odds of dealing successfully with the ordinary demands of modem life (such as banking, using maps and transportation schedules, reading and understanding forms, interpreting news articles). These and other data are summarized to illustrate how the advantages of higher g, even when they are small, cumulate to affect the overall life chances of individuals at different ranges of the IQ bell curve. The article concludes by suggesting ways to reduce the risks for low-IQ individuals of being left behind by an increasingly complex postindustrial economy.
“Intelligence is important in social life.” Few claims in the social sciences are backed by such massive evidence but remain so hotly contested in public dis- course. One obvious reason for such dispute is that many Americans are unsettled by the possible social ramifications of the claim, accurate or not. Another reason is that intelligence remains for many people an abstraction unconnected to their personal experience-a mere “black box” that they can fill with any imagining.
The aim of this article is to clarify the relevance of general intelligence (specifi- cally, g) in everyday life-in other words, to demystify that black box. Besides demonstrating that g is important in practical affairs, I seek to demonstrate why intelligence has such surprisingly pervasive importance in the lives of individuals.
Virtually all research on intelligence contributes to our understanding of its meaning. Indeed, thousands of studies have provided, and continue to provide, evidence about the origins of intelligence, its course of development, constituent
Direct all correspondence to: Linda S. Gottfredson, College of Human Resources, Education, and Public Policy, University of Delaware, Newark, DE 19716.
INTELLIGENCE a(1) 79- 132 Copyright 0 1997 Ablex Publishing Corporation ISSN: 0160-2896 All rights of reproduction in any form reserved
79
80 GOTTFREDSON
mental processes, degree of malleability, impact on performance in training and education, and the like (e.g., see the bibliography published with the editorial in this issue). However, relatively little attention has been devoted to the meaning of intelligence as individuals go about their daily lives. There is, nonetheless, con- siderable evidence pertinent to the issue.
I begin by focusing on the extensive research in job performance and job analy- sis. This work demonstrates that intelligence is important outside school settings, but it also reveals why it has practical utility. As will be shown, paid employment often consists of tasks that many people perform in their daily lives, so the re- search also provides a window into the cognitive demands of everyday life and hence the utility of g across perhaps all of life’s settings.
Next, I draw on the National Adult Literacy Survey (NALS) to provide more specific examples of the everyday tasks for which higher intelligence constitutes a substantial advantage. I then use both the employment and literacy data to sketch a portrait of life’s challenges and opportunities at different levels of intelligence. Lastly, I compare trends in the supply of national intelligence with trends in the demand for it and what they may portend for individuals at different levels of the IQ continuum.
WHAT DOES “IMPORTANT” MEAN?
By importance 1 mean functional importance. For example, to what extent does being brighter typically enhance academic achievement or job performance? To what extent will a firm’s aggregate worker productivity rise if it selects brighter employees? My concern here is thus with the impact of actual capabilities, not with people’s perceptions of their existence, utility, or moral value. Intelligence is viewed here, not as a virtue in itself, but as a means to commonly valued social ends.
The most common ways of indexing functional importance involve calculating correlations between individuals’ levels of intelligence and their degrees of suc- cess on some criterion. (These correlations are also called validities, predictive validities, or validity coefficients .) The higher the correlation, the more important a predictor is generally said to be.
Three sorts of statistics, however, can be calculated from correlations in order to facilitate their interpretation for different purposes: predictive efficiency, pre- diction of individuals’ odds of success, and prediction of changes in groups’ ag- gregate levels of performance (Jensen, 1980, pp. 305-310). I describe them in the Appendix, because there is much confusion on the issue. The latter two are the most important for social policy purposes. As will be illustrated, even small cor- relations can yield huge differences in individuals’ life chances.
WHY g MATTERS 81
g MATTERS ON THE JOB
The nature of intelligence-specifically, the general mental ability factor g de- rived from factor analyses of large sets of diverse mental tests-is discussed in detail later. It is sufficient at this point to note that it is a highly general informa- tion-processing capacity that facilitates reasoning, problem solving, decision making, and other higher order thinking skills.
Research in job analysis and personnel selection refutes the claim that g is useful only in academic pursuits. Intelligence turns out to be more important in predicting job performance than even personnel psychologists thought just two decades ago. And, very importantly, the research allows strong inferences about its causal importance.
Illustrative Correlational Data Civil rights law and regulation have led many employers in recent decades to scrutinize more carefully the validity of their selection procedures (Sharf, 1988). They have also prompted a sometimes desperate search for less g-loaded selection procedures (procedures less highly correlated with intelligence) in order to reduce disparate impact of selection devices on minority hiring and thus employers’ vul- nerability to employment discrimination lawsuits (Gottfredson & Sharf, 1988). As a result, there now exists a very large body of evidence concerning the predic- tive validity of various mental aptitudes, personality traits, and physical capa- bilities (e.g., see Gottfredson, 1986b; J. Hogan, 1991; R. Hogan, 1991; Landy, Shankster, & Kohler, 1994; Lubinski & Dawis, 1992; Schmidt, Ones, & Hunter, 1992; Stokes, Mumford, & Owens, 1994). Many of these data have been meta- analyzed.
Predictive Validity ofg Is Ubiquitous. The key observation here is that person- nel psychologists no longer dispute the conclusion that g helps to predict perfor- mance in most if not all jobs (Hartigan & Wigdor, 1989). Rather, their disputes concern how large the predictive validities are, often in the context of deciding the appropriate composition of a personnel selection battery. Estimates of the average validity of g across all jobs in the economy generally range between .3 and .5 (on a scale from 0 to 1 .O), depending on how validities are corrected for unreliability in the criterion and restriction in range on the predictor (Hartigan & Wigdor, 1989).
These estimates are based primarily on studies that used supervisor ratings of job performance. Average validities are yet higher when performance is measured objectively. For example, Hunter (1986) reported that correlations of g-loaded tests with work sample (“hands-on”) performance versus supervisor ratings were .75 versus .47 in a sample of civilian jobs and .53 versus .24 for a range of
82 GO’ITFREDSON
military jobs. Validities vary widely across different kinds of jobs, from a low of about .2 to a high of .8.
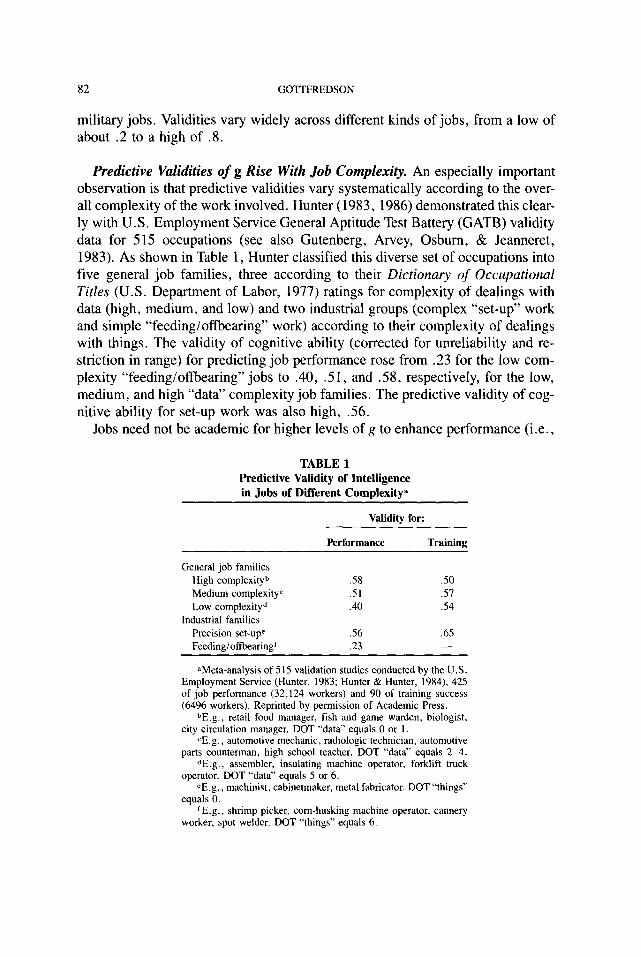
Predictive Validities of g Rise With Job Complexity. An especially important observation is that predictive validities vary systematically according to the over- all complexity of the work involved. Hunter (1983, 1986) demonstrated this clear- ly with U.S. Employment Service General Aptitude Test Battery (GATB) validity data for 5 15 occupations (see also Gutenberg, Arvey, Osburn, & Jeanneret, 1983). As shown in Table 1, Hunter classified this diverse set of occupations into five general job families, three according to their Dictionary of Occupational Titles (U.S. Department of Labor, 1977) ratings for complexity of dealings with data (high, medium, and low) and two industrial groups (complex “set-up” work and simple “feeding/offbearing” work) according to their complexity of dealings with things. The validity of cognitive ability (corrected for unreliability and re- striction in range) for predicting job performance rose from .23 for the low com- plexity “feeding/offbearing” jobs to .40, .51, and .58, respectively, for the low, medium, and high “data” complexity job families. The predictive validity of cog- nitive ability for set-up work was also high, .56.
Jobs need not be academic for higher levels of g to enhance performance (i.e.,
TABLE 1 Predictive Validity of Intelligence in Jobs of Different Complexity”
Validity for:
Performance Training
General job families
High complexityb
Medium complexityC
Low complexityd
Industrial families
Precision set-upr
Feedingioffbearing’
S8 .50
.51 .51
.40 .54
.56 .65
.23 -
‘Meta-analysis of 515 validation studies conducted by the U.S. Employment Service (Hunter, 1983; Hunter & Hunter, 1984), 425 of job performance (32,124 workers) and 90 of training success (6496 workers). Reprinted by permission of Academic Press.
bE.g., retail food manager, fish and game warden, biologist, city circulation manager. DOT “data” equals 0 or 1.
cE.g., automotive mechanic, radiologic technician, automotive parts counterman, high school teacher. DOT “data” equals 2-4.
dE.g., assembler, insulating machine operator, forklift truck operator. DOT “data” equals 5 or 6.
‘E.g., machinist, cabinetmaker, metal fabricator. DOT “things” equals 0.
E E.g., shrimp picker, corn-husking machine operator, cannery worker, spot welder. DOT *‘things” equals 6.
WHY g MATTERS 83
to be g loaded). Clerical occupations and the skilled trades are both moderately g loaded, but the latter have always been considered “hand” rather than “head” occupations. To illustrate the complexity of many “nonacademic” jobs, Hunter’s medium complexity job family includes auto mechanics; similarly, the even more highly g-loaded industrial set-up work is typified by jobs such as machinist and cabinetmaker.
Other data indicate that even the most intellectually demanding work is not necessarily academic. Professionals and high-level executives both rate their oc- cupations as highly intellectually demanding, but only the former tend to rate educational credentials, reading, and writing as essential (Gottfredson, Finucci, & Childs, 1984). Consistent with this, dyslexic men of high intelligence and social class frequently hold high-level jobs but rarely enter ones in which reading, writing, and educational credentials are critical (Gottfredson et al., 1984). (Dys- lexics are notable precisely because they do not have the reading and spelling skills, despite exposure to learning them, that normally accompany intelligence.)
Validity of g Is High Relative to Other Predictors. g can be said to be the most powerful single predictor of overall job performance. First, no other measured trait, except perhaps conscientiousness (Landy et al., 1994, pp. 271, 273), has such general utility across the sweep of jobs in the U.S. economy. More specific personality traits and aptitudes, such as extraversion or spatial aptitude, some- times seem essential above and beyond g, but across a more limited range of jobs (e.g., Bat-rick & Mount, 1991; Gottfredson, 1986a).
Second, no other single predictor measured to date (specific aptitude, person- ality, education, experience) seems to have such consistently high predictive val- idities for job performance. The clearest exceptions to the predictive superiority of g prove its relative importance. Psychomotor aptitudes sometimes have higher predictive validities than g, but only in low-level work (validities for g and psy- chomotor aptitudes vary inversely with each other; Gottfredson, 1986a; Hunter & Hunter, 1984). Validities for experience can also sometimes rival those for g, but, once again, they fall as complexity increases (McDaniel, Schmidt, & Hunter, 1988). In addition, they fall (whereas those for g do not) as groups gain longer average job tenure (Schmidt, Hunter, Outerbridge, & Goff, 1988). The advan- tages of superior experience fade-but those of superior g do not-in more expe- rienced groups of workers. In short, there is no rival to g in predicting performance in complex jobs. Average validity coefficients for educational level (0.0 to .2) are inconsequential relative to those for g (Hunter & Hunter, 1984).
Third, g generally predicts training and job performance about as well as whole batteries of predictors and, in any case, “carries the freight of prediction” in those batteries (Jensen, 1980, pp. 347-349; Ree, Earles, & Teachout, 1994; Thom- dike, 1986). Less cognitive traits such as personality and interests may better predict the less central dimensions of job performance, but this exception once
84 GO'lTFREDSON
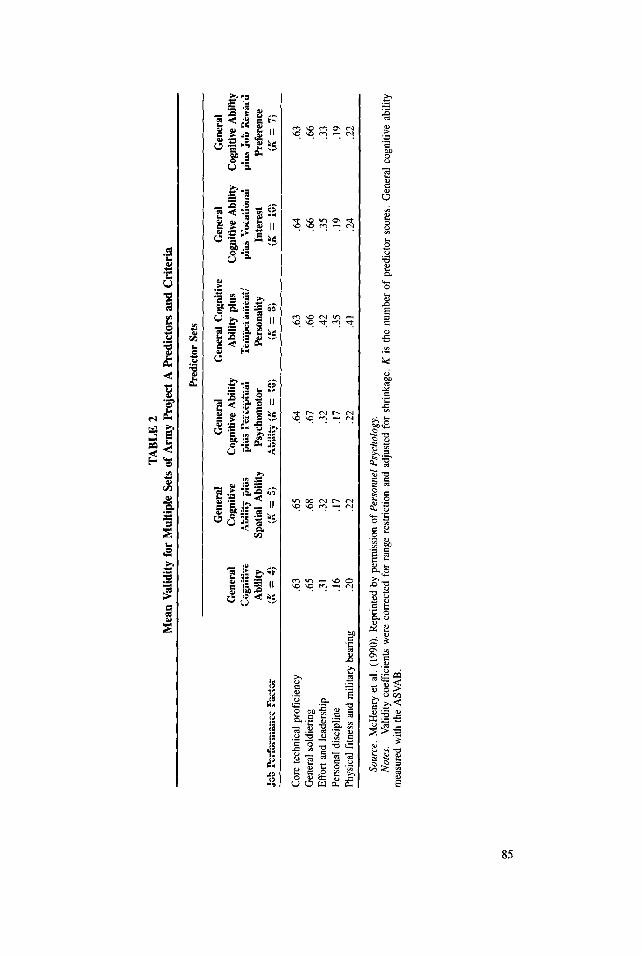
again proves the relative importance of g. The Army’s Project A provides the most definitive evidence in this regard (McHenry, Hough, Toquam, Hanson, & Ashworth, 1990). As shown in Table 2, specific aptitudes, interests, and traits of personality and temperament do not add meaningfully to the ability of general cognitive ability to predict either core technical proficiency or general proficiency in soldiering; they raise (corrected) validities only from .63 to .65 for the former and from .65 to .68 for the latter. Personality and temperament are at least as powerful as g, however, in predicting “personal discipline” and “physical fitness and military bearing .” They raise multiple correlations for these two auxilliary performance dimensions from .17 and .22, respectively, to .35 and .41.
Recent efforts to model job performance have begun to clarify the role of g. Path models of training and job proficiency (mostly in military jobs) indicate that g strongly predicts success in training and acquiring job knowledge, which in turn strongly predict task proficiency (Borman, White, Pulakos, & Oppler, 1991; Bor- man, Hanson, Oppler, Pulakos, & White, 1993; Borman, White, & Dorsey, 1995; Hunter, 1983; Ree, Carretta, & Teachout, 1995; Schmidt, Hunter, & Out- erbridge , 1986).
The nature of the job and its context seem to determine whether g has any direct effect on task proficiency, net of job knowlege. To illustrate, g has no direct effect in the nonsupervisory military jobs studied to date, where “performance requirements are laid out in great detail in technical manuals and training pro- grams” (Ree et al., 1995, p. 728), and workers are expected to “go by the book” (Hunter, 1986; Schmidt et al., 1986). By contrast, g has been found to have a direct effect, net of job knowledge, in civilian jobs (Hunter, 1983) and superviso- ry military jobs, where there is perhaps “more frequent, direct use of ability” (Borman et al., 1993, p. 447).
Length of experience has weak to moderate effects on job knowledge and task proficiency, net of g (Borman et al., 1993). Experience has its largest effects, as noted earlier, in less complex jobs, which are typically learned through experi- ence rather than training (Schmidt et al., 1986).
g Is Zmportunt in a Causal Sense. Perhaps no firm conclusions about the causal importance of g can be drawn when it is measured concurrently with job performance, as has often been the case with large civilian testing programs, such as the U.S. Employment Service’s General Aptitude Test Battery (GATB; U.S. Department of Labor, 1970). However, cognitive ability is always measured prior to induction into the military. The military has provided considerable evidence during the past half century for the causal importance of g.
World War II offers an early demonstration. During a period when it had to train many thousands of pilots, the military experimented with admitting to pilot training inductees of all ability levels (Matarazzo, 1972, p. 163). Of men in the top stanine of the experimental selection battery, which included abilities and
TA
BL
E 2
M
ean
Val
idity
for
Mul
tipl
e Se
ts o
f A
rmy
Pro
ject
A
Pre
dict
ors
and
Cri
teri
a
Pre
dict
or S
ets
Gen
eral
G
ener
al
Gen
eral
Cog
niti
ve
Gen
eral
G
ener
al
Gen
eral
C
ogni
tive
C
ogni
tive
Abi
lity
Abi
lity
plus
C
ogni
tive
Abi
lity
Cog
niti
ve A
bilit
y C
ogni
tive
A
bilit
y pl
us
plus
Per
cept
ual
Tem
pera
men
t/
plus
Voc
atio
nal
plus
Job
Rew
ard
Abi
lity
Spat
ial
Abi
lity
Psy
chom
otor
P
erso
nalit
y In
tere
st
Pre
fere
nce
Job
Per
form
ance
Fac
tor
(K
=
4)
(K
=
5)
Abi
lity
(K
=
10)
(K
=
8)
(K
=
10)
(K
=
7)
Cor
e tec
hnic
al p
rofi
cien
cy
.63
.65
.64
.63
.64
.63
Gen
eral
sol
dier
ing
.65
.68
.6-l
.6
6 .6
6 .6
6 E
ffor
t an
d le
ader
ship
.3
1 .3
2 .3
2 .4
2 .3
5 .3
3 Pe
rson
al d
isci
plin
e .I
6 .I
7 .I
7 .3
5 .I
9 .I
9 Ph
ysic
al f
itnes
s an
d m
ilita
ry b
eari
ng
.20
.22
.22
.41
.24
.22
Sour
ce.
McH
enry
et
al.
(199
0).
Rep
rint
ed b
y pe
rmis
sion
of
Per
sonn
el P
sych
olog
y.
Nor
es.
Val
idity
coe
ffic
ient
s w
ere
corr
ecte
d fo
r ra
nge
rest
rict
ion
and
adju
sted
for
shr
inka
ge.
K i
s th
e nu
mbe
r of
pre
dict
or s
core
s. G
ener
al c
ogni
tive
abili
ty
mea
sure
d w
ith t
he A
SVA
B.
86 GOTTFREDSON
motivation measured at induction, 95% successfully completed training, whereas only 20% of those in the lowest stanine did so. Subsequent military research has consistently shown that highly g-loaded measures such as the Armed Forces Qual- ifying Test (AFQT) and its forerunners, although not always conceptualized as measures of g, are good measures of “trainability’‘-hence their long-time use in screening for enlistment and assignment to training programs. More recent work, such as Army Project A (McHenry et al., 1990), has carefully demonstrated the validity of such measures for predicting job performance itself in military spe- cialties.
Additional evidence of the causal importance of g is provided by the many un- successful efforts to eliminate or short-circuit its functional link (correlation) with job proficiency. For example, there have been efforts to train the general cognitive skills that g naturally provides and that jobs require-such as general reading comprehension (which is important for using work manuals, interpreting instruc- tions, and the like). Another approach has been to provide extra instruction or experience to very low-aptitude individuals so that they have more time to master job content. Both reflect what might be termed the training hypothesis, which is that, with sufficient instruction, low-aptitude individuals can be trained to perform as well as high-aptitude individuals. The armed services have devoted much re- search to such efforts, partly because they periodically have had to induct large numbers of very low-aptitude recruits. Even the most optimistic observers (Sticht, 1975; Sticht, Armstrong, Hickey, & Caylor, 1987) have concluded that such train- ing fails to improve general skills and, at most, increases the number of low- aptitude men who perform at minimally acceptable levels, mostly in lower level jobs.
Not even lengthy experience (5 years) eliminates differences in overall job performance between more and less bright men (Schmidt et al., 1988). A large study of military cooks, repairmen, supply specialists, and armor crewmen showed that performance may converge on simpler and oft-performed tasks (Vineberg & Taylor, 1972, p. 55-57). However, even that limited convergence took consider- able time, reflecting large differences in trainability. It took men in the 10th to 30th percentiles of ability about 12 to 24 months to catch up with the performance levels on those tasks that were exhibited by men above the 30th percentile with no more than 3 months’ experience on the job. These findings from field settings are consis- tent with Ackerman’s (1987) review of the experimental literature relating skill learning and ability: individual differences in performance do not decrease with practice, and sometimes increase, when tasks are characterized by “predominantly inconsistent or varied information processing requirements .” In short, tasks that are not easily routinized continue to call forth g.
Finally, even individuals who argue most systematically that work environ- ments influence intelligence have estimated, using linear equation modeling, that intelligence affects the complexity of work one performs much more than the
WHY g MA’ITERS 87
reverse (Schooler, 1984). This conclusion is buttressed by evidence that intel- ligence is highly stable beginning in childhood (Moffitt, Caspi, Harkness, & Sil- va, 1993), has not been permanently affected by interventions specifically designed to raise it (Jensen, 1989a; Spitz, 1986), and has high (within-race) heri- tability but negligible “shared environmentability” by early adulthood (Plomin & Petrill, 1997; Rowe, 1997).
The causal impact of g does not mean, of course, that it is the only cause of differences in job performance. Other personal and environmental attributes clear- ly matter. However, the evidence is overwhelming that differences in intelligence are a major source of enduring, consequential differences in job performance.
Criterion-Referenced Data The concrete meaning of higher versus lower intelligence on the job-and in everyday life-is better illustrated by linking IQ levels to specific job proficiency levels, that is, by providing criterion-referenced data. For example, what exactly can workers of different ability levels do, and how quickly and accurately can they learn to do it? Disappointingly little such information has been published, but the manuals and reports for the major employment testing programs, civilian and military, provide a good start in piecing together criterion-related interpretations. All such programs provide measures of g, although they are not always labeled as such.
I focus mostly on data from the Wonderlic Personnel Test (WPT), which is a 50-item intelligence test that many employers have used to screen job applicants. Its validity and reliability for this purpose compare favorably with other adult intelligence tests. The manual for the Wonderlic provides the most comprehen- sive, up-to-date and publicly available data on the g demands of a wide variety of civilian jobs.
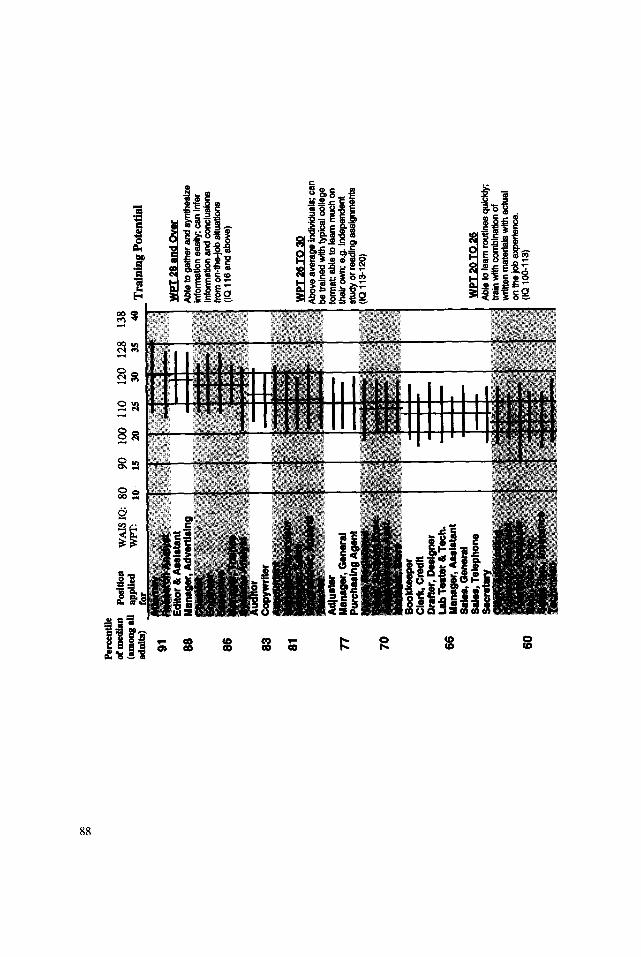
Higher Levels of g Are Required up the Occupational Ladder. Figure 1 pre- sents data from the Wonderlic Personnel Test. It illustrates the broad pattern docu- mented by the big military and civilian testing programs during the first half of this century (see Matarazzo, 1972, chap. 7, for a summary).
The first observation is that there is much IQ variation within all occupations and much overlap among them. Occupations attract and accommodate individuals from a wide range of IQ levels. As Figure 1 shows, the middle 50% of applicants to a job generally covers a range of 15 to 20 IQ points.
Applicants to particular jobs are somewhat more homogeneous than the general working population: specifically, the median SD of WIYI scores of applicants to the specific occupations shown in Figure 1 (6.3 WPT points) is 83% of that for the entire working population (7.6; Wonderlic Personnel Test, 1992, pp. 25, 27; but see also Sackett and Ostgaard, 1994, p. 682). (The data in Figure 3 suggest,
Per
cen
tile
of Ind
an
Pos
ltlon
W
AIS
IQ:
80
90
100
110
120
128
138
m:
10
15
20
25
30
35
4o
Tra
inin
g P
oten
tial
adlll
tsj
91
88
Mtm
agsr
, A
dver
tisin
g A
ble
to g
eths
r an
d sy
nths
ske
info
md
on
eas
ily: c
an in
fer
hlf
orm
atio
n an
d c
on
clu
sio
ns
fro
m on
-th
e-jo
b situ
atio
ns
(IQ
116
an
d a
bo
ve)
83
81
77
Adj
US
W
Msn
agw
, G
ener
al
Pur
chas
lna A
asnt
I
YY
m 2
6 vL
3.Q
W
ove
avsr
egs
indh
ridue
ls;
can
D
e tra
ined
wit
h ty
pic
al co
lleg
e b
nn
at: a
ble
to le
arn
mu
dr o
n
bir
o
wn
; e.g
. ln
dep
end
ant
stu
dy o
r rea
din
g as
sig
nm
ents
[I
Q 1
%IM
)
70
66
BO
Okb
Op
8f
Cl&
cr
edit
Dra
fter,
D
eslg
ner
L
ab T
eato
r & T
ech
. M
anag
er, A
ssis
tant
sa
ks,G
8ner
al
sale
s, T
ekph
ms
60
Abl
e to
lear
n ro
utfn
ss
quhd
dy;
trai
n w
hh
com
bin
atto
n of
wri
tten
mat
erie
ls wlt
h ac
tual
o
n th
e jo
b ex
per
ien
ce.
(IQ
loo
-l 1
3)
55
50
45
42
37
31
25
21
Au
tom
otI
Ve
sale
sman
cl
* T
ypis
t D
lSp
atC
tW
otf
i~~,
G
ener
al
Po
lice,
Pat
rol
off
.
Dat
a E
nb
y E
lect
rlca
l H
elp
er
Mac
hln
lst
Man
aaer
. F
oo
d D
aut.
Aic
W
eld
er,
Die
Set
t.
Mec
han
ic
Med
lcal
-Den
tal
Ass
t. M
esse
ng
er
Pro
du
ctlo
n.
Fac
torv
- -
Cu
sto
dia
n
& J
anit
or
I
YdP
fl6to
22
Suc
cess
ful In
ele
men
tarv
se
tting
s and w
ould
ben
ekt
fro
m p
rog
ram
med
or
mas
tery
le
arn
ing
ap
pro
ach
es;
imp
or-
ta
nt t
o a
llow
en
ou
gh
tim
e an
d
‘han
ds
on
’ (o
n th
e jo
b)
exp
erie
nce
pre
vio
us
to w
ork
. (I
Q 9
%10
4)
wpT
1oto
17
Nee
d t
o be
‘exp
lklll
y ta
ug
ht
mo
st o
f wh
at t
hey
mu
st le
arn
; su
cces
sfu
l ap
pro
ach
Is
to u
se
app
ren
tice
ship
pro
gra
m; m
ay
no
t ben
efll
fro
m ‘b
oo
k le
arni
ng”
trai
ning
. (I
Q 8
0-95
)
Un
likel
y to
ben
effl
fro
m
form
alfz
sd tr
afn
ing
set
tin
g;
succ
essf
ul u
sin
g s
imp
le to
ols
un
der c
onsi
sten
t sup
er&
ion.
(I
Q 83
an
d b
elo
w)
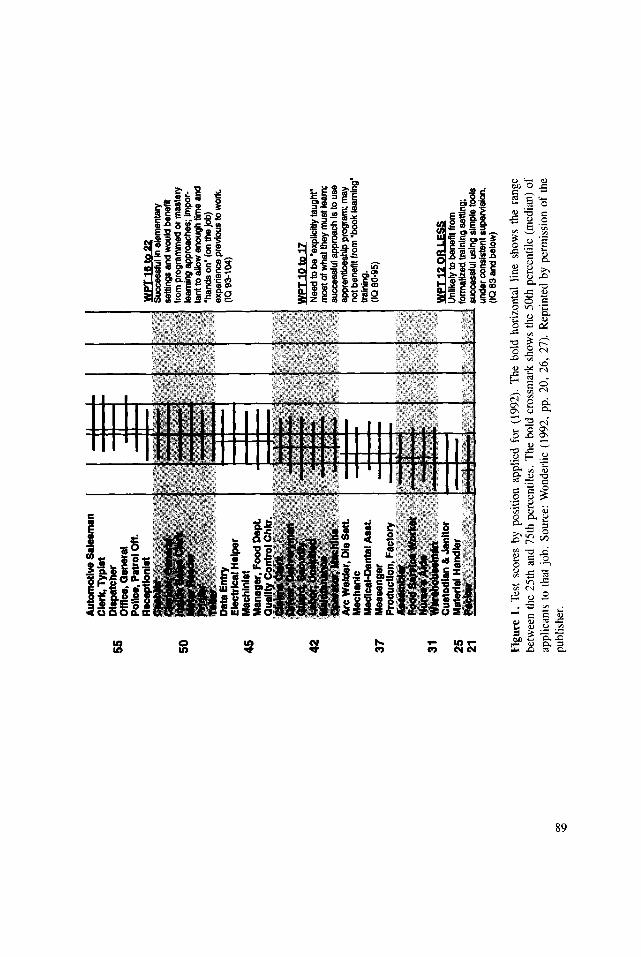
Figu
re
1. T
est
scor
es
by
posi
tion
appl
ied
for
(199
2).
The
bo
ld
hori
zont
al
line
show
s th
e ra
nge
betw
een
the
25th
an
d 75
th p
erce
ntile
s.
The
bo
ld
cros
smar
k sh
ows
the
50th
per
cent
ile
(med
ian)
of
ap
plic
ants
to
tha
t jo
b.
Sour
ce:
Won
derl
ic
(199
2,
pp.
20,
26,
27).
R
epri
nted
by
per
mis
sion
of
the
pu
blis
her.
90 COTTFREDSON
however, that the general working population disproportionately excludes low-IQ individuals.)
Job incumbents, in turn, are more homogeneous than applicants: the SD of job incumbents on ability tests is .6 to .7 of that for applicants (Hunter, Schmidt, & Judiesch, 1990)-but they still range widely in ability. Translating these data into the IQ metric, the average SD among incumbents in an occupation is between about 7.5 and 8.7 IQ points (compared with 15 for the general population). This means that two thirds of incumbents in the average job fall within a range of 15 to 17 IQ points; over 95% would be within a range of 30 to 34 points.
The second important observation, however, is that there are striking differ- ences in the IQ ranges from which occupations tend to draw the bulk of their workers. More specifically, there appear to be minimum IQ thresholds that rise steadily with job level. The median of an applicant pool is often recommended as a minimum passing score for further consideration of applicants to that job (Won- derlic Personnel Test, 1992, p. 14), so it can be viewed as a threshold for applicant competitiveness. By this measure, one needs an IQ of about 120 (the 91st percent- ile of the general population) to be competitive for the highest level jobs in Figure 1 (research analyst and advertising manager). The IQ levels required for compet- itiveness drop with job level: for example, IQ 112 (81st percentile of the general adult population) for accountant and teacher; IQ 100 (50th percentile) for cashier, meter reader, and teller; IQ 90 (25th percentile) for custodian and material han- dler. The medians of the highest and lowest of these applicant IQ distributions (IQ 120 vs. 90) differ by 2 SD, which means these distributions do not overlap much.
If the 25th WPT percentile of applicants is used to estimate the minimum threshold for employability in an occupation, it suggests that virtually all occupa- tions accommodate individuals down to IQ 110, but virtually none routinely ac- commodates individuals below IQ 80 (WPT 10). Employment options drop dramatically with IQ-from virtually unlimited above IQ 120 to scant below IQ 80. Such options are virtually nonexistent today (except in sheltered settings) for individuals below IQ 70 to 75, the usual threshold for borderline mental retarda- tion.
Lest IQ 80 seem an unreasonably high (i.e., exclusionary) threshold in hiring, it should be noted that the military is prohibited by law (except under a declaration of war) from enlisting recruits below that level (the 10th percentile). That law was enacted because of the extraordinarily high training costs and high rates of failure among such men during the mobilization of forces in World War II (Laurence & Ramsberger, 1991; Sticht et al., 1987; U.S. Department of the Army, 1965). Minimum enlistment standards since World War II have generally been higher than the 10th percentile, and closer to what they are today for the different ser- vices: the 16th AFQT percentile (Army, about IQ 85), 21st (Marine Corps and Air Force, IQ 88), and 27th (Navy, IQ 91). It should be noted that these are the enlistment standards for high school graduates. Nongraduates must score above
WHY g MATTERS 91
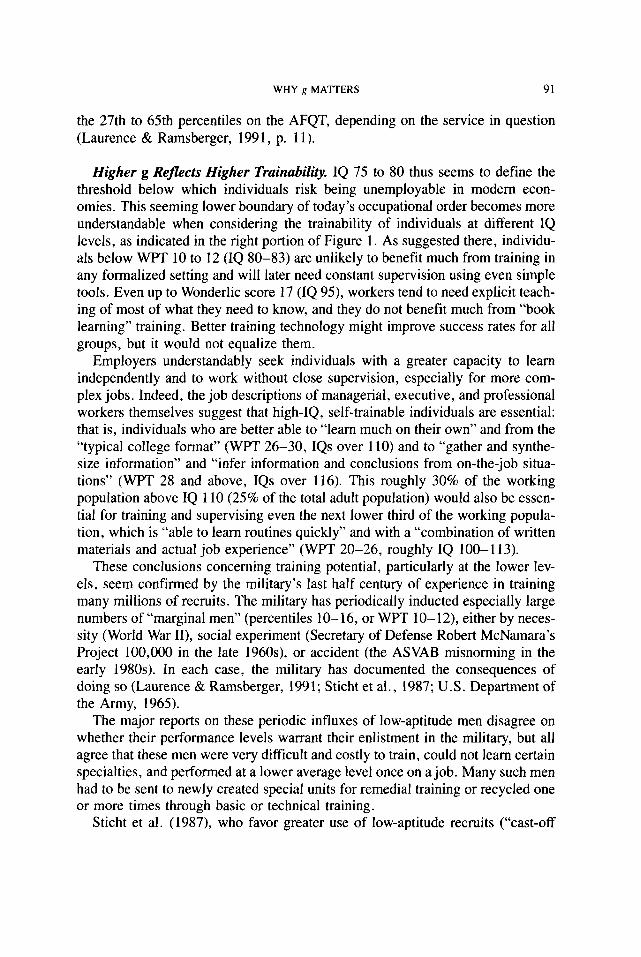
the 27th to 65th percentiles on the AFQT, depending on the service in question (Laurence & Ramsberger, 1991, p. 11).
Higher g Reflects Higher Trainability. IQ 75 to 80 thus seems to define the threshold below which individuals risk being unemployable in modern econ- omies. This seeming lower boundary of today’s occupational order becomes more understandable when considering the trainability of individuals at different IQ levels, as indicated in the right portion of Figure 1. As suggested there, individu- als below WPT 10 to 12 (IQ 80-83) are unlikely to benefit much from training in any formalized setting and will later need constant supervision using even simple tools. Even up to Wonderlic score 17 (IQ 95), workers tend to need explicit teach- ing of most of what they need to know, and they do not benefit much from “book learning” training. Better training technology might improve success rates for all groups, but it would not equalize them.
Employers understandably seek individuals with a greater capacity to learn independently and to work without close supervision, especially for more com- plex jobs. Indeed, the job descriptions of managerial, executive, and professional workers themselves suggest that high-IQ, self-trainable individuals are essential: that is, individuals who are better able to “learn much on their own” and from the “typical college format” (WPT 26-30, IQs over 110) and to “gather and synthe- size information” and “infer information and conclusions from on-the-job situa- tions” (WPT 28 and above, IQs over 116). This roughly 30% of the working population above IQ 110 (25% of the total adult population) would also be essen- tial for training and supervising even the next lower third of the working popula- tion, which is “able to learn routines quickly” and with a “combination of written materials and actual job experience” (WPT 20-26, roughly IQ 100-l 13).
These conclusions concerning training potential, particularly at the lower lev- els, seem confirmed by the military’s last half century of experience in training many millions of recruits. The military has periodically inducted especially large numbers of “marginal men” (percentiles lo- 16, or WPT lo- 12), either by neces- sity (World War II), social experiment (Secretary of Defense Robert McNamara’s Project 100,000 in the late 196Os), or accident (the ASVAB misnorming in the early 1980s). In each case, the military has documented the consequences of doing so (Laurence & Ramsberger, 1991; Sticht et al., 1987; U.S. Department of the Army, 1965).
The major reports on these periodic influxes of low-aptitude men disagree on whether their performance levels warrant their enlistment in the military, but all agree that these men were very difficult and costly to train, could not learn certain specialties, and performed at a lower average level once on a job. Many such men had to be sent to newly created special units for remedial training or recycled one or more times through basic or technical training.
Sticht et al. (1987), who favor greater use of low-aptitude recruits (“cast-off
92 COTTFREDSON
youth’), are most explicit about the modifications in technical training they re- quire and about “how difficult it is for the [military training] schools to train personnel of all aptitudes when slow learners may require two to five times more instructional time than more able learners” (p. 91). They report the conclusions of research on Project 100,000 men, which are that training for such individuals must be made as concrete, precise, structured, and job specific as possible. Sub- ject matter must not be “decontextualized” (abstracted) from common, everyday experiences with which the men are familiar. Quoting Crawford (1962, p. 3 13), Sticht et al. (1987, p. 94) noted that successful training for low-aptitude men “in some cases . . . may be achieved if the training content is limited strictly to that which is relevant to a specific job, and no attempt is made to supply any underly- ing theory or more general instruction which might be useful to trainees of higher aptitude in fitting them for rapid advancement to positions of greater respon- sibility.”
Laurence and Ramsberger (1991, pp. 146-147) were more skeptical about the future of low-aptitude men in the military:
The reluctance of the military to accept these men, let alone keep them, appears to be stead- fast. Higher quality recruits are easier to train and retrain and show greater promise for moving up the ranks and leading others as noncommissioned officers. Defense downsizing as a result of the thawing of Cold War tensions further removes the likelihood of increasing, and may even reduce, reliance on low-aptitude youth . . No one seems to want people of low- aptitude, at least for long.
BUT WHY DOES g MATTER?
The foregoing examples of the practical importance of g could be multiplied many times. The deeper question, however, is why does g have such pervasive practical utility? For example, why is a higher level of g a substantial advantage in carpen- try, managing people, and navigating vehicles of all kinds? And, very impor- tantly, why do those advantages vary in the ways they do? Why is g more helpful in repairing trucks than in driving them for a living? Or more for doing well in school than staying out of trouble? For example, IQ correlates .5 to .7 with aca- demic achievement (Jensen, 1980, p. 3 19), but only - .25 with delinquency (Gor- don, 1986). What explains this pattern of results?
Also, can we presume that similar activities in other venues might be similarly affected by intelligence? For example, if differences in intelligence change the odds of effectively managing and motivating people on the job, do they also change the odds of successfully dealing with one’s own children? If so, why, and how much?
The heart of the argument I develop here is this: For practical purposes, g is the ability to deal with cognitive complexity-in particular, with complex informa-
WHY g MATTERS 93
tion processing. All tasks in life involve some complexity, that is, some informa- tion processing. Life tasks, like job duties, vary greatly in their complexity (g loadedness). This means that the advantages of higher g are large in some situa- tions and small in others, but probably never zero.
g Is the Ability to Deal With Complexity One of the liveliest areas of research on intelligence today concerns the brain “hardware” and information-processing “software” that compose intelligence. Researchers are just beginning to chart the neural basis of g. However, much is known about the behavioral manifestations of these underlying processes. It is these outward signs of what we commonly recognize as intelligence that are most relevant for understanding the role of g in practical affairs.
Outward Manifestations of Intelligence. Although researchers disagree on how they define intelligence, there is virtual unanimity that it reflects the ability to reason, solve problems, think abstractly, and acquire knowledge (Snyderman & Rothman, 1988, p. 56). Intelligence is not the amount of information people know, but their ability to recognize, acquire, organize, update, select, and apply it effectively. In educational contexts, these complex mental behaviors are referred to as higher order thinking skills.
Stated at a more molecular level, g is the ability to mentally manipulate infor- mation-“to fill a gap, turn something over in one’s mind, make comparisons, transform the input to arrive at the output” (Jensen, 198 1, p. 62).
Complexity: The “Active Ingredient” in Intelligence Tests. One reason that many people have trouble believing that intelligence is important is that the con- tent of intelligence tests often seems remote from everyday demands (arranging blocks to copy specified designs, identifying the missing element in a picture, repeating digits in reverse order) or merely academic (vocabulary, arithmetic, analogies). They thus find it hard to conceive how the tests could possibly be measuring anything of benefit in daily affairs. However, the active ingredient in intelligence tests has nothing to do with their manifest content. This “indifference of the indicator” (Spear-man, 1923) was one of the earliest discoveries in intel- ligence testing (see Jensen, 1980, chap. 5, for an extended discussion).
Instead, the active ingredient in test items seems to reside in their complexity. Any kind of item content-words, numbers, figures, pictures, symbols, blocks, mazes, and so on-can be used to create less to more g-loaded tests and test items. Differences in g loading seem to arise from variations in items’ cognitive complexity and thus the amount of mental manipulation they require. Digit span subtests provide a clear example of how complexity can be manipulated with identical content. In digits forward, individuals are asked to repeat a string of from two to nine digits (say, 6-2-l-8-3) that is presented orally at one digit per
94 GOTTFREDSON
TABLE 3 Adults 16-65 Passinga WAIS Vocabulary Items (%)
Passing Passing Item (o/o) Item (o/o)
1. Bed 100 21. Terminate 55
2. Ship 100 22. Obstruct 58
3. Penny 100 23. Remorse 51
4. Winter 99 24. Sanctuary 49
5. Repair 98 25. Matchless 41
6. Breakfast 99 26. Reluctant 50
7. Fabric 92 27. Calamity 50
8. Slice 94 28. Fortitude 36
9. Assemble 90 29. Tranquil 36 10. Conceal 87 30. Edifice 22
11. Enormous 89 3 1. Compassion 29
12. Hasten 87 32. Tangible 30
13. Sentence 83 33. Perimeter 26
14. Regulate 80 34. Audacious 20
15. Commence 79 35. Ominous 20
16. Ponder 64 36. Tirade 17
17. Cavern 68 37. Encumber 19
18. Designate 63 38. Plagiarize 13
19. Domestic 65 39. Impale 14
20. Consume 61 40. Travesty 5
=Passing includes getting at least partial credit. Source. Matarazzo (1972, Table 5, p. 5 14). Reprinted by permission of
Williams and Wilkens.
second. In digits backward, the individual simply repeats the numbers in reverse order (in this case, 3-8-l-2-6). The one extra element in the second task (mentally “flipping” the list over) substantially increases its g loading (Jensen & Figueroa, 1975).
A little reflection also reveals how performance on even the most “academic” of tests, such as the Vocabulary subtest of the Wechsler Adult Intelligence Scale (WAIS; Wechsler, 1981), calls forth a highly general capacity for comprehending and manipulating information in the swirl of everyday life. We do not learn most words by memorization or direct instruction, but by inferring their meanings- and their fine nuances in meaning-from the way others use them. Learning vocabulary is largely a process of distinguishing and generalizing concepts.
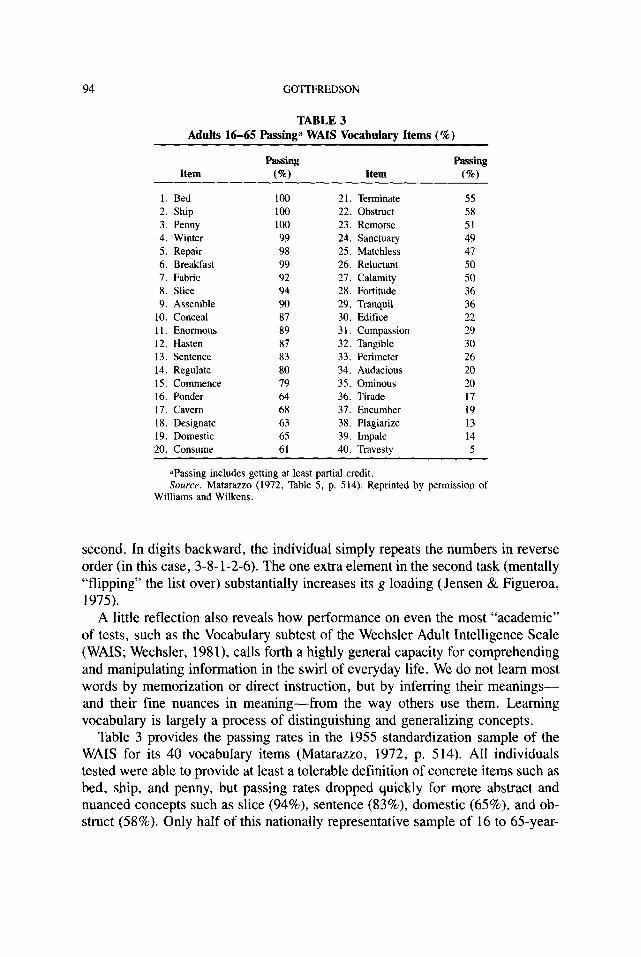
Table 3 provides the passing rates in the 1955 standardization sample of the WAIS for its 40 vocabulary items (Matarazzo, 1972, p. 514). All individuals tested were able to provide at least a tolerable definition of concrete items such as bed, ship, and penny, but passing rates dropped quickly for more abstract and nuanced concepts such as slice (94%), sentence (83%), domestic (65%), and ob- struct (58%). Only half of this nationally representative sample of 16 to 65-year-
WHY g MATTERS 95
TABLE 4 Adults 16-65 Passing”
WAIS Similarities Items (%)
1. Orange-Banana 93
2. Coat-Dress 90
3. Axe-Saw 90
4. Dog-Lion 86
5. North- West 73
6. Eye-Ear 69
7. Air-Water 56
8. Table-Chair 55
9. Egg-Seed 46
10. Poem-Statue 38
11. Wood-Alcohol 21
12. Praise-Punishment 25
13. Fly-Tree 18
aPassing includes getting at least partial credit. Source. Matarazzo (1972, Table 4, p. 513). Re-
printed by permission of Williams and Wilkins.
olds could define the words “remorse,” “ reluctant,” and “calamity.” Fewer than one in five knew the words “ominous” and “tirade,” and only 5% could provide even a partial definition of “travesty.” None of these words is esoteric; anyone who has attended U. S . high schools or read national newspapers or magazines has surely encountered them. Vocabulary tests gauge the ease with which individuals have routinely caught on to new and more complex concepts they encounter in the general culture.
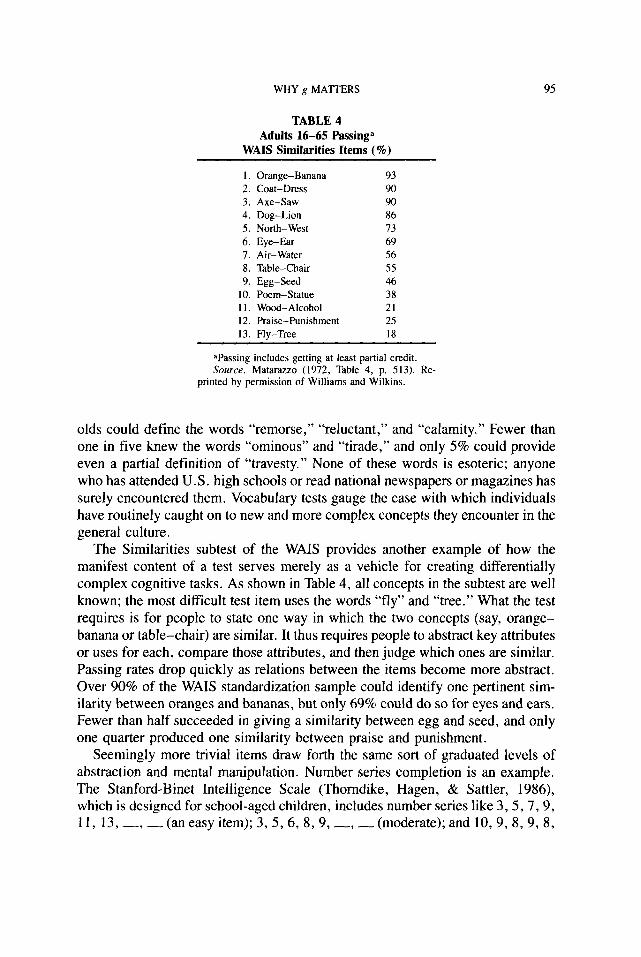
The Similarities subtest of the WAIS provides another example of how the manifest content of a test serves merely as a vehicle for creating differentially complex cognitive tasks. As shown in Table 4, all concepts in the subtest are well known; the most difficult test item uses the words “fly” and “tree.” What the test requires is for people to state one way in which the two concepts (say, orange- banana or table-chair) are similar. It thus requires people to abstract key attributes or uses for each, compare those attributes, and then judge which ones are similar. Passing rates drop quickly as relations between the items become more abstract. Over 90% of the WAIS standardization sample could identify one pertinent sim- ilarity between oranges and bananas, but only 69% could do so for eyes and ears. Fewer than half succeeded in giving a similarity between egg and seed, and only one quarter produced one similarity between praise and punishment.
Seemingly more trivial items draw forth the same sort of graduated levels of abstraction and mental manipulation. Number series completion is an example. The Stanford-Binet Intelligence Scale (Thomdike, Hagen, & Sattler, 1986), which is designed for school-aged children, includes number series like 3,5,7,9, 11, 13, _, _ (an easy item); 3, 5,6, 8,9, -, _ (moderate); and 10,9,8, 9, 8,
96 GOTTFREDSON
7, -, _ (difficult). One must discern the relations among succeeding numbers in order to complete the series. The relations become increasingly complex with successive items (in the foregoing examples, add 2 to each successive digit; add 3 to each successive set of two digits; subtract 1 from each successive set of three digits).
These sorts of mental processes-contrasting, abstracting, inferring, finding sa- lient similarities and differences-are the building blocks of intelligence as mani- fested in reasoning, problem solving, and grasping new concepts with facility.
Conceptions of Task Complexity Highlight Demands for Information Pro- cessing. We lack systematic task analyses of IQ tests, partly because their devel- opment has traditionally been guided by empirical procedures (e.g., what discriminates best between individuals who are considered gifted, average, and retarded), rather than by theoretical considerations. However, the nature of objec- tive task complexity has drawn attention in the fields of information processing, decision making, and goal setting (Campbell, 1988).
The terms used in different conceptions of task complexity connote a ground- ing in information-processing demands: multiple alternatives, inexact means- ends, interrelated and conflicting subtasks, uncertain or unknown outcomes, in- formation load and diversity, and rate of change. The various definitions tend to stress the number, variety, variability, ambiguity, and interrelatedness of informa- tion-not its substantive content-that must be processed to evaluate altema- tives, make a judgment, and reach a decision.
Wood (1986), for example, discussed three dimensions of task complexity: component complexity (e.g., number of cues to attend to and integrate, redundan- cy of demands), coordinative complexity (e.g., timing or sequencing of tasks, length of sequences), and changes in cause-effect chains or means-ends rela- tions).
This literature concerns itself with differences in tasks’ information-processing demands, not with differences in individuals’ ability to meet those demands. However, the task differences it identifies parallel the crucial task differences identified in IQ tests. This literature thus constitutes independent support for the inference that differences in IQ constitute differences in the capability to process diverse kinds of information in diverse situations.
Complexity Is a Key Feature of the Workplace Life is replete with uncertainty, change, confusion, and misinformation, some- times minor and at times massive. From birth to death, life continually requires us to master abstractions, solve problems, draw inferences, and make judgments on the basis of inadequate information. Such demands may be especially intense in school, but they hardly cease when one walks out the school door. A close look at job duties in the workplace shows why.
WHY g MATTERS 97
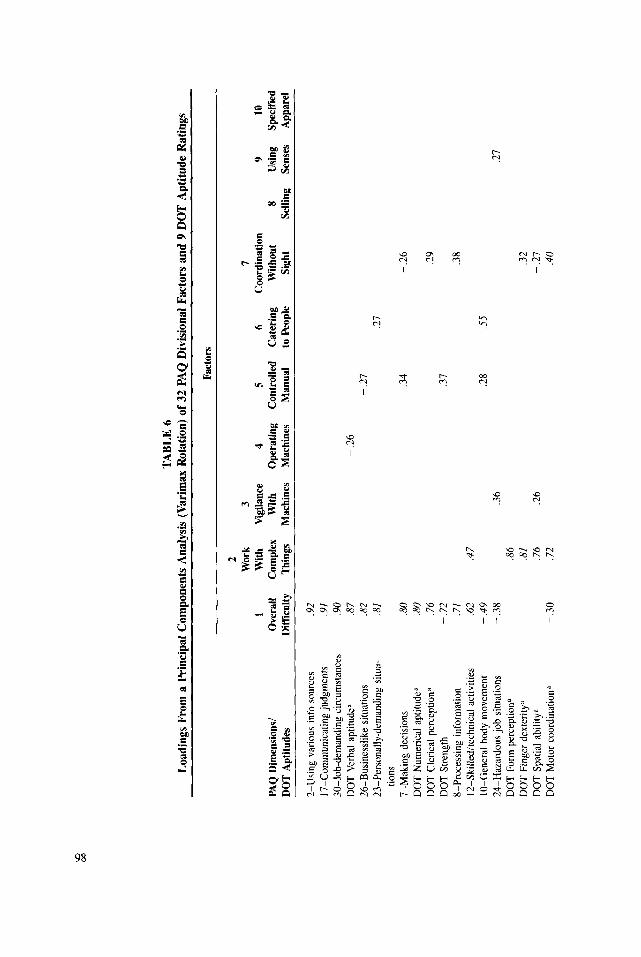
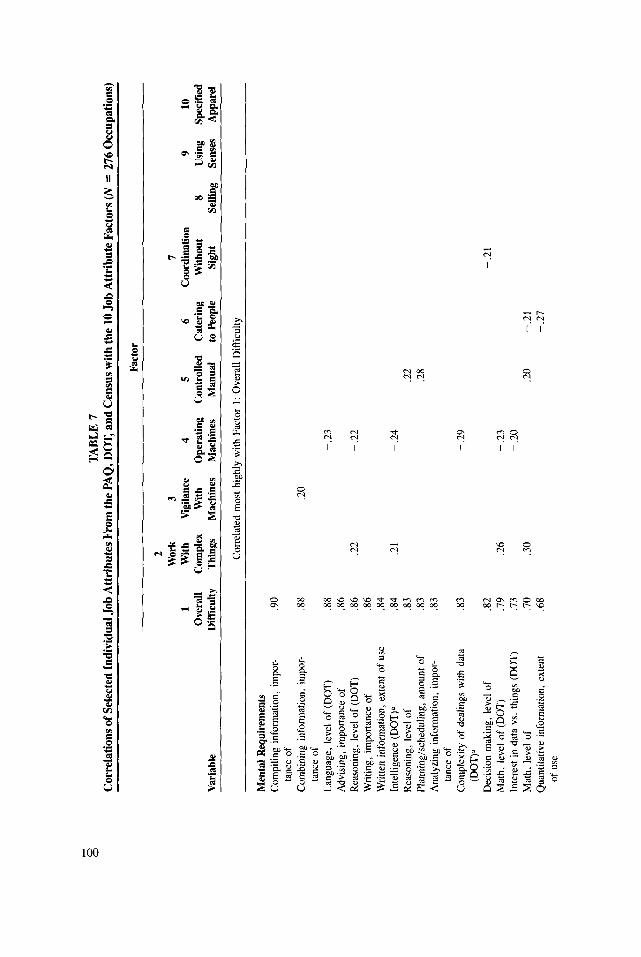
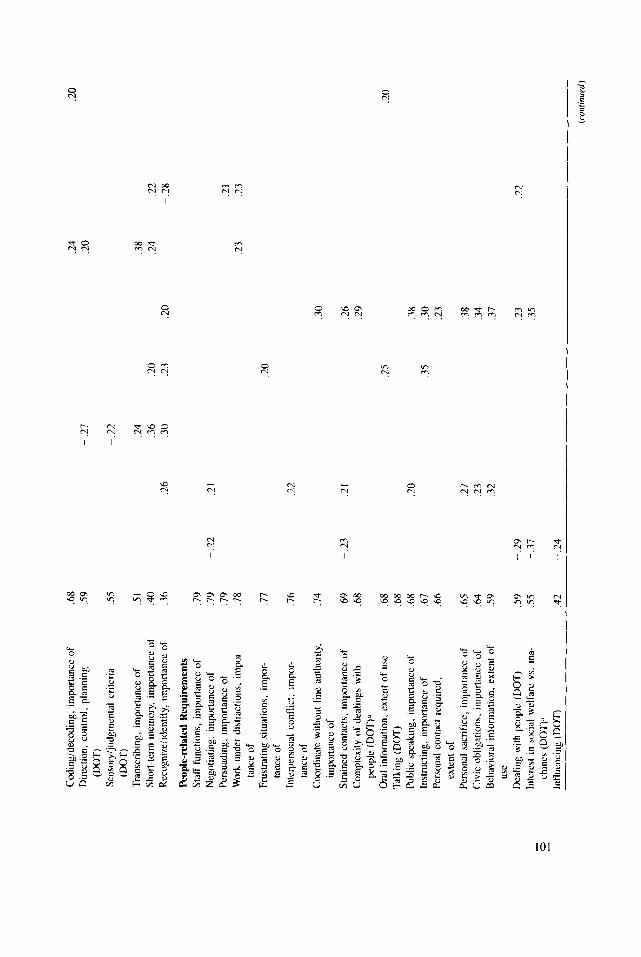
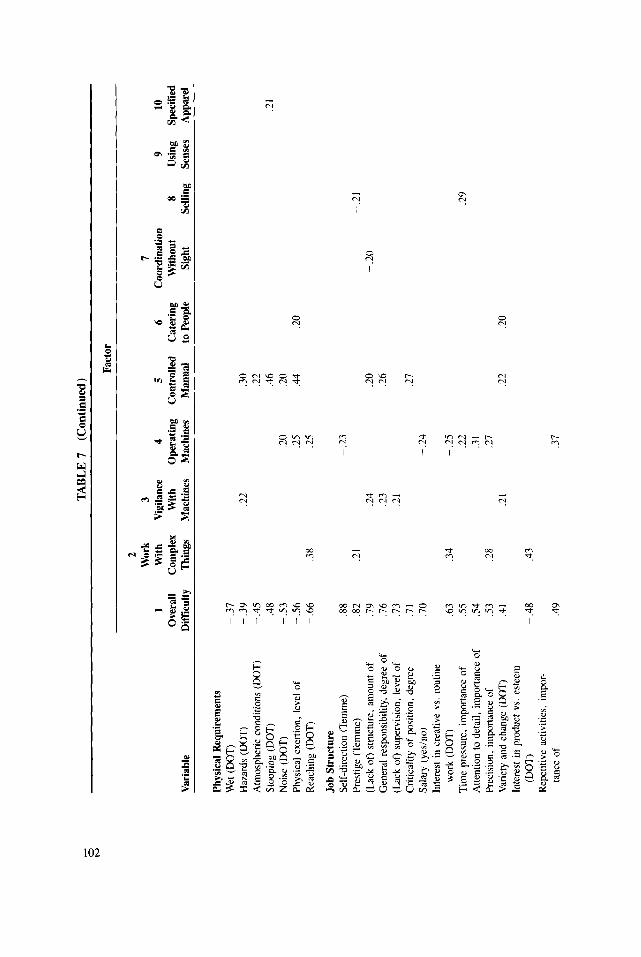
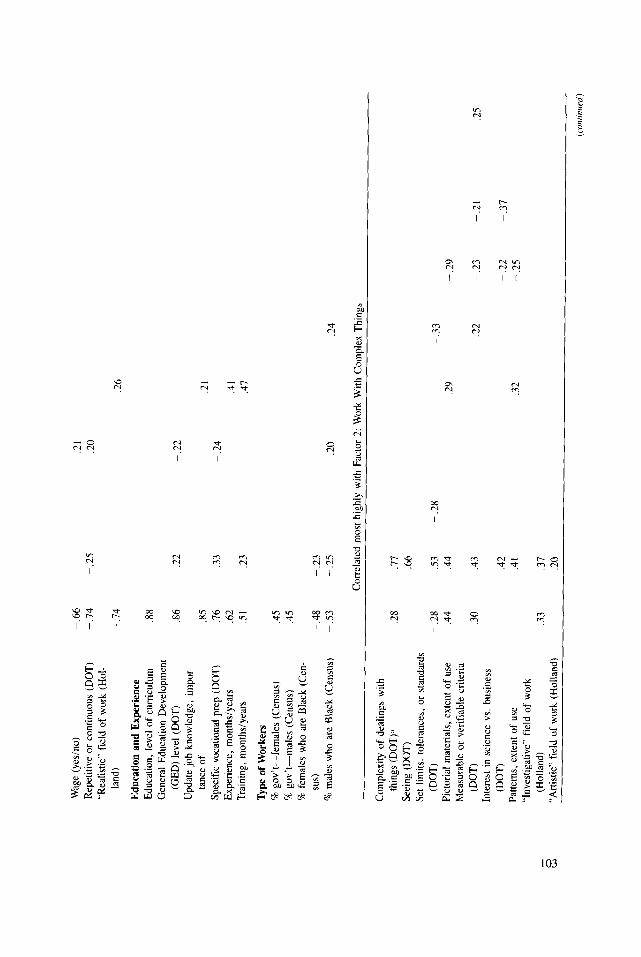
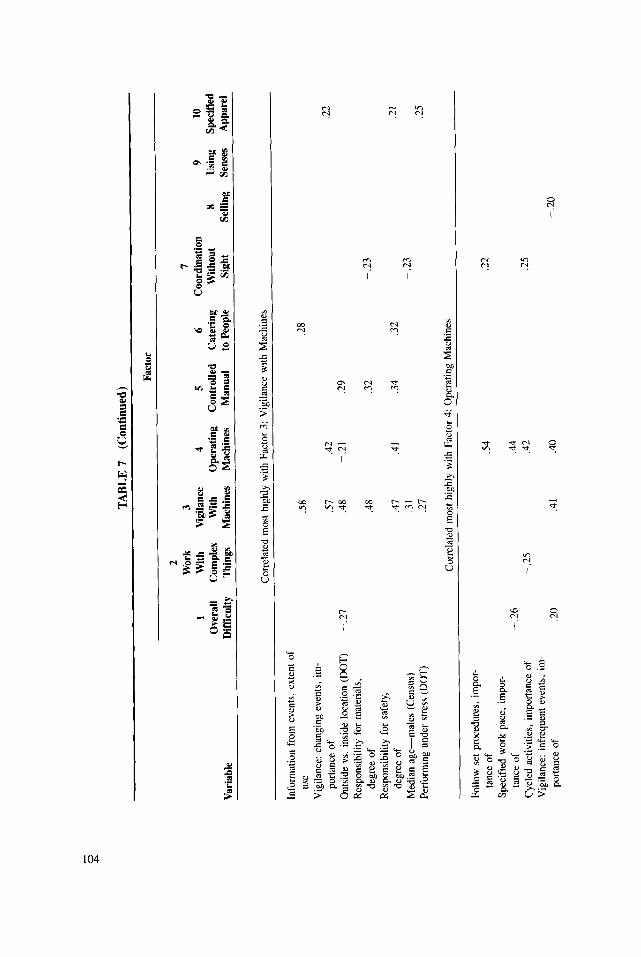
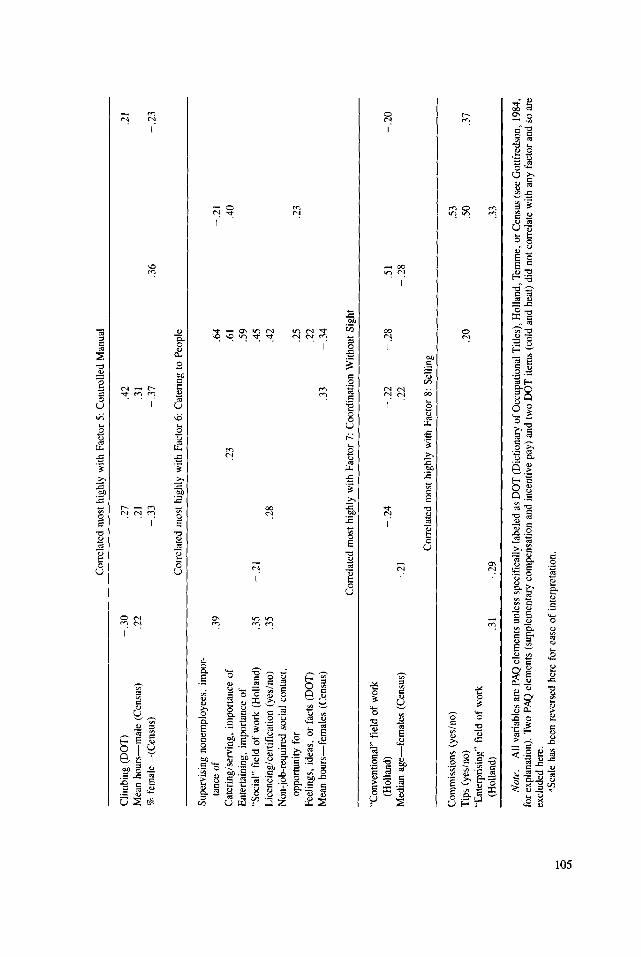
Many organizations, civilian and military, turn to job analysis in order to un- derstand how work might be better structured, what kinds of workers they should seek, and what sorts of training should be provided. Many inventories and stan- dardized procedures are available for this purpose (Harvey, 1991). The Position Analysis Questionnaire (PAQ), for example, assesses almost 200 elements of work and work context (see Table 7) under about three dozen categories (see Table 6). Data generated by such questionnaires have accumulated for many decades.
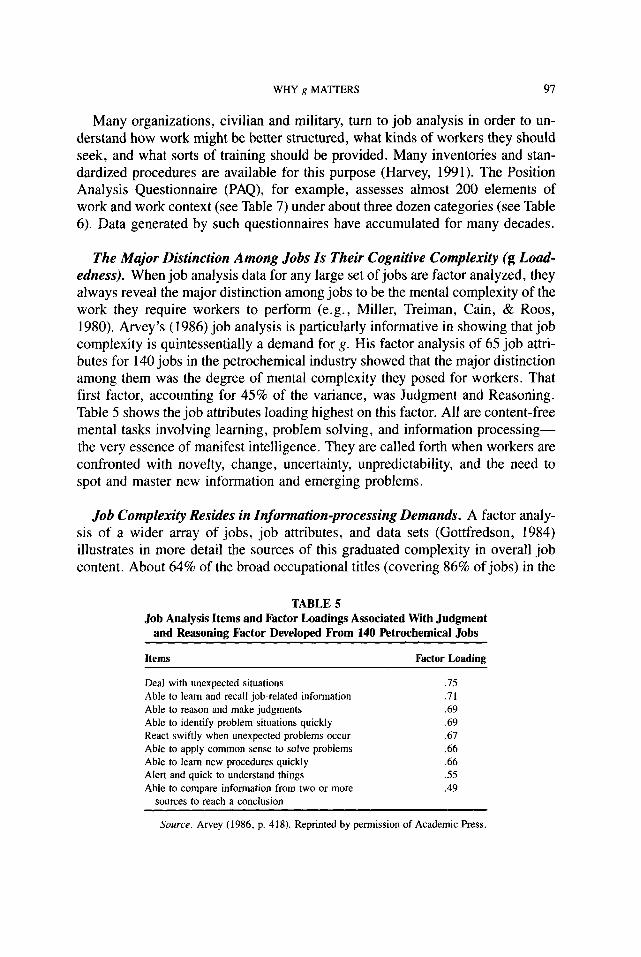
The Major Distinction Among Jobs Is Their Cognitive Complexity (g Load- edness). When job analysis data for any large set of jobs are factor analyzed, they always reveal the major distinction among jobs to be the mental complexity of the work they require workers to perform (e.g., Miller, Treiman, Cain, & Roos, 1980). Arvey’s (1986) job analysis is particularly informative in showing that job complexity is quintessentially a demand for g. His factor analysis of 6.5 job attri- butes for 140 jobs in the petrochemical industry showed that the major distinction among them was the degree of mental complexity they posed for workers. That first factor, accounting for 45% of the variance, was Judgment and Reasoning. Table 5 shows the job attributes loading highest on this factor. All are content-free mental tasks involving learning, problem solving, and information processing- the very essence of manifest intelligence. They are called forth when workers are confronted with novelty, change, uncertainty, unpredictability, and the need to spot and master new information and emerging problems.
Job Complexity Resides in Information-processing Demands. A factor analy- sis of a wider array of jobs, job attributes, and data sets (Gottfredson, 1984) illustrates in more detail the sources of this graduated complexity in overall job content. About 64% of the broad occupational titles (covering 86% of jobs) in the
TABLE 5 Job Analysis Items and Factor Loadings Associated With Judgment
and Reasoning Factor Developed From 140 Petrochemical Jobs
Items
Deal with unexpected situations
Able to learn and recall job-related information
Able to reason and make judgments
Able to identify problem situations quickly
React swiftly when unexpected problems occur
Able to apply common sense to solve problems
Able to learn new procedures quickly Alert and quick to understand things
Able to compare information from two or more
sources to reach a conclusion
Factor Loading
.75
.71
.69
.69
.67
.66
.66
.55
.49
Source. Arvey (1986, p. 418). Reprinted by permission of Academic Press.
TA
BL
E 6
L
oadi
ngs
Fro
m a
Pri
ncip
al C
ompo
nent
s A
naly
sis
(Var
imax
Rot
atio
n) o
f 32
PA
Q D
ivis
iona
l F
acto
rs a
nd 9
DO
T A
ptit
ude
Rat
ings
Fac
tors
PA
Q D
imen
sion
s/
DO
T A
ptit
udes
2 W
ork
3 I
1 W
ith
Vig
ilanc
e 4
5 6
Coo
rdin
atio
n 9
10
Ove
rall
Com
plex
W
ith
Ope
rati
ng
Con
trol
led
Cat
erin
g W
itho
ut
8 U
sing
Sp
ecif
ied
Dif
Ecu
lty
Thi
ngs
Mac
hine
s M
achi
nes
Man
ual
to P
eopl
e Si
ght
Selli
ng
Sens
es
App
arel
2-U
sing
va
riou
s in
fo
sour
ces
17-C
omm
unic
athr
g ju
dgm
ents
30-J
ob-d
eman
ding
ci
rcum
stan
ces
DO
T
Ver
bal
aptit
udea
26-B
usin
essl
ike
situ
atio
ns
23-P
erso
nally
-dem
andi
ng
situ
a-
tions
7-M
akin
g de
cisi
ons
DO
T
Num
eric
al
aptit
ude”
DO
T
Cle
rica
l pe
rcep
tion’
DO
T
Stre
ngth
8-Pr
oces
sing
in
form
atio
n
12-S
kille
d/te
chni
cal
activ
ities
IO-G
ener
al
body
m
ovem
ent
24-H
azar
dous
jo
b si
tuat
ions
DO
T
Form
pe
rcep
tionB
DO
T
Fing
er
dext
erity
”
DO
T
Spat
ial
abili
tya
DO
T
Mot
or
coor
dina
tiona
.92
.91
.90
.87
- .2
6
.82
.81
.80
.80
.76
-.72 .7
/
.62
.47
-.49
-.38
.36
.86
.81
.76
.26
-.30
.72
- .2
7
.21
.34
.31
.28
.55
- .2
6
.29
.38
.21
.32
-.27 .4
0

DO
T
Man
ual
dext
erity
”
3-W
atch
ing
devi
ces/
mat
eria
ls
5-A
war
e of
env
iron
men
t
1 I -C
ontr
ollin
g m
a-
chin
es/p
roce
sses
32-A
lert
to
cha
ngin
g co
nditi
ons
I4-M
isc.
eq
uipm
ent/d
evic
es
9-U
sing
m
achi
nes/
tool
s
I -In
terp
retin
g w
hat
sens
ed
31-S
truc
ture
d w
ork
25-T
ypic
al
day
sche
dule
13-C
ontr
olle
d m
anua
l ac
tiviti
es
20-E
xcha
ngin
g jo
b in
form
atio
n
22-U
nple
asan
t en
viro
nmen
t
19-S
uper
viso
ry/c
oord
inat
ion
IX-G
ener
al
pers
onal
co
ntac
ts
29-R
egul
ar
sche
dule
I6-G
ener
al
phys
ical
co
ordi
natio
n 2 I -
Publ
ic/r
elat
ed
cont
acts
2S
-Var
iabl
e vs
. sa
lary
pa
y
&U
sing
va
riou
s se
nses
4-E
valu
atin
g w
hat
is s
ense
d
27-O
ptio
nal
vs.
spec
ifie
d ap
pare
l 15
-Han
dlin
g/re
late
d m
anua
l
Eig
enva
lues
- .5
2 .7
0
.59
-.40
-.28
-.48
-.27
.38
-.48
- .3
8
.77
-.33
.73
.68
.34
.60
.70
.30
.63
.59
-.46
-.46
.31
.25
.21
.26
.63
.59
.56
.56
.38
-.32
.86
-.49
.82
.25
.80
.73
.29
.87
.8I
-.82
-.34
.31
.35
-.41
10.5
4.
6 4.
3 2.
5 1.
9 1.1
1.
6 1.
4 1.
3 1.
0
.25
.31
.29
-.34 .2
9
-.32
Var
ianc
e (%
) 25
.7
11.3
10
.6
6.2
4.6
4.2
3.8
3.4
3.1
2.5
aDO
T
aptit
ude
scal
es
are
reve
rsed
fo
r ea
se
of i
nter
pret
atio
n
g T
AB
LE
7
Cor
rela
tion
s of
Sel
ecte
d In
divi
dual
Job
Att
ribu
tes
Fro
m t
he P
AQ
, DO
T, a
nd C
ensu
s w
ith
the
10 J
ob A
ttri
bute
Fac
tors
(N
= 2
76 O
ccup
atio
ns)
Fac
tor
Var
iabl
e
2 W
ork
3 7
1 W
ith
Vig
ilanc
e 4
5 6
Coo
rdin
atio
n 9
10
Ove
rall
Com
plex
W
ith
Ope
rati
ng
Con
trol
led
Cat
erin
g W
itho
ut
8 U
sing
Sp
ecif
ied
Dif
fkul
ty
Thi
ngs
Mac
hine
s M
achi
nes
Man
ual
to P
eopl
e si
ght
Selli
ng
Sens
es
App
arel
Cor
rela
ted
mos
t hi
ghly
w
ith
Fact
or
1: O
vera
ll D
ifft
culty
Men
tal R
equi
rem
ents
C
ompi
ling
info
rmat
ion,
im
por-
tanc
e of
Com
bini
ng
info
rmat
ion,
im
por-
tanc
e of
Lan
guag
e,
leve
l of
(D
OT
)
Adv
isin
g,
impo
rtan
ce
of
Rea
soni
ng,
leve
l of
(D
OT
)
Wri
ting,
im
port
ance
of
Wri
tten
info
rmat
ion,
ex
tent
of
use
Inte
llige
nce
(DO
T)=
Rea
soni
ng,
leve
l of
Plan
ning
/sch
edul
ing,
am
ount
of
Ana
lyzi
ng
info
rmat
ion,
im
por-
tanc
e of
Com
plex
ity
of d
ealin
gs
with
da
ta
(DO
T)a
Dec
isio
n m
akin
g,
leve
l of
Mat
h,
leve
l of
(D
OT
)
Inte
rest
in
dat
a vs
. th
ings
(D
OT
)
Mat
h,
leve
l of
Qua
ntita
tive
info
rmat
ion,
ex
tent
of u
se
.90
.88
.20
.8X
-.2
3
.86
.86
.22
- .2
2
.86
.84
.84
.21
-.24
.83
.83
.83
.83
-.29
.82
.I9
.26
.I3
.70
.30
.68
-.23
-.20
.22
.28
-.21
.20
-.21
-.27
Co
din
g/d
eco
din
g,
imp
ort
ance
o
f
Dir
ecti
on
. co
nlr
ol,
pla
nn
ing
(DO
T)
Sen
sory
/jud
gm
enta
l cr
ilcri
a
(DO
T)
Tra
nsc
rib
ing
, im
po
rtan
ce
of
Sh
ort
-ter
m
mem
ory
, im
po
rtan
ce
of
Rec
o@
xe/id
enti
fy,
imp
ort
ance
o
f
Peo
ple-
rela
ted
Req
uire
men
ts
Staf
f fu
nct
ion
s,
imp
ort
ance
o
f
Neg
oti
atin
g,
imp
ort
ance
o
f
Per
suad
ing
. im
po
rtan
ce
of
Wo
rk
un
der
dis
trac
tio
ns,
im
po
r-
tan
ce o
f
Fru
stra
tin
g
silu
atio
ns.
im
po
r-
tan
ce o
f
Inte
rper
son
al
con
flic
t,
imp
or-
tan
ce o
f
Co
ord
inat
e w
ith
ou
t lin
e au
tho
rity
.
imp
ort
ance
of
Slr
ain
cd c
on
tact
s,
imp
ort
ance
o
f
Co
mp
lcxi
ly
of
dea
ling
s w
ilh
peo
ple
(D
OT
)a
Ora
l in
form
atio
n,
exte
nt
of
use
Tal
kin
g
(DO
T)
Pu
blic
sp
eaki
ng
, im
po
wan
cc o
f
Inst
ruct
ing
, im
po
rtan
ce
of
Per
son
al c
on
tact
rcq
uir
cd,
exte
nt
of
Per
son
al s
acri
fice
, im
po
rtan
ce
of
civi
c o
bti
gd
tio
ns,
im
po
rtan
ce
of
Beh
avio
ral
info
rmat
ion
, ex
ten
t o
f
“SC
Dea
ling
w
ith
pco
plc
(D
OT
)
lntc
rest
in
so
cial
wel
fare
vs
. m
a-
chin
es (
DO
T),
’
Infl
uen
cin
g
(DO
T)
.68
.59
-55
.51
.24
.38
.40
.36
.20
.24
-22
.36
.26
.30
.23
.20
p.2
8
.79
.79
-.22
.I9
.78
.-ll
.76
.I4
.21
.21
.23
.23
.22
.69
-.23
.2
1 -2
6
.6R
.2
9
.68
.68
.68
.67
-66
.20
.65
.27
.38
.64
.23
.34
.59
.32
.37
.59
-.29
.2
3 .2
2 .5
5 -.
37
-3s
.42
~24
~ .2
1
p.2
2
.24
m.2
0
.30
.25
.I38
.35
.30
.23
.20
20
(co
nti
nu
ed)
TA
BL
E
7 (C
onti
nued
)
Fac
tor
Var
iabl
e
L
Wor
k 3
7 1
Wit
h V
igila
nce
4 5
6 C
oord
inat
ion
9 10
O
vera
ll C
ompl
ex
Wit
h O
pera
ting
C
ontr
olle
d C
ater
ing
Wit
hout
8
Usi
ng
Spec
ifie
d D
iffi
cult
y T
hing
s M
achi
nes
Mac
hine
s M
anua
l to
Peo
ple
Sigh
t Se
lling
Se
nses
A
ppar
el
Phy
sica
l Req
uire
men
ts
Wet
(D
OT
)
Haz
ards
(D
OT
)
Atm
osph
eric
co
nditi
ons
(DO
T)
Stoo
ping
(D
OT
)
Noi
se
(DO
T)
Phys
ical
ex
ertio
n,
leve
l of
Rea
chin
g (D
OT
)
Job
Stru
ctur
e Se
lf-d
irec
tion
(Tem
me)
Pres
tige
(Tem
me)
(Lac
k of
) st
ruct
ure,
am
ount
of
Gen
eral
re
spon
sibi
lity,
de
gree
of
(Lac
k of
) su
perv
isio
n,
leve
l of
Cri
tical
ity
of p
ositi
on,
degr
ee
Sala
ry
(yes
/no)
Inte
rest
in
cre
ativ
e vs
. ro
utin
e
wor
k (D
OT
)
Tim
e pr
essu
re,
impo
rtan
ce
of
Atte
ntio
n to
det
ail,
impo
rtan
ce
of
Prec
isio
n,
impo
rtan
ce
of
Var
iety
an
d ch
ange
(D
OT
)
Inte
rest
in
pro
duct
vs
. es
teem
(DO
T)
Rep
etiti
ve
activ
ities
, im
por-
tanc
e of
-.37
-.
39
-.4_
5 -.
48
-.53
-.
56
-.66
.22
.20
.25
.38
.25
.88
.82
.I9
.76
.73
.71
.70
-.23
.2
1 .2
4 .2
3 .2
1
- .2
4
.63
.34
-.25
.55
.22
.54
.31
.53
.28
.21
.41
.21
- .4
8
-.49
.43
.3?
.30
.22
.46
.20
.44
.20
.20
.26
.21
.22
.20
.21
-.21
-.20
.29
Wag
e (y
es/n
o)
Rep
etiti
ve
or c
ontin
uous
(D
OT
)
“Rea
listic
” fi
eld
of
wor
k (H
ol-
land
)
Edu
cati
on a
nd E
xper
ienc
e E
duca
tion,
le
vel
of c
urri
culu
m
Gen
eral
E
duca
tion
Dev
elop
men
t
(GE
D)
leve
l (D
OT
)
Upd
ate
job
know
ledg
e,
impo
r-
tanc
e of
Spec
ific
vo
catio
nal
prep
(D
OT
)
Exp
erie
nce,
m
onth
s/ye
ars
Tra
inin
g,
mon
ths/
year
s
‘Qpe
of
Wor
kers
%
gov’
t-fe
mal
es
(Cen
sus)
% g
ov’t
-mal
es
(Cen
sus)
% f
emal
es
who
ar
e B
lack
(C
en-
sus)
% m
ales
w
ho
are
Bla
ck
(Cen
sus)
-.66
.2
1 -.
74
-.25
.20
-.I4
.2
6
.88
.86
.22
-.22
.85
.21
.76
.33
-.24
.62
.41
.51
.23
.47
.45
.45
-.48
-.23
- .5
3 -.2
5 .2
0 .2
4
Cor
rela
ted
mos
t hi
ghly
w
ith
Fact
or
2: W
ork
With
C
ompl
ex
Thi
ngs
Com
plex
ity
of
deal
ings
w
ith
thin
gs
(DO
T)a
-.2
8 .7
1
Seei
ng
(DO
T)
.66
Set
limits
, to
lera
nces
, or
st
anda
rds
(DO
T)
-.28
.53
-.28
-.33
Pict
oria
l m
ater
ials
, ex
tent
of
use
.4
4 .4
4 .2
9 -.2
9 M
easu
rabl
e or
ve
rifi
able
cr
iteri
a
(DO
T)
.30
.43
-.22
-.23
-.21
.25
Inte
rest
in
sci
ence
vs
. bu
sine
ss
(DO
T)
.42
-.22
-.37
Patte
rns,
ex
tent
of
use
.4
l .3
2 -
.25
“Inv
estig
ativ
e”
fiel
d of
w
ork
(Hol
land
) .3
3 .3
1
“Art
istic
” fi
eld
of
wor
k (H
olla
nd)
.20
,,,
TA
BL
E
7 (C
onti
nued
)
Fac
tor
Var
iabl
e
2 W
ork
3 7
1 W
ith
Vig
ilanc
e 4
5 6
Coo
rdin
atio
n 9
10
Ove
rall
Com
plex
W
ith
Ope
rati
ng
Con
trol
led
Cat
erin
g W
itho
ut
8 U
sing
Sp
ecif
ied
Dif
ficu
lty
Thi
ngs
Mac
hine
s M
achi
nes
Man
ual
to P
eopl
e Si
ght
Selli
ng
Sens
es
App
arel
Cor
rela
ted
mos
t hi
ghly
w
ith
Fact
or
3: V
igila
nce
with
M
achi
nes
Info
rmat
ion
from
ev
ents
, ex
tent
of
us
e .5
8 .2
8
Vig
ilanc
e:
chan
ging
ev
ents
, im
- po
rtan
ce
of
51
.42
.22
Out
side
vs
. in
side
lo
catio
n (D
OT
) -.2
1 .4
8 -.2
1 .2
9
Res
pons
ibili
ty
for
mat
eria
ls,
degr
ee
of
.48
.32
-.23
Res
pons
ibili
ty
for
safe
ty,
degr
ee
of
.41
.41
.34
.32
.21
Med
ian
age-
mal
es
(Cen
sus)
.3
1 -
.23
Perf
orm
ing
unde
r st
ress
(D
OT
) .2
7 .2
5
Cor
rela
ted
mos
t hi
ghly
w
ith
Fact
or
4: O
pera
ting
Mac
hine
s
Follo
w
set
proc
edur
es.
impo
r-
tanc
e of
Spec
ifie
d w
ork
pace
, im
por-
ta
nce
of
Cyc
led
activ
ities
, im
port
ance
of
Vig
ilanc
e:
infr
eque
nt
even
ts,
im-
port
ance
of
.54
.22
-.26
.44
-.25
.42
.25
.20
.41
.40
-.20
,,,
Cor
rela
ted
mos
t hi
ghly
with
Fac
tor
5: C
ontr
olle
d M
anua
l
Clim
bing
(D
OT
) -.
30
.27
.42
.21
Mea
n ho
urs-
mal
e (C
ensu
s)
.22
.21
.31
7~ fe
mal
e-(C
ensu
s)
-.33
-.
31
.36
-.23
Cor
rela
ted
mos
t hi
ghly
with
Fac
tor
6: C
ater
ing
to P
eopl
e
Supe
rvis
ing
none
mpl
oyee
s,
impo
r-
tanc
e of
C
ater
ing/
serv
ing,
im
port
ance
of
Ent
erta
inin
g, i
mpo
rtan
ce o
f “S
ocia
l” f
ield
of
wor
k (H
olla
nd)
Lic
enci
ng/c
ertif
icat
ion
(yes
/no)
N
on-j
ob-r
equi
red
soci
al c
onta
ct,
oppo
rtun
ity f
or
Feel
ings
, id
eas,
or
fact
s (D
OT
) M
ean
hour
s-fe
mal
es
(Cen
sus)
.39
.64
-.21
.2
3 .6
1 .4
0 .5
9 .3
5 -.
21
.45
.35
.28
.42
.25
.23
.22
.33
-.34
Cor
rela
ted
mos
t hi
ghly
with
Fac
tor
7: C
oord
inat
ion
With
out
Sigh
t
“Con
vent
iona
l” f
ield
of
wor
k (H
olla
nd)
Med
ian
age-
fem
ales
(C
ensu
s)
-.24
-.
22
-.28
.5
1 -.
20
-.21
.2
2 -.
28
Cor
rela
ted
mos
t hi
ghly
with
Fac
tor
8: S
ellin
g
Com
mis
sion
s (y
es/n
o)
.53
Tip
s (y
es/n
o)
.2O
SO
.3
-l
“Ent
erpr
isin
g” f
ield
of
wor
k (H
olla
nd)
.31
-.29
.3
3
No
te.
All
vari
able
s ar
e PA
Q el
emen
ts u
nles
s sp
ecif
ical
ly l
abel
ed a
s D
OT
(Dic
tiona
ry o
f O
ccup
atio
nal T
itles
), H
olla
nd,
Tem
me,
or
Cen
sus
(see
Got
tfre
dson
, 19
84,
for
expl
anat
ion)
. T
wo
PAQ
elem
ents
(su
pple
men
tary
com
pens
atio
n an
d in
cent
ive
pay)
and
tw
o D
OT
item
s (c
old
and
heat
) di
d no
t co
rrel
ate
with
any
fac
tor
and
so a
re
excl
uded
her
e.
%Sc
ale h
as b
een
reve
rsed
her
e fo
r ea
se o
f in
terp
reta
tion.
106 GOTTFREDSON
1970 census were characterized according to the major dimensions of job activ- ities, aptitude requirements, and working conditions that had been documented in previous large studies of American jobs (Mecham, McCormick, & Jeanneret, 1977; U.S. Department of Labor, 1970, 1977). A principal components factor analysis of these data yielded 10 orthogonal factors, shown in Table 6. The first factor-labeled Overall Mental Difficulty-accounted for 26% of the total vari- ance among these wide-ranging job attributes; the attributes loading most highly on this factor were the PAQ factors Using Various Information Sources, .92, and Communicating Judgments, .91. These results replicate Arvey’s (1986) in sug- gesting that job complexity arises in large part from complexity of information- processing demands. They are also consistent with the finding that the validities of the GATB Intelligence Scale in predicting job performance rise (are themselves correlated) with PAQ ratings of the job’s demands for decision making, Y = .37; information processing, .24; and decision making/communication/general re- sponsibility, .20 (Gutenberg et al., 1983).
The 10 factors in Table 6 were then correlated with more molecular job duties and work contexts (which had not been included in the factor analysis) to enhance their interpretation (see Table 7). These more elemental attributes included spe- cific mental, people-related, and physical requirements; the structure, sequenc- ing, and physical context of work performed; its prestige, criticality, and social- emotional demands; general education, training, and experience typically re- quired; and selected demographic characteristics of job incumbents.
Complexity of Dealings with Data and Intelligence Level Required were equal- ly and highly correlated, .84 and .83, with the Overall Mental Difficulty factor. High-level information-processing activities-compiling and combining informa- tion, planning, analyzing, reasoning, decision making, and advising-also corre- lated highly with that factor, .82 to .90; lower level mental processing activities- identifying, coding, transcribing, and remembering-correlated at a lower level, .36 to .68. As might be expected, then, the simpler, less highly g-loaded informa- tion-processing activities were less highly correlated with this g factor among jobs.
Jobs higher on this job complexity and intelligence factor also tend to be more critical to the organization, . 7 1. Other data show, in fact, that variance in perfor- mance levels among workers rises with job complexity. Hunter et al. (1990) found that the ratios of SD in performance to mean performance were 19%, 32%, and 48%, respectively, in low-, medium-, and high-complexity civilian jobs. This means that the same differences in g lead to bigger differences in performance in more complex jobs, because g variance counts more heavily in those jobs.
Dealing With People Tends to Be Complex. The next panel of Table 7 shows that Complexity of Dealings with People is fairly highly correlated, .68, with Overall Mental Difficulty. (It is correlated .48 with Complexity of Dealings With
WHY g MATTERS 107
Data; Gottfredson, 1980.) The other people-related job requirements show how specific activities in dealing with people, like information-processing demands, also vary greatly in complexity. Negotiating, Persuading, and Staff (but not Line) Functions are all highly correlated, .79, with overall job complexity. Correlations are somewhat lower, .59 to .68, for Extent of Personal Contact, Instructing, and Public Speaking, perhaps because they each encompass activities that themselves may range greatly in complexity. Supervising Nonemployees (such as children) is also reasonably complex, . 39 (see Factor 6), as is Influencing Others, .42. Activ- ities dealing with people almost always correlate more highly with the overall cognitive complexity factor than with the specifically people-related Factor 6 (Ca- tering to People), which includes job elements pertaining primarily to entertain- ment and personal service.
Perhaps the most important conclusion to be drawn from these people-related ratings, however, is that dealing with people is always fairly complex. This should not be surprising, because other individuals are among the most complex, novel, changing, active, demanding, and unpredictable objects in our environ- ments, Living and working with others is a complicated business.
Task Configuration A$ects Complexity. The configuration of activities, as the task complexity literature suggests, can also increase job complexity. Task vari- ety, change, ambiguity, and lack of supervision all contribute to complexity. Thus, we find that jobs high on the Overall Mental Difficulty factor tend to be unstructured, .79, and entail much self-direction, .88, and general responsibility, .76. They also tend to involve time pressure, 5.5; variety and change, .41; and attention to detail, .54; and to emphasize creative rather than routine activities, .63. The more highly supervised, - .73, repetitive, - .49 and - .74, or physical, -.48 to -.66, the job, the less cognitively complex it is.
Complexity of Dealings With Things Is a Distinct and Secondary Fac- tor. Complexity of dealings with things and with data are negatively correlated with each other, - .57 (Gottfredson, 1980), but the former is useful in distinguish- ing people-oriented versus things-oriented jobs at similar ranges of overall job complexity. Recall the two industrial job families that Hunter (1986) split off from other jobs of similar cognitive complexity. Hence, we see that Complexity of Dealings With Things defines (and is correlated .77 with) the second factor in Tables 6 and 7, labeled Complex Dealings With Things and Use of Patterns. As Table 6 indicates, jobs high on this factor (architects, physicians, draftsmen, painters, sculptors, pattern and model makers) require high perceptual (spatial, form perception) and psychomotor (finger dexterity and eye-hand coordination) aptitudes. This second factor (which accounts for 11.3% of the variance in the factor analysis) illustrates the point that other aptitudes, mental and physical, are
108 GOTTFREDSON
functionally important in the world of work, but that they tend to be less important than g overall.
High Levels of Education and Training Are Often Necessary But Not Su$i- cient in Highly Complex Jobs. Not surprisingly, jobs high in overall complexity require more education, .86 and .88, training, .76 and .5 1, and experience, .62- and are viewed as the most prestigious, . 82. These correlations have sometimes been cited in support of the training hypothesis discussed earlier, namely, that sufficient training can render differences in g moot.
However, prior training and experience in a job never fully prepare workers for all contingencies. This is especially so for complex jobs, partly because they require workers to continually update job knowledge, .85. As already suggested, complex tasks often involve not only the appropriate application of old knowledge, but also the quick apprehension and use of new information in changing environments.
Education, training, experience, and the job knowledge to which they lead are all important aids in performing jobs well. This fact is aptly captured by discus- sions of the “practical intelligence” and “tacit knowledge” that is gained through experience (Jensen, 1993; Schmidt & Hunter, 1993; Sternberg & Wagner, 1993; Sternberg, Wagner, Williams, & Horvath, 1995). Raw intelligence is not enough, as the path analyses of intelligence, knowledge, and performance discussed ear- lier suggest. However, knowledge is merely a tool that people apply with different degrees of competence to an unending array of new situations-some potentially critical (engine failure in flight, an injured or trapped child, plunging sales, corpo- rate mergers) and others less so (novel questions or complaints from customers, comparison shopping, applying and interviewing for jobs, setting behavioral stan- dards for one’s adolescent children). As discussed earlier, the facility with which individuals accumulate these tools (trainability) and the competence with which they apply them (task proficiency) often depend heavily on g, especially in the absence of close supervision.
Complex Job Duties Have Everyday Analogs Many of the duties that correlate highly with overall job complexity suffuse our lives: advising, planning, negotiating, persuading, supervising others, to name just a few. The job analysis tools used to analyze paid work could readily be adapted to analyze the nature of unpaid roles in life, such as parenting. One might ponder, for example, whether the most important elements of good parenting involve the duties associated with low complexity work such as driver, custodian, nurse’s aide, messenger, and food service worker-or whether they are more like the duties of moderate to high complexity jobs such as teacher, counselor, dis- patcher, police officer, and accountant. (See also Kohn & Schooler’s, 1983, pp. 340-344, analysis of the complexity of cooking, home repair, and other housework.)
WHY g MATTERS 109
COMPLEXITY IN THE NATIONAL ADULT LITERACY SURVEY: AN EXAMPLE OF THE FUNCTIONAL IMPORTANCE OF g
The National Adult Literacy Survey (NALS) of 26,000 persons aged 16 and older (Kirsch, Jungeblut, Jenkins, & Kolstad, 1993) is one in a series of national liter- acy assessments developed by the Educational Testing Service (ETS) for the U.S. Department of Education. It is a direct descendent, both conceptually and meth- odologically, of the National Assessment of Educational Progress (NAEP) studies of reading among school-aged children and literacy among adults aged 21 to 25 (Kirsch & Jungeblut, 1990).
NALS, like its NAEP predecessors, is extremely valuable in understanding the complexity of everyday life and the advantages that higher g provides. In particu- lar, NALS provides estimates of the proportion of adults who are able to perform everyday tasks of different complexity levels. One criterion for including tasks in NALS is precisely that they have prima facie functional importance. Inter- pretability is further enhanced by presenting results on criterion-referenced scales, that is, in terms of the concrete levels of proficiency they represent.
NALS Literacy Scales Are Highly g Loaded The NALS and NAEP literacy assessments are not IQ tests, nor were they in- tended to be. Four kinds of data suggest, however, that NALS is highly correlated with g. First, its design resembles that of an intelligence test in crucial ways: the intent was to measure “complex information-processing skills” that “go beyond simply decoding and comprehending text” by sampling a “broad range” of tasks that cover a variety of “universally relevant contexts and contents” and which can be “arrayed along a continuum” of difficulty (Campbell, Kirsch, & Kolstad, 1992). Accordingly, demands for mere recall and school-based knowledge were minimized. Reports from ETS routinely interpret NALS and NAEP reading scores as measures of higher order thinking skills, reasoning, problem solving, and information processing (e.g., Kirsch, Jungeblut, & Campbell, 1992; Mullis, Owen, & Phillips, 1990; Venezky, Kaestle, & Sum, 1987).
Second, factor analyses support the inference that NALS is highly correlated with verbal intelligence, if not g itself. The three NALS scales (prose, document, and quantitative) correlate over .9 with each other in large national samples, and factor analyses of their items show that they measure primarily a single general factor (Baldwin, Kirsch, Rock, & Yamamoto, 1995; Reder, 1995). This general literacy factor correlates .8 (in highly range-restricted samples, thus reducing the correlation) with the “academic G” factor of the General Educational Develop- ment (GED) exam. “Both assess skills that appear to represent verbal comprehen- sion and reasoning, or the ability to understand, analyze, interpret, and evaluate written information and apply fundamental principles and concepts” (Baldwin et al., 1995, p. xv.).
110 GOTTFREDSON
As will be discussed further, the difficulty of NALS items stems from their complexity, not from their readability per se. Consistent with this, Sticht (1975) found that verbal comprehension test scores were no higher among military re- cruits when the test was administered to them orally rather than in written form.
Third, all tests of verbal ability are highly g loaded, regardless of whether they are oral (individual tests like the WAIS) or written (group tests like the GATB and Wonderlic. For example, the Vocabulary subtest of the WAIS-R is correlated .85 and .81 with WAIS-R Verbal IQ and Full-Scale IQ (Wechsler, 1981, p. 46). WAIS Vocabulary and Verbal IQ are correlated .68 and .85, respectively, with the GATB General Intelligence Scale (U.S. Department of Labor, 1970, pp. 32-34, 247-249). (See also Carroll’s, 1993, chap. 5, three-stratum account of the rela- tions among verbal ability, crystallized intelligence, and g).
Fourth, growth curves (ages 9-23) on the general NAEP reading scale resem- ble IQ growth curves in the general population, which has led some researchers to suggest that the NAEP reading scores represent the nation’s “intelligence” (Ralph, Keller, & Crouse, 1994) or “verbal intelligence” (Carroll, 1987, 1997).
Difficulty Level of NALS Literacy Items Is Determined by Their Complexity Figure 2 shows the NALS prose, document, and quantitative scales. Specific test items are listed for different proficiency levels in order to anchor scores to readily interpreted behavior. (Proficiency here means having an 80% probability of cor- rectly answering items at that level of difficulty.) The individual items are of inherent interest, and I will return to them shortly.
The three literacy scales order items in terms of their difficulty level. The pertinent question is, then, “What makes some NALS items more difficult than others?’ ETS has devoted much effort to answering this question in order to en- hance interpretability of its scales (e.g., Kirsch & Jungeblut, 1990, chap. 3; Kirsch, Jungeblut, & Mosenthal, 1994; Kirsch & Mosenthal, 1990).
ETS analyses clearly reveal that difficulty within each literacy scale relates to the complexity of their items, not their substantive content. Beginning with a complex grammar for analyzing text, Kirsch and Mosenthal (1990) discovered that document difficulty arose primarily from “process complexity.” They then developed three variables to measure such complexity in all three scales: type of match, plausibility of distracters, and type of information (or of calculation, in the case of the quantitative scale). Type of match refers to the literalness of the match between the information requested in the question and the information to be lo- cated in the text; more difficult items require readers to make an inference to perform successfully. Distracting (irrelevant) information enhances difficulty the more similar it is in nature or text location to the correct information. Type of information (in prose and document scales) refers to how abstract versus concrete the information is. Type of calculation (quantitative scale) refers to the number and difficulty of arithmetic operations that readers must discern and perform.
WHY g MATTERS 111
These variables were found to account for 84% to 89% of the variance in task difficulty across the three scales: “The points on the scales at which major shifts in the processes and skills required for successful task performance were remarkably similar” across the three scales (Kirsch, Jungeblut, & Mosenthal, 1994, p. 33). Despite large differences in manifest content, task difficulty in all three scales was rooted in the same “process complexity.” In addition, a traditional measure of readability did not increase explained variance. Thus, complexity clearly lies in the information-processing demands of the tasks to be performed, not in the diffi- culty of the words and sentences describing the task to be performed.
Such findings are consistent with the literature on task complexity noted ear- lier, as well as with analyses of the information-processing demands of a different functional reading test (Kirsch & Guthrie, 1980). Together, they support the infer- ence that the NALS literacy scales measure primarily g.
NALS Items Represent Practical, Everyday Skills A look at the items in Figure 2 reveals their general relevance to social life. These are not obscure skills or bits of knowledge whose value is limited to academic pursuits. They are skills needed to carry out routine transactions with banks, social welfare agencies, restaurants, the post office, and credit card agencies; to understand contrasting views on public issues (fuel efficiency, parental involve- ment in schools); and to comprehend the events of the day (sports stories, trends in oil exports) and one’s personal options (welfare benefits, discount for early payment of bills, relative merits between two credit cards).
Table 8 shows the percentages of White adults who are proficient at each of the five levels on the three NALS scales. Generally about 4% reach the highest level. Level 5 (376-500) signals an 80% probability, for example, of being able to summarize two ways that lawyers challenge prospective jurors (based on a pas- sage discussing such practices) and to use a calculator to determine the total cost of carpet to cover a room (see Figure 2). Roughly another 20% of White adults reach Level 4 (326-375), where individuals can perform such tasks as restating an argument made in a lengthy news article and calculating the money needed to raise a child based on information stated in a news article.
A total of about one third of White adults reach Level 3 (276-325), but no higher, which includes capabilities for writing a brief letter explaining an error in a credit card bill and using a flight schedule to plan travel arrangements. Level 2 proficiency (226-275) includes locating an intersection on a street map, entering background information on an application for a social security card, and deter- mining the price difference between two show tickets. This level is reached but not exceeded by about 25% of Whites. Finally, one out of seven White adults functions routinely no higher than Level 1 (less than 225), which is limited to 80% proficiency in skills like locating an expiration date on a driver’s license and totaling a bank deposit. Individuals at Level 1 or 2 “are not likely to be able to perform the range of complex literacy tasks that the National Education Goals
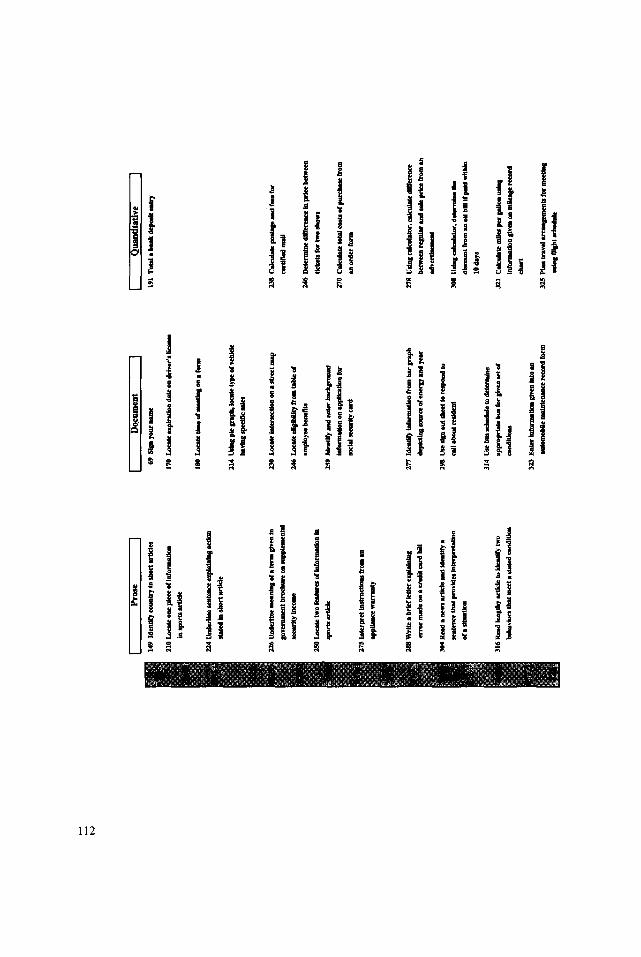
I R
ose
I
226”
ndul
hem
mnb
lgor
.krm
gl”~
bl
go”-
1 bm
cbur
e on
sup
pkm
entd
aeau
ltJ-
230
-k-d
r-r
c?m
rkdm
ao
270
Ca
lad
akt
okJ
ma
kdp
hvm
M0r
derk
.m
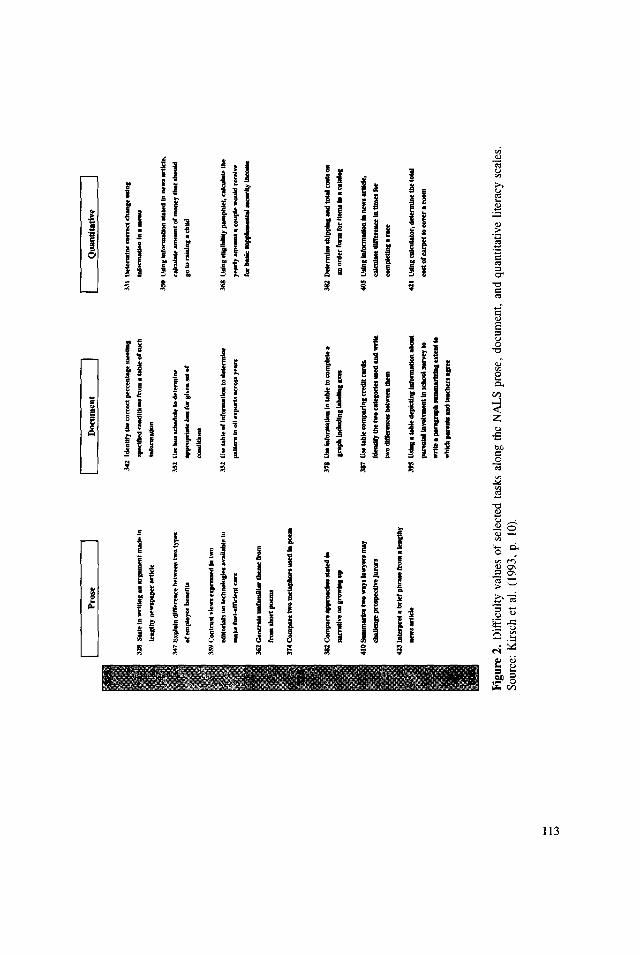
Figu
re
2.
Dif
ficu
lty
valu
es
of s
elec
ted
task
s al
ong
the
NA
LS
pros
e,
docu
men
t, an
d qu
antit
ativ
e lit
erac
y sc
ales
. So
urce
: K
irsc
h et
al.
(199
3,
p.
10).
w
114 GOTTFREDSON
Panel considers important for competing successfully in a global economy and exercising fully the rights and responsibilities of citizenship” (Baldwin et al., 1995, p. 16).
To avoid confusion, it should be noted that no one item on the NALS, or any other mental test, is by itself a good measure of any ability. As is well known in psychometrics (see also Gordon, 1997), the fact that an individual passes or fails any single test item says little about that person’s general intelligence level. What is crucial is the level of proficiency at which a person routinely functions on a wide variety of tasks. The point here is, thus, not that some people cannot do particular things like finding an intersection on a map (which presumably could be taught to most of them), but that some individuals routinely fail a high proportion of tasks at that complexity level (which is a much more difficult problem to reme- diate).
NALS Scales Measure General Information-Processing Capability As just implied, although the NALS items represent skills that are valuable in themselves, they are merely samples from broad domains of such skill. As al- ready suggested, scores on the NALS reflect people’s more general ability (the latent trait) to master on a routine basis skills of different information-processing complexity: “Careful analysis of the range of tasks along each scale provides clear evidence of an ordered set of information-processing skills and strategies” (Kirsch et al., 1993, p. 9). It is therefore informative to describe the general information- processing capabilities represented by each of the five NALS proficiency levels.
Level 1 proficiency is characterized by identifying or matching single pieces of information or performing a single, simple, specified arithmetic operation (like addition) in contexts where there is little or no distracting information (e.g., see Kirsch et al., 1993, p. 11). As Table 8 indicates, about 14% of White adults seem unable to function routinely at a higher level than this.
Level 2 tasks introduce distracters, more varied information, and the need for low-level inferences or to integrate two or more pieces of information. Informa- tion tends to be easily identifiable, despite the presence of distracters, and numer- ic operations are easily determined from the format of the material provided (say, an order form). About two in five White adults function routinely no higher than this level.
At Level 3 individuals are able to integrate multiple pieces of information from one or more documents, which themselves may be complex and contain much irrelevant information. However, the matches to be made between information and text tend to be literal or synonymous, and correct information is not located near incorrect information. Less than 60% of White adults reach or exceed this level of routine functioning. It takes the average person 14 years (from age 9 to 23) to progress from just above Level 1 to just above Level 3 (Carroll, 1987).
Multiple-feature matches, integration and synthesis of information from com- plex passages or documents, and use of multiple sequential operations are charac-
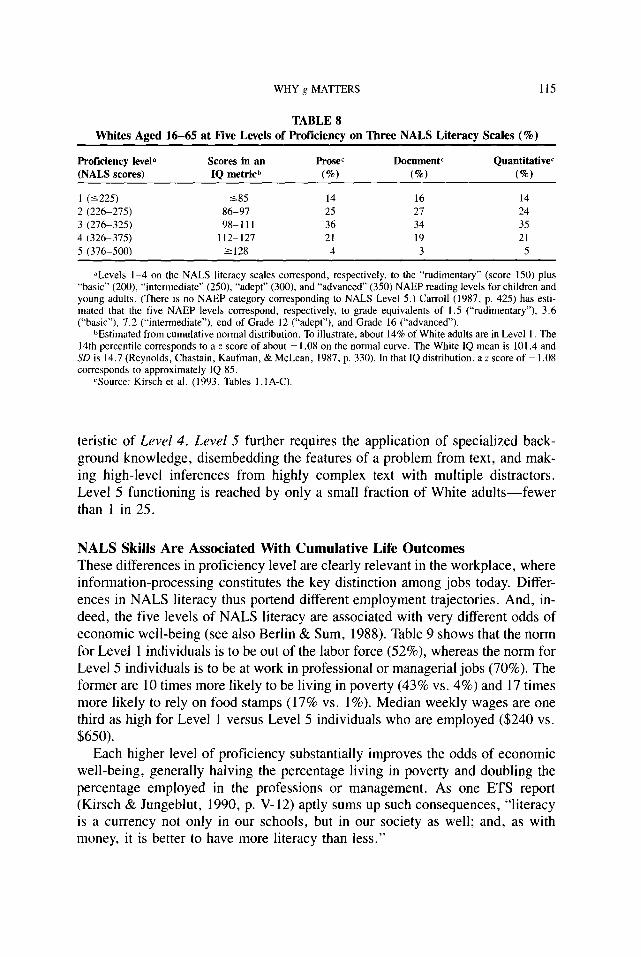
WHY ,g MATTERS 115
TABLE 8 Whites Aged 16-65 at Eive Levels of Proficiency on Three NALS Literacy Scales (%)
Proficiency levela Scores in an (NALS scores) IQ metricb
Prosec
(%)
Documentc
(Q/o)
Quantitativec
(a)
1 (5225) 585 14 16 14
2 (226-275) 86-97 25 27 24
3 (276-325) 98-111 36 34 35
4 (326-375) 112-127 21 19 21
5 (376-500) 2128 4 3 5
aLevels l-4 on the NALS literacy scales correspond, respectively, to the “rudimentary” (score 150) plus “basic” (200) “intermediate” (250), “adept” (300). and “advanced” (350) NAEP reading levels for children and young adults. (There is no NAEP category corresponding to NALS Level 5.) Carroll (1987, p, 425) has esti- mated that the five NAEP levels correspond, respectively, to grade equivalents of 1.5 (“rudimentary”), 3.6 (“basic”), 7.2 (“intermediate”), end of Grade 12 (“adept”), and Grade 16 (“advanced”).
bEstimated from cumulative normal distribution. To illustrate. about 14% of White adults are in Level 1. The 14th percentile corresponds to a z score of about - 1.08 on the normal curve. The White IQ mean is 101.4 and SD is 14.7 (Reynolds, Chastain, Kaufman, & McLean, 1987, p. 330). In that IQ distribution, a z score of - 1.08 corresponds to approximately IQ 85.
cSource: Kirsch et al. (1993. Tables l.IA-C).
teristic of Level 4. Level 5 further requires the application of specialized back- ground knowledge, disembedding the features of a problem from text, and mak- ing high-level inferences from highly complex text with multiple distracters. Level 5 functioning is reached by only a small fraction of White adults-fewer than 1 in 25.
NALS Skills Are Associated With Cumulative Life Outcomes These differences in proficiency level are clearly relevant in the workplace, where information-processing constitutes the key distinction among jobs today. Differ- ences in NALS literacy thus portend different employment trajectories. And, in- deed, the five levels of NALS literacy are associated with very different odds of economic well-being (see also Berlin & Sum, 1988). Table 9 shows that the norm for Level 1 individuals is to be out of the labor force (52%), whereas the norm for Level 5 individuals is to be at work in professional or managerial jobs (70%). The former are 10 times more likely to be living in poverty (43% vs. 4%) and 17 times more likely to rely on food stamps (17% vs. 1%). Median weekly wages are one third as high for Level 1 versus Level 5 individuals who are employed ($240 vs. $650).
Each higher level of proficiency substantially improves the odds of economic well-being, generally halving the percentage living in poverty and doubling the percentage employed in the professions or management. As one ETS report (Kirsch & Jungeblut, 1990, p. V-12) aptly sums up such consequences, “literacy is a currency not only in our schools, but in our society as well; and, as with money, it is better to have more literacy than less.”
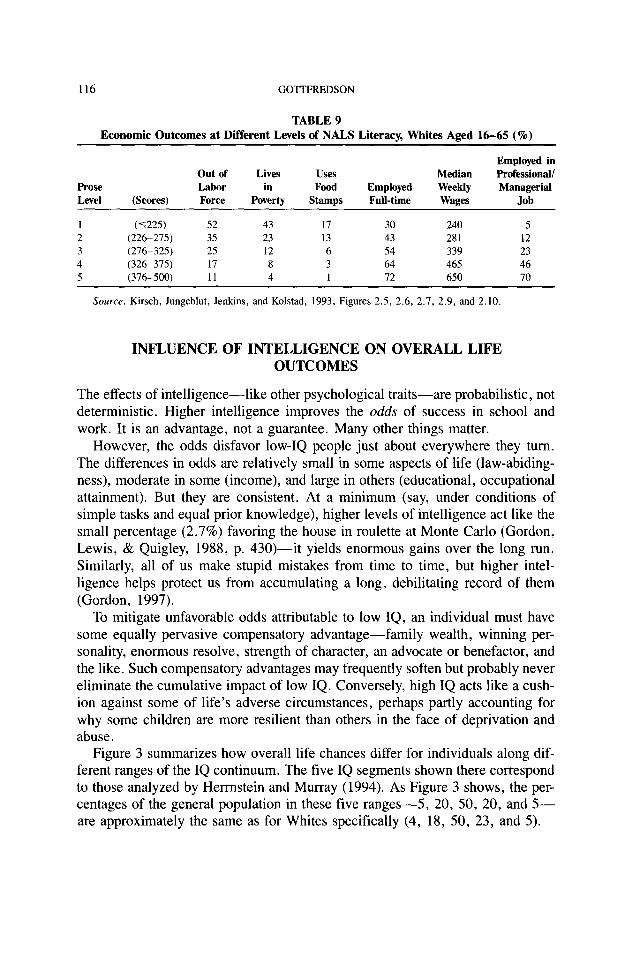
116 GO’ITFREDSON
TABLE 9 Economic Outcomes at Different Levels of NALS Literacy, Whites Aged 16-65 (%)
pro.%
Level
1 2 3 4 5
(Scores)
(~225) (226-275) (276-325) (326-375) (376-500)
out of Lives Uses Labor in Food Force Poverty Stamps
52 43 17 35 23 13 25 12 6 17 8 3 11 4 1
Employed Full-time
30 43 54 64 72
Median Weekly Wages
240 281 339 465 650
Employed in Professional/ Managerial
Job
5 12 23 46 70
Source. Kirsch, Jungeblut, Jenkins, and Kolstad, 1993, Figures 2.5, 2.6, 2.7, 2.9, and 2.10.
INFLUENCE OF INTELLIGENCE ON OVERALL LIFE OUTCOMES
The effects of intelligence-like other psychological traits-are probabilistic, not deterministic. Higher intelligence improves the odds of success in school and work. It is an advantage, not a guarantee. Many other things matter.
However, the odds disfavor low-IQ people just about everywhere they turn. The differences in odds are relatively small in some aspects of life (law-abiding- ness), moderate in some (income), and large in others (educational, occupational attainment). But they are consistent. At a minimum (say, under conditions of simple tasks and equal prior knowledge), higher levels of intelligence act like the small percentage (2.7%) favoring the house in roulette at Monte Carlo (Gordon, Lewis, & Quigley, 1988, p. 430)-it yields enormous gains over the long run. Similarly, all of us make stupid mistakes from time to time, but higher intel- ligence helps protect us from accumulating a long, debilitating record of them (Gordon, 1997).
To mitigate unfavorable odds attributable to low IQ, an individual must have some equally pervasive compensatory advantage-family wealth, winning per- sonality, enormous resolve, strength of character, an advocate or benefactor, and the like. Such compensatory advantages may frequently soften but probably never eliminate the cumulative impact of low IQ. Conversely, high IQ acts like a cush- ion against some of life’s adverse circumstances, perhaps partly accounting for why some children are more resilient than others in the face of deprivation and abuse.
Figure 3 summarizes how overall life chances differ for individuals along dif- ferent ranges of the IQ continuum. The five IQ segments shown there correspond to those analyzed by Herrnstein and Murray (1994). As Figure 3 shows, the per- centages of the general population in these five ranges-5, 20, 50, 20, and 5-- are approximately the same as for Whites specifically (4, 18, 50, 23, and 5).
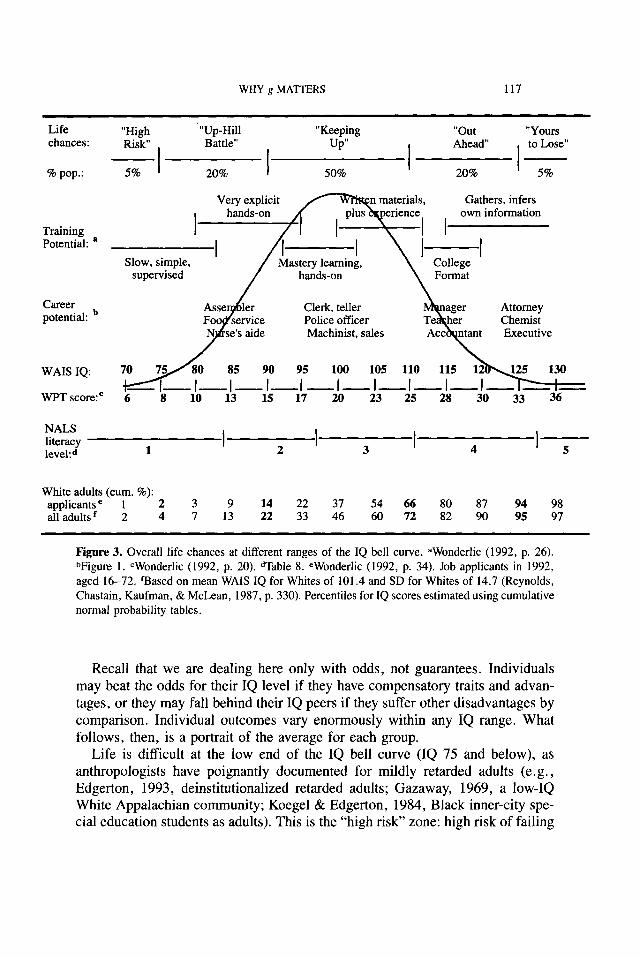
WHY g MATTERS 117
Life chances:
% pop.:
“High ‘“Up-Hill “Keeping “Out “Yours Risk” Battle” Up”
5% I 20% I 50% I
Ahead”
20% I
to Lose”
5%
Gathers, infers own information
Career
Police officer Machinist, sales
WPT score:’ 6
NALS literacy 1evel:d 1 I 2 ’ 3 1 4 15
White adults (cum. %): applicants e 1 2 3 9 14 22 37 54 66 80 87 94 98 all adults r 2 4 7 13 22 33 46 60 72 82 90 95 97
Figure 3. Overall life chances at different ranges of the IQ bell curve. aWonderlic (1992, p. 26). bFigure 1. =Wonderlic (1992, p. 20). dTable 8. eWonderlic (1992, p. 34). Job applicants in 1992, aged 16-72. ‘Based on mean WAIS IQ for Whites of 101.4 and SD for Whites of 14.7 (Reynolds, Chastain, Kaufman, & McLean, 1987, p. 330). Percentiles for IQ scores estimated using cumulative normal probability tables.
Recall that we are dealing here only with odds, not guarantees. Individuals may beat the odds for their IQ level if they have compensatory traits and advan- tages, or they may fall behind their IQ peers if they suffer other disadvantages by comparison. Individual outcomes vary enormously within any IQ range. What follows, then, is a portrait of the average for each group.
Life is difficult at the low end of the IQ bell curve (IQ 75 and below), as anthropologists have poignantly documented for mildly retarded adults (e.g., Edgerton, 1993, deinstitutionalized retarded adults; Gazaway, 1969, a low-IQ White Appalachian community; Koegel & Edgerton, 1984, Black inner-city spe- cial education students as adults). This is the “high risk” zone: high risk of failing
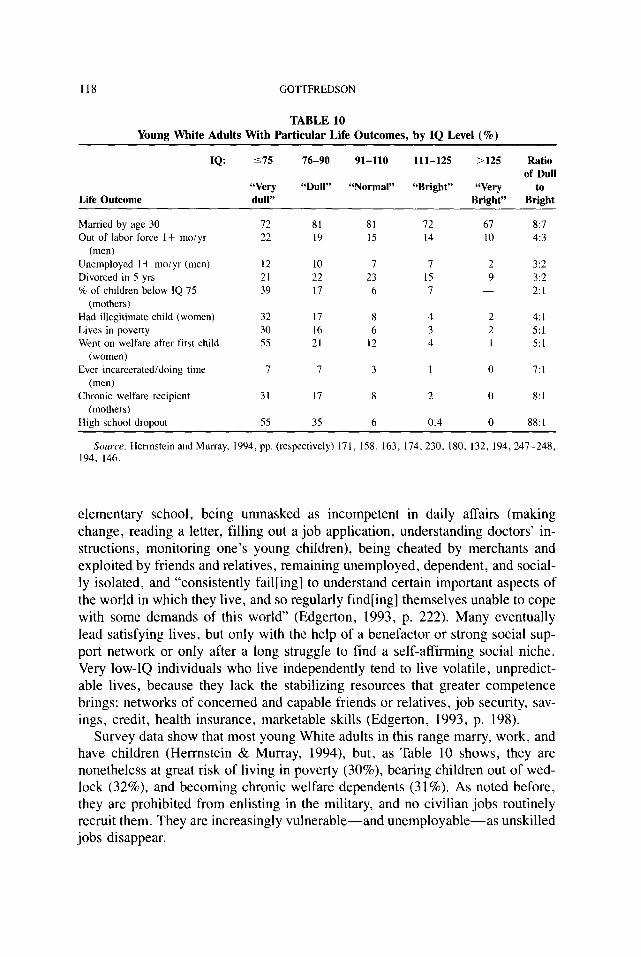
118 GOTTFREDSON
TABLE 10 Young White Adults With Particular Life Outcomes, by IQ Level (%)
Life Outcome
IQ: 575
“Very dull”
76-90 91-110 111-125 >125 Ratio
of Dull “DUII” “Normal” “Bright” “Very to
Bright” Bright
Married by age 30 72 81 81 72 67 8:7
Out of labor force 1 + mo/yr 22 19 15 14 10 4:3
(men) Unemployed I + moiyr (men) 12 10 7 7 2 312 Divorced in 5 yrs 21 22 23 15 9 3~2
% of children below IQ 75 39 17 6 I 2:l
(mothers)
Had illegitimate child (women)
Lives in poverty
Went on welfare after first child
32 17 8
30 16 6 55 21 12
4
3
4
2 4: I
2 5:l I 5:l
(women)
Ever incarcerated/doing time
(men) Chronic welfare recipient
(mothers)
High school drooout
I 7 3 1 0 7:l
31 17 8 2 0 8:l
55 35 6 0.4 0 88:1
Source. Hermstein and Murray, 1994, pp. (respectively) 171, 158. 163, 174,230, 180, 132, 194,247-248, 194. 146.
elementary school, being unmasked as incompetent in daily affairs (making change, reading a letter, filling out a job application, understanding doctors’ in- structions, monitoring one’s young children), being cheated by merchants and exploited by friends and relatives, remaining unemployed, dependent, and social- ly isolated, and “consistently fail[ing] to understand certain important aspects of the world in which they live, and so regularly find[ing] themselves unable to cope with some demands of this world” (Edger-ton, 1993, p. 222). Many eventually lead satisfying lives, but only with the help of a benefactor or strong social sup- port network or only after a long struggle to find a self-affirming social niche. Very low-IQ individuals who live independently tend to live volatile, unpredict- able lives, because they lack the stabilizing resources that greater competence brings: networks of concerned and capable friends or relatives, job security, sav- ings, credit, health insurance, marketable skills (Edgerton, 1993, p. 198).
Survey data show that most young White adults in this range marry, work, and have children (Hermstein & Murray, 1994), but, as Table 10 shows, they are nonetheless at great risk of living in poverty (30%), bearing children out of wed- lock (32%), and becoming chronic welfare dependents (31%). As noted before, they are prohibited from enlisting in the military, and no civilian jobs routinely recruit them. They are increasingly vulnerable-and unemployable-as unskilled jobs disappear.
WHY g MATTERS 119
Fortunately, because of regression to the mean, their children will tend to be brighter than they are, but 4 in 10 still have IQs below 75 (Table 10). Thus, although these adults’ child-rearing capabilities are surely below average, their parenting challenges tend to be greater. As a group, these are highly vulnerable individuals and families, especially in each other’s company.
Life is easier and more stable, but still an “uphill battle” for the next 20% of the bell curve (IQ 76-90). More training and job opportunities are within reach cog- nitively, but they tend to be the least desirable and least remunerative: production workers, welders, machine operators, custodians, and food service workers. The work is atypically dangerous, physically difficult, and/or performed in unpleasant circumstances (Table 7). Individuals at this level tend not to be competitive for higher level work, in part because its training is relatively difficult for them. Over half are what the military used to call marginal men for purposes of military service (below the 16th percentile). At this IQ level, fewer than half the high school graduates and none of the dropouts meet the military’s minimum AFQT enlistment standards. As seen in Table 10, rates of poverty (16%) and social pathology among young White adults at this IQ level are still substantial (35% drop out of school; 17% of mothers are chronic welfare recipients), which sug- gests that socioeconomic progress and stability remain tenuous for adults of be- low-average intelligence.
The middle 50% of the bell curve (IQ 91-1 IO)-the average person-is readi- ly trained for the bulk of jobs in society: clerks and secretaries, skilled trades and protective service workers, dispatchers, insurance sales representatives, and other midlevel work. All high school graduates and most of the dropouts in this range meet the military’s minimum mental ability enlistment standards. Life is more secure and rates of poverty and pathology are much lower than for individuals in the “battling uphill” range (IQ 76-90): as seen in Table 10 for young White adults, dropout rates are, by comparison with that lower IQ group, cut by 6 (from 35% to 6%) and poverty, illegitimacy, and chronic welfare dependence all fall by half (from about 16%-17% to 6%-8%).
The rates of distress for this middle-IQ group are still at least several multiples higher, however, than those for the next higher IQ range (IQ 11 l- 125): two times higher for poverty and illegitimacy, three to four times higher for welfare depen- dence and incarceration, and 15 times higher for dropping out of high school. Individuals in this vast middle range of the population function at either NALS literacy Levels 2 (the NAEP “intermediate” level) or 3 (NAEP “adept” level). Carroll (1987) has estimated that reading materials at these two levels include simple popular magazines (“intermediate”) and most newspaper stories and popu- lar novels (“adept”).
The next higher 20% of the IQ distribution (IQ 11 l-125, or the 75th-95th percentiles) is “out ahead” as far as life chances go. Most occupations are within reach cognitively, because these individuals learn complex material fairly easily and independently. Their odds are quite good for being able to enter graduate or
120 GOTTFREDSON
professional school and for finding work in management or the professions. None would be barred from even the most selective occupational specialties in the mili- tary on the basis of inadequate g (Eitelberg, 1988, pp. 132-135). Only 2% to 3% of young White adults in this IQ range live in poverty or go on welfare.
As shown in the last column of Table 10, it is far better to be somewhat above than somewhat below average in IQ (i.e., “bright” or “out ahead” rather than “dull” or “battling uphill”). The degree of advantage differs by the outcome in question. The percentages of “dull” White men who are unemployed (or di- vorced) is not much greater than those for “bright” White men (3:2). However, the percentages diverge increasingly for bearing an illegitimate child (4:1), living in poverty or women going on welfare after the birth of the first child (5:1), men being incarcerated (7:1), mothers becoming a chronic welfare recipient (8:1), or dropping out of high school (88:l). The odds diverge most for the outcomes generally considered most serious.
Individuals in the “out ahead” IQ range read at NALS Level 4 (NAEP “ad- vanced”), which gives them access to reading material such as Time magazine, editorials in newspapers such as the New York Times, articles in Scientific Ameri- can, and novels by Joseph Conrad and Thomas Mann (Carroll, 1987). Even these IQ-advantaged individuals, however, may have trouble with legal documents and tax instructions, because they are written “considerably above the 350 [NAEP “advanced”] point on the Reading Proficiency scale” (Carroll, 1987, p. 425).
For the top 5% of the population (over IQ 125), success is really “yours to lose.” These people meet the minimum intelligence requirements of all occupa- tions, are highly sought after for their extreme trainability, and have a relatively easy time with the normal cognitive demands of life. Their jobs are often high pressure, emotionally draining, and socially demanding (Table 7), but these jobs are prestigious and generally pay well. Although very high IQ individuals share many of the vicissitudes of life, such as divorce, illness, and occasional unem- ployment, they rarely become trapped in poverty or social pathology. They may be saints or sinners, healthy or unhealthy, content or emotionally troubled. They may or may not work hard and apply their talents to get ahead, and some will fail miserably. But their lot in life and their prospects for living comfortably are com- paratively rosy (e. g . , see follow-ups of gifted students, Subotnik & Arnold, 1994).
There are, of course, multiple causes of different social and economic out- comes in life. However, g seems to be at the center of the causal nexus for many. Indeed, g is more important than social class background in predicting whether White adults obtain college degrees, live in poverty, are unemployed, go on wel- fare temporarily, divorce, bear children out of wedlock, and commit crimes (Hermstein & Murray, 1994, chap. 5-11).
There are many other valued human traits besides g (e.g., see Gardner, 1983, on “multiple intelligences”), but none seems to affect individuals’ life chances so systematically and so powerfully in modern life as does g. To the extent that one is
WHY g MA7TERS 121
concerned about inequality in life chances, one must be concerned about differ- ences in g.
THE FUTURE
Complexity enriches social and cultural life, but it also risks leaving some individ- uals behind. Democracies are especially troubled by the social inequalities created by increasing cognitive complexity (Gottfredson, 1996). The bad news is that this challenge is increasing. The good news is that there are more effective approaches to meeting it.
The Increasing Challenge
Trends in Complexity. Society has become more complex-and g loaded-as we have entered the information age and postindustrial economy. Major reports on the U.S. schools, workforce, and economy (e.g., Johnston & Packer, 1987; National Commission on Excellence in Education, 1983) routinely argue, in par- ticular, that the complexity of work is rising.
Where the old industrial economy rewarded mass production of standardized products for large markets, the new postindustrial economy rewards the timely customization and delivery of high-quality, convenient products for increasingly specialized markets. Where the old economy broke work into narrow, routinized, and closely supervised tasks, the new economy increasingly requires workers to work in cross-functional teams, gather information, make decisions, and under- take diverse, changing, and challenging sets of tasks in a fast-changing and dy- namic global market. Accordingly, organizations are “flatter” (have fewer hierarchical levels), and increasing numbers of jobs require high-level cognitive and interpersonal skills (Camevale, 1991; Cascio, 1995; Hunt, 1995; Secretary’s Commission on Achieving Necessary Skills, 1991).
Such reports emphasize that the new workplace puts a premium on higher order thinking, learning, and information-processing skills (see especially Hunt, 1995)-in other words, on intelligence. Gone are the many simple farm and factory jobs where a strong back and willing disposition were sufficient to sustain a respected livelihood, regardless of IQ. Fading too is the need for highly devel- oped perceptual-motor skills, which were once critical for operating and monitor- ing machines, as technology advances (Hunt, 1995, chap. 6).
Daily life also seems to have become considerably more complex (cf. Herm- stein & Murray, 1994, chap. 22). For instance, we now have a largely moneyless economy-checkbooks, credit cards, and charge accounts-that requires more abstract thought, foresight, and complex management. More self-service, wheth- er in banks or hardware stores, throws individuals back onto their own capa- bilities. We struggle today with a truly vast array of continually evolving complexities: the changing welter of social services across diverse, large bureau- cracies; increasing options for health insurance, cable, and phone service; the
122 GOTTFREDSON
steady flow of debate over health hazards in our food and environment; the maze of transportation systems and schedules; the mushrooming array of over-the-coun- ter medicines in the typical drugstore; new technologies (computers) and forms of communication (cyberspace) for home as well as office.
Brighter individuals, families, and communities will be better able to capitalize on the new opportunities this increased complexity brings. The least bright will use them less effectively, if at all, and so fail to reap in comparable measure any benefits they offer. There is evidence that increasing proportions of individuals with below-average IQs are having trouble adapting to our increasingly complex modern life (Granat & Granat, 1978) and that social inequality along IQ lines is increasing (Herrnstein & Murray, 1994).
Trends in Natiomd Intelligence. The trends in national intelligence are un- clear. There is evidence of increases in average intelligence test scores across the developed world, although their source is as yet a matter of speculation. There is also, however, evidence of dysgenic trends in birthrates (see Herrnstein & Mur- ray, 1994, for discussions of both issues).
For our purposes it is sufficient to point out that, whatever the trends, there is widely perceived to be a growing gap between the information-processing skills the nation needs and the skills Americans possess. That is the urgent message of virtually all of the aforementioned education and training reform reports. Those reports trace falling levels of job capability to the disproportionate growth of the “disadvantaged” sectors of U. S . society. They note, quite correctly, that the future of these groups and of the nation as a whole is unsettling unless the growing skills gap can be narrowed.
Perhaps more importantly, it must be recognized that an aggregate rise in intel- ligence, should it exist, does not necessarily imply any equalization of intel- ligence levels in the population. Dispersion in g-the IQ bell curve-is a stable feature of all human societies. Schools and other institutions may widen or narrow those differences somewhat (Jencks et al., 1972), but nothing seems likely ever to eliminate them.
New Directions for Social Policy It is surely true that most students can learn more than they now do. Most have untapped strengths, mental and otherwise. There is much to the lament that U.S. educational standards are low. Higher standards, better instruction, and more in- centives for learning might indeed work wonders in better preparing students for productive work. However, they will not transform slow, concrete learners into fast, abstract thinkers capable of processing large, complex, and ever-shifting bodies of information.
Societies can, however, develop and use their members’ different capabilities in more effective ways. Indeed, a society’s collective welfare requires that it make

WHY g MATTERS 123
good use of its most talented members but also find productive roles for its least talented. Much less is known about accomplishing the latter than the former, but knowledge about the complexity of work reveals new opportunities. To begin with, it suggests that social policy might attend more in the near term to manipu- lating the environmental complexity individuals face than to changing their intel- ligence levels.
Reduce Complexity, Where Feasible and Appropriate. Radically simplifying education, occupations, and social life across the board is obviously neither feasi- ble nor wise. However, audits of complexity might reveal unnecessary complexity in particular settings. The military, for example, lowered the reading levels of its technical manuals when it discovered that these manuals often required reading skills many grades levels above the average recruit (Sticht, 1975). Medical work- ers have likewise become acutely aware that routine instructions and requests are often incomprehensible to low-literacy patients (Williams et al., 1995). Public health education programs might also be scrutinized for the levels of g they effec- tively require of their intended audiences. A sophisticated, subtle AIDS aware- ness campaign, for example, is probably least accessible to the populations who need it most.
Task complexity can be reduced somewhat in particular jobs or for particular workers, for example, by providing closer supervision or assigning the more g-loaded tasks to other jobs or workers. Practiced consistently or on a large scale, such job simplification would eventually lower those jobs’ pay scales. Nonethe- less, it is worth considering how to fashion or retain productive jobs that are simple enough for low-IQ individuals.
Focus on Specific Training, Not Broad Education, When Time and Ability to Learn Are Limited. The key problem with low IQ is not that it necessarily ren- ders people incapable of mastering moderately complex tasks, because there is some evidence that, with extensive time and focused practice, lower IQ individu- als can master tasks normally associated with higher IQ (e.g., Ceci & Liker, 1986, on racetrack handicapping). Rather, the practical problem is that it takes less intelligent individuals longer to master tasks (Carroll, 1997; Jensen, 1989b), especially more complex ones. Learning at a slower rate means that such individ- uals often master far fewer tasks than their brighter compatriots, even when those tasks are not particularly complex.
Optimizing learning among lower IQ individuals therefore requires narrowing the material to be learned to the most essential and then presenting it in the most accessible way. With regard to content, this means emphasizing the basics. With regard to method, this means more concrete, experience-based (less g-dependent) learning that ties in with what individuals already know. As already noted, this is exactly what the military has done in attempting to cope with low-aptitude’ re-
124 GOTTFFCEDSON
cruits. It does not try to turn them into thinkers with highly transferable capa- bilities, but into doers with very particular, highly job-specific skills.
As the military experience also illustrates, however, what is good pedagogy for the low-aptitude learner may be inappropriate for the high-aptitude person. Re- search in educational settings finds that low-g learners require highly structured, detailed, concrete, and “contextualized” instruction that omits no intermediate steps, but that such “complete” instruction is actually dysfunctional for high-g individuals. The latter easily fill gaps in instruction on their own and benefit most from abstract, self-directed, incomplete instruction that allows them to assemble new knowledge and reassemble old knowledge in idiosyncratic ways (Snow & Lohman, 1984).
Enhance Important But Less g-loaded Competencies. A recurring theme in studies of very low-IQ individuals is that their social adaptation is greatly en- hanced by certain personality traits, particularly persistence and a willingness to adhere to their community’s rules and norms. These findings dovetail with recent research in industrial-organizational psychology on the importance of workers’ “organizational citizenship behavior” (OCB; Organ, 1994) and “contextual per- formance” (Cascio, 1995). These are the more discretionary, pro-social job behav- iors that contribute to a group’s or organization’s effectiveness, but which are more constrained by workers’ intent than ability-for example, helping others with heavy workloads and always being punctual. “Altruism” and “conscientious- ness” seem to be the most important, but “courtesy,” “sportsmanship,” and “civic virtue” are other documented OCB factors (Organ, 1994). Supervisors and peers highly value these “will do” as distinct from “can do” attributes of workers.
It is not clear how malleable OCB dispositions are, but they are largely inde- pendent of g. High conscientiousness is no panacea for low IQ, but it does seem to improve absolute and relative functioning and to gamer the individual addition- al social support. Low conscientiousness and low IQ are surely a disastrous com- bination. Individuals with below-average IQs might therefore benefit as much from efforts to enhance their citizenship behavior as their intellectual skills. Such, in fact, may be the major benefit of Head Start.
Differences in intelligence matter. For members of the cognitive elite to main- tain otherwise is like the rich arguing that money does not matter. Differences in g affect the lives of individuals and families. They help shape the social order and limit our ability to reshape it (Gottfredson, 1985, 1986b; Gottfredson & Sharf, 1988).
Much social policy has long been based on the false presumption that there exist no stubborn or consequential differences in mental capability. Worse than merely fruitless, such policy has produced one predictable failure and side effect after another, breeding widespread cynicism and recrimination. Educators rou- tinely overpromise and schools, accordingly, consistently disappoint. Welfare re- formers do not take seriously the possibility that today’s labor market cannot or
WHY g MA’ITERS 125
will not utilize all low-IQ individuals, no matter how motivated they may be. Civil rights advocates resolutely ignore the possibility that a distressingly high proportion of poor Black youth may be more disadvantaged today by low IQ than by racial discrimination, and thus that they will realize few if any benefits (unlike their more able brethren) from ever-more aggressive affirmative action. Virtually everyone is capable of living productive, fulfilling lives in which they contribute to the general welfare of their communities. However, protecting and enhancing that potential requires us to appreciate its greater vulnerability to disruption among lower IQ individuals.
The g-related challenges in fashioning a simultaneously fair, compassionate, and economically competitive society are far greater than we might wish. How- ever, those challenges can be more effectively met if social scientists and policy analysts begin to take their true measure. Taking g seriously is a necessary first step.
Acknowledgment: I wish to thank the following people for their helpful comments: Jan
H. Blits, John B. Carroll, Robert A. Gordon, Lloyd G. Humphreys, Arthur R. Jensen, Eliot Long, David Lubinski, Malcolm J. Ree, Frank L. Schmidt, James C. Sharf, and Julian C. Stanley.
REFERENCES
Ackerman, P.L. (1987). Individual differences in skill learning: An integration of psychometric and information processing perspectives. Psychological Bulletin, 102, 3-27.
Arvey. R.D. (1986). General ability in employment: A discussion. Journal of Vocational Behavior, 29, 415-420.
Baldwin, J., Kirsch, LS., Rock, D., & Yamamoto, K. (1995). The literacy proficiencies of GED exatninees: Results from the GED-NALS comparison study. Washington, DC: American Council on Education and Educational Testing.
Barrick, M.R., & Mount, M.K. (1991). The big five personality dimensions and job performance: A meta-analysis. Personnel Psychology, 44, l-26.
Berlin, G., & Sum, A. (1988). Toward a more perfect union: Basic skills, poorfamilies, and our economic future. New York: Ford Foundation.
Borman, W.C., Hanson, M.A., Oppler, S.H., Pulakos, E.D., & White, L.A. (1993). Role of early supcrvisoty experience in supervisor performance. Journal of Applied Psychology, 78, 443- 449.
Borman, W.C., White, L.A., & Dorsey, D.W. (1995). Effects of ratee task performance and inter- personal factors on supervisor and peer performance ratings. Journal of Applied Psychology, 80, 168-177.
Borman, W.C., White, L.A., Pulakos, E.D., & Oppler, S.H. (1991). Models of supervisory job performance ratings. Journal of Applied Psychology, 76, 863-872.
Boudreau, J.W. (1991). Utility analysis for decisions in human resource management. In M.D. Dunnette & L.M. Hough (Eds.), Handbook of industrial and organizational psychology (Vol. 2). Palo Alto: Consulting Psychologists Press.
Campbell, D.J. (1988). Task complexity: A review and analysis. Academy of Management Review, 13, 40-52.
126 GOTTFREDSON
Campbell, A., Kirsch, I.S., & Kolstad, A. (1992). Assessing literacy: Theframeworkfor the Na- tional Adult Literacy Survey. Washington, DC: U.S. Department of Education and Education- al Testing Service.
Camevale, A.P. (1991). America and the new economy. Washington, DC: American Society for Training and Development & U.S. Department of Labor, Employment and Training Adminis- tration.
Carroll, J.B. (1987, February). The national assessments in reading: Are we misreading the find- ings? Phi Delta Kappan, 424-430.
Carroll, J.B. (1993). Human cognitive abilities: A survey of factor-analytic studies. New York: Cambridge University Press.
Carroll, J.B. (1997). Psychometrics, intelligence, and public perception. Intelligence, 24(l), 25-52. Cascio, W.F. (1995). Whither industrial and organizational psychology in a changing world of
work? American Psychologist, 50, 928-939. Ceci, S.J., & Liker, J.K. (1986). A day at the races: A study of IQ, expertise, and cognitive
complexity. Journal of Experimental Psychology: General, 115, 255-266. Crawford, M.P. (1962). Concepts of training. In R.M. Gagne (Ed.), Psychological principles in
system development. New York: Holt, Rinehart, & Winston. Edgerton, R.B. (1993). The cloak of competence: Revised and updated. Berkeley: University of
California Press. Eitelberg, M.J. (1988). Manpowerfor military occupations. Alexandria, VA: Office of the Assistant
Secretary of Defense, Force Management and Personnel. Gardner, H. (1983). Frames of mind: The theory of multiple intelligences. New York: Basic Books. Gazaway, R. (1969). The longest mile. New York: Doubleday. Gordon, R.A. (1986). Scientific justification and the race-IQ delinquency model. In T.F. Hartnagel
& R.A. Siverman (Eds.), Critique and explanation: Essays in honor of Gwynne Nettler. New Brunswick, NJ: Transaction Books.
Gordon, R.A. (1997). Everyday life as an intelligence test: Effects of intelligence and intelligence context. Intelligence, 24(l), 203-320.
Gordon, R.A., Lewis, M.A., & Quigley, A.M. (1988). Can we count on muddling through the g crisis in employment? Journal of Vocational Behavior, 33, 424-451.
Gottfredson, L.S. (1980). Construct validity of Holland’s occupational typology in terms of pres- tige, census, Department of Labor, and other classification systems. Journal ofApplied Psy- chology, 65, 697-7 14.
Gottfredson, L.S. (1984). The role of intelligence and education in the division of labor. (Report No. 355). Baltimore: Johns Hopkins University, Center for Social Organization of Schools.
Gottfredson, L.S. (1985). Education as a valid but fallible signal of worker quality: Reorienting an old debate about the functional basis of the occupational hierarchy. In A.C. Kerckhoff (Ed.), Research in sociology of education and socialization (Vol. 5). Greenwich: JAI Press.
Gottfredson, L.S. (1986a). Occupational Aptitude Patterns (OAP) Map: Development and implica- tions for a theory of job aptitude requirements (Monograph). Journal of Vocational Behavior, 29, 254-291.
Gottfredson, L.S. (Ed.). (1986b). The g factor in employment [Special issue]. Journal of Vocational
Behavior, 29(3). Gottfredson, L.S. (1996, Winter). What do we know about intelligence? American Scholar, 15-30. Gottfredson, L.S., Finucci, J.M., & Childs, B. (1984). Explaining the adult careers of dyslexic
boys: Variations in critical skills for high-level jobs. Journal of Vocational Behavior, 24, 355-373.
Gottfredson, L.S., & Sharf, J.C. (Eds.). (1988). Fairness in employment testing [Special issue]. Journal of Vocational Behavior, 33(3).

WHY g MA’l-l-ERS 127
Gould, S.J. (1994, November 28). Curveball [Review of The bell curve: Intelligence and class
structure in American life]. New Yorker, 139- 149. Granat, K., & Granat, S. (1978). Adjustment of intellectually below-average men not identified as
mentally retarded. Scandinavian Journal of Psychology, 19, 41-51.
Gutenberg, R.L., Arvey, R.D., Osbum. H.G., & Jeanneret, P.R. (1983). Moderating effects of decision-making/information-processing job dimensions on test validities. Journal of Applied
P.sychology, 68, 602-608.
Hartigan, J.A., & Wigdor, A.K. (Eds.). (1989). Fairness in employment testing: Validity general-
ization, minority issues, and the General Aptitude Test Battery. Washington, DC: National Academy Press.
Harvey, R.J. (1991). Job analysis. In M.C. Dunnette & L.M. Hough (Eds.), Handbook of industrial
and organizational psychology (Vol. 2). Palo Alto: Consulting Psychologists Press. Herrnstein, R. J., & Murray, C. (1994). The bell curve: Intelligence and class structure in American
life. New York: Free Press. Hogan, J.C. (1991). Physical abilities. In M.C. Dunnette & L.M. Hough (Eds.), Handbook of
industrial and organizational psychology (Vol. 2). Palo Alto: Consulting Psychologists Press. Hogan, R.T. (1991). Personality and personality measurement. In M.C. Dunnette & L.M. Hough
(Eds.), Handbook of industrial and organizational psychology (Vol. 2). Palo Alto: Consulting Psychologists Press.
Hunt, E. (1995). Will we be smart enough? A cognitive analysis of the coming workforce. New
York: Russell Sage Foundation. Hunter, J.E. (1983). Overview of validity generalization for the U.S. Employment Service. (USES
Test Research Report No. 43). Washington, DC: U.S. Department of Labor, Employment and Training Administration.
Hunter, J.E. (1986). Cognitive ability, cognitive aptitudes, job knowledge, and job performance. Journal of Vocational Behavior, 29, 340-362.
Hunter, J.E., & Hunter, R.F. (1984). Validity and utility of alternative predictors of job perfor- mance. Psychological Bulletin, 96, 72-98.
Hunter, J.E., Schmidt, F.L., & Judiesch, M.K. (1990). Individual differences in output variability as a function of job complexity. Journal of Applied Psychology, 7.5, 28-42.
Jencks, C., Smith, M., Acland, H., Bane, M.J., Cohen, D., Gintis, H., Heyns, B., & Michelson, S. (1972). Inequality: A reassessment of the effect offamily and schooling in America. New
York: Harper. Jensen, A.R. (1980). Bias in mental testing. New York: Free Press.
Jensen, A.R. (1981). Straight talk about mental tests. New York: Free Press. Jensen, A.R. (1989a). Raising IQ without increasing g? A review of The Milwaukee project: Pre-
venting mental retardation in children at risk. Developmental Review, 9, 234-258.
Jensen, A.R. (1989b). The relationship between learning and intelligence. Learning and Individual
Differences, I, 37-62.
Jensen, A.R. (1993). Test validity: g versus “tacit knowledge.” Current Directions in Psychological
Science, 2, 9-10.
Jensen, A.R., & Figueroa, R.A. (1975). Forward and backward digit-span interaction with race and IQ: Predictions from Jensen’s theory. Journal of Educational Psychology, 67, 882-893.
Johnston, W.B., & Packer, A.H. (1987). Workforce 2000: Work and workers for the 21st century.
Indianapolis: Hudson Institute. Kirsch, I.S., & Guthrie, J.T. (1980). Construct validity of functional reading tests. Journal of
Educational Measurement, 17, 8 l-93.
Kirsch, I.S., & Jungeblut, A. (Eds.). (1990). Literacy: Profiles of America’s young adults. Prince- ton: Educational Testing Service.
128 GOTTFREDSON
Kirsch, IS., Jungeblut, A., & Campbell, A. (1992). Beyond the school doors: The literacy needs of job seekers served by the U.S. Department of Labor. Princeton: Educational Testing Service.
Kirsch, IS., Jungeblut, A., Jenkins, L., & Kolstad, A, (1993). Adult literacy in America: Ajirst look at the results of the National Adult Literacy Survey. Princeton: Educational Testing Service.
Kirsch, IS., Jungeblut, A., & Mosenthal, P.B. (1994). Moving towards the measurement of adult literacy. Paper presented at the March NCES meeting, Washington, DC.
Kirsch, I.S., & Mosenthal, P.B. (1990). Exploring document literacy: Variables underlying the performance of young adults. Reading Research Quarterly, 25, S-30.
Koegel, P., & Edgerton, R.B. (1984). Black “six hour retarded children” as young adults. In R.B. Edgerton (Ed.), Lives in process: Mildly retarded adults in a large city. Washington, DC: AmMcan Association on Mental Deficiency.
Kohn, M.L., & Schooler, C.S. (1983). Work and personality: An inquiry into the impact of social stratification. Norwood, NJ: Ablex.
Landy, F.J., Shankster, L.J., & Kohler, S.S. (1994). Personnel selection and placement. Annual Review of Psychology, 45, 261-296.
Laurence, J.H., & Ramsberger, P.F. (1991). Low-aptitude men in the military: Who profits, who pays? New York: Praeger.
Lubinski, D., & Dawis, R.V. (1992). Aptitudes, skills, and proficiencies. In M.D. Dunnette & L.M. Hough (Eds.), Handbook of industrial and organizational psychology (Vol. 3). Palo Alto: Consulting Psychologists Press.
Lubinski, D., & Humphreys, L.C. (1997). Incorporating general intelligence into epidemiology and the social sciences. Intelligence, 24, 159-201.
‘Matarazzo, J.D. (1972). Wechsler’s Measurement and appraisal of adult intelligence (5th ed.). Baltimore: Williams & Wilkins.
McDaniel, M.A., Schmidt, F.L., & Hunter, J.E. (1988). Job experience correlates of job perfor- mance. Journal of Applied Psychology, 73, 327-330.
McHenry, J.J., Hough, L.M., Toquam, J.L., Hanson, M.A., & Ashworth, S. (1990). Project A validity results: The relationship between predictor and criterion domains. Personnel Psy- chology, 43, 335-354.
Mecham, R.C., McCormick, E.J., & Jeanneret, P.R. (1977). Position Analysis Questionnaire job analysis manual (System II). West Lafayette, IN: University Book Store.
Miller, A.R., Treiman, D.J., Cain, P.S., & Roos, P.A. (Eds.). (1980). Work, jobs, and occupa- tions: A critical review of the Dictionary of Occupational Titles. Washington, DC: National Academy Press.
Moffitt, T.E., Caspi, A., Harkness, A.R., & Silva, P.A. (1993). The natural history of change in intellectual performance: Who changes? How much? Is it meaningful? Journal of Child Psy- chology and Psychiatry, 34, 455-506.
Mullis, I.N.S., Owen, E.H., & Phillips, G.W. (1990). America’s challenge:Accelerating academic achievement: A summary offindings from 20 years of NAEP. (ETS Report No. 19-OV-01.) Princeton: Educational Testing Service and U.S. Department of Education.
National Commission on Excellence in Education. (1983). A nation at risk: The imperative for educational reform. Washington, DC: U.S. Department of Education.
Organ, D.W. (1994). Organizational citizenship behavior and the good soldier. In M.G. Rumsey, C.B. Walker, & J.H. Harris (Eds.), Personnel selection and classification. Hillsdale, NJ: Erlbaum.
Plomin, R., & Petrill, S. (1997). Genetics and intelligence: What’s new? Intelligence, 24(l), 53-77. Ralph, J., Keller, D., & Crouse, J. (1994). How effective are American schools? Phi Delta Kappan,
76, 144-150.
WHY g MATTERS 129
Reder, S . ( 1995). What does NALS measure? Issues of dimensionality and construct validity. Tech- nical report. Portland: Portland State University, National Center on Adult Literacy.
Ree, M.J., Carretta, T.R., & Teachout, MS. (1995). Role of ability and prior job knowledge in complex training performance. Journal of Applied Psychology, 80, 721-730.
Ree, M.J., Earles, J.A., & Teachout, M.S. (1994). Predicting job performance: Not much more than g. Journal of Applied Psychology, 79, 518-524.
Reynolds, C.R., Chastain, R.L., Kaufman, A.S., & McLean, J.E. (1987). Demographic charac- teristics and IQ among adults: Analysis of the WAIS-R standardization sample as a function of the stratification variables. Journal of School Psychology, 25, 323-342.
Rowe, D. (1997). A place at the policy table? Behavior genetics and estimates of family environ- mental effects on IQ. Intelligence, 24, 133-158.
Sackett, P.R., & Ostgaard, D.J. (1994). Job-specific applicant pools and national norms for cogni- tive ability tests: Implications for range restriction corrections in validation research. Journal of Applied Psychology, 79, 680-684.
Schmidt, F.L., & Hunter, J.E. (1993). Tacit knowledge, practical intelligence, general mental abili- ty, and job knowledge. Current Directions in Psychological Science, 2, 8-9.
Schmidt, F.L., Hunter, J.E., & Outerbridge, A.N. (1986). The impact of job experience and ability on job knowledge, work sample performance, and supervisory ratings of job performance. Journal of Applied Psychology, 71, 432-439.
Schmidt, F.L., Hunter, J.E., Outerbridge, A.N., & Goff, S. (1988). Joint relation of experience and ability with job performance: Test of three hypotheses. Journal of Applied Psychology, 73, 46-57.
Schmidt, F.L., Ones, D.S., & Hunter, J.E. (1992). Personnel selection. Annual Review ofPsycholo- gy, 43, 627-670.
Schooler, C. (1984). Psychological effects of complex environments during the life span: A review and theory. Intelligence, 8, 259-28 1.
Secretary’s Commission on Achieving Necessary Skills. (1991). What work requires of schools: A SCANS report for America 2000. Washington, DC: U.S. Department of Labor.
Sharf, J.C. (1988). Litigating personnel measurement policy. Journal of Vocational Behavior, 33, 235-27 1.
Snow, R.E., & Lohman, D.F. (1984). Toward a theory of cognitive aptitude for learning from instruction. Journal of Educational Psychology, 76, 347-376.
Snyderman, M., & Rothman, S. (1988). The IQ controversy, the media and public policy. New Brunswick, NJ: Transaction Books.
Spearman, C. (1923). The nature of “intelligence” and the principles of cognition. London: Macmillan. Spitz, H.H. (1986). The raising of intelligence: A selected history of attempts to raise retarded
intelligence. Hillsdale, NJ: Erlbaum. Stemberg, R.J., & Wagner, R.K. (1993). The g-acentric view of intelligence and job performance is
wrong. Current Directions in Psychological Science, 2, l-5. Stemberg, R.J., Wagner, R.K., Williams, W.M., & Horvath, J.A. (1995). Testing common sense.
American Psychologist, 50, 912-926. Sticht, T. (Ed.). (1975). Reading for working: A functional literacy anthology. Alexandria, VA:
Human Resources Research Organization. Sticht, T.G., Armstrong, W.B., Hickey, D.T., & Caylor, J.S. (1987). Cast-o$youthc Policy and
training methods from the military experience. New York: Praeger. Stokes, G.S., Mumford, M.D., & Owens, W.A. (Eds.). (1994). Biodata handbook: Theory, re-
search, and use of biographical information in selection and performance prediction. Palo Alto: CPP Books.
130 GOTTFREDSON
Subotnik, R.F., & Arnold, K.D. (Eds.). (1994). Beyond Terman: Contemporary longitudinal stud- ies of gtftedness and talent. Norwood: NJ: Ablex.
Thorndike, R.L. (1986). The role of general ability in prediction. Journal of Vocational Behavior, 29, 332-339.
Thorndike, R.L., Hagen, E.P., & Sattler, J.M. (1986). The Stanford-Binet Zntelligence Scale: Fourth Edition. Chicago, IL: Riverside.
U.S. Department of the Army. (1965). Marginal man and military service. Washington, DC: Author. U.S. Department of Labor. (1970). Manual for the USTES General Aptitude Test Battery. Washing-
ton, DC: U.S. Government Printing Office. U.S. Department of Labor. (1977). Dictionary of occupational titles (4th ed.). Washington, DC:
U.S. Government Printing Office. Venezky, R.L., Kaestle, C.F., & Sum, A.M. (1987). The subtle danger: Reflections on the literacy
abilities of America's young adults. Princeton: Educational Testing Service. Vineberg, R., & Taylor, E.N. (1972). Performance in four Army jobs by men of dtrerent aptitude
(AFQT) levels: 3. The relationship of AFQT and job experience to job performance. Human Resources Research Organization Technical Report 72-22. Washington, DC: Chief of Re- search and Development, U.S. Department of the Army.
Wechsler, D. (198 1). WAIS-R manual: Wechsler Adult Intelligence Scale-Revised. New York: Psy- chological Corporation.
Williams, M.V., Parker, R.M., Baker, D.W., Parikh, N.S., Pitkin, K., Coates, W.C., & Nurss, J.R. (1995, December 6). Inadequate functional health literacy among patients at two public hospitals. Journal of the American Medical Association, 274, 1677- 1682.
Wonderlic Personnel Test, Inc. (1992). Wonderlic Personnel Test and Scholastic Level Exam: User’s manual. Libertyville, IL: Author.
Wood, R.E. (1986). Task complexity: Definition of the construct. Organizational Behavior and Human Decision Processes, 37, 60-82.
APPENDIX USING CORRELATIONS TO ASSESS THE IMPORTANCE OF g
Four ways of using correlations to assess importance are described. The second and third are the most useful in social policy analysis.
Predictive Effkiency Predictive efficiency refers to degree of success at reducing the error in predicting individual’s scores on the criterion (say, income level). The index of forecasting efficiency is one such measure, as is percentage of criterion variance “explained” by (shared in common with) the predictor. The latter, which is a squared correla- tion, is used in evaluating how well theoretical models “fit” the data. It also seems to be the measure of predictive importance favored by detractors of g (e.g., Gould, 1994), perhaps because it (necessarily) yields the smallest-appearing esti- mates of importance.
However, predictive efficiency has little value in applied settings. Educators, selection psychologists, policymakers, and others who work in the realm of prac-
WHY g MATTERS 131
tical affairs are not concerned with fully explaining particular outcomes. Instead, they usually want to know how much “bang for the buck” on a criterion they will get by changing some input by a certain amount. As already described, predictors with low predictive efficiency can yield huge effects over extended periods of time. Similarly, to take a hypothetical example, a vocational counselor would find it more useful to know that a particular counselee’s SAT score gives her only a 60% chance of achieving a C average or better at the college she wishes to attend than to know that SAT scores account for 30% of the variation in grades in that institution.
Prediction of Individuals’ Odds of Success Little in life is guaranteed, good or bad. Like gamblers, we all have to play the odds, to the extent that we can discern them. Predictive validities can be used to show how our odds of success or failure (graduating from high school, being admitted to Harvard, bearing an illegitimate child) rise or fall depending on our traits (intelligence, grades) or circumstances (parents’ income or education). In particular, correlations can be used to calculate the expected rates of criterion success for any particular range of scores on the predictor. Personnel profession- als and college admissions officers, for example, use such tables to set minimum cut-off scores in hiring workers and admitting students. They cannot know for sure which particular applicants will succeed, but they can be fairly certain about the proportions who will and how those proportions rise or fall with predictive validity.
For example, consider a situation where 60% of individuals succeed. To be specific, about 60% of the working population is above the intelligence level (IQ 100) required for adequate performance as a bank teller (see Figure 1 for appli- cants). If a bank hired randomly, the odds of successful performance would be 1.5: 1 (60:40, in Jensen, 1980, Taylor-Russell tables on p. 307). If the bank se- lected applicants based on a test with a predictive validity of only .3 (and hired half the applicants), the odds of success would rise to over 2: 1 (69:3 1). Switching to a test with a validity of .45 (many are available) would raise the odds to 3:l (74:26), thus doubling the original odds.
The higher the correlation between predictor and criterion, the more sharply the odds of success will diverge for the same two scores (say, IQ 85 vs. 115). As we saw, odds are especially useful in assessing the life chances of individuals at different levels of the IQ continuum. They often differ by multiples far greater than 3:l.
Prediction of Groups’ Average Performance Levels Odds deal with success versus failure, that is, with either meeting or failing some minimum performance level. Many institutions, however, are more interested in
132 GO’ITFREDSON
predicting average performance levels above some minimum and how much they might change under different conditions (new selection procedures, instructional strategies, nutritional supplements, and the like). This is the realm of “effect sizes” and “utility” analysis (respectively, Lubinski & Humphreys, 1997; Bou- dreau, 1991).
Such calculations are of particular importance for social policy because it usu- ally concerns itself with gradual shifts in population outcomes, favorable or unfa- vorable. Predictive validity need not be large for effect sizes to be substantial in both human and economic terms (Lubinski & Humphreys, 1997). Utility analyses of alternative selection procedures make the same point. The percentage gain in aggregate worker performance that is to be expected when switching from one selection procedure to another is a direct function of their respective predictive validities. For example, a predictive validity of .4 (or .5) means that using the selection battery can achieve up to 40% (or 50%) of the gains that would be possible by using a perfectly valid test (predictive validity of 1 .O) compared with random selection (predictive validity of zero). Even much smaller increases in validity (say, from .2 to .4) often translate into thousands of dollars per hire per year (see Boudreau, 1991, for an extended discussion of utility analyses in per- sonnel selection).
Relative Importance The importance of a predictor is often also judged by comparing its validity with that of other predictors. The predictor with the tighter link to important outcomes is, prima facie, the more important. More formally, a set of such correlations can be mathematically modeled to estimate the independent effects of each predictor. Path analyses that do so were reviewed earlier.
However, simple comparisons of predictors are also useful in the current con- text. Socioeconomic background (parental income, education, poverty) is widely presumed to be an important cause of different life outcomes, so it can serve here as a benchmark for relative importance. If the correlations for g equal or exceed those for social class, then g would appear to be important as well. Indeed, as we saw, g is quite important by this measure (cf. Gordon, 1997).
Finally, it is important to realize that the same validity coefficient may be of little use for one purpose (accurately predicting an individual’s behavior) and yet quite powerful for another (predicting rates of behavior in different groups). Also, a panoply of even small validities that might be inconsequential individually can cumulate for enormous impact over an individual’s lifetime. An analogy is the small but inexorable odds favoring the house in casino gambling (Gordon et al., 1988).