why is this indicator so profitable? - perfect trend system€¦ · · 2017-11-21why is this...
TRANSCRIPT

Why is this indicator so profitable?
This indicator is based on sound trading logic. It exploits the always recurring behavior of the smart
money (in forex the mega banks). The smart money produces double tops and bottoms with fake
breakouts. Then the smart money reverses the trend very sharply.
The following screenshots are showing a double bottom and a double top with fake breakout:
The fake breakout is the move behind the left leg (labeled with 1) followed by a sharp reversal. With this
pattern, the smart money makes a final accumulation of its position before it reverses the trend.
This is a recurring behavior which you can exploit!

Why does this pattern happen?
The forex market has at its core the interbank market. It’s a network between the mega banks Citicorp,
JP Morgan Chase; Deutsche Bank, HSBC etc. All smaller networks are attached to the interbank market.
The 8 biggest mega banks are responsible for 70% of volume which is traded in the forex market every
day. These mega banks are the smart money and the driving forces in the forex market.
If we look at the huge volume of the 8 biggest banks then we can agree that the forex game is more or
less a battle between 8 big market participants (the smart money) and millions of smaller market
participants (the herd). You can guess who will win the fight every day.
Every buyer needs a seller and every seller needs a buyer. This means that for every position that is
taken in the forex market there needs to be a counter part of this position.
Now let’s assume that most members of the herd jump on a trend when it starts to develop, they enter
on pullbacks or scalp during fast moves in direction of the trend etc. Most members of the herd seek
trends and want to profit from them.
If this is true, then an imbalance within the herd will develop during trends. This means e.g. during an
upward trend the herd will throw more long orders than short orders into the market. During a
downward trend the herd will throw more short orders into the market than long orders.
So, what happens with this imbalance? Who takes the counterpart of the imbalance of millions of
market participants? It’s the smart money (the mega banks). The smart money is therefore taking
positions against the direction of the prevailing trend.
Lately I heard that the mega banks are NOT charity organizations. They are indeed acting in the markets
to make profits for themselves. What a shock! 😊 So, what do the mega banks do if they take positions
against the direction of the trend and their entire position is in a deep drawdown?
They need to drive their position into profit and give the position back to the herd (of course with
profit)! And this special action of the mega banks is detected by the Double Top/Bottom Indicator!
The following charts show what I mean with the explanations above. The smart money takes the
imbalance of the herd and therefore must take the position against the trend. The average price of the
position of the smart money is in loss at this moment:

The position of the smart money is in loss. And for whatever reason, the smart money decides that NOW
is a good time to reverse the trend and to drive the position in profit again. But as you can see in the
charts above the average price of the position of the smart money is far away from the actual price and
maybe they want to accumulate an even bigger position before they reverse the trend to make even
more profits.
Therefore, the smart money decides to drive the price into the next liquidity zone where stops of the
herd are placed and where new entries of the herd in direction of the trend can be expected. Such
liquidity zones are directly below the recent low (in a downward trend) and above the recent high (in an
upward trend).
Following charts show those liquidity zone:

As soon as the liquidity zones are reached the smart money starts aggressively adding to its position.
Through this aggressive adding to its position the average price of the position of the smart money
comes nearer to the actual price, as shown in the following charts:

Within the liquidity zones the smart money absorbs all incoming orders from the her. As soon as the
smart money has accumulated a big enough position it reverses the trend very sharply. The trapped
traders of the herd who opened their position within the liquidity zones into the wrong direction are
now in panic and exit or even reverse their position, as shown in following chart:
This is what happens in the markets every day, not only in the forex market. And this pattern is detected
by the Double Top/Bottom Indicator which you can get for FREE:

Visual Filtering
To get an even better performance you shouldn’t take every signal of the indicator!
Besides the look of the signal itself (how obvious is the fake breakout and the sharp reversal?) you
should also look where the signal occurs.
The big picture analysis (where the signal occurs) imho can’t be programmed into a fixed programmatic
ruleset. Or at least a visual filtering is a lot better than a programmatic attempt. Therefore, I prefer a
visual check for every signal.
How to visually check?
With the explanations above about the smart money in mind you can ask yourself the following
questions:
For Double Bottoms
Is the double bottom signal at a low (did the smart money most probably accumulate a long position)?
Is there enough room to the upside for a good Risk/Reward? This means: Is the next resistance far
enough away?
For Double Tops
Is the double top signal at a high (did the smart money most probably accumulate a short position)?
Is there enough room to the downside for a good Risk/Reward? This means: Is the next support far
enough away?

Tips
I personally use the timeframes M30 and higher. They have less noise and you have usually more time to
react. But of course, it’s up to you which timeframes you want to trade. There are good signals on every
timeframe.
Wish you a lot of pips and happy trading!
PS:
I know from my own experience that nobody can scan all trading instruments and timeframes without
missing some of these good setups. Therefore, I have created an Alerter-Tool which checks up to 30
instruments and 8 timeframes for you. This tool is available for a small one-time-fee here:
Double Top/Bottom Alerter

More on Visual Filtering
Besides the good feedback, the following question was asked most often: Is there a way to further add to the profitability of the signals?
And the answer is: Yes! You need to be selective which signals you choose.
So, how can you be more selective? As I mentioned in Post #4 (Visual Filtering) there are
two areas where you can improve the profitability of the signals:
1. The smaller picture and the look of the Double Top/Bottom itself (for a higher winning
percentage) 2. The bigger picture analysis (for bigger winning trades)
I will start with the smaller picture and how a good Double Top/Bottom should look like.
Later I will post some tips how you can use a bigger picture analysis with which you can
get very big winners on a regular basis.
Filter #1: The smaller picture and the look of the Double Top/Bottom itself
A good Double Top/Bottom should take out a recent Top/Bottom followed by a fast
rejection. The fast rejection shows the strong momentum of the move. The strong
momentum is a sign that the smart money has most probably finished its accumulation
phase and starts its profit release phase (the big move).
Examples of good Double Tops/Bottoms with stop levels taken out:
Recent high is taken out, then fast rejection downward: Attached Image (click to enlarge)
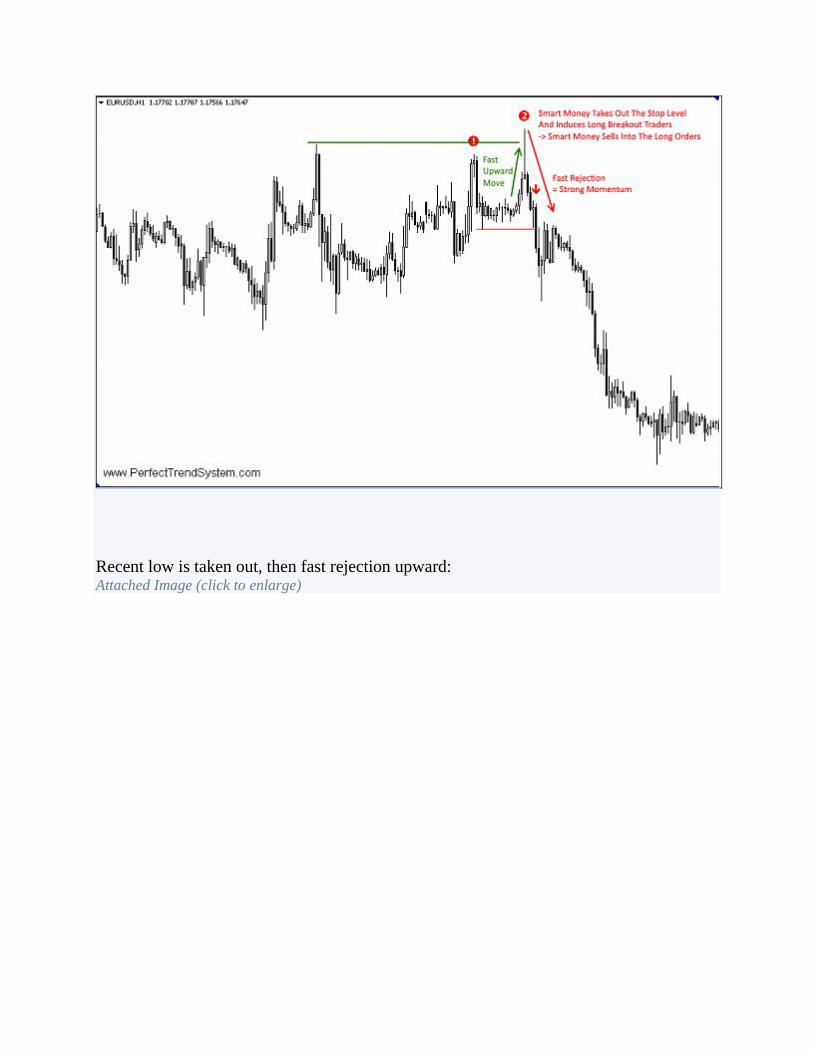
Recent low is taken out, then fast rejection upward: Attached Image (click to enlarge)

Trend continuation trade, but multiple recent (smaller) highs are taken out: Attached Image (click to enlarge)

Example of a bad Double Bottom:
Bad Double Bottom -> no recent low is taken out: Attached Image (click to enlarge)

Bad Double Bottom -> signal is not at the lower boundary of the trend channel: Attached Image (click to enlarge)

Example of a good Double Bottom near lower boundary of the channel of the
downward trend:
Attached Image (click to enlarge)

Example of a bad Double Top/Bottom:
No recent high/low are taken out. Signals are not within a trend / near outer boundary of
channel. Although both signals reached 1R you should not trade such signals: Attached Image (click to enlarge)

Filter #2: The bigger picture analysis
The following screenshot shows what i bigger picture analysis. This screenshot shows
major support/resistance zones on the daily timeframe.
Often the direction of the trend will reverse within these areas. Now imagine how big
your winners can get if you catch the reversal of the trend (e.g. the trend changes from
downward trend to upward trend) near to the lowest point of the downward trend with a
double bottom signal on the timeframe M30. You will have a tiny stop of e.g. 30 pips and
a huge profit potential of several hundred pips!
Attached Image (click to enlarge)

This is professional trading with multiple edges:
Edge #1: High probability double bottom signal on lower TF
Edge #2: The big picture (the major support) adds to the quality of the signal of the lower
TF
Soon I will release an Alerter-Tool with which you can trade exactly this trading style
with major support/resistance zones. This Alerter-Tool will give you signals of all
configured timeframes within the support/resistance zones.

Example Trade
Double Top on USDCAD on M30 could get a good trade:
Attached Image (click to enlarge)
Smart Money trapped long traders and hunted stops of short traders. Then the smart money runs
away very fast to start its profit release phase:
Attached Image (click to enlarge)
My targets were reached very fast:
Attached Image (click to enlarge)

1.5 R winning trade. Pair this with a high winning percentage then ...