why marketers need dashboards
TRANSCRIPT

Webinar: Why Marketers Need Dashboards
1

Mychelle MollotChief Marketing Officer
Jonathan TaylorDigital Marketing Manager

WHYDashboards?
HOWwith Klipfolio
TOP 6Need-to-know
STARTEasy + fast
Covered in this slide deck
● Why do Marketers need Dashboards when the services they use have
reports?
● How does a Dashboard help marketers with a link to a dashboard demo
● Top 6 things Marketers should look for in a Dashboard solution
● How to get started on your Dashboarding journey today
Why do marketers need dashboards?
WHY
To answer a question all marketers have...

How are we doing?
in SEO?
And email
campaigns?
Advertising?
Social media?
Events?
Last month?
This month?
RIGHT NOW?

The answer to that question
usually comes from many
independent marketing
services.

And this is just a small sampling of
the services Marketers are using.
There are many, many more (as
you know).

And from spreadsheets, databases, email and other on premise data
sources.

Often the answers come from
multiple services and
databases at the same time.

How is our new
campaign impacting
sales today?
So how does a dashboard help?
HOW
A Dashboard answers the
“how are we doing?”
question regardless of where the
information is coming from.
It is the single place for all the key
metrics you want to track on a
regular basis

And it can answer it in the time-frame
you need:
every minute
every hour
every day
every week…..
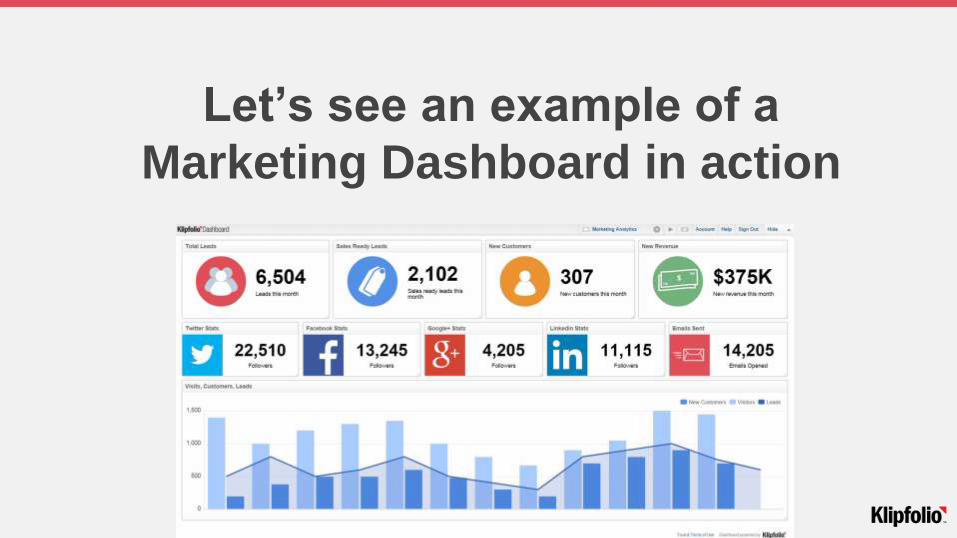
Let’s see an example of a
Marketing Dashboard in action
Now you know why Marketers need
Dashboards, let’s look at what you
need to get from your dashboard
solution to be successful.

THINGS YOU NEED FROM
YOUR DASHBOARD
TOP 6
No IT.1

No IT.1
Look for a solution that doesn’t require IT for any aspect of your
Dashboarding journey:
● Access to the data,
● Creation of the dashboards,
● Administration of the dashboard (things like adding users), and
evolution of the dashboards.
IT can’t keep up with pace that marketers move. With new
campaigns and services constantly being added, you need to be in
control of your dashboarding journey.

Up-to-date data.2

Up-to-date data.2
Look for a solution that can be right-time, which might mean it
refreshes every minute or it might mean that it refreshes every hour
or day depending on your data and services. Seeing data refresh
when meaningful changes occur allows you to better optimize your
marketing performance. Doubling down on what is working and
aborting what isn’t or just tweaking to improve.

Mashups.3
Mashups.3
Look for a solution that allows you to combine, compare and
calculate with multiple data sources. Many solutions give you
widgets that only pull data from one data source, allowing you to
see data side by side, but your performance can’t be assessed in
silos. For example, when you launch a campaign you want to see
how you are doing across all your social media channels together in
the same visualization. You want to see how your social activity is
driving traffic to your website. This requires data mashups.

Math.4
Math.4
Look for a solution that supports functions and calculations. More
often than not, the metric you want to track doesn’t exist in the data
and you’ll need to derive it by using math. This functionality may be
used to do simple things like summing columns or to do more
complicated things like statistical calculations.
Some dashboarding solutions enable you to configure predefined
visualizations (usually called widgets) but don’t provide the
functions, calculations and an editor to enable you to build out the
visualizations and metrics that are unique to your business.

Interaction.5

Interaction.5
Look for a solution that enables you and your colleagues to interact in
multiple ways with the dashboard when you aren’t the dashboard
creator/editor.
To really explore your dashboard you will need interactivity like:
● Sorting, drilling down, annotating, user input controls, resizing and
moving visualizations, zooming on maps, ability to hide or show series in
in-series charts, print, share, and adding or remove visualizations.

Help when, and how
you need it.
6
Help when, and how you
need it.
6
Look for a solution that supports when, and how you want help. Many
vendors post little about their solution on the Web forcing you to contact
sales for even the most basic questions and when it comes to trying the
solution many force an on-site vendor lead installation.
Look for a vendor that has the information you need to evaluate and use their
solution - including pricing and contract terms - on their web site.
And look for a vendor that offers help from real people at all times -
regardless of whether you are a customer or not.

TOP 6Look for solutions:
1. that don’t require IT
2. that support real-time data
3. that support data mashups
4. that have functions and calculations
5. that support interactivity like filtering, grouping, sorting,
annotating, reconfiguring of the dashboards
6. from vendors that believe in complete transparency and that give
you access to real live humans...

See how you can get started today at
Klipfolio.com/marketingFor $20/user/month you won’t believe what you can build.
STARTEasy + fast
+ Affordable