why most traders fall victim to false...
TRANSCRIPT
TRADERS´ CovER SToRy 42A breakout can be likened to a volcano. As the lava builds under the earth’s bedrock the pressure builds and builds until finally the pressure gets too much and lava explodes from the earth’s core. As a breakout trader is scanning their charts they are attempting to locate price levels where price is testing that level but cannot break through it. Eventually the pressure becomes too much for the price level and price breaks through with a fast explosive move.
But how can we tell the difference between an explosion that will continue on and one that will peter out (i.e. false breakout)?
In the author‘s experience there is a large number of things traders do wrong when trading breakouts but in this article he is going to cover what he considers to be the five most critical errors.
Error 1: Relying on too Few Criteria The most critical error traders make when trading breakouts is that their breakout strategy requires too few criteria to line up before they will take the trade. We like to use the analogy of baking a chocolate cake. you cannot bake a chocolate cake with only two ingredients and neither can you have a successful trading strategy with only two criteria lining up.
The author will often speak to traders who tell him that breakouts do not work. When he
Revealing Five Common Mistakes
Why Most Traders Fall Victim to False BreakoutsLike a large majority of traders the first strategy we ever learnt was the humble breakout. It is a common strategy that you will find in a large number of trading books and courses. Whilst it appears on the surface to be a simple strategy that is easy to master, more often than not most traders struggle to be consistently profitable with it. Falling victim to false breakouts is the main reason why traders discard breakouts and continue their search for a profitable strategy. The aim of this article is to prove to you that breakouts are indeed a powerful strategy but more often than not traders are committing a number of critical errors which drastically reduces their probability of success.

43
06/2012 www.tradersonline-mag.com
Travis McKenzie
Travis is the Head of online
Trading at Trade With Precision
(www.tradewithprecision.com)
where he is one of their most
highly sought after speakers
and trading educators.
Experienced in both intra-
day and swing trading, Travis
largely focuses on forex &
stock markets where he
applies his precision trading
methodology. Throughout his
career Travis has spoken on
behalf of some of the largest
names in the financial world
including the CME Group,
TradeStation Securities, ETX
Capital, CMC Markets and
City Index to name only a few.
probes them a little he typically discovers that they only really have two criteria they are looking for. The first criteria will be they need to locate an area of support or resistance. The second criteria will be that they want price to break and close above/below that level before they will enter in the direction of the break.
The simple truth is that two criteria simply is not enough in order to create a high probability trading strategy. yes, with only two criteria you will find a large number of set ups but they will be substandard and will lead to a large number of false breakouts.
When the author is scanning for a breakout he has a list of 19 possible criteria that he is looking to have aligned. out of those 19 he looks for a minimum of nine of them to align before he would even consider it a valid set up. obviously the greater the number of criteria which align the higher the probability becomes of that set up being successful.
Error 2: Trading Breaks of Sloping Support/Resistance LevelsBreakouts can be categorised into two broad categories: (a) breaks from sloping support/resistance levels e.g. trend lines or patterns such as symmetrical triangles or (b) breaks from horizontal support/resistance level.
Please note that breakouts can be applied to any market and any time frame therefore we have intentionally cut off the market and time frame for the accompanying diagrams as it really does not make a difference what market or timeframe the chart is.
Breaks of Sloping LevelsIn the author‘s opinion breakouts are often a self-fulfilling prophecy, that is because so many traders are looking for and trading them that they work. If we are correct on that point, then would not it make sense that the most powerful and highest probability breakouts will result from those breakouts which are the most obvious and identified by the greatest number of traders?
The biggest issue a trader has who attempts to trade breaks of sloping levels is that the drawing of sloping levels is so subjective, every trader seems to draw them slightly differently from the next trader. If we gave a room full of traders a chart and asked them to draw sloping trend lines on that chart it would come back looking like Figure 1. So where exactly on that chart is the breakout level?
If the author‘s theory is correct that the highest probability and most powerful breakouts result from those breakouts which are the most obvious and identified by the greatest number of traders
F1) Subjective Sloping Levels of Support/Resistance
Every trader seems to draw sloping levels of support/resistance differently therefore making them extremely subjective.
Source: www.tradewithprecision.com
F2) Far Less Subjective Horizontal Levels
The large majority of traders will agree where to draw horizontal levels of support/resistance.
Source: www.tradewithprecision.com
44
06/2012 www.tradersonline-mag.com
TRADERS´ CovER SToRy
then can you now see the issue you have with subjective sloping levels. Most traders will be drawing in their levels differently to you therefore meaning that very few traders will be entering at the same level you will be entering and without the crowd support the likelihood of the move being a false breakout is dramatically increased.
Breaking Horizontal LevelsNow let us take the same chart we used in Figure 1 and ask the same room of traders to locate any horizontal levels of support/resistance. It is more than likely that the large majority of those traders would return a chart like the one in Figure 2.
Horizontal levels are much less subjective and only trading the obvious ones will assist us in ensuring we are only entering breaks where a large number of other traders are entering and this crowd participation will lead to a stronger initial move and more follow through as late comers also join the party.
The author also believes that it is crucial that you only look for what he calls true levels of support/resistance. His definition of a true level of support/resistance is a level that has been tested two or more times (the more times the better as this will mean a stronger level but also give more people the opportunity
to locate the set up too). By testing a level he means price has hit (tested) that level, bounced off that level and then tested it again (this is opposed to simply price consolidating around a level without really testing it). Refer to Figure 3 for an example of three clear tests of a level.
Error 3: Not Enough Emphasis on Trading with the TrendAnother critical error traders make which leads to false breakouts is they attempt to trade breaks against the trend or where there is no clear trend. This is often what a trader will be doing when attempting to trade a break of a sloping level. For example the sloping level trader in Figure 1 would be trading against a very established downtrend if they were to go long on the break of the downward sloping trend line.
We also see a lot of traders of horizontal levels make this mistake when they find a market which has formed a consolidation box (ie a horizontal level above and below the current price action) and then they simply enter long if the upper level is broken or enter short if the lower level is broken. They have absolutely no regard for the current trend and therefore often find themselves trading against the trend and once again a victim of a false breakout.
The trend really is your friend
when it comes to avoiding false breakouts.
In assessing trends the author tries not to overcomplicate it and use good old fashion price action, assessing highs and lows to establish the trend direction. He will only go long in an uptrend, short in a downtrend and sit on his hands in a non-trending market. If you want that sustained follow through then you need to trade with the trend.
Error 4: Trading off Only One Time frameSome of the more advanced traders may be incorporating trading with the trend as one of their criteria but then they often fail to take into consideration what the higher time frames are doing. Trading off only one time frame is like driving your car on a foggy night. you will have no trouble seeing what is right in front of you but it is impossible to see any danger that lies further ahead on the road. The biggest danger that lurks in the fog for traders is that the shorter term trend they are trading with is actually in conflict with a bigger more powerful higher time frame trend. See Figure 4 for an example.
The most powerful moves with the greatest follow through will occur when you have as a minimum two time frames in agreement.
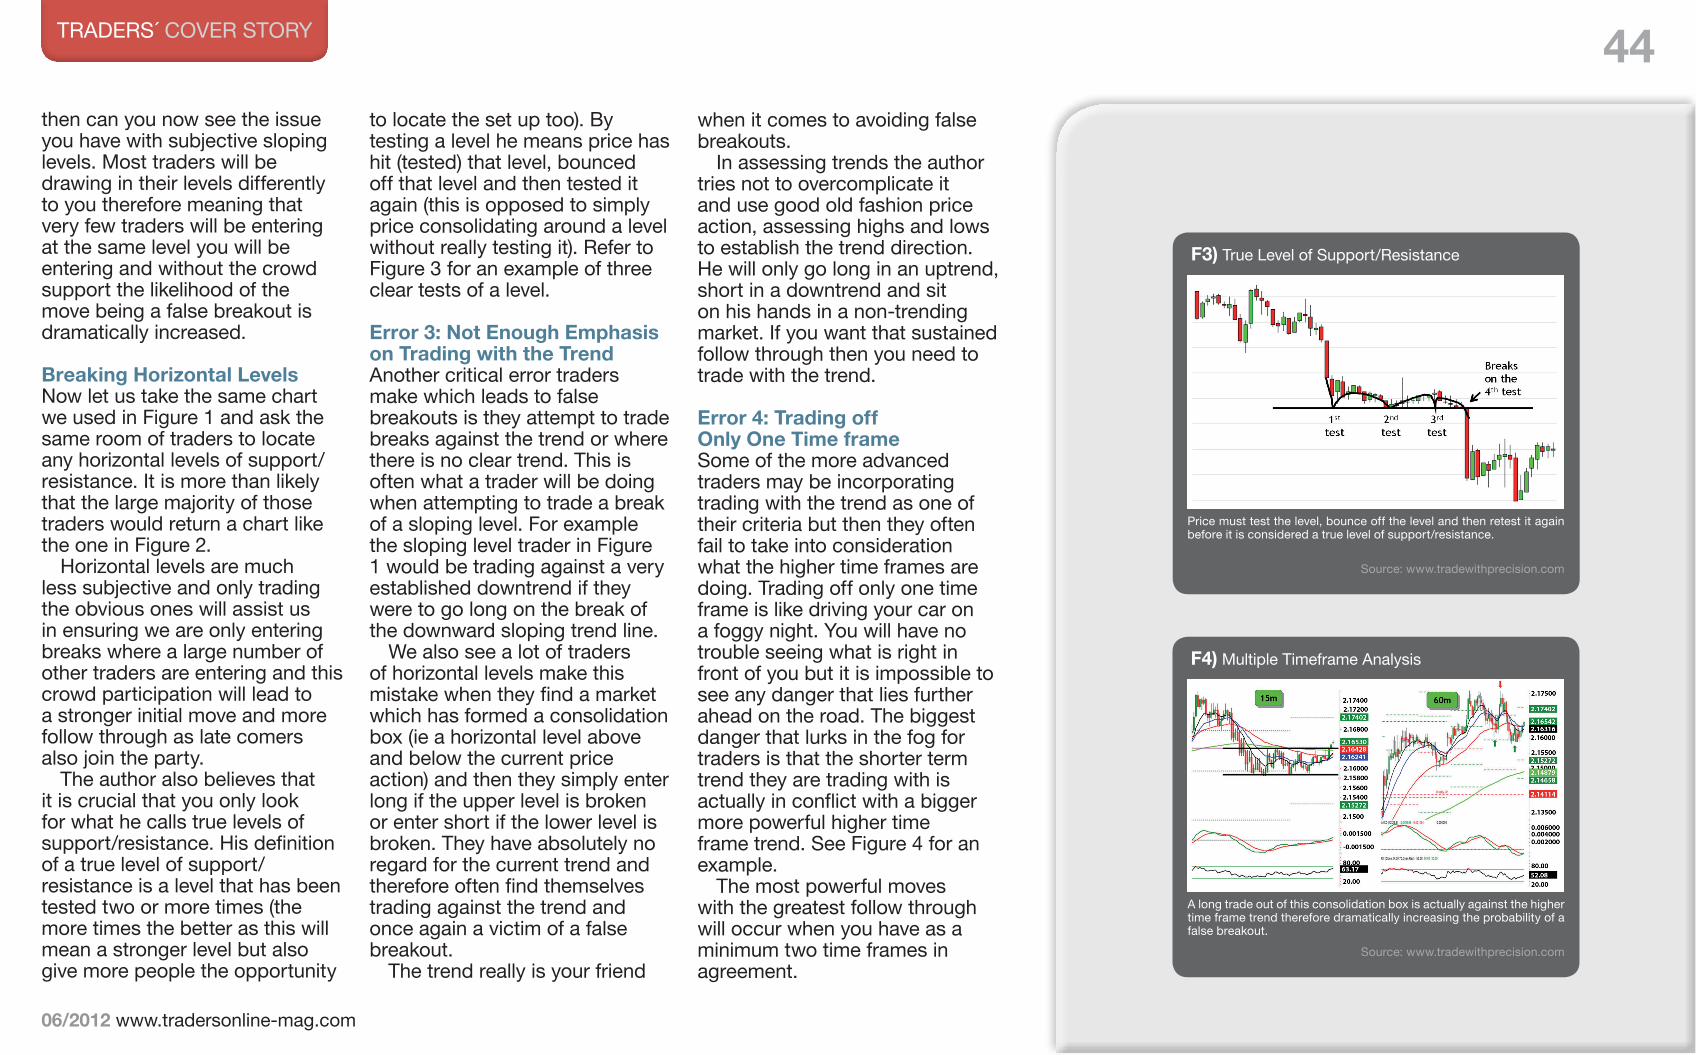
F3) True Level of Support/Resistance
Price must test the level, bounce off the level and then retest it again before it is considered a true level of support/resistance.
Source: www.tradewithprecision.com
F4) Multiple Timeframe Analysis
A long trade out of this consolidation box is actually against the higher time frame trend therefore dramatically increasing the probability of a false breakout.
Source: www.tradewithprecision.com
45
06/2012 www.tradersonline-mag.com
TRADERS´ CovER SToRy
trader will be getting in at a worse price with a much wider stop and therefore will need the market to run on so much further just so they can get a 1:1 target.
If you are trading true levels of horizontal support/resistance in the direction of not only the set up chart’s trend but also the higher timeframe’s trend then there is no need to wait for extra confirmation, enter as the initial break occurs.
ConclusionIf you are currently trading breakouts and not getting the results you desire or you have given up all together then hopefully we have demonstrated to you in this article that they can be an extremely powerful strategy when traded correctly. Ensuring you have a large number of criteria aligned is critical for any trading strategy and breakouts are no different. Based on the above you can now add the following criteria to your checklist: (1) Trade only horizontal levels of support/resistance. (2) Ensure it is a level of true support/resistance with a minimum of two tests. (3) Trade only in the direction of the set up chart’s trend. (4) Ensure you are also trading in the direction of the trend on the next higher time frame. (5) Enter as price breaks the flat level, do not wait for a close above/below the flat level.
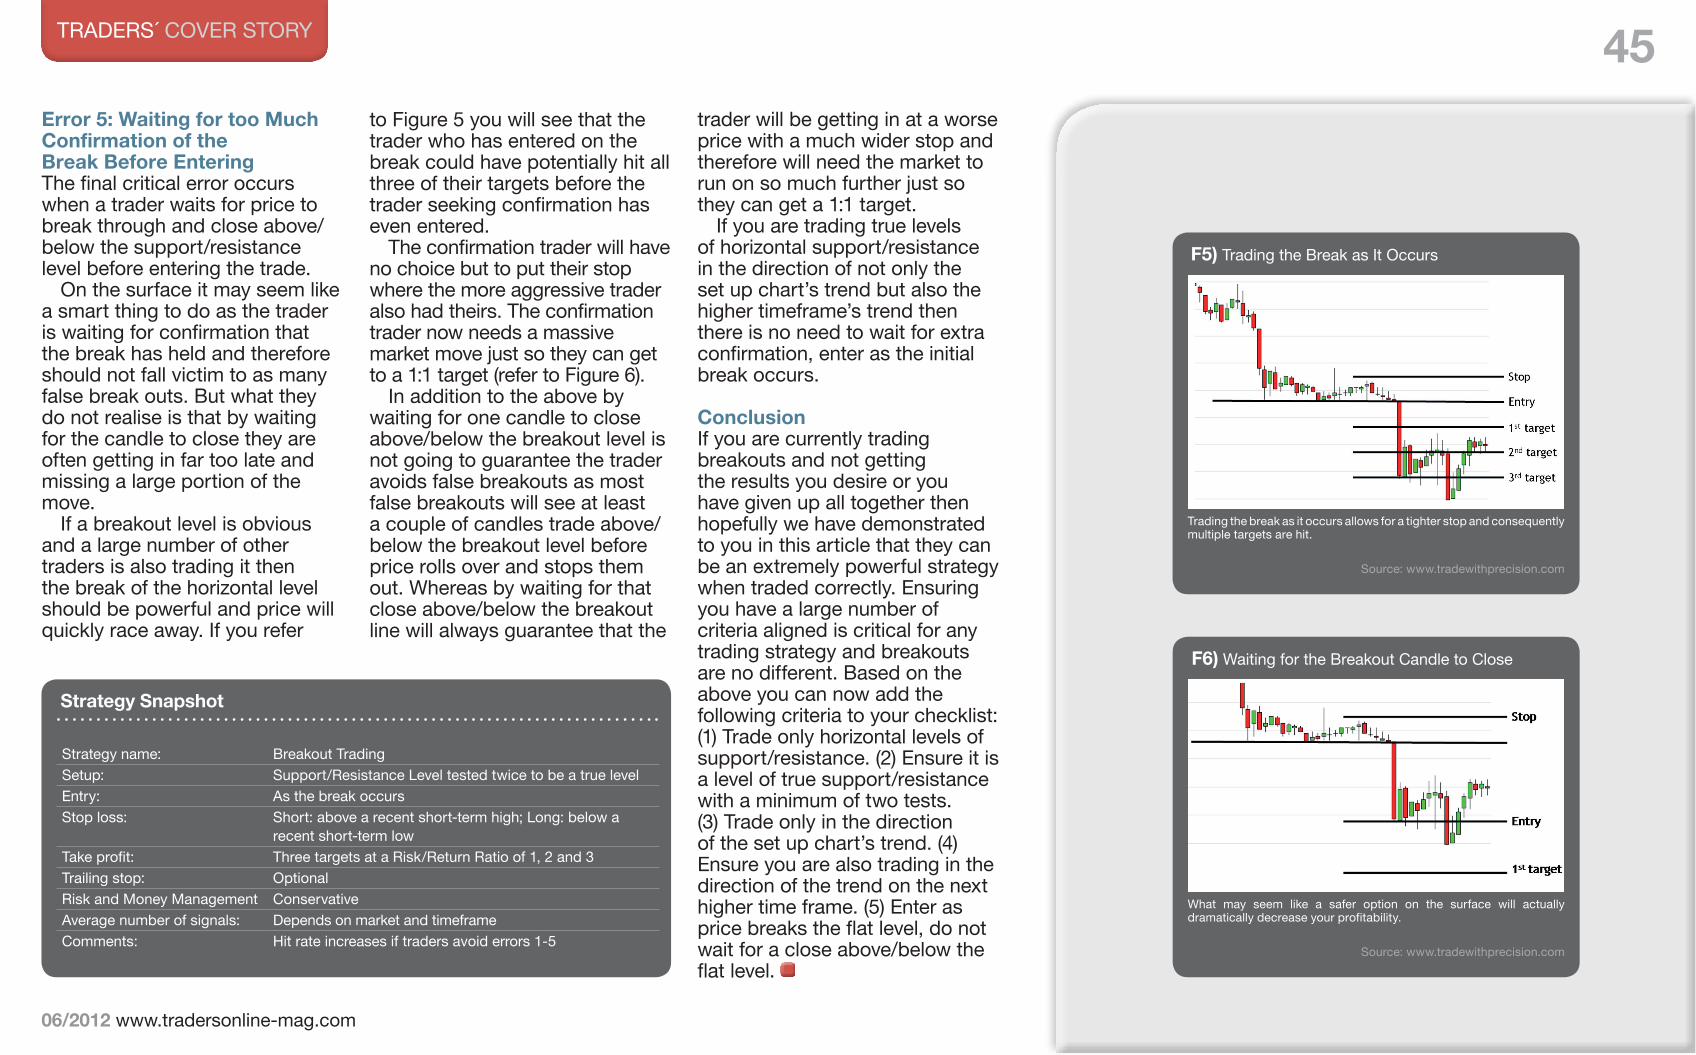
F5) Trading the Break as It occurs
Trading the break as it occurs allows for a tighter stop and consequently multiple targets are hit.
Source: www.tradewithprecision.com
F6) Waiting for the Breakout Candle to Close
What may seem like a safer option on the surface will actually dramatically decrease your profitability.
Source: www.tradewithprecision.com
Strategy Snapshot
Strategy name: Breakout TradingSetup: Support/Resistance Level tested twice to be a true levelEntry: As the break occursStop loss: Short: above a recent short-term high; Long: below a
recent short-term lowTake profit: Three targets at a Risk/Return Ratio of 1, 2 and 3Trailing stop: optionalRisk and Money Management ConservativeAverage number of signals: Depends on market and timeframeComments: Hit rate increases if traders avoid errors 1-5
Error 5: Waiting for too Much Confirmation of the Break Before EnteringThe final critical error occurs when a trader waits for price to break through and close above/below the support/resistance level before entering the trade.
on the surface it may seem like a smart thing to do as the trader is waiting for confirmation that the break has held and therefore should not fall victim to as many false break outs. But what they do not realise is that by waiting for the candle to close they are often getting in far too late and missing a large portion of the move.
If a breakout level is obvious and a large number of other traders is also trading it then the break of the horizontal level should be powerful and price will quickly race away. If you refer
to Figure 5 you will see that the trader who has entered on the break could have potentially hit all three of their targets before the trader seeking confirmation has even entered.
The confirmation trader will have no choice but to put their stop where the more aggressive trader also had theirs. The confirmation trader now needs a massive market move just so they can get to a 1:1 target (refer to Figure 6).
In addition to the above by waiting for one candle to close above/below the breakout level is not going to guarantee the trader avoids false breakouts as most false breakouts will see at least a couple of candles trade above/below the breakout level before price rolls over and stops them out. Whereas by waiting for that close above/below the breakout line will always guarantee that the