why nations succeed the institutional and political in ... · to de ne the institutional di erence...
TRANSCRIPT

Why Nations Succeed
The Institutional and Political Influence on Prosperity
Jincheng Zhang
Yiqian Lu
November, 2016
1

Abstract
We answered the question of “why nations succeed” by deriving the resource
allocation between human capital and political capital for agents of various po-
litical statuses within economies of distinct institutions. The equilibrium al-
location depends on how political power is open and fair to all citizens, how
influential agents can exert their political power, the threshold level to reap po-
litical benefits and the relationship between human capital investment efficiency
and interest rate. Our analysis raises an alternative view on describing how in-
stitutions can affect economic development and provides a possible explanation
on the economic success of both democratic and authoritarian societies.
JEL Classification: P16, P26, J24, O11, O38
Keywords: Institutions; Political Capital; Human Capital
2

1 Introduction
To the unease of believers of ideal societies, evidence of political power prevails
in all communities, be it small or large, rich or poor, capitalism or socialism. Po-
litical power exists in all forms, such as lobbying, media control, bribery, nepotism
and even the choice of regime. Within a country, the discrepancy in political capi-
tal among economic participants can affect their behavior and the pattern of their
interaction, thus affecting structural evolution of the country; meanwhile, the insti-
tutional difference among different countries would create distinct evolution patterns
for market participants subject to their political capital discrepancy. This paper fo-
cuses on the impact of political capital discrepancy and institutional difference on
corporate behavior and market evolution. To be specific, we examined how the
difference among nations’ institutions (democracy or authoritarian), the efficacy of
company’s political power and relative political status of companies would affect
firm’s resource allocation between human capital and political capital investment.
Essentially there are tight link between human capital and economic growth. It
is concluded that human capital is associated with knowledge and skills, contributing
to economic development that depends on advances in technological and scientific
knowledge. (Gary S. Becker, Kevin M. Murphy, and Robert Tamura 1994). Barro
(1989) studies the education impact on per capita level growth among approximate
100 countries and proposes the argument that human capital investment plays a piv-
otal role in subsequent economic growth. It has been found (Romer 1989) that initial
literacy level has no additional explanatory power on growth rates on investment
but help predict the subsequent rate of investment and economic development.
With the development of Corruption Perceptions Index, it is now easier to find
the empirical relationship between corruption and economic development. In empir-
ical studies conducted by Pellegrini and Gerlagh (2004), corruption has been found
to have a negative effect on economic growth. Corruption is also studied as case
studies for various countries, such as Vietnam, South Korea and Philippines, Italy
and many others. When it comes to democratic and market-oriented economies,
government intervention in the economy is often referred to as rent seeking activi-
ties. Krueger (1974) discusses the ways where rent seeking is competitive. Following
Bentley’s pioneering work (1908) and stimulated by Stigler (1975), Peltzman and
Posner (1974), Becker (1983) build a model of political competition among pressure
groups. Under political equilibrium, all groups–defined by occupation, industry,
3

income, geography and other characteristics–maximize their incomes by spending
their optimal amount on political pressure, given the productivity of their expendi-
tures and the behavior of other groups. Indeed, the interference of government in
the economy are not pervasive in all societies for no reason. Market participants
face the dilemma of seeking political support or investing in its core competency
despite the institutional difference of countries. If we carefully consider these insti-
tutional difference among nations, does the difference between the process of “rent
seeking” which describes a money-dominated bidding process, and the process of
“corruption” which depicts a subtle and more complicated efforts, have the same or
different implications on economic development? Our answer is different, depending
on the country’s political institutions.
Now let’s treat political advantages as one type of asset called “political capital”
similar to human capital, regardless of which channel the participants acquire the
advantages. In a world that’s not perfectly free (i.e. affected by political power),
relative abundance of political capital can yield extra income to a group in forms
such as subsidies, free licences, tax exemptions, preferential policies, etc.; on the
contrary, lack of political capital often leads to losses to the group of interest, and
the losses in many occasions are not as financially explicit, such as more red tapes
in licensing process, stricter regulations and restrictions on qualifications and harsh
finance environment. Although political capital itself does not enhance productivity,
a group’s comparative abundance or deficiency in political capital can boost or hurt
its profitability as well as its business strategy. In our model following the work
of Ehrlich and Lui (1999), political capital partially redistributes the income of the
society without affecting the total output of all entities.
To define the institutional difference among nations, we find the recent work
“why nations fail” by Acemoglu and Robinson (2012) provides a helpful framework.
They argue that political institutions can be divided into two kinds - “extractive”
institutions in which a “small” group of individuals do their best to exploit - in the
sense of Marx - the rest of the population, and “inclusive” institutions in which
“many” people are included in the process of governing hence the exploitation pro-
cess is either attenuated or absent. While they successfully apply their reasoning to
most of the nations, they dodge the question that why countries such as Singapore,
where only a few people are included in the process of governing, succeed. Their ar-
gument is that countries that have extractive institutions cannot sustain long-term
4

economic growth even if they can experience a short-term rapid growth. In our
model, we translate the inclusiveness of institutions as how easy it is to accumu-
late political power and impose this power to gain economic benefits. The result of
our model provides a strong and effective amendment to Acemoglu and Robinson’s
theories where we have explained the East Asia’s “success” which is a phenomenon
that can maintain its stability.
For nations with inclusive institutions, political capital usually accumulates
through lobbying, media control and advocacy, all of which are generally consid-
ered “competitive rent seeking”; while for nations with extractive institutions, po-
litical capital is usually acquired through more interpersonal interactions such as
bribery, nepotism and political marriages. The difference, however, cannot always
be measured quantitatively since the implicit cost of many behaviors could not be
monetized. However, all behaviors above take efforts and time from the economic
participants, and can be measured in the sense of the opportunity cost behind those
efforts seeking political advantages. For example, an agent in an inclusive econ-
omy chooses to hire lobbyists at the cost of giving up investment in research and
development using the same amount of resource; on the other hand, an agent in
an extractive economy spend time and effort to build relationship with the ones in
power by letting go the chances to attract more employees of high capacity and im-
prove the efficiency of business. For economic participants in nations of whichever
institutions, they are always weighing the costs and benefits from investing between
political capital and human capital (and other investments that can improve pro-
ductivity of their businesses). Therefore the percentage of all resources available
(monetary or non-monetary including time, efforts and other expenditures) invested
in human capital and political capital can be taken as the decisions made from this
weighing and balancing all direct and indirect trade-offs.
With the concept of opportunity cost in mind, Isaac Ehrlich, Francis Lui (1999)
develop two complementary models to demonstrate the endogenous development of
corruption and growth. Their paper makes a significant contribution by introducing
time constraint imposed on individuals considering resource allocation to human
capital or political capital. In addition, they assume that corruption affects individ-
uals’ income by creating an add-on profit or loss to individuals’ production income
depending on their relative political capital stock, which is contrary to the common
belief that corruption imposes a social cost to all participants. These two assump-
5

tions lay a solid theoretical foundation for the model we develop in this paper.
Different from Ehrlich and Lui (1999), this paper applies the same assumptions to a
corporate setting and instead of maximizing the utility from an infinite consumption
stream, the corporate agent maximizes its discounted inter-temporal profit level in
this paper.
The conclusion from Ehrlich and Lui’s paper is intriguing where they deduce
three equilibrium in both of their homogeneous and heterogeneous agents cases:
low-level stagnant equilibrium (poverty trap), stagnant “development” equilibrium
and persistent “growth” equilibrium. The crucial difference among these three equi-
librium stages is the investment in human capital, which is considered as the engine
of economy’s growth. In fact, Adam Smith in “the Wealth of Nation” wrote down
the very first sentence, “The greatest improvement in the productive powers of labor,
and the greater part of the skill, dexterity, and judgement with which it is anywhere
directed or applied, seem to have been the effects of the division of labor.” In our
model, we use the investment in human capital as the proxy to discuss the growth
of nations.
The reallocation of resource due to varying political capital was discussed in
various forms. Song, Storesletten and Zilibotti (2011) have constructed a two-sector
model to explain the coexistence of high growth, high return to capital and a grow-
ing foreign surplus in China’s economic transformation. By demonstrating the re-
allocation of capital and labor from less productive externally financed firms to
more productive entrepreneurial firms who have less access to external financing,
Song implies that less productive firms have comparatively more political capital
which grants them easier access to financing resources. In reality, political capital
varies widely since political power can exist in a great variety of forms besides state-
ownership, making it sometimes difficult to classify them into binary categories-less
productive externally financed firms and more productive internally financed firms:
first, the percentage of equity owned by government (state or local government) can
vary from single digits to 100%; second, productive private enterprise may choose
to hire relatives of government officials, invite people who are politically powerful
on the company’s board, or get around with government interference with other
tactics in order to be favoured by the bureaucrats and receive “income transfer”
from political advantages; third, the level of political capital can vary across time
for companies who change their resource allocation strategy (e.g. political capital
6

v.s. human capital) in different time frames. In our model, the political status of
firms vary continuously throughout history and political advantages impose on a
company based on its relative political capital stock rather than absolute capital
stock. In other words, the political status of a firm needs to be ranked with its
peers to see how much political capital is accumulated in this firm compared with
other firms who are also competing for political preference by resource allocation to
political endeavors.
For a specific economy, companies’ capacity to accumulate political capital and
influence policy making might result in different resource allocation strategy, de-
pending on whether the company is in an economy with extractive or inclusive in-
stitutions. The debate of what kind of institutions foster or hinder economic growth
has been going on for a long time. Przeworski and Limongi (1993) have summarized
the debate on democracy, where they attach an interesting table showing the findings
in about twenty papers, all holding different opinions on what level of democracy or
authoritarian yields fastest growth. The impact of political institutions on corpo-
rates political activity has not been discussed as much. In as early as 1986, Useems
book “The inner circle: Large corporations and the rise of business political activity
in the US and UK” expressed concerns to the rising political activity from large
enterprises. Hillman, Zardkoohi and Bierman (1999) have found clear evidence of
a positive relationship between one type of political strategy, personal service, and
firm performance. Hansen and Mitchell (2000) has examined the political activities
of Fortune 500 firms, along with an oversampling of U.S. affiliates of large foreign in-
vestors for the 1987 to 1988 election cycle. Ansolabehere, de Figueiredo, and Snyder
(2003) has argued that political contributions should not be viewed as investment
in the political process but merely as a form of consumption good. Milyo, Primo,
and Groseclose (2000) have shown that large political action committee contributors
spend 20 to 60 times more on lobbying expenses than they do on hard money con-
tributions. Cooper, Gulen and Ovtchinnikov (2009) have documented a strong and
robust positive correlation between firms political contribution practices and their
future abnormal returns, and it is likely that only large firms can afford to pay these
political contributions. Their findings are partially confirmed in our modeling where
we found large companies tend to invest more in political capital only in inclusive in-
stitutions. The case for extractive institutions, however, is more complicated, which
will be discussed in more detail in the following sections.
7

The literature regarding the impact of political institutions on division of labor
is relatively limited. The inspiring work of Becker (1994) “The Division of Labor,
Coordination Costs, and Knowledge” discusses how specialization and the division
of labor depend on coordination costs, and also on the amount and extent of knowl-
edge. He also comments that “Countries with lower coordination costs due to stabler
and more efficient laws, or other reasons, not only have larger outputs, but they also
tend to grow faster because lower cost stimulate investments in knowledge by raising
the advantages of a more extensive division of labor.” without specifying how the
“stabler and more efficient laws” takes effect on the coordination costs. This insti-
tutional effect is studied more closely by Yang and Sachs (2003). They theorize that
the delimitation and protection of property rights is the ultimate driver of labor
division.
The remaining sections of this article are organized as follows. Section 2 builds
the benchmark model and discusses the case without political intervention. Sec-
tion 3 shows three different equilibrium cases under various exogenous conditions of
parameters. Section 4 provides detailed case studies to help understand why some
nations succeed while others fail and section 5 concludes the whole article. The
most remarkable contribution of this article is that it originally points out there ex-
ists an alternative way towards long-term economic prosperity other than political
and economic intuitions being intrinsic at the same time.
2 Equilibrium under no political intervention
In this section we build an infinite-period heterogeneous agent model. Each
company in the framework attempts to maximize its discounted intertemporal profit
level.
max∞∑t=0
1
(1 + rt)tP it ,∀i (1)
where rt is the t-year yield rate and P it represents profit level for agent i in period t.
Here for simplicity at the very beginning we assume each agent faces homogeneous
credit constraints and discounted rate so that rt only relies on t but not i. Later
we will relax the homogeneous discount rate assumption and unveil the dynamic
equilibrium under more general assumptions.
The profit is endogenously determined in each period with the engine of human
8

capital accumulation. Following Isaac Ehrlich, Francis Lui (1999)’s approach, we
assume the human capital is decided by
H it+1 = A(H̄ i +H i
t)hit (2)
where H it means human capital endowment is period t for company i. hit denotes
fraction of time spent on acquiring human capital in period t for agent i and A
human-capital-augmenting technology coefficient. H̄ i here, however, denotes raw
human capital capacity such as manual labor for ith agent, which can be obtained
without any human capital obtaining effort . For instance, people who possess raw
human capital only should be able to accomplish simple task like housekeeping and
mowing.
Meanwhile, there exists a second type of capital, say political capital in this
framework, which is generated by
Qit+1 = B(λH̄ i +Qit)qit (3)
where Qit denotes political capital and qit the fraction of time spent on investing
political capital accumulation for agent i at time t. B is the political accessibility co-
efficient, which denotes fairness and openness of the public policy decision-making
process. A higher B represents a more inclusive political institution. Raw labor
with a multiplier λ is also introduced into the function of political capital accu-
mulation, which is consistent with a reasonable assumption that the company with
more people should have a large capacity of political endowment. Examples of po-
litical capitals could vary under different political and economic institutions (see
Acemoglu (2012)’s definition of intrinsic and extractive intuition). For instance, po-
litical capital includes lobbying power, dominance of media, political contributions
for countries with intrinsic institutions. On the contrary, for extractive intuitions,
bribery amount, the relationship with political entity leaders or dictators could be
widely regarded as political capital. In our framework, political capital plays a
crucial role in realized profit function through output redistribution while human
capital affects profit function through contribution to higher technology efficiency.
Without loss of generality, total time endowment within one period is set as 1
for all agents. Consequently, the remaining time for company i to do production in
9
period t is calculated as
eit = 1− hit − qit (4)
and the raw profit is set by
Y it = C(H̄ i +H i
t)ett (5)
where Y it is the raw profit level and C represents Hicks-neutral technological progress.
The realized profit is as follows.
P it = Y it [1 + θ ln(
QitQ∗t
)] (6)
where θ denotes the political influential level, which is the amount under government
intervention and regulation. In a hypothetical society with government intervention
level θ = 0, it is intuitive and straightforward that each agent will choose qit = 0,∀i, t
since acquiring political capital is nothing but wastes of time contributing to dis-
counted profit level. Q∗t denotes political beneficiary threshold , which is the me-
dian political capital level with zero realized government intervention gain or loss.
Agents with stronger political power Qit > Qt are accompanied by positive subsidies
or transferring income. On the contrary, Qit < Qt denotes a net loss. I will raise
two examples under intrinsic and extractive intuitions, respectively, to illustrate the
economic implication of θ. (1) In the countries with intrinsic intuitions, a restau-
rant chain company could donate an increasing amount of political contributions
to support senators or representatives favoring low sales taxes. Once the Act of
reducing tax rate is passed, they will be the beneficiary of both increased sales and
less tax obligation. (2) The corresponding example in those extractive countries is
a different story. The restaurant company could bribe the bureaucrats in food regu-
lation department. The bureaucrats, therefore, will be reluctant to issue restaurant
license to its competitors or simply fine heavily the competitors under some unrea-
sonable excuse such as “low food quality” or “unqualified sanitary condition” even
for highly-qualified restaurant competitors.
Since it is a close economy, the aggregate political redistribution gain for com-
panies with Qi > Q∗ should be equal to the aggregate loss suffering by agents with
Qi < Q∗. ∑i
Y it =
∑i
P it =∑i
Y it [1 + θ ln
QitQ∗t
], ∀t (7)
And the median political capital level Q∗t is also determined by the above equation.
10

For instance, if all agents have the same raw profit level Y it and the distribution of
political capital follows log-normal distribution lnN(µ, σ2), the Q∗t will be exactly
eµ since lnQitQ∗t
remains symmetric.
The Ehrlich & Lui’s (1997) framework makes similar assumptions on the con-
sumption function, but it suffers from the following weakness and could be eliminated
in our firm-level profit-based approach. Firstly, with θ high enough, those agents
with low political capital should have a negative profit level during that particular
period, which is consistent and ubiquitous in those developing economies. However,
in Ehrlich & Lui’s (1997) approach, their model did not wipe out the possibilities
of a negative consumption level, leading to inappropriate and unconvincing conclu-
sion. Secondly, it is more rational to assume that profits instead of consumptions
suffer from linear-form extraction gain/loss. The linear tax-consumption relation-
ship is not consistent with permanent income hypothesis while in our approach the
linear-type tax-profit approach is in conform with the hypothesis.
The state variables in this framework are H it and Qit and choice variables are
hit and qit, for i ∈ I and t = 0, 1, .... Consequently, we could have the following two
Euler Equations.
eit+1 =(1 + rt+1)(1 + θ ln
QitQ∗t)
A(1 + θ lnQit+1
Q∗t+1
)(8)
andH̄ i +H i
t
H̄ i +H it+1
=θQ∗t+1B(λH̄ i +Qit)
A(1 + θ lnQit+1
Q∗t+1
)(9)
Where H it+1 = A(H̄ i + Ht)ht We have reach out the policy function of deter-
mining ht if the politically influential level θ > 0
hit =
Xit+1
H̄i+Hit− H̄ i
A(H̄ i +H it)
(10)
Where
Xit+1 =
θQ∗t+1B(λH̄ i +Qit)
A(1 + θ lnQit+1
Q∗t+1
)(11)
The economic meaning of those two policy functions is intuitive. The marginal
profit gain from production alone should be equal to the discounted marginal profit
gain for investing in human capital for the future periods, which itself is equivalent
to the discounted marginal profit obtaining political capital to seek additional tax
11

bracket/income transfer gain and/or avoid redistribution penalty loss.
If there did not exist government fiscal policy or any business intervention,
θ = 0. In this case we will have only one policy function with respect to human
capital investment choice. It is meaningless to invest any political capital as the
marginal profit contribution of political capital is nothing but negative number. In
this case,
hit+1 = 1− 1 + rt+1
A, ∀t (12)
(i) Equilibrium I: no human capital accumulation. Notice the natural constraint
0 ≤ ht ≤ 1. When A ≤ 1 + rt, the rational choice of human capital investment
ht = 0, denoting a zero human-capital-accumulation economy. The human capital
technology level remains at a low level so that the raw labor production efficiency
outweighs human capital investment, leading a stagnant economic growth situation.
Assuming flat interest rate term structure rt ≡ r, the value of a corporate is fully
determined by the initial raw human capital endowment, say H̄ i.
V (H̄ i) =
∞∑t=0
CH̄ i
(1 + r)t=CH̄ i(1 + r)
r(13)
which is quite similar to the traditional discount cash flow pricing model.
(ii) Equilibrium II: Decreasing human capital growth.
In this case, we assume 1 + rt < A < 2rt. By assuming initial political capital
endowment H0 = H̄ i and flat term-structure rt ≡ r, ∀t, we have Ht+1 = A(H̄ +
Ht)(1− 1+rtA ). The human capital for each period is calculated as
H it =
H̄ i((2A− 2r − 3)(A− r − 1)t −A+ r + 1
)A− r − 2
,∀t (14)
The value for an agent with intial human capital H̄ under flat term structure rt ≡
r, ∀t is
V (H̄) =∞∑t=0
1
(1 + r)tPt
=∞∑t=0
C(r + 1)1−t(H̄((2A−2r−3)(A−r−1)t−A+r+1)
A−r−2 + H̄
)A
=CH̄(r + 1)2(2r + 1)
Ar(2(r + 1)−A)
(15)
The value of the stock is a finite number with human capital Ht decreasing each
12

period by approximately 1− (A− 1− r) (where A− 1− r is less than 1) percent.
From the expression of the agent value, we could derive without difficulty that
∂V (H̄)∂H̄
> 0, meaning stock value increases with a large initial (raw) human capital.
From this point of view, corporation with initial larger number of workers should
be accompanied by a larger share price. ∂V (H̄)∂C = constant > 0, representing linear
positive contribution of Hicks-neutral technology progress.
Meanwhile, the marginal share price on human-capital-accumulating technology
progress is positive.
dV
dA=
2CH̄(r + 1)2(2r + 1)(A− r − 1)
A2r(A− 2(r + 1))2> 0 (16)
Although a higher A could lower current proportion of production, the invest-
ment on future human capital accumulation contributes positively to the aggregate
discounted profit level with a higher production efficiency for the periods after.
At the same time, the second derivative with respect to A is also positive.
d2V
dA2= −
2CH̄(r + 1)2(2r + 1)(3A2 − 6A(r + 1) + 4(r + 1)2
)A3r(A− 2(r + 1))3
= −2CH̄(r + 1)2(2r + 1)
(3(A− (1 + r))2 + (r + 1)2
)A3r(A− 2(r + 1))3
> 0
(17)
The positive second-level differential means the human-capital accumulation
technology progress can accelerate intrinsic value of a firm. This result explains why
human capital enhancing technology plays a more productive role than production
technology in boosting share values. Besides contribution to production efficiency,
human capital accumulation technology itself, such as a faster self-studying search
engine like Google or an efficient online learning platform like Coursera, could lift
future human capital accumulation speed, resulting in even higher production tech-
nology. In the field of theoretical physics, Albert Einstein, standing on the accom-
plishment of Newton’s theoretical framework, was able to step forward to make the
world-changing contribution by developing the theory of relativity.
Similar to the traditional model, ∂V∂r < 0 and ∂2V∂r2
> 0 (proof is in the appendix
A1 & A2), indicating a diminishing firm value with respect to increase in interest
rate at a decreasing scale. A high interest hurts the value of a corporation through
not only decreasing the present value of future profit, but reducing the incentive for
future human capital investment.
(iii) Equilibrium III: Increasing human capital growth with finite share value.
13

This equilibrium happens when 2 + r < A < 2(1 + r). Most of the properties in
Equilibrium III is the same as Equilibrium II. The only difference is that the human
capital accumulation growth rate is positive for each period, which is still slower
than the growth of interest discount rate ((1 + r)t), forming a finite company share
price.
(iv) Equilibrium IV: Increasing human capital growth with unbounded share
price.
When human capital technology is high enough, i.e. A ≥ 2(1 + r), S(H̄) =∞.
This is equivalent to the case g > r in the discounted cash flow with growth model.
In this case, the approximate growth rate for human capital and profit level are
A−1− r, which even exceed the interest discount rate ((1+r)t), yielding an infinite
share price.
Figure 1: The relationship between firm value, human-capital-augmenting technol-ogy and interest rate
Figure 1 reflects the relationship between firm value, human-capital-augmenting
technology and interest rate when we normalizing C = 1 and H̄ = 1. Figure 2 shows
the case when interest rate equals 0.25 to provide a sectional view of share value.
14

There is a sudden jump at the threshold point A = 1.25 when shifting from Equilib-
rium I to Equilibrium II. Surpassing the critical point switches the economic growth
pattern from producing with raw labor to human capital accumulation. Figure 3
shows the case of A = 1.5 how firm value diminishes with interest rate at a decreasing
scale.
Figure 2: Firm value when r = 0.25
Figure 3: Firm value when A = 1.5
15

3 Equilibrium under political intervention
Now we switch to the case when the politically influential coefficient θ is not
zero. Different from Daron Acemoglu and James Robinson’s dichotomous defini-
tion of intrinsic and extractive institution, B and θ depict institutional differences
through continuous function. While, it is without any controversies that North Ko-
rea accounts for extractive institutions while the South is intrinsic, it is hard to judge
without any ambiguity whether Thailand’s institution is intrinsic or not. Allowing
continuous changes leave more room for picturing differences between countries’
regimes.
Define Sit =QitQ∗t
as the relative social status for agent i in period t. In the steady
state of hit and qit under constant inter-temporal relative social status assumption,
we have the following equilibrium conditions.
hie + qie =A− (1 + r)
A(18)
andH̄ i +H i
t
H̄ i +A(H̄ i +H it)h
ie
=θQ∗t+1B(λH̄ i +Q∗tS
ie)
A(1 + θ lnSie)(19)
where hie, qie, e
ie, S
ie are the steady state of hit, q
it, e
it, S
it respectively. And a flat
term structure rt ≡ r is assumed. Let τ = argmint hit, q
it, e
it, S
it all enter steady
state. With the recurrence definition of H it and Qit the following expressions can be
reached out.
H it = (H i
τ +AH̄ ihieAhie − 1
)(Ahie)t−τ − AH̄ ihie
Ahie − 1(20)
and
Qit = (Qiτ +BλH̄ iqieBqie − 1
)(Bqie)t−τ − BλH̄ iqie
Bqie − 1(21)
There exists three cases under the natural constraint of A ≥ 1 + r
(i) Equilibrium I. (Stagnant human capital accumulation whereHt cannot grow)
When A ≤ 2+r, we have hie <1A , ie. Ahie < 1. In this case hit keeps decreasing with
respect to t and consequently the steady state human capital accumulation hie = 0
and Hei = 0. With equation (19) we could have Q∗t+1 is also at its steady state Q∗e,
where Q∗e is the median agent’s equilibrium political capital and H̄ is the median
agent’s initial raw human capital endowment.
θQ∗eB(λH̄ +Q∗e)
A= 1 (22)
16

So we reach out the expression of Q∗e
Q∗e =−θBλH̄ +
√(θBλH̄)2 + 4AθB
2θB(23)
where
q∗e =Q∗e
BλH̄ +BQ∗e(24)
under the condition1
q∗e≤ A− 1− r
A(25)
ie
A >1 + r
1− qie(26)
It is straightforward to show that the relative social status of agent i in each period
is the ratio of raw human capital H̄ i for ith company to median raw human capital
endowment H̄.
Si0 = Si1 = ... = Sie = ... =H̄ i
H̄(27)
with Qi0 = λH̄ i and Qit+1 = B(λH̄ i + Qit)qie = B(λH̄ i + Qit)q
ie = −BλH̄iqie
Bqie−1for
∀t ≥ τ .
We could show that dq∗edθ < 0 (in the Appendix A3). Recalling θ denotes marginal
redistribution power between different social status, the equilibrium time effort to
accumulate political capital decreases with θ increases when there are no human
capital accumulation.
In this case, the after-redistribution profit is
P it = CH̄ i(1− qie)(1 + θ lnH̄ i
H̄) (28)
and the share value for the median company under stagnant equilibrium when en-
tering the steady state is
Vθ(H̄) =
∞∑t=0
CH̄ i(1− qie)(1 + θ ln H̄i
H̄)
(1 + r)t=CH̄ i(1− qie)(1 + θ ln H̄i
H̄)(1 + r)
r(29)
Clearly the value of firm under stagnant equilibrium is higher under larger ex-
ogenous Hicks-neutral production technology C, political-capital accumulation tech-
nology B, initial human capital endowment H̄ i and lower interest rate r. The most
remarkable result in this equilibrium, however, is that dVθdθ > 0, which means a higher
17

social unequal level could lead to a higher firm/stock value when firms only use raw
labor but no human capital to conduct production.
For the non-median corporation with relative social status Si, the policy func-
tion for determining qie is as follows.
θQ∗e(λH̄i +Qie) = A(1 + θ lnSie) (30)
where
qie =Qie
BλH̄ +BQie(31)
.
With the tool of comparative static analysis, it could be demonstrated that
dqiedSie
< 0 and dQiedqie
> 0 (proof in Appendix A4), which is consistent with the definition
of Sit that higher-rank agent has more political capital and devotes more time in
accumulating political resources.
The share value of the firm with relative class level Si is
V Si
θ =
∞∑t=0
CH̄ i(1− qie)(1 + θ lnSi)
(1 + r)t=CH̄ i(1− qie)(1 + θ lnSi)(1 + r)
r(32)
In the Appendix A5 we could demonstrateV S
i
θ
dSi> 0 if and only if B > 1.
North Korea, to some extent, could be a suitable example depicting this equilibrium.
The marginal gain from accumulating political capital exceeds marginal loss from
relinquished production time for the sake of political capital accumulation. In this
case, upper class has a far better agent value than lower class. For a rational agent,
the reasonable choice is to make social status as high as possible. In North Korea’s
example, closely following the dictator seems to be the only rational choice for all
agents, by fair means or foul.
Mathematically, it is also valid whereV S
i
θ
dSi< 0 when B < 1. However, since we
can hardly find any corresponding example in modern society, we will not consider
this possibility.
Equilibrium I is stable.
(ii) Equilibrium II and III. (Increase in human capital accumulation)
As Equilibrium I could fail to depict the real world for most countries in 21st cen-
tury, we switch to the Equilibrium II where exists steady growth in human capital
accumulation. The condition Ah > 1 is sufficient to guarantee the existence of
18

Equilibrium II. With Equation (19) and (20), it could be reached out that
limt→∞
H̄ i +H it
H̄ i +H it+1
=1
Ahie(33)
We rewrite equation (19),
(A− r − 1
A− qie)θQ∗t+1B(λH̄ i +Q∗tS
ie) = 1 + θ lnSie (34)
From the above equation it could be found Qit is bounded and we should have at
the equilibrium state
limt→∞
Qti =BλH̄ iqie1−Bqie
(35)
when
B <1
qie(36)
which means the political-capital accumulation speed is slow in this equilibrium. If
Q∗t is replaced with q∗t , then
(A− r − 1
A− qie)
BλH̄ iqie1−Bqie
B(λH̄ i +BλH̄ iqie1−Bqie
) =Sieθ
+ Sie lnSie (37)
with
0 ≤ qie
<
1
B, if
1
B≤ A− r − 1
A
≤ A
A− r − 1, if
1
B>A− r − 1
A
(38)
We have two cases with different democracy level B.
Equilibrium II (Democratic Equilibrium): When 1B ≤
A−r−1A , i.e. B ≥
AA−r−1 , for higher class agents with Sidem ≥ 1, no matter what θ is, there exists one
unique equilibrium state {qidem, hidem, eidem}. For lower class agents with Sidem < 1, if
and only if θ ≤ − 1lnSidem
, there exists one unique equilibrium state {qidem, hidem, eidem}.
For all 0 < Sidem <∞, we have
(a) (w.r.t social status)∂qidem∂Sidem
> 0,∂hidem∂Sidem
< 0,∂eidem∂Sidem
= 0
(b) (w.r.t. political influence coefficient)∂qidem∂θ < 0,
∂hidem∂θ > 0,
∂eidem∂θ = 0
(c) (w.r.t. to democracy level)∂qidem∂B < 0,
∂hidem∂B > 0,
∂eidem∂B = 0
(d) (w.r.t how raw human capital impacts initial political endowments)∂qidem∂λ < 0,
∂hidem∂λ > 0,
∂eidem∂λ = 0
19

(e) (w.r.t. human capital accumulation coefficient)∂qidem∂A < 0,
∂hidem∂A > 0,
∂eidem∂A <
0
(f) (w.r.t. interest rate)∂qidem∂r > 0,
∂hidem∂r < 0,
∂eidem∂r > 0
Proof is in Appendix B1.
In the democratic case (B high enough) a unique equilibrium could be reached
with relative small proportion of allocation on political capital and large on human
capital accumulation (comparing to Equilibrium III Authoritarian Case in the
following context). In our benchmark model human capital is the only accelera-
tor of long-term economic growth. Property (a) indicates that political advantaged
agents invest less in human capital than in political capital because marginal profit
from investing an additional unit of political capital is higher. It is demonstrated in
property (b) that the country with large political influence (θ) should enjoy a higher
prosperity level. Most low-rank agents in the social rank pyramid respond to high
political influence by reducing inefficient political capital investment, leading to an
increase in human capital stock. The most remarkable property is that the growth
level strictly increases with respect to democracy level. Different from Acemoglu and
Robinson’s dichotomous definition of institution (intrinsic and extractive), we adopt
political capital accumulation speed (B) to capture the democracy level, which is
allowed to be continuous in our approach. From property (c), it is explicitly stated
without ambiguity that human capital accumulation is positively related to the in-
clusiveness of political institution. The economic intuition of property (d) could
be better interpreted as labor union. Recalling the definition of political capital
accumulation, λ is a good indicator reflecting the strength of union. Property (d)
demonstrates that countries with high union power is accompanied by high human
capital investment level. Property (e) and (f) is the natural extension of previous
deduction in the previous content of this article, where human capital investment
increases with high human-capital-augmenting technology and low interest rate con-
dition.
In Figure 4 we simulate the Democratic Equilibrium with B = 2, H̄ i = 1, λ = 1,
A = 5, r = 0.1.
When B is not high enough, say B < AA−r−1 , the following authoritarian equi-
librium is reached out.
Equilibrium III (Authoritarian Equilibrium) When 1B > A−r−1
A , i.e. B <
AA−r−1 , there are two equilibrium states.
20

Figure 4: Democratic Equilibrium: the relationship between q and θ
(i) Equilibrium IIIG (Good Authoritarian Equilibrium) {qiautg, hiautg, eiautg}
when (a) Siaut ≥ 1, θ ≥ θ(Saut) or (b) Siaut < 1 , θ(Saut) ≤ θ ≤ − 1lnSiaut
, where θ(Siaut)
is a threshold depending on Siaut. The property of good authoritarian equilibrium
is the same as Equilibrium II (Democratic Equilibrium) {qidem, hidem, eidem}
(ii) Equilibrium IIIB (Bad Authoritarian Equilibrium) {qiautb, hiautb, eiautb}
when (a) Siaut ≥ 1, θ ≥ θ(Saut) or (b) Siaut < 1 , θ(Saut) ≤ θ ≤ − 1lnSiaut
, where the
threshold function θ(Siaut) is the same as good equilibrium case. When we compare
good equilibrium {qiautg, hiautg, eiautg} with bad equilibirium {qiautb, hiautb, eiautb}, we
have
qiautg ≥ q∗ ≥ qiautb, hiautg ≤A− r − 1
A− q∗ ≤ hiautb, eiautg = eiautb =
1 + r
A(39)
where
0 < q∗ =A− r − 1
2A+B +Br −AB<A− r − 1
A<
1
B(40)
21

and following 6 properties.
(a) (w.r.t social status)∂qiautb∂Siaut
< 0,∂hiautb∂Siaut
> 0,∂eiautb∂Siaut
= 0
(b) (w.r.t. political influence coefficient)∂qiautb∂θ > 0,
∂hiautb∂θ < 0,
∂eiautb∂θ = 0
(c) (w.r.t. to democracy level)∂qiautb∂B > 0,
∂hiautb∂B < 0,
∂eiautb∂B = 0
(d) (w.r.t how raw human capital impacts initial political endowments)∂qiautb∂λ > 0,
∂hiautb∂λ < 0,
∂eiautb∂λ = 0
(e) (w.r.t. human capital accumulation coefficient)∂qiautb∂A > 0,
∂hiautb∂A indeter-
mined,∂eiautb∂A < 0
(f) (w.r.t. interest rate)∂qiautb∂r < 0,
∂hiautb∂r indertermined,
∂eiautb∂r > 0
Proof is in Appendix B2.
In the authoritarian case, there exist two equilibrium. One is called “good”
authoritarian equilibrium while the other is “bad”. The characteristics of good au-
thoritarian equilibrium is the similar to democratic one. More prestigious firms
invest more in human capital but not political resources. A larger political influ-
ence coefficient leads to an increasing human capital accumulation effort while the
enhancement of democratic level improves human capital condition. Typical coun-
tries staying in this authoritarian “good” equilibrium include Singapore, Qatar and
United Arab Emirates. On the other hand, “bad” authoritarian equilibrium has
very different characteristics. Examples could be Cambodia, Russia and Indonesia.
The equilibrium investing in political capital increases with decreasing social ranks,
where firms lack of political capital have to put much effort in political capital accu-
mulation to avoid being exploited thoroughly. All agents respond to an increasing
level of political influence coefficient θ by throwing more time spent on political
investments, which is exactly contrary to the democratic and authoritarian “good”
equilibrium. Property (c) demonstrates that the increasing democracy level B in
“bad” authoritarian equilibrium could make the whole economy worse with less hu-
man capital accumulation. The democracy reform of Soviet Union under president
Mikhail Gorbachev could be a good example reflecting this property. Unless the im-
provement could switch bad authoritarian equilibrium to good or democratic one,
the incomplete democracy reform itself could stimulate agents in the economy to
quit investment in human capital and turn back to invest in political capital.
22
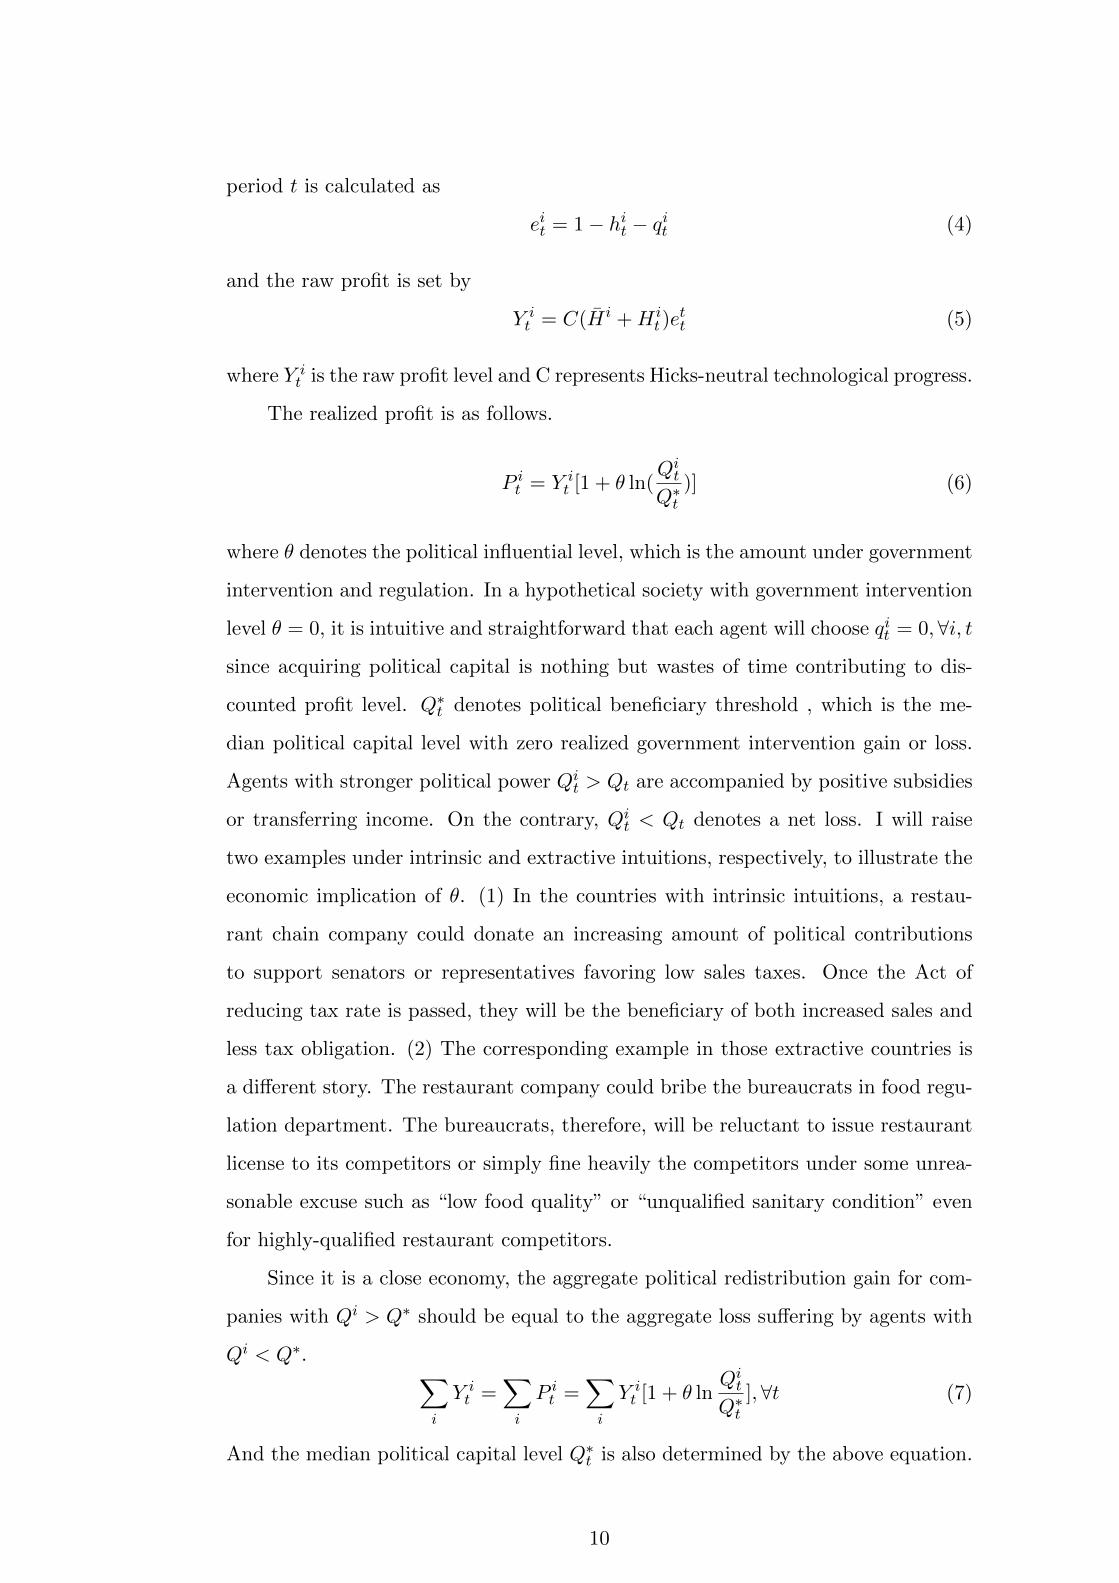
In Figure 5 we simulate the Authoritarian Equilibrium with B = 1, H̄ i = 1,
λ = 1, A = 5, r = 0.1.
Figure 5: Democratic Equilibrium: the relationship between q and θ
Then the question comes what is the condition for a country to stay in good
authoritarian equilibrium or bad one. First, it depends on the peer choice. If
most companies within the same class remain in a bad one, the rest within their
cohort could not have much choices other than following the majority. Second, the
choices among various classes are intertwined with each other, making the choice
within one class highly depend on others. In most cases, if the dictator chooses
low-human-capital and high-political-capital states, the rest entities in the economy
have to devote a dominating proportion of time to allocating political capital to
escape exploitation losses. Third, the level of political capital threshold could have
deterministic impact on the choice between good and bad authoritarian equilibrium.
In the country like United Arab Emirates, millions of immigrants who could never
achieve permanent residency work diligently in Dubai and Abu Dhabi, lowering
23

local political beneficial threshold Q∗. The differences of immigration policy partly
explain why United Arab Emirates stays in the good authoritarian equilibrium while
Vietnam with fewer immigrants is in the bad one.
4 Case Study
Equilibrium I
In Equilibrium I, there is no human capital accumulation because A ≤ 2 + r.
This describes the situation in many least developed countries, where political insta-
bility, prevalence of human rights invasion and ongoing warfare drive up the discount
rate to a level so high that any substantial human capital accumulation becomes not
worthwhile. This equilibrium most likely depicts the case in those least developed
countries such as North Korea, Syria and many Sub-Saharan countries. In Middle
East Asian and Sub-Saharan countries that are without centralized political author-
ities, citizens cannot be certain about what the social order will be like in the near
future and therefore, cannot commit themselves to making long-term investment
in any education or training. In North Korea, although there exists a centralized
government, the inflation rate has remained at high level varying between 30% to
triple digits. At the same time, North Korean citizens lack most of basic human
rights such as basic education, which yields a relatively small A (human capital ac-
cumulation technology coefficient). In our model, these two factors combined trap
the country in economic stagnancy despite a centralized political authority.
Equilibrium II
When A ≤ 2+r and B ≥ AA−r−1 , countries fall into the status of Equilibrium II,
which largely reflects the reality in democratic nations since B is the political access
coefficient. Democratic countries here refer to countries that are politically inclusive
and where the access to political power is generally open and fair to everyone.
United States is definitely a good example since everyone can acquire political capital
through various channels, such as military service, advocacy work and community
service. The election process involves almost all citizens and have a high level of
procedural transparency. Others countries that qualify for this category include
United Kingdom, Canada, Australia, and developing democratic countries including
Brazil and India.
Within the same country, companies enjoying more abundant stock of political
capital will choose to invest more in political capital while companies that rank
24

lower in relative political capital stock will invest more in human capital according
to Equilibrium II property (a). This deduced property is in conformity with our
observations that at an initial stage, small companies focus on its core competency
and technology and when they grow bigger, they start to participate more actively
in industrial standard establishment and seek more connections with policy makers
and regulators. Although they can still invest a great deal in human resource, on
a relative scale they mostly allocate more resource in public relations and politics
compared to at initial stage of their businesses.
If we examine across countries with distinct political environment, investment
in political capital decrease or human capital investment increases with respect to B
or θ increase. United States, in our modeling, enjoys a high level of both B and θ,
and it has been investing a huge amount in human capital. While B describes how
easy political capital is accessible to everyone, theta means how influential compa-
nies can exert this political power. The property indicates that when it is easier to
gain and execute political capital (B and θ is larger) countries invest more human
capital. This might be somehow counter-intuitive but it is in fact reasonable if we
think about it. United States actually has a higher B and theta compared to Brazil
and India. Why? Because in the United States, electoral process and policy making
are much more transparent and routine. For example, in 1995, Congress passed the
Lobbying Disclosure Act (LDA) that defined the term “lobbyist” as “any individual
who is employed or retained by a client for financial or other compensation for ser-
vices that include more than one lobbying contact.”, and all legal documents of this
sort make political activity a smoother and more standardized process manageable
and accessible to all market participants. In this case, companies do not have to
engage in illegal activities or wander around grey legal and policy arena to accu-
mulate and execute political power and therefore, choose to invest more “effort” in
human capital. California has been the heart of Democratic states due to Demo-
crat’s favourable policies on immigrants and regulation freedom. Since 2008, the
Internet firms, software companies, computer manufacturers and data processors
that comprise Silicon Valley have delivered more than 172 million dollars in cam-
paign contributions for federal elections, according to data compiled by the Center
for Responsive Politics. This amount is not as much if we look at another case in
India. In 2013, Indian government launched an investigation on the allegations that
Wal-Mart had bribed officials in New Delhi to gain access to India’s lucrative retail
25

market, amount of which is disclosed at around 25 million dollars. Assertions that
lobbying is tantamount to bribery are common in India, reflecting that the coun-
try’s legal and policy ambivalence towards the practice is not formally regulated.
As a result, endemic corruption slows down the development in India and impedes
investment in technology and human capital. Brazil shares a similar story and is
thus deeply sunk in distress due to corruption and bribery scandals.
Equilibrium IIIG
In both Equilibrium IIIG and IIIB, countries who have the property of B <
AA−r−1 are classified into “authoritarian” regimes. In the case of Equilibrium IIIG,
authoritarian countries enjoy similar resource allocation strategy in human and po-
litical capital to countries in Equilibrium II. However, if authoritarian countries
unfortunately fall into Equilibrium IIIB, the properties can change massively and
generally witness much more investment in political capital rather than human cap-
ital. In reality, we can find only a few countries satisfying these characteristics,
including Singapore and Qatar. Constitutionally, Singapore is a parliamentary re-
public with a Westminster system of unicameral parliamentary government. How-
ever, as People’s Action Party has been in control since Singapore’s independence,
this country is mostly regarded as an authoritarian if not autarky. Qatar is known
as an absolute monarchy. However, both Singapore and Qatar are among the richest
countries: Singapore has GDP per capita of more than 50,000 US dollars and Qatar
more than 70,000 US dollars.
There are two factors playing a major part in drawing countries to either equi-
librium. The first factor is Q∗, the politically influential threshold. Note that both
Singapore and Qatar have large population of foreign workers. Singapore has 1.4
million foreign workers equivalent to 25% of total population. Qatar is notorious of
its exploitation of migrant workers which construct more than 90% of its popula-
tion. High percentage of migrant workers lowers countries’ Q∗ level, which means
that for most companies established by citizens with political rights, they receive ex-
tra benefits aside from their own production. Migrant workers provide products and
services generating bonus revenues to citizens through government income-transfer
such as taxes. The second factor that drives authoritarian countries into this equi-
librium rather than Equilibrium IIIB is the result of choices made by the majority
of companies at similar Q levels, which was ultimately decided by the highest polit-
ical class of the societies. For example, under the system of meritocracy forged by
26

renowned First Prime Minister Lee Kuan Yew, Singapore government was highly ef-
fective and introduced legislation giving the Corrupt Practices Investigation Bureau
(CPIB) great power to conduct arrests, search, call up witnesses, and investigate
bank accounts and income-tax returns of the suspected officials. The choice of curb-
ing investment in political power made by the leader is equivalent to a strong pull
to the good equilibrium for the authoritarian country. Similar in Qatar, the gov-
ernment has streamlined its regulations regarding business practices and engaged
in reforms from above that have liberalized the Qatar’s economy and increased its
strength and viability, which makes it among the highest performing countries in the
Middle East and North Africa. The initial “choice” from the highest-ranked political
leaders also play a major part in securing the countries on the “good” equilibrium
together with the factor of Q∗.
Equilibrium IIIB
Equilibrium IIIB reflects authoritarian countries who unfortunately stay with
the “bad” equilibrium. Typical countries include many of those in South Asia such
as Cambodia and Bangladesh, in Middle Asia such as Tajikistan and Kyrgyzstan,
and in Africa such as Uganda and Kenya. In this status, citizens put more efforts
in acquiring political power than human capital, although their human capital still
grows very slowly compared to countries in Equilibrium I stagnant economy where
human capital deteriorates over time. The properties of this equilibrium are exactly
opposite to Equilibrium IIIG. Within the same country, companies enjoying more
abundant stock of political capital will choose to invest less in political capital.
If we examine across countries with distinct political environment, investment in
political capital increase or human capital investment decreases with respect to B
or θ increase. The property indicates that when it is easier to gain and execute
political capital (B and θ is larger), countries invest less human capital.
These contrary properties relative to democratic equilibrium provide a possible
explanation on why issues can emerge if authoritarian countries, without changing
their political regimes, directly copy some specific policies from United States. For
example, Unites States’ legalizing lobbying activities, which is clearly the action to
increase B and θ in our model, might never take place in authoritarian countries,
because political leaders are aware of the disastrous consequences that could result
from this policy shift: all will choose to invest as much as possible in political capital
and the economy will suffer. Instead, political leaders in authoritarian countries
27

usually advocate anti-corruption moves and exert all efforts to crack down nepotism
and bribery although these actions are futile for most of time. In these authoritarian
countries, if autocrats imprudently decide to adopt more politically inclusive policies
such as legalizing lobby activities and granting more policy-making influence to
companies, their own political power might be eroded and the country will be kicked
off on the path towards a politically inclusive country if B becomes larger than AA−r−1
which is condition for countries to stay in Equilibrium II. Acemoglu in his book
(2012) has also reached similar conclusions that autocrats choose to stay autocrats
because making the regime politically or economically inclusive will result in the
deprivation of their own power.
Transitional Status
Like any theoretical models, the listed equilibrium cannot fully describe all coun-
tries in the world. Many countries, however, are in the transitional status somewhere
in between these equilibrium discussed. For example, China, being identified as an
“authoritarian” regime, has witnessed fast economic growth during past decades
of reform and opening up economic policy. However, its political inclusiveness has
not been improved at the same scale of economic policy reform. There are three
directions China might fall onto: Equilibrium II, Equilibrium IIIG and Equilibrium
IIIB.
To reach Equilibrium II, China needs to switch to a regime more politically
inclusive just like the democracy reform Taiwan experienced during 1980s after
Kaohsiung Incident. This requires politically-influential upper class to relinquish
a substantial political power and liberate political capital market, and therefore,
considerably increase B to a level higher than AA−r−1 . This without doubt a depriva-
tion of political upper class’s vested interest. The process can be extremely bumpy
and might cause painful turbulence to China’s economy. The number of countries
who enjoy a sustainable growth by human capital accumulation in Equilibrium IIIG
are relatively limited compared to Equilibrium I. We have only found Singapore,
Qatar and maybe the United Arab Emirates who are successful in economic growth.
Common characteristics among them include: 1. The size of their economies is small,
which simplifies the process of streamlining regulations regarding business practices
and any liberalization schemes; 2. Their economies depend heavily on migrant work-
ers. China is an economy with much more complicated properties including regional
development difference, rural-urban divide, aging societies and homogeneity of labor
28

force (few immigrants). Therefore if China is to progress towards Equilibrium IIIG,
there might not be proper role-models to follow. If China fails to transition into
Equilibrium II or IIIG, the only option left in our model is IIIB, the equilibrium
for most of the underdeveloped nations now where economic development is largely
restrained under a stable authoritarian regime.
5 Concluding Remarks
This paper has explored different ways nations can develop. By finding stable
statuses under assumptions of parameters, we have identified theoretical develop-
ment patterns for stagnant countries, politically inclusive countries and authoritarian
countries. For politically inclusive countries, there exists only one equilibrium and
the share of resource allocation to human capital depends on how effective political
capital can influence production redistribution and the politically beneficial thresh-
old. For authoritarian countries, unlike mainstream argument that their economic
growth is most likely unsustainable, our modeling result suggests that it is possible
for those countries to enjoy long-lasting economic development as well if they hap-
pens to stay with the “good” equilibrium given proper political and policy nudges.
We believe these results to be important for understanding why nations succeed and
provide a theoretical framework where practical policy-making can be built on.
This article also sheds light on future research in political and development
economics. The precise calibration and estimation of political accessibility index B
and political influence parameter θ is beyond further research, which is somehow
different from current widely-used democracy or corruption index. At least from
Equilibrium IIIG we know there are more than one way towards long-term economic
prosperity. But what is the initial motive for authoritarian countries like Singapore,
Qatar leaning to high human capital and low political capital investment? For
example, what drives Singapore to enact immigrant-friendly policy thus lowering
the local political beneficial threshold Q∗ so that it could have more chance getting
close to good authoritarian equilibrium? Could the size of economy play a part? Or
it is simply because Singapore is lucky enough to have Cambridge First Class Honor
graduate Lee Kuan Yew as its founding father while unfortunate for Philippines to
have rapacious Ferdinand Marcos. This, of course, calls for future works.
29

Appendix
A1. The proof of ∂V∂r < 0.
∂V
∂r=CH̄(r + 1)
(−A
(4r2 + r − 1
)+ 4r3 + 4r2 − 2r − 2
)Ar2(A− 2(r + 1))2
≤CH̄(r + 1)
(−2(1 + r)
(4r2 + r − 1
)+ 4r3 + 4r2 − 2r − 2
)Ar2(A− 2(r + 1))2
=CH̄(r + 1)(−2r(1 + 3r + 2r2)
Ar2(A− 2(r + 1))2
< 0
(41)
given 1 + r < A < 2(1 + r)
A2. The proof of ∂2V∂r2
> 0.
∂2V
∂r2= −
2CH̄(A2(2r3 + 1
)+ 2A(r − 2)(r + 1)2 + 4(r + 1)3
)Ar3(A− 2(r + 1))3
= −2CH̄
((1 + 2r3)(A+ (−2+r)(1+r)2
2(1+2r3))2 + (1+r)3(12−8r−5r2+31r3)
4(1+2r3)
)Ar3(A− 2(r + 1))3
> 0
(42)
given 1 + r < A < 2(1 + r)
A3. The proof of dq∗edθ < 0.
We take the total differentiation of
θQ∗eB(λH̄ +Q∗e) = A (43)
we have
Q∗eB(λH̄)dθ + θB(λH̄ + 2Q∗e)dQ∗e = 0 (44)
dθ
dQ∗e= −θB(λH̄ + 2Q∗e)
Q∗eB(λH̄)< 0 (45)
Noticedq∗edQ∗e
=BλH̄
(BλH̄ +BQ∗e)2> 0 (46)
Use the chain rule we havedq∗edθ
=dq∗edQ∗e
dQ∗edθ
< 0 (47)
30
A4. Proof of dqiedSie
> 0 and dqiedQie
> 0
We take the total differentiation of
θQ∗e(λH̄i +Qie) = A(1 + θ lnSie) (48)
we have
θQ∗edQie =
Aθ
SiedSie (49)
We could havedQiedSie
=A
Q∗eSie
> 0 (50)
NoticedqiedQie
> 0 (51)
Use the chain rule we havedqiedθ
=dqiedQie
dQiedθ
> 0 (52)
A5. Proof ofdV S
i
θ
dSi> 0 when B > 1 and
dV Si
θ
dSi< 0 when B < 1 where
V Si
θ =
∞∑t=0
CH̄ i(1− qie)(1 + θ lnSi)
(1 + r)t=CH̄ i(1− qie)(1 + θ lnSi)(1 + r)
r(53)
we only need to show ddSie
(1− qie)(1 + θ lnSi)<=>
0 if B<=>
1
Notice
d
dSie(1− qie)(1 + θ lnSi)
=dSiedQie
d
dQie(1− qie)(1 + θ lnSi)
=dSiedQie
d
dQie(1− Qie
BλH̄ i +BQie)(θQ∗e(λH̄
i +Qie)
A)
=dSiedQie
Q∗eθ(Qie +Hλ)
(BQie
(BQie+BH̄iλ)2− 1
BQie+BH̄iλ
)A
+Q∗eθ
(1− Qie
BQie+BH̄iλ
)A
=dSiedQie
(−1 +B)Q∗eθ
AB
<=>
0
(54)
31
if and only if B<=>
1 since dSiedQie
> 0. The statement is proved.
B1. Proof of Equilibrium II
First we prove a Lemma.
Lemma. Under B ≥ AA−r−1 and 0 ≤ qidem < 1
B , we have AB−A−B−Br ≥ 0 and
A− r − 1−Aqidem > 0.
AB −A−B −Br ≥ 0
⇔ AB −Br −B ≥ A
⇔ B ≥ A
A− r − 1
(55)
and
A− r − 1−Aqidem > 0
⇔ qidem <A− r − 1
A
This is because qidem <1
B≤ A− r − 1
A
(56)
Lemma is proved.
With
(A− r − 1
A− qidem)
BλH̄ iqidem1−Bqidem
B(λH̄ i +BλH̄ iqidem1−Bqidem
) =Sidemθ
+ Sidem lnSidem (57)
we define
LHS(qidem) = (A− r − 1
A− qidem)
BλH̄ iqidem1−Bqidem
B(λH̄ i +BλH̄ iqidem1−Bqidem
) (58)
Notice LHS(0) = 0 and limqidem→1BLHS(qidem) =∞, then we show
dLHS(qidem)
dqidem> 0
dLHS(qidem)
dqidem= −
B2H̄ i2(A(1 + (−2 +B)qidem)− (1 +Bqidem)(1 + r))λ2
A(−1 +Bqidem)3
= −B2H̄ i2λ2(qidem(AB −A−B −Br) + (A− r − 1−Aqidem))
A(−1 +Bqidem)3
> 0
(59)
The last inequality is due to Lemma and Bqidem < 1
we define
RHS(θ, Sidem) =Sidemθ
+ Sidem lnSidem (60)
32

If Sidem ≥ 1, with any θ ≥ 0, we have RHS(θ, Sidem) ≥ 0. Thanks to Intermediate
Value Theorem, we could show there exists a unique qidem ∈ [0, 1B ) to make the
LHS = RHS. If Sidem < 1, when θ < − 1lnSidem
, RHS < 0, the equilibrium does not
exist; when θ ≥ − 1lnSidem
, RHS ≥ 0, it exists a unique equilibrium qidem ∈ [0, 1B )
SincedLHS(qidem)
dqidem> 0 for qidem ∈ [0, 1
B ), we have
dqidemdRHS
> 0 (61)
and with dRHSdSidem
> 0 and dRHSdθ < 0 we have
∂qidem∂Sidem
> 0 and∂qidem∂θ < 0. Under
qidem + hidem = A−r−1A , we could reach out
∂hidem∂Sidem
< 0,∂hidem∂θ < 0,
∂eidem∂Sidem
= 0,
∂eidem∂θ = 0,
By calculating the total differetiation of LHS and rearraning terms, we have
∂qidem∂B
=2qidem(1 +A(−1 + qidem) + r)
B[qidem(AB −A−B −Br) + (A− r − 1−Aqidem)]< 0 (62)
The inequality is because of Lemma. So∂hidem∂B > 0,
∂eidem∂B = 0.
Similarly we have
∂qidem∂λ
= −2qidem(−1 +Bqidem)(1 +A(−1 + qidem) + r)
λ[qidem(AB −A−B −Br) + (A− r − 1−Aqidem)]< 0 (63)
So∂hidem∂λ > 0,
∂eidem∂λ = 0.
And∂qidem∂A
=qidem(−1 +Bqidem)(1 + r)
A[qidem(AB −A−B −Br) + (A− r − 1−Aqidem)]< 0 (64)
and∂eidem∂A = − r+1
A2 < 0. With constraint hidem+qidem+eidem = 1, we have∂hidem∂A > 0.
Similarly we could demonstrate∂qidem∂r > 0,
∂hidem∂r < 0,
∂eidem∂r > 0
B2. Proof of Equilibrium III
First we prove another Lemma*.
Lemma*. Under A > 1 + r, B < AA−r−1 and 0 ≤ qiautb < A
A−r−1 , we have
2A+B +Br −AB > A and thus 0 < q∗ = A−r−12A+B+Br−AB < A−r−1
A .
33

0 < q∗ =A− r − 1
2A+B +Br −AB<A− r − 1
A
⇔ 2A+B +Br −AB > A
⇔ AB −Br −B < A
⇔ B <A
A− r − 1
(65)
Lemma* is proved.
we define
LHS(qiautb) = (A− r − 1
A− qiautb)
BλH̄ iqiautb1−Bqiautb
B(λH̄ i +BλH̄ iqiautb1−Bqiautb
) (66)
Notice LHS(0) = 0 and LHS( AA−r−1) = 0. While
dLHS(qiautb)
dqiautb
=−B2H̄ i2λ2(qiautb(AB − 2A−B −Br) + (A− r − 1))
A(−1 +Bqiautb)3
⇒
> 0 if 0 < qiautb < q∗
< 0 if q∗ < qiautb <A− r − 1
A
(67)
Define
RHS(θ, Siaut) =Siautθ
+ Siaut lnSiaut (68)
If Siaut ≥ 1 and θ(Siaut) ≥Siaut
LHS(q∗)−Siaut lnSiautor if Siaut < 1 and
SiautLHS(q∗)−Siaut lnSiaut
≤
θ(Siaut) ≤ − 1lnSiaut
, there exists two equilibrium states with qiautg ≤ q∗ ≤ qiautb that
makes LHS = RHS under Intermediate Value Theorem.
The properties of {qiautg, hiautg, eiautg} are the same as {qidem, hidem, eidem} while prop-
erties of {qiautb, hiautb, eiautb} opposite {qidem, hidem, eidem} with similar demonstration
procedure in 2A.
34

References
Acemoglu, Daron, and James Robinson. Why nations fail: The origins of
power, prosperity, and poverty. Crown Business, 2012.
Ansolabehere, Stephen, John M. De Figueiredo, and James M. Snyder.
“Why is there so little money in US politics?.” The Journal of Economic Per-
spectives 17.1 (2003): 105-130.
Antrs, Pol, Luis Garicano, and Esteban Rossi-Hansberg. Offshoring in a
knowledge economy. No. w11094. National Bureau of Economic Research,
2005.
Antrs, Pol, and Davin Chor. “Organizing the global value chain.” Econometrica
81.6 (2013): 2127-2204.
Antras, Pol. “forthcoming, Grossman-Hart (1986) Goes Global: Incomplete
Contracts, Property Rights, and the International Organization of Production.”
Journal of Law and Economics.
Bai, Jie, et al. “Firm Growth and Corruption: Empirical Evidence from Vietnam.”
(2016).
Barro, Robert J. Economic growth in a cross section of countries. No. w3120.
National Bureau of Economic Research, 1989.
Becker, Gary S. “A theory of competition among pressure groups for political
influence.” The Quarterly Journal of Economics (1983): 371-400.
Becker, Gary S., and Kevin M. Murphy. “The division of labor, coordination
costs, and knowledge.” Human Capital: A Theoretical and Empirical Analysis
with Special Reference to Education (3rd Edition). The University of Chicago
Press, 1994. 299-322.
Becker, Gary S., Kevin M. Murphy, and Robert Tamura. “Human capital,
fertility, and economic growth.” Human Capital: A Theoretical and Empirical
Analysis with Special Reference to Education (3rd Edition). The University of
Chicago Press, 1994. 323-350.
Cooper, Michael J., Huseyin Gulen, and Alexei V. Ovtchinnikov. “Cor-
porate political contributions and stock returns.” The Journal of Finance 65.2
(2010): 687-724.
Del Monte, Alfredo, and Erasmo Papagni. “Public expenditure, corruption,
and economic growth: the case of Italy.” European journal of political economy
17.1 (2001): 1-16.
35

Ehrlich, Isaac, and Francis T. Lui. “Bureaucratic corruption and endogenous
economic growth.” Journal of Political Economy 107.S6 (1999): S270-S293.
Faccio, Mara, Ronald W. Masulis, and John McConnell. “Political connec-
tions and corporate bailouts.” The Journal of Finance 61.6 (2006): 2597-2635.
Faccio, Mara. “Politically connected firms.” The American economic review 96.1
(2006): 369-386.
Gibbs, Jack P., and Walter T. Martin. “Urbanization, technology, and the
division of labor: International patterns.” American sociological review (1962):
667-677.
Hansen, Wendy L., and Neil J. Mitchell. “Disaggregating and explaining
corporate political activity: Domestic and foreign corporations in national pol-
itics.” American Political Science Review 94.04 (2000): 891-903.
Hillman, Amy J., Asghar Zardkoohi, and Leonard Bierman. “Corporate
political strategies and firm performance: Indications of firm-specific benefits
from personal service in the US government.” Strategic Management Journal
20.1 (1999): 67-81.
Kang, David C. Crony capitalism: Corruption and development in South Korea
and the Philippines. Cambridge University Press, 2002.
Kim, Jongwook, and Joseph T. Mahoney. “Property rights theory, transac-
tion costs theory, and agency theory: an organizational economics approach to
strategic management.” Managerial and decision economics 26.4 (2005): 223-
242.
Krueger, Anne O. “The political economy of the rent-seeking society.” The Amer-
ican economic review 64.3 (1974): 291-303.
Limongi, Fernando, and Adam Przeworski. “Political regimes and economic
growth.” Journal of Economic Perspectives 7.3 (1993): 51-69.
Mauro, Paolo. “Corruption and growth.” The quarterly journal of economics
(1995): 681-712.
Milyo, Jeffrey, David Primo, and Timothy Groseclose. “Corporate PAC
campaign contributions in perspective.” Business and Politics 2.1 (2000): 75-
88.
Nguyen, Thuy Thu, and Mathijs A. Van Dijk. “Corruption, growth, and
governance: Private vs. state-owned firms in Vietnam.” Journal of Banking &
Finance 36.11 (2012): 2935-2948.
36

Pellegrini, Lorenzo, and Reyer Gerlagh. “Corruption’s effect on growth and
its transmission channels.” Kyklos 57.3 (2004): 429-456.
Posner, Richard A. “Economic approach to law.” Tex. L. Rev. 53 (1974): 757.
Rodriguez-Clare, Andres. “The division of labor and economic development.”
Journal of Development Economics 49.1 (1996): 3-32.
Romer, Paul M. Human capital and growth: theory and evidence. No. w3173.
National Bureau of Economic Research, 1989.
Song, Zheng, Kjetil Storesletten, and Fabrizio Zilibotti. “Growing like
china.” The American Economic Review 101.1 (2011): 196-233.
Stigler, George J. “The Division of Labor is Limited by the Extent of the Market.”
The Journal of Political Economy (1951): 185-193.
Stigler, George Joseph. The citizen and the state: Essays on regulation. Vol.
834. Chicago: University of Chicago Press, 1975.
Useem, Michael. The inner circle: Large corporations and the rise of business
political activity in the US and UK. Oxford University Press, 1986.
Yang, Xiaokai, and Dingsheng Zhang. “Endogenous structure of the division
of labor, endogenous trade policy regime, and a dual structure in economic
development.” Annals of Economics and Finance 1.1 (2000): 211-230.
Yang, Xiaokai, and Jeffrey D. Sachs. Economic development and the division
of labor. John Wiley & Sons, 2008.
37