why would i use this tool? how would i use this tool ... · why would i use this tool? the fishbone...
TRANSCRIPT
Why would I use this tool?
The Fishbone (Cause and Effect) Diagram is a tool to help your team create a common understanding of potential sources (root causes) that most significantly contribute to the problem in question. It is used when the team needs to identify the many different causes of a problem and to focus improvement efforts on true causes rather than symptoms. The Fishbone Diagram is very useful for sorting contributing factors into easily understood categories.
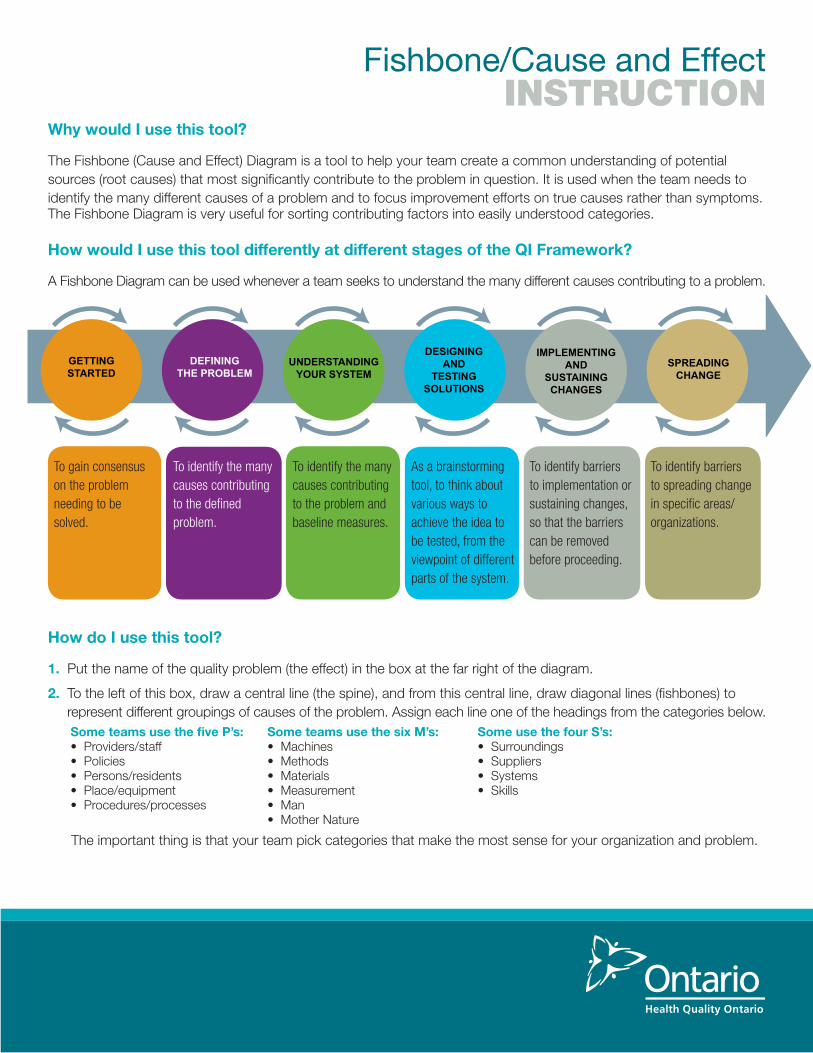
How would I use this tool differently at different stages of the QI Framework?
A Fishbone Diagram can be used whenever a team seeks to understand the many different causes contributing to a problem.
How do I use this tool?
1. Put the name of the quality problem (the effect) in the box at the far right of the diagram.
2. To the left of this box, draw a central line (the spine), and from this central line, draw diagonal lines (fishbones) to represent different groupings of causes of the problem. Assign each line one of the headings from the categories below.
The important thing is that your team pick categories that make the most sense for your organization and problem.
To gain consensus on the problem needing to be solved.
To identify the many causes contributing to the defined problem.
As a brainstorming tool, to think about various ways to achieve the idea to be tested, from the viewpoint of different parts of the system.
To identify barriers to spreading change in specific areas/organizations.
To identify barriers to implementation or sustaining changes, so that the barriers can be removed before proceeding.
To identify the many causes contributing to the problem and baseline measures.
Fishbone/Cause and Effect INSTRUCTION
Some teams use the five P’s:• Providers/staff• Policies• Persons/residents• Place/equipment• Procedures/processes
Some teams use the six M’s:• Machines• Methods• Materials• Measurement• Man • Mother Nature
Some use the four S’s: • Surroundings• Suppliers• Systems • Skills
3. Ask your Quality Improvement Team members to silently and independently identify different causes and to write each one on a sticky note.
4. Place each sticky note in the correct category.
5. Team members may take any cause and draw a line and more branches off the line to link it to other factors that contribute to the cause. 6. Have the team continue identifying causes until it cannot identify any additional causes.
How do I analyze a Fishbone?
Once the Fishbone is completed, the QI Team will want to grapple with what the information means. Useful questions include:
• Are there causes on every “spine” or in every category? Are there gaps? What do these gaps tell us about how we see our system?
• What causes are observable and have (or can have) data that shed light on their prevalence?
• What causes reflect opinion only, and what is the underlying cause of this opinion? What is the impact of people thinking this way?
• What causes are contributing the most to the effect?
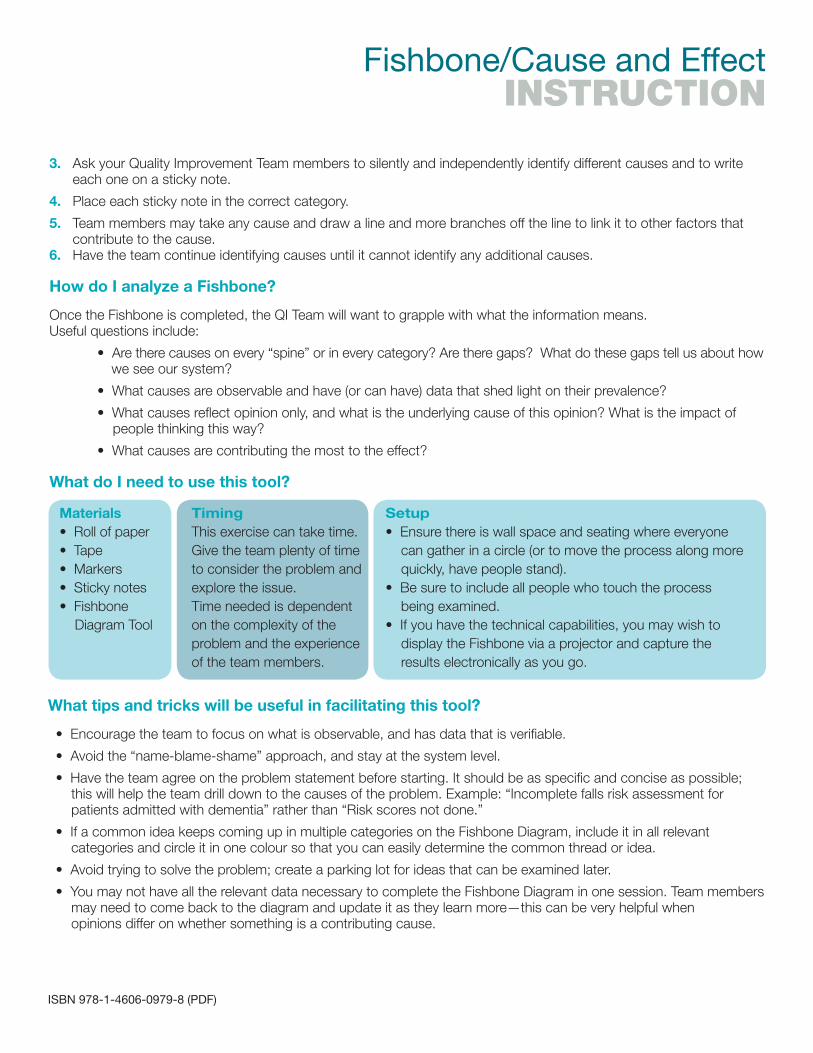
What do I need to use this tool?
What tips and tricks will be useful in facilitating this tool?
• Encourage the team to focus on what is observable, and has data that is verifiable.
• Avoid the “name-blame-shame” approach, and stay at the system level.
• Have the team agree on the problem statement before starting. It should be as specific and concise as possible; this will help the team drill down to the causes of the problem. Example: “Incomplete falls risk assessment for patients admitted with dementia” rather than “Risk scores not done.”
• If a common idea keeps coming up in multiple categories on the Fishbone Diagram, include it in all relevant categories and circle it in one colour so that you can easily determine the common thread or idea.
• Avoid trying to solve the problem; create a parking lot for ideas that can be examined later.
• You may not have all the relevant data necessary to complete the Fishbone Diagram in one session. Team members may need to come back to the diagram and update it as they learn more—this can be very helpful when opinions differ on whether something is a contributing cause.
Fishbone/Cause and Effect INSTRUCTION
Materials • Roll of paper • Tape • Markers • Sticky notes• Fishbone Diagram Tool
Timing This exercise can take time. Give the team plenty of time to consider the problem and explore the issue. Time needed is dependent on the complexity of the problem and the experience of the team members.
Setup• Ensure there is wall space and seating where everyone can gather in a circle (or to move the process along more quickly, have people stand).• Be sure to include all people who touch the process being examined.• If you have the technical capabilities, you may wish to display the Fishbone via a projector and capture the results electronically as you go.
ISBN 978-1-4606-0979-8 (PDF)