wi seminar series - cottingham & butler · 2019-11-19 · wi seminar series cottingham &...
TRANSCRIPT

Presented By |
WI Seminar Series
Cottingham & Butler
March 14-15, 2017

Employee Benefits

Revolutionizing Healthcare
Through Transparency
Employer Presentation

Company Overview
Who We Are
HST is at the forefront of Value-
Based Payments (VBP). Since
2009, we have helped reduce our
clients healthcare costs.
What We Do
We provide pricing solutions
that reduce healthcare costs for
payers and consumers.
We bring pricing accountability
through transparency.
Our Goal
We are revolutionizing healthcare
through pricing transparency.
Through value-based payments
we are bending the cost curve
downward.
Headquarters
We are located
in Irvine, California.
© 2016 HST All Rights Reserved | Confidential | page 4

VBP Facts About HST
2%
Push
Back
15Pricing
Databases
43States
Covered
98%
Acceptance
Rate
LESS
THAN
© 2016 HST All Rights Reserved | Confidential | page 5
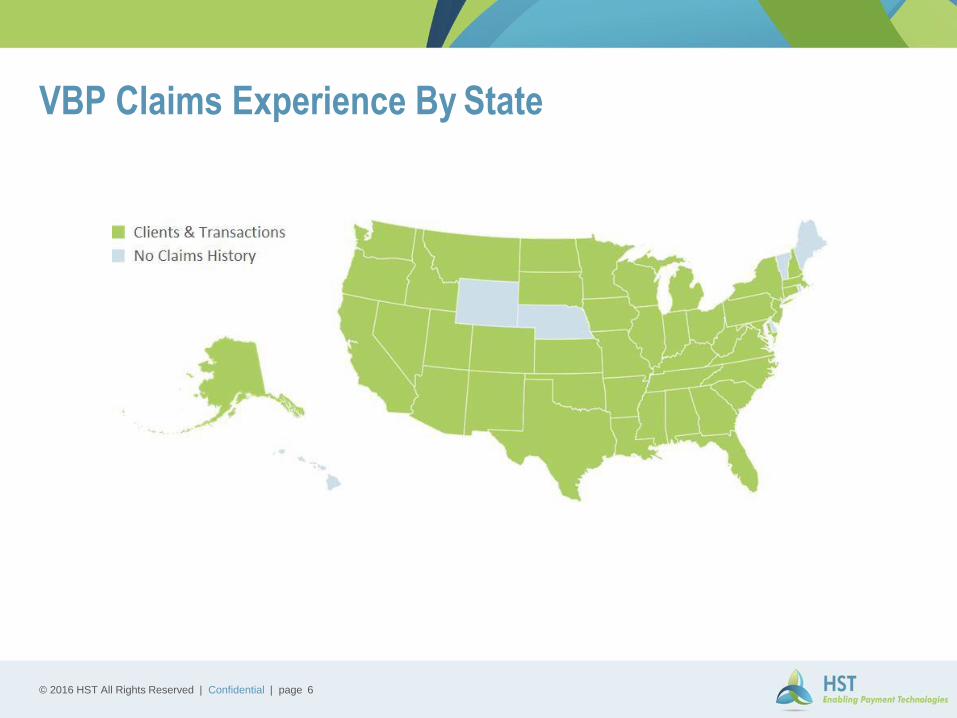
VBP Claims Experience By State
© 2016 HST All Rights Reserved | Confidential | page 6

What is Value-Based Payments?
VBP is a reimbursement that uses Medicare and Cost Information to determine the
prevailing price for medical services.
Types of VBP
• Medicare factor equivalent
• VBP Health Plan
• Cost Plus
• Procedure specific
• Consumer driven
Quality
• Frequency of services as a leading indicator
• Readmission rates – outcomes
• Top hospital evaluation criteria
• High risk procedures and diagnosis
© 2016 HST All Rights Reserved | Confidential | page 7

Client Profile & Situation
• 1200 employees self funded
• 12 months of paid facility claims
• Utilized a BUCAPPO
• No benchmarking or R&C (UCR) language
HST Involvement
• Improved reimbursements using VBP; Medicare
at 140%
• Turnkey solution from pricing databases, plan doc,
prepricing, and consumer app
• Stop-loss rates reduce claims expense andadmin
fees
Case Study
© 2016 HST All Rights Reserved | Confidential | page 8

Employee Experience – I.D. Card
For physicians
A physician network is utilized that has both inand
out-of-network benefits for all physician services
(primary care and specialists).
For inpatient and outpatient claims
For inpatient and outpatient services, you canuse
any facility you choose. VBP is openaccess.
Any procedure that requires use of a medical facility
must be pre-certified at least 7 days prior to service
as indicated on your I.D. Card.
Urgent and emergent care is treated like any other
medical services in that VBP will be applied based
on the plan guidelines.
© 2016 HST All Rights Reserved | Confidential | page 9
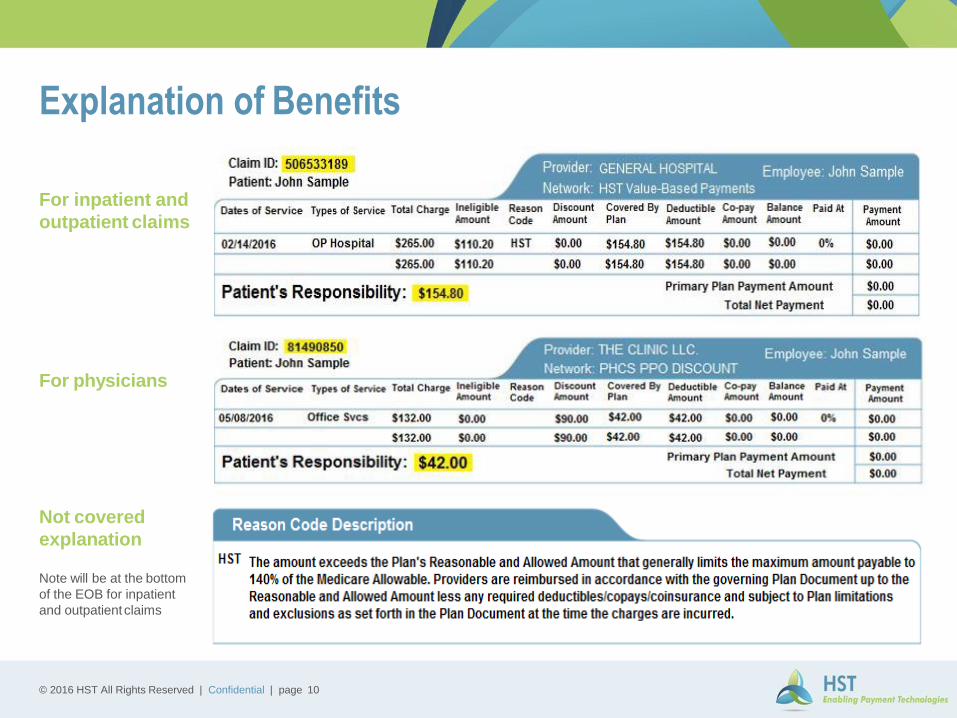
Explanation of Benefits
For inpatient and
outpatient claims
For physicians
Not covered
explanation
Note will be at the bottom
of the EOB for inpatient
and outpatientclaims
© 2016 HST All Rights Reserved | Confidential | page 10

How the VBP Plan Works
*TPA (Third-Party Administrator)
1.Provider calls for pre-
certification
2.Provider is notified of
pre-priced amount for
the service
3.Medical treatment or
services are received
by you or your family
member
4.The provider submits a
bill for services to TPA
for payment
5.TPA remits payment to
the provider based
upon the pre-priced
amount
7.TPA issues an
Explanation of Benefit
(EOB) to you and the
provider
6.You pay deductible and
co-insurance
© 2016 HST All Rights Reserved | Confidential | page 11

Employee Communication Tools
Patient Advocacy Center (PAC)
• Patient advocate to assist in dealing with unexpected
medical costs and verify fair prices on medical
services
HST Connect
• Mobile app offers you 24/7 access to your planinformation, ID Card, eligibility and coverage
Print Campaigns
• Handbook, posters
Member Communication
• Enrollment packet, benefits guide, newsletters and
memorandums
Educational Videos
Sample of open enrollment newsletter
© 2016 HST All Rights Reserved | Confidential | page 12

HST’s Patient Advocacy Center (PAC)
Member
Provider Communications
Inquiries Handled by PAC
Drafts Member Letters
Protects and Guides
Provider
Handles Communications
NegotiatesAgreements
Reviews Plan Language
Explains Reimbursement
Protecting
Members
© 2016 HST All Rights Reserved | Confidential | page 13

Healthcare Pricing Trends
Typical Renewal Inflation
Fully-Insured of 12% vs. Self-Funded of 8% vs. RBP tracking Medicare at 1%.
© 2016 HST All Rights Reserved | Confidential | page 14

Benefits of VBP
Transparency
Increase visibility into healthcare
expenses
Accountability
Gain understanding on
healthcare costs
Sustainability
Maximize your budget with our
sustainable long term value
Predictability
Know what your costs will be,
today and in the future
Value
Bend the cost curve downward
while increasing value
© 2016 HST All Rights Reserved | Confidential | page 15

Why HST?
Fixed fee (PEPM)
versus percentage
of billed charges
Integrate pre-pricing
navigator estimate
at point of
authorization
Balance billing
handled by the
PatientAdvocacy
Center along with
stop loss/MGU
partners
Collaborative approach
versus legalistic and
adversarial
Comprehensive
databases to establish
price to value versus
limited data
Achieves lowest claims
cost by combining
reference pricing, fixed
fees and stop loss
discounts
© 2016 HST All Rights Reserved | Confidential | page 16

Thank You
Revolutionizing Healthcare Through Transparency
Visit Us
Visit our website at
www.hstechnology.com
Contact Us
You can contact us at
800-292-0536
Claim Analysis
To receive a claim analysis,
touch base with us at
© 2016 HST All Rights Reserved | Confidential | page 17

Proprietary and Confidential © 2016 Truveris, Inc. 1
Technology in Pharmacy Management

Truveris Provides Rx Visibility To Key Stakeholders
OUR MISSION
We are on a mission to save
Americans money by
democratizing data &
access across the
prescription drug industry
through technology. We
work with the largest
payers and providers to
develop innovative
solutions that drive
measurable results to our
clients.
1
9
3/8/17 Proprietary and Confidential © 2016 Truveris, Inc.

$375b
2015 2016 2017 2018 2019Source: PWC Health Research Institute: Behind the Numbers 2015 in conjunction with CVS Caremark
2020
$450b
$650bTrend Drivers
• New drugs coming to market faster
• More expensive drugs
• Existing drugs receiving more disease treatment approvals
• Inflation disconnection to typical economicmarket forces
• Aging population and obesity epidemic
Pharmacy Benefits Market Doubling Over Five Years
2
0
3/8/17 Proprietary and Confidential © 2016 Truveris, Inc.

• Once upon a time…
• There was a PrinCesS (PCS)
A PBM Fable
Proprietary and Confidential © 2016 Truveris,
Inc.
6

Why Am I Here?
Proprietary and Confidential © 2016 Truveris,
Inc.
7
• Caveat Emptor
• Market Failure
• Moreover, since asymmetries of information give rise to market
power, and perfect competition is required if markets are to be
efficient, it is perhaps not surprising that markets with information
asymmetries and other information imperfections are far from
efficient.
Joseph Stiglitz, Nobel Prize Lecture, December 8, 2001

2 31Associated Pain Points of Lifecycle Management
Across all lifecycle states, inefficiencies hamper effective business operations. Status quo
processes lack:
• INSIGHT: Granular market intelligence, apples-to-apples financial comparison
• OVERSIGHT: Claim processing errors
• ACCESS: Steps are resource intensive, often exceeding available bandwidth and restricting the ability for
smaller teams to access these critical services
3/8/17 6
Plan
Design
Plan
Vendor
Live Plan
Performance
Cost v. Selection & Monitoring &
Member Impact Evaluation Audit
Proprietary and Confidential © 2016 Truveris, Inc.

Pharmacy Vendor Procurement & Bill Review
3/8/17 7

The Solution: Truveris Platforms Serve All Market Segments
COMPETITIVE QUOTES
• Top pharmacy benefit rates
• Best-in-class legal terms
EASY CONTRACTING
• Software-as-a-Service processes
• No client resources required
OVERSIGHT
• Ongoing bill review
• Financial performance reports Proprietary and Confidential © 2016 Truveris,
Inc.
27

Full RFP | Customizable Process | Vendor Scoring
PBM BIDDING & SELECTION
• Only independent re-pricing adjudication
engine in industry
• View bids in an apples-to-apples
comparison using code based classification
of drugs
• Only platform in industry that shows
blinded leader results to all bidders to drive
competition
• Quantitative and qualitative vendor ranking
within hours of vendor submission
• Average 45 day project completion
Proprietary and Confidential © 2016 Truveris,
Inc.
28

Free PBM Quotes | Competitive Rates | Award in Minutes
PBM BIDDING & SELECTION
• Payers under 3500 lives can benefit from
pre-negotiated rates and scale
• Run pharmacy benefit quotes in under 15
minutes
• View 3-year cost projections
• Simply click to award business
Proprietary and Confidential © 2016 Truveris,
Inc.
29

SaaS | Cloud-hosted | Multi-tenant | Infinitely scalable
PLATFORM CAPABILITIES
• Review Bills Concurrently
• Identify Overcharges
• Maintain Plan Integrity
• Mitigate Fiduciary Liability
• Track Effective Rates
• Enforce Guarantees
• Audit Retrospectively
283/8/17 Proprietary and Confidential © 2016 Truveris, Inc.

Pharmacy Stop Loss
WHO
Self-insured plans with greater than 200 employees or 400 lives
looking for protection against the uncertain costs associated
with providing pharmacy benefits.
WHAT
Truveris has partnered with Swiss Re to offer pharmacy stop
loss that will cap pharmacy spend. This includes specialty
spend and can also be attached to any TruBid or RxChoice
opportunity.
WHY
For fully-insured plans looking to self insure but afraid of
losing the “insurance” aspect, stop loss allows for savings from
self-insuring while maintaining protection. For self-insured
plans concerned about costs, stop loss provides a cap.
Insurance For Self-Insured Plans
293/8/17 Proprietary and Confidential © 2016 Truveris, Inc.

3/8/17 13Proprietary and Confidential © 2016 Truveris, Inc.
Thank You

Risk Management

Presented By |
The Cornerstones of Alternative Risk
Financing & Risk ManagementElliot LePoidevin, Colin Green & Katie Hensley

C&B RISK MANAGEMENT WI TEAM
Elliot LePoidevinSenior Account Executive
Colin GreenSenior Account Executive
Katie HensleyWorker’s Compensation
Specialist

TODAY’S AGENDA
• C&B - Alternative Program Design
• The Traditional Insurance Dilemma
• Alternative Risk Financing Program Design Options
• Safety
• Claims Best Practices

COTTINGHAM & BUTLER – ALTERNATIVE PROGRAM DESIGN

THE INSURANCE DILEMMA
$-
$100,000
$200,000
$300,000
$400,000
$500,000
$600,000
$700,000
$800,000
2012 2013 2014 2015 2016
Premium
Losses
Many companies would be better off not buying insurance and paying their claims out of pocket, but don’t want to take on the
risk of a bad loss year (ie: 2015).

THE INSURANCE DILEMMA
2011 2012 2013 2014 2015
$19.5
$35.1
$63.4
$55.9 $56.6
Annual Property & Casualty Insurer Profit (Billions)

INSURANCE MARKETPLACE VOLATILITY
Combined Ratio = (Incurred Losses + Operating Expenses) / Earned Premiums
110.1%
115.8%
107.5%
100.1%
98.4%
100.8%
92.6%
95.7%
101.0%
99.3%
100.8%
106.3%
102.4%
96.7% 97.2%96.0%
90%
95%
100%
105%
110%
115%
120%
2000 2001 2002 2003 2004 2005 2006 2007 2008 2009 2010 2011 2012 2013 2014 2015
Property & Casualty Industry Combined Ratio

STANDARD/TRADITIONAL INSURANCE
Acknowledgements:
• Pricing is cyclical and based on the market, not individual results.
• The top performing companies subsidize the worst.
• The insurance company retains profit and investment income
Best in class organizations are doing something different
Traditional Insurance Marketplace
Best in Class

ALTERNATIVE RISK FINANCING PROGRAMS

Alternative Risk Financing Program
Design Options

RISK MANAGEMENT
Basic Acknowledgment
• Most losses can be controlled, but some are inevitable
Basic Approach
• Retain losses that are predictable
• Transfer losses that are not – losses catastrophic in nature
• Find the best solution for managing risk over a period of time
• Find the most effective method in reducing the total cost of risk

MEMBER-OWNED GROUP CAPTIVES
• Simply, an insurance company owned by its’ policyholders created to lower the cost of insurance over the long-term by pooling resources.
• Annual premium consists of funds to cover the operations of the captive and funds to pay losses.
• Losses below the captive retention are paid by the members; large losses over the retention are transferred to an insurance company.
• Unused loss funds are returned to each individual member as dividends.
Loss Funds
Operating Costs
Annual Premium
Potential Dividend
Stop Loss Insurance

MEMBER-OWNED GROUP CAPTIVES
Benefits:
• Return of unused loss funds (aka: profit) plus investment income to the member.
• Greater control of costs while still protecting from catastrophe
• Superior claims and safety (TPA/Consultants vs. the Ins. Company)
Considerations:
• Collateral requirements
• Captive structure and performance (NOT all created equal)
• Current partners and selection process
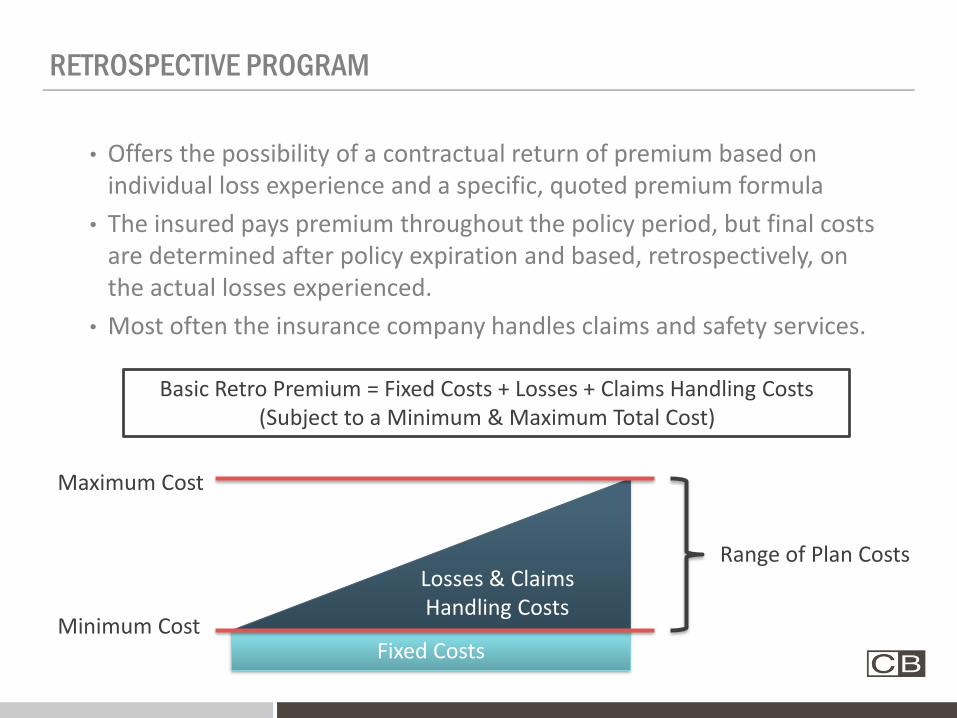
RETROSPECTIVE PROGRAM
• Offers the possibility of a contractual return of premium based on individual loss experience and a specific, quoted premium formula
• The insured pays premium throughout the policy period, but final costs are determined after policy expiration and based, retrospectively, on the actual losses experienced.
• Most often the insurance company handles claims and safety services.
Basic Retro Premium = Fixed Costs + Losses + Claims Handling Costs(Subject to a Minimum & Maximum Total Cost)
Losses & Claims Handling Costs
Fixed Costs
Maximum Cost
Minimum Cost
Range of Plan Costs

RETROSPECTIVE RATING
Benefits:
• Ability to drive down costs relatively quickly
• Alignment between safety and claims practices and cost of risk
• Highly flexible program design (Paid, Incurred, Reduced Pay-In, Lines of Coverage)
Considerations:
• Upside risk can be substantial
• Collateral requirements
• Limited control over claims and safety resources

SELF INSURANCE
• A retention plan in which the insured retains all or a major portion of its own risk.
• The insured contracts with TPA and other administrative partners or, in some cases, handles in-house.
• Typically combined with specific and/or aggregate stop-loss insurance.
Self-Insured Retention
Operating Costs
Stop Loss Insurance
Insured controls claims, safety, compliance and admin.

SELF INSURANCE
Benefits:
• Low fixed/operating costs as minimal risk is being transferred – long-term cost savings maximized.
• High level of control over claims, safety, and administrative components.
• Cash flow benefits
Considerations:
• High volatility in costs
• Administrative requirements
• Compliance with contractual obligations

Insurance Program Design Spectrum
Low Risk High Risk
Risk Appetite/Premium Volatility for each program solution:
Guaranteed Cost
Risk Retained: none
Volatility: low
Cash Flow: low
Security: none
PROS:
No upside risk
Dividend Potential (WC)
Stable cash flow
CONS:
Good losses benefit insurer
Premium affected by mod
Premium up/down based on
losses and market conditions
Group Captive
Risk Retained: moderate
Volatility: moderate
Cash Flow: low
Security: required
PROS:
High dividend potential
Unbundled claims/safety
Interest income on loss funds
Member/Owned benefits
Smoothes insurance cycles
Potential tax advantages
WC/GL/Auto combined
CONS:
Relatively higher fixed costs
Assessment potential
Collateral requirements
Retrospective
Risk Retained: moderate
Volatility: moderate
Cash Flow: low or high
Security: low
PROS:
High return potential
Little or no collateral
Unbundled claims & savings
Dedicated claim adjusters/team
Incurred or Paid Basis
Limited upside exposure
CONS:
Higher aggregate risk
Collateral requirements
Large Deductible
Risk Retained: moderate high
Volatility: high
Cash Flow: low or high
Security: high
PROS:
High return potential
Low fixed costs
Incurred or Paid Basis
Unbundled claims possible
CONS:
Higher collateral requirement
Higher aggregate risk
Collateral can tie to carrier
Self Insurance
Risk Retained: moderate high
Volatility: high
Cash Flow: high
Security: moderate
PROS:
Lowest fixed cost potential
Unbundled claims/safety
Cash flow benefit
No collateral required for
carrier (possible for state)
CONS:
Application for state approval
Upside risk
State by state issue, would
need WC for other states
Assessment Potential
ALTERNATIVE RISK FINANCING

OVERALL CONSIDERATIONS/QUESTIONS
To move to an alternative risk program, you would need to believe:• You can control and prevent the majority of your losses; your good loss
years over time will far outweigh your bad loss years. • You are willing to bet on yourself and assume more risk to receive a greater
reward. • There is a difference in claims handling and safety services and they can
benefit your company when there is buy in from upper management. • You have a long-term view on your business and risk management
To stay in the standard market, you would need to believe:• Your loss experience will get worse over time not better, or your losses are
unpredictable and difficult to control.• Your guaranteed cost premium rates will stay stable and not increase over
time.• You prefer a more conservative approach to handle your insurance that
likely costs more money over time. • You are not in a financial position to accept any ‘upside’ risk

ALTERNATIVE RISK FINANCING PROGRAMS

ALTERNATIVE RISK FINANCING PROGRAMS
Safety & Risk Management
Claims Handling Best
Practices

Four Keys to Effective Safety Program

MANAGEMENT BUY-IN/SUPPORT

GOALS

TRENDING DATA
Major Injury
Minor Injury
Near Misses
Unsafe Behaviors

TRENDING DATA

ACCOUNTABILITY
Main purpose: Establish how the program/culture will be enforced.

ACCOUNTABILITY
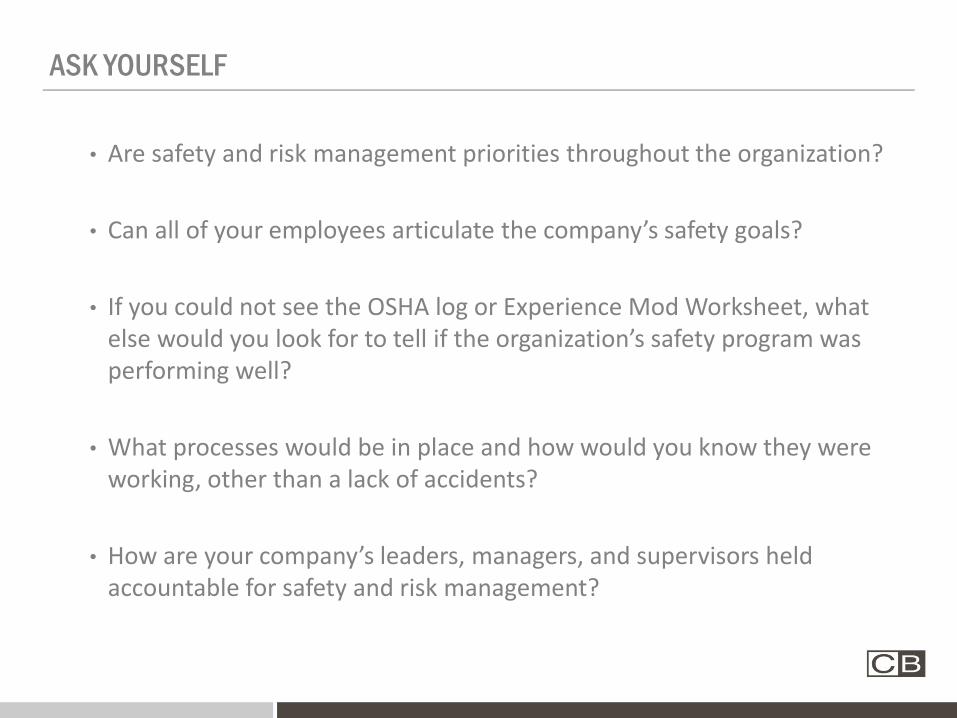
ASK YOURSELF
• Are safety and risk management priorities throughout the organization?
• Can all of your employees articulate the company’s safety goals?
• If you could not see the OSHA log or Experience Mod Worksheet, what else would you look for to tell if the organization’s safety program was performing well?
• What processes would be in place and how would you know they were working, other than a lack of accidents?
• How are your company’s leaders, managers, and supervisors held accountable for safety and risk management?
Presented By |
Claims Philosophy
Katie Hensley, AICWorkers’ Compensation Specialist
DIRECT IMPACT-MOD

COMMUNICATION
• Reduces the likelihood of attorney involvement
• Improves morale
• Speeds up recovery
• Reduces claim costs

UNDERSTANDING THE EMPLOYEE
• Morbidities- Weight- Age- Smoker- Pregnant
• Personality- Mental health
• Claims History/Experience- Professional Claimant/Bad experience…

ACCIDENT INVESTIGATION
• Importance of Documenting/Reporting
• Protects everyone
• How you can help the adjuster (photos, witness statement, red flags…)

RETURN TO WORK
Time off Work Chances of Returning to Work
6 months 50%
1 year 25%
2 years 0-2%

TEAMWORK

QUESTIONS

Thank you for attending!