wic nutrition education demonstration study: child ... · pdf filelesson plan the food guide...
TRANSCRIPT

Nutrition Assistance Program Report SeriesThe Office of Analysis, Nutrition and Evaluation
Special Nutrition Programs Report No. CN-01-WICNECI
WIC Nutrition EducationDemonstration Study:
Child Intervention
United States Food andDepartment of NutritionAgriculture Service
March 2001

Non-Discrimination Policy
The U.S. Department of Agriculture (USDA) prohibits discrimination in all its programs and activitieson the basis of race, color, national origin, gender, religion, age, disability, political beliefs, sexualorientation, and marital or family status. (Not all prohibited bases apply to all programs.) Personswith disabilities who require alternative means for communication of program information (Braille,large print, audiotape, etc.) should contact USDA's TARGET Center at (202)720-2600 (voice andTDD).
To file a complaint of discrimination, write USDA, Director, Office of Civil Rights, Room 326-W,Whitten Building, 14th and Independence Avenue, SW, Washington, DC 20250-9410 or call (202)720-5964 (voice and TDD). USDA is an equal opportunity provider and employer.

WIC Nutrition EducationDemonstration Study:
Child Intervention
Authors:Bonnie RandallKim SpragueDavid B. ConnellJenny Golay
Submitted by: Submitted to:Abt Associates Inc. Office of Analysis, Nutrition and Evaluation55 Wheeler Street USDA, Food and Nutrition ServiceCambridge, MA 02138 3101 Park Center Drive, Room 503
Alexandria, VA 22302-1500Project Director: Bonnie Randall Project Officer: Boyd Kowal
This study was conducted under Contract number 53-3198-4-020 with the Food and Nutrition Service.
This report is available on the Food and Nutrition Service website: http://www.fns.usda.gov/oane.
Suggested Citation:U.S. Department of Agriculture, Food and Nutrition Service, Office of Analysis, Nutrition and Evaluation, WICNutrition Education Demonstration Study: Child Intervention, CN-01-WICNECI, by Bonnie Randall, KimSprague, David B. Connell, and Jenny Golay. Project Officer, Boyd Kowal. Alexandria, VA: 2001.
United States Food andDepartment of NutritionAgriculture Service
March 2001Special Nutrition Programs
Report No. CN-01-WICNECI

Abt Associates Inc. i
Acknowledgments
Any research that takes place in the service delivery world can be completed only with the cooperationand support of at least dozens, often hundreds, and sometimes thousands of individuals. The WICNutrition Education Demonstration Study is no exception to this axiom. We owe a tremendous debtto the hundreds of three- and-four-year-old WIC children who participated in the demonstration and itsevaluation. We are also immensely grateful to their parents and other caretakers who made sure thattheir preschoolers attended the demonstration lesson.
Our debt to the WIC administrators and staff of our two demonstration sites is also a large one. Topreserve the anonymity of these local WIC agencies, we cannot name either the WIC directors, their staffpersons, or the demonstration teachers. We can say that the preschool nutrition education portion of thisdemonstration could not have occurred without their assistance and advice.
We are most grateful for the collaboration and guidance of nutrition educators Laurie Sims, JeannieMacKenzie, and Barbara Mayfield. Breanda Lisi, J.P. Passino, and Janet Tognetti Schiller from theFood and Nutrition Service, USDA, and Mary Kay Fox from Abt also provided expert advice during thedevelopment phases of this nutrition education demonstration. Boyd Kowal and Leslie Christovichoffered astute direction during the final phases of report preparation.
This study was blessed with four devoted child testers, Joyce Burr, Marlys Jordan, Mary Neil, andCourtney Wasden, and one of the best field data collection managers on the face of the earth—CindyKorf.
We are also indebted to several other colleagues: Amy Fowler, who, for many months, was an integralmember of our project team; Barbara Goodson, whose wise counsel improved our statistics and ourprose; and Tracy Olcott and Eileen McEnaney, who are responsible for the excellent production of thisreport.
Our final, and most sincere, thanks go to Jeffrey Wilde, our original project officer at the Food andNutrition Service. His interest and his confidence sustained all of us.

Contents
Acknowledgments . . . . . . . . . . . . . . . . . . . . . . . . . . . . . . . . . . . . . . . . . . . . . . . . . . . . . . . . . . i
Executive Summary
Designing the WIC Preschool Nutrition Education Demonstration
Conclusions
Chapter OneIntroduction . . . . . . . . . . . . . . . . . . . . . . . . . . . . . . . . . . . . . . . . . . . . . . . . . . . . . . . . . . . . . . 1
Overview of the Demonstration . . . . . . . . . . . . . . . . . . . . . . . . . . . . . . . . . . . . . . . . . . . 2Organization of This Report . . . . . . . . . . . . . . . . . . . . . . . . . . . . . . . . . . . . . . . . . . . . . . 5
Chapter TwoThe WIC Preschool Nutrition Education Intervention: Its Design, Implementation,
and Feasibility . . . . . . . . . . . . . . . . . . . . . . . . . . . . . . . . . . . . . . . . . . . . . . . . . . . . . . . . 7Nutrition Education in WIC . . . . . . . . . . . . . . . . . . . . . . . . . . . . . . . . . . . . . . . . . . . . . . 7Nutrition Education for Preschoolers . . . . . . . . . . . . . . . . . . . . . . . . . . . . . . . . . . . . . . . 8Developing the Intervention . . . . . . . . . . . . . . . . . . . . . . . . . . . . . . . . . . . . . . . . . . . . . . 8Developing the Preschool Nutrition Education Test . . . . . . . . . . . . . . . . . . . . . . . . . . . . 13Implementing the Intervention . . . . . . . . . . . . . . . . . . . . . . . . . . . . . . . . . . . . . . . . . . . . 17
Chapter ThreeImpact of the WIC Preschool Intervention . . . . . . . . . . . . . . . . . . . . . . . . . . . . . . . . . . . . . . 24
Sample . . . . . . . . . . . . . . . . . . . . . . . . . . . . . . . . . . . . . . . . . . . . . . . . . . . . . . . . . . . . . . 24Analysis and Test Scoring . . . . . . . . . . . . . . . . . . . . . . . . . . . . . . . . . . . . . . . . . . . . . . . . 27Child Test Results . . . . . . . . . . . . . . . . . . . . . . . . . . . . . . . . . . . . . . . . . . . . . . . . . . . . . . 30
Chapter FourConclusions: Impact of the Demonstration on Children . . . . . . . . . . . . . . . . . . . . . . . . . . 52
References . . . . . . . . . . . . . . . . . . . . . . . . . . . . . . . . . . . . . . . . . . . . . . . . . . . . . . . . . . . . 54
Appendix AResearch on Nutrition Education Theory and Practice
Appendix BLesson PlanThe Food Guide PyramidWIC Nutrition Education Demonstration Study
Appendix CTest of Nutrition KnowledgeEducational Intervention for ChildrenWIC Nutrition Education Demonstration Study
Appendix DResults of Pilot TestingWIC Nutrition Education Demonstration Study
Appendix EObservation ChecklistWIC Nutrition Education Demonstration Study
Appendix FDetailed Tables of Mean Scores and Tests of Statistical SignificanceWIC Nutrition Education Demonstration Study

WIC Nutrition Education Demonstration Study
Executive Summary
The Special Supplemental Nutrition Program for Women, Infants, and Children (WIC) was
established to counteract the negative effects of poor nutrition on the prenatal and pediatric health
of low-income individuals. WIC provides direct nutritional supplementation, nutrition education
and counseling, and increased access to health care and social services to pregnant, breastfeeding,
and postpartum women; infants; and children up to the age of five years. The program is
administered by the Food and Nutrition Service (FNS) of the US Department of Agriculture
(USDA).
To receive WIC benefits, an applicant must be categorically eligible (a pregnant woman or a two-
year-old child, for example); must reside in the State in which the application is filed; must be
income eligible (usually defined as equal to or less than 185 percent of the federal poverty income
guidelines); and at nutritional risk as determined by a competent professional health authority.
Federal regulations specify content and amount of food items in WIC food packages that are
designed for different categories of participants. These prescriptions contain foods that are good
sources of the nutrients most likely to be lacking in the WIC population's diet -�protein, iron,
calcium, and vitamins A and C. The food packages are grounded in the developmental needs of
infants as well as in pediatric recommendations about infant feeding. Food package designers
also incorporated the recommended eating patterns for preschool children and the additional
nutritional requirements of pregnant and breastfeeding women.
Nutrition education is an integral part of WIC and its provision is considered a key WIC benefit.
Federal regulations require WIC service providers to offer participants at least two nutrition
education sessions during each certification period. Certification tends to occur every six months.
State WIC agencies and their local WIC service providers design educational programs that are
appropriate for their participant caseloads. Whatever the delivery mechanism, this education
must stress the relationship between proper nutrition and good health.
In 1994, FNS initiated the WIC Nutrition Education Demonstration Study. The demonstration
had two components: a comparison of the effects of innovative and traditional WIC nutrition
education for prenatal participants; and a study of the feasibility and effectiveness of providing
nutrition education to preschool (three-and-four-year-old) WIC participants. The report

WIC Nutrition Education Demonstration Study
summarized here describes the design and implementation of the child nutrition education
demonstration and presents findings describing the effectiveness of the demonstration.
Designing the WIC Preschool Nutrition Education Demonstration
The developmental phase of the demonstration involved the preparation of two products for use
with three- and four-year-old WIC children: a nutrition education lesson and a child test.
The Preschool Lesson
A key element of the design of this demonstration was the formulation of clear and specific
learning objectives. The three learning objectives for the demonstration incorporated concepts
from the Food Guide Pyramid, a colorful graphic developed by USDA and the US Department of
Health and Human Services to illustrate the recommendations of Dietary Guidelines for
Americans. Two primary factors were taken into account when objectives were defined: the
developmental appropriateness of the goals for preschool WIC children; and the feasibility of
successfully covering the objectives in a thirty-minute, one-time class. In addition, it was
important to create a lesson that could be taught by WIC staff who are unlikely to be trained in
preschool education. The demonstration objectives are listed below.
Objective 1 Food Pyramid
Children will be able to identify the Food Pyramid.
Children will be able to distinguish the different food groups onthe Food Guide Pyramid.
Children will be able to identify and name foods in the foodgroups on the Food Guide Pyramid.
Children will understand that they should eat more food from thebottom segment of the Food Pyramid and less food from the top.
Objective 2 Variety
Children will understand that they need to eat a variety of foodsto stay healthy and grow.
Objective 3 Food Choices
Children will be able to correctly identify "anytime" foods and"sometimes"�foods.
WIC Nutrition Education Demonstration Study
Children will understand that "anytime" foods should be eatenmore often than "sometimes"�foods.
Children will understand that "anytime" foods promote growthand health better than "sometimes" foods.
Working with these objectives, FNS chose to adapt lessons from the Kid's Club curriculum,
developed by child educator Barbara Mayfield. Material was drawn from three Kid's Club
components: variety, the food pyramid, and healthy versus junk foods. The demonstration lesson
involved activities which address a child�s cognitive, affective, and behavioral domains. It also
incorporated different learning strategies such as self-learning, meaningful learning, and concrete
learning. Lesson content was drawn from the principles behind the Food Guide Pyramid.
Children were told how eating well helps them to grow and stay healthy-topics in which they are
interested. Finally, materials were colorful and appealing to capture a child's immediate interest.
The Preschool Test
Designing the test of nutrition knowledge required generating and validating a test composed of
items that are directly related to the educational objectives of the demonstration and that are also
appropriate for the developmental levels of children ranging from thirty-six to fifty-nine months
of age. The nutrition education lesson was limited to thirty minutes; the time for the test was
limited to ten-to-fifteen minutes to ensure that the single contact would last no longer than forty-
five minutes. The time was limited to avoid fatigue in children and to limit additional time
families spent at the WIC agency.
FNS and Abt developed a child test composed of nine items directly related to the educational
objectives identified earlier in this chapter. Test items were constructed to maintain a child�s
interest in a one-to-one interview during a ten-to-fifteen-minute testing period. Pilot-testing
occurred in two stages: the item development stage and the final pilot test stage. The purpose of
the first stage was to establish that children in the target age group could respond appropriately to
test items and that their ability to respond would be enhanced following a brief educational
intervention. During this phase, in which forty-seven children were tested, the nutrition education
lesson was modified, and some test items were added while others were revised or discarded.
The final pilot-testing phase focused on establishing reliability and validity of the overall test as
well as for the items comprising the test. This phase involved fifty-three children: thirty were
WIC Nutrition Education Demonstration Study
pretested and twenty-three were post-tested. Results of the pilot-testing demonstrate that three-
and-four-year-old children in the post-tested group - that is, the children who were tested after
attending the nutrition education lesson -�scored higher on most test items than children in the
pretest group. Item-specific results indicate that the individual test items are valid measures for
preschoolers.
Implementing the Preschool Demonstration
The demonstration took place in two local WIC agencies�Site A and Site B. With grants from
USDA, each demonstration site employed an individual to teach the preschool classes.
Demonstration lessons were offered several times each week during the data collection period
which began in February 1996 and ended in November 1996. Child WIC participants were
scheduled for either morning or afternoon sessions and were tested on the days they attended
classes. Children were randomly assigned to either pretest or post-test. Preschool classes were
scheduled to coincide with WIC certification appointments. Parents completed most certification
activities during the lessons. Children in the pretest group were tested prior to attending nutrition
education; children in the post-test group were tested after the lessons.
The child testers observed fifty-one nutrition education lessons across the two demonstration
sites. Using a standardized observation protocol, specific information about the process and
content of the classes was recorded. Information was collected about session length, attendance,
amount of time devoted to each nutrition topic, disruptions, environmental considerations, and the
quality of interactions between nutrition educators and children.
Very few differences were observed across sites. Attendance, usually two children per lesson,
was the same at both sites. The entire lesson was, on average, six minutes longer at Site B
because, at that agency, the nutrition educator chose to incorporate the snack into the lesson. At
the other agency (Site A), children received snacks after they were told the lesson had ended.
Site B - with longer class times - also experienced more disruptions during lessons because that
agency did not have an available and separate room to assign to the demonstration. We do not
know the effects of these differences on child testing. The lower test scores of Site B may have
been affected by these disruptions. Nonetheless, we found higher post-test scores for children at
Site B.

WIC Nutrition Education Demonstration Study
Impact of the WIC Preschool DemonstrationAs noted earlier, a concern-during-the evaluation’s development phase was minimizing burden on three-
and-four-year-Old WIC participants and their parents. The goal was to design a research approach which
would allow WIC preschoolers to participate as much as their developmental stages permitted. The final
research design was a quasi-experimental design—separate-sample pretest-post-test desigin. Much of the
strength of this design was in its randomization which provided us with equivalent groups of children for
pre- and post-testing. Immediate post-testing of children was another design benefit because observed
effects can more reliably be attributed to the educational intervention which has just occurred. Moreover,
this design provided data for overall and subgroup analyses and also reduced burden on children and their
parents or caretakers. -
Across the two demonstration sites, the final sample was comprised of 497 children who were tested at
two test points. Exhibit E.l contains information on overall sample size by site and by test point. There
were about 10 percent more total tests at Site A than at Site B.
Exhibit-E.1
Sample Size by Test Point by Site
Site A Site B Total
Pretest 133 145 278
Post-test 126 93 219
Total 259 238 497
The random assignment resulted in equivalent groups of WIC children by test point. There were no-
significant differences in age or gender across the groups of children. The average age for all pretested
children was 46 months; for post-tested children, the average age was 47 months.
Child tests were scored using standardized protocols, and item scores were scaled to permit calculation ofa total score for each child test. Using scaled scores, we calculated average (mean) scores by test point,site, age, gender, and race-ethnicity and then compared pretest with post-test scores. Findings arepresented only by site.
WIC Nutrition Education Demonstration Study
At both sites, there were significant differences between test scores for the pretest and post-test
groups (Exhibit E.2). Overall, WIC preschoolers had significantly higher post-test scores than
pretest scores. At post-test, children at Site A correctly answered 48 percent of the items as
compared with 34 percent at pretest; at Site B, children answered 45 percent correctly as
compared with 34 percent. Children, at Site A, who attended the nutrition education lesson
scored 14 percentage points higher on the test of nutrition knowledge than did children tested
before the lesson. At Site B, the difference was 11 percentage points. Analyses by site, age, and
gender suggested that results (mean test scores and pretest-post-test differences) were consistent
across these categories. Four-year-old children had significantly higher test scores at both test
points because four-year-olds are developmentally more advanced than three-year-olds. (Note
that our analyses controlled for the effects of age on test scores.) The correlation between age and
total score was high, accounting for 14 percent of the variation in total score. Analyses of
variance and covariance indicated that test point (pretest versus post-test) and age were the
important predictor variables of child performance.
Item-specific analyses supported the overall findings. Five of the nine test items showed
statistically significant differences at the p < .001 level for pretest-post-test differences; seven
were significant at the p < .05 level. For both three- and four-year-olds, four items showed
statistically significant differences. Three additional items were significant only for four-year-
olds. Again, item-by-item variance analysis indicated that for seven of the nine items, age was
the important predictor of whether or not a child will correctly answer the question.

WIC Nutrition Education Demonstration Study
Exhibit E.2
Mean Total Test Scores for WIC Children by Test Type and by Site
Mean Score for All Children Mean Score by AgeThree Years Four Years
Mean StandardDeviation
Mean Standard Deviation Mean StandardDeviation
PretestSite A 3.73 1.38 3.40 1.13 4.21 1.57
n=133 n=78 n=55
Site B 3.75 1.26 3.55 1.11 4.06 1.42n=145 n=87 n=58
Post-testSite A 5.31*** 2.16 4.19* 1.72 6.39*** 1.99
n=126 n=62 n=64
Site B 4.96*** 1.62 4.19* 1.45 5.72*** 1.43n=93 n=46 n=47
* Difference between pre- and post-test significant at the p<.05 level.*** Difference between pre- and post-test significant at the p<.001 level.
NOTES: Mean is for total score.Highest possible total score is 11.0.Exhibits F.2 and F.3 in Appendix F contain more detailed calculations of these test results.

WIC Nutrition Education Demonstration Study
Conclusions
The objective of this evaluation of the WIC Nutrition Education Demonstration Study was
assessing the viability and effectiveness of a nutrition education intervention for preschool WIC
participants. The findings summarized above indicate that preschool nutrition education may be a
viable strategy for the WIC Program. Overall results are summarized below.
C Nutrition education is feasible for three- and four-year-old children inWIC settings.
C The demonstration's nutrition education lesson improved children'sknowledge (as evidenced in statistically significant differences betweenpretest and post-test scores) about certain nutrition topics such as theFood Guide Pyramid, food groups, and eating food that makes themhealthy and strong.
C Some nutrition education concepts may be too difficult for three- andfour-year-old children to learn. These topics include: eating a variety offoods, selecting companion foods, and identifying "anytime"� foods.
C Short interventions appear to be practical strategies for teaching WICpreschoolers about nutrition.
C More information is needed on the cost and sustainability of preschoolnutrition education in the WIC Program.

WIC Nutrition Education Demonstration Study
1
Chapter One
Introduction
The Special Supplemental Nutrition Program for Women, Infants, and Children (WIC) was established to
counteract the negative effects of poor nutrition on the prenatal and pediatric health of low-income
individuals. A combination of direct nutritional supplementation, nutrition education and counseling, and
increased access to health care and social services is offered to pregnant, breastfeeding, and postpartum
women; infants; and children up to the age of five years. Created in 1972 by an amendment to the Child
Nutrition Act of 1966, WIC is administered by the Food and Nutrition Service (FNS) of the US
Department of Agriculture.
To receive WIC benefits, an individual must meet four conditions. An applicant must be (1) a resident of
the state in which s/he applies for WIC benefits; (2) categorically eligible (a child between the ages of
thirteen and sixty months, for example); (3) income-eligible - most States set income limits as equal to or
less than 185 percent of the federal poverty income guidelines; and (4) at nutritional risk. Determination of
nutritional risk is based on medical or nutritional assessment by a competent professional authority (a
registered nurse or a nutritionist, for example). Nutritional risks include such conditions as anemia, low
weight for height, obesity, and inadequate nutrient intake.
Nutritional Supplementation. To improve the health of program participants, WIC provides
supplemental foods that are good sources of the nutrients most likely to be lacking in the diet of low-income
populations - protein, iron, calcium, and vitamins A and C. In most States, WIC clients receive WIC
vouchers or checks with which they purchase specific food items at participating retail stores. The foods
listed on these vouchers or checks meet the special nutritional requirements of pregnant and breastfeeding
women; take into account the developmental needs of infants; and incorporate the nutrients in recommended
eating patterns for preschool children.

WIC Nutrition Education Demonstration Study
2
Access to Health and Social Services. The local WIC service provider also serves as a link between
participants and appropriate health-care providers or systems. Each WIC agency is charged with assisting
WIC participants to obtain and use preventive health-care services.
Nutrition Education and Counseling. Finally, nutrition education plays a crucial role in the WIC Program
and is viewed as an essential benefit directed toward achieving positive changes in participant knowledge,
attitude, and behavior about food consumption. Federal WIC regulations require WIC service providers
to offer participants at least two nutrition education sessions during each certification period. In WIC,
certifications tend to occur every six months - with the exception of infants who may be certified for twelve
months and prenatal women who may be certified for the duration of pregnancy. While WIC participants
are not required to attend nutrition education, local service providers often schedule nutrition education to
coincide with voucher or check issuance to encourage WIC clients to attend. Education on a variety of
health and nutrition-related topics may be provided in individual counseling sessions, through group classes,
or via films and videos. Whatever the delivery form, education must stress the relationship between proper
nutrition and good health.
Overview of the Demonstration
Although good nutrition has long been recognized as related to optimal growth and development of children,
only recently have we begun to appreciate the importance of teaching young children about good nutrition.
The last twenty years have seen the development of numerous nutrition education projects for preschoolers.
Some of these efforts are federally funded through the Nutrition Education and Training Program (NET)
and Head Start (Contento et al., 1995). These projects have created an expansive body of knowledge
about how preschoolers learn, what they can learn, and the elements of effective nutrition education.
During the past dozen years, at national, State, and local levels, the WIC Program has focused on updating
the content and enhancing the quality of its nutrition education offerings. Considerable emphasis has been
placed on nutrition education for prenatal WIC participants, which includes such topics as smoking
cessation, diet during pregnancy, and breastfeeding. In recent years, a few WIC service providers have

WIC Nutrition Education Demonstration Study
3
offered nutrition education directly to children in addition to educating their parents or other caregivers. In
1994, FNS initiated the WIC Nutrition Education Demonstration Study. The demonstration had two
components: a comparison of the effects of innovative and traditional WIC nutrition education for prenatal
participants; and a study of the viability and effectiveness of providing nutrition education to three-and-four-
year-old WIC participants. The prenatal demonstration is the subject of a separate report. In this
publication, we describe the child nutrition education demonstration and its results.
There is considerable information available on the positive outcomes of teaching preschoolers about nutrition
and its relationship to good health. There is also a curriculum for educating WIC children – Kid’s Club,
a nutrition education curriculum for preschoolers developed by Barbara Mayfield.1 The educational
intervention for this demonstration combined and modified several lessons from Kid’s Club, merging this
information with some new material to create a single, thirty-minute lesson on the Food Guide Pyramid.
Research Design
A concern during the planning phase of this evaluation was minimizing burden on three-and-
four-year-old participants and their parents. We focused on designing a research approach which
would allow WIC children to participate as completely as their levels of development permitted. A key
element was ensuring that the innovative lesson could be easily taught in thirty or fewer minutes. A
second was minimizing total time the child and parent(s) spent in the WIC clinic. The evaluation design
incorporated assistance from WIC staff in scheduling three-and-four-year-old certification appointments
in morning and afternoon clusters so that the project’s child testers could recruit sufficient numbers of
children in local WIC waiting rooms.
1 This curriculum is described and referenced in detail in Chapter Two of this report.

WIC Nutrition Education Demonstration Study
4
Half of these children were randomly assigned to pretesting and were pretested when they were
recruited into the demonstration. All children attended the educational intervention. Then, children who
were not pretested were post-tested.
The final research design is a quasi-experimental design -separate-sample pretest-post-test design
(Campbell and Stanley, 1963).2 The design can be shown as:
Treatment R X O
Control R O (X)
where,
R represents randomized assignment to either pretest or post-test.
2 A true experimental design would require a control group of WIC children who are randomly assigned to that groupand who would not receive the educational intervention but who would be post-tested.
X is the nutrition education intervention for post-tested children.O indicates administration of the child test.(X) is the nutrition education intervention for pretested children.
Much of the strength of this design is in its randomization which provided us with equivalent groups of
children for pre- and post-testing. Immediate post-testing of children was another design benefit because
observed effects can more reliably be attributed to the educational intervention which has just occurred.
Moreover, this design provided data needed for overall and subgroup analyses and also reduced burden
on children and their parents or caretakers.
The Demonstration Sites
The demonstration took place in two large local WIC agencies. These agencies received grants from FNS
to defray the costs of hiring staff to teach the innovative lesson to WIC children. Size was necessarily a
factor in choosing demonstration sites because of the need to enroll and test a significant number of WIC
children in a reasonable amount of time. Child testing began in February 1996 and ended in November
1996.

WIC Nutrition Education Demonstration Study
5
Site A, in a mountain State, is one of three WIC service delivery sites comprising a WIC agency sponsored
by the city-county health department. The character of the town is more suburban than urban due in part
to the presence of a large university. The agency’s total caseload is close to 11,000 persons of which 49
percent are children. The demonstration site accounts for half of the agency’s participants, serving about
2,500 children. Nutrition education for adults is provided in group settings; class times range from twenty
to twenty-five minutes. This service site is open until 7:30 in the evening every Wednesday. Site A had
experimented with Kid’s Club prior to the demonstration. Staff nutritionists objected to some elements of
the curriculum, such as singing and using puppets, so the local Kid’s Club experiment was discontinued.
Site B is entirely urban, located in a downtown medical center in a large Midwestern city. It is one of
twenty-seven service sites in this local WIC agency which provides WIC services to the entire county. The
county WIC caseload is around 20,000 persons; the demonstration site has an active caseload of 4,300
persons of whom 36 percent are children. Adult WIC participants attend group nutrition education classes
which last about twenty minutes. The site has office hours the second Saturday of every month and is open
until 6:00 pm every weekday except Friday. At various times during the past five years, staff nutritionists
have offered family nutrition education classes attended by both parents and children. WIC staff reported
that these classes were very well-received by WIC clients.
Overall, the local agency operating Site B served about twice as many WIC participants as did the local
agency operating Site A. However, at the demonstration sites themselves, Site A had a 16 percent
larger caseload (5,100 persons) than did Site B (4,300 persons). The two sites were similar in their
approach to adult nutrition education. They differed in their racial-ethnic mix. The caseload at Site A
was 90 percent white. At Site B, 80 percent of the caseload was African-American.

WIC Nutrition Education Demonstration Study
6
Organization of This Report
In Chapter Two, we provide the rationale for offering nutrition education to preschoolers. We then
describe the development of the child nutrition education lesson as well as design and validation of the child
test of nutrition knowledge. The chapter concludes with a discussion of site-level implementation of the
demonstration which is partially based on observation data collected by the child testers. The impact of the
intervention is described in Chapter Three. Demographics of the sample are delineated. Test results are
presented for all children as well as for subgroups by age, gender, and site. Test means and item-specific
scores are reported. The final chapter appraises the overall effects of the intervention.

7
Chapter Two
The WIC Preschool Nutrition Education Intervention:Its Design, Implementation, and Feasibility
Developing the nutrition educational intervention for WIC children was an iterative process which
included establishing specific educational goals for the intervention as well as correlating the lesson’s
content and objectives with the items comprising the test of nutrition knowledge. This chapter describes
that process.
Nutrition Education in WIC
Nutrition education is one of WIC’s three primary benefits—the other two are supplemental food and
referrals to health and social services. Some local WIC agencies have offered nutrition education since
the program's inception in 1972. PL 94-105, which, in 1975, made nutrition education an allowable
administrative cost, formally incorporated nutrition education into WIC. In 1978, the role of nutrition
education in the WIC Program was considerably strengthened by PL 95-627 which mandated the
provision of nutrition education to all program participants.
In 1990, FNS issued regulations clarifying the goals of WIC nutrition education. Section 246.11 of these
regulations delineates two broad goals.
Nutrition education should stress the relationship between proper nutrition andgood health with special emphasis on the nutritional needs of pregnant,postpartum, and breastfeeding women, infants, and children under five yearsof age.
Nutrition education should assist the individual who is at nutritional risk inachieving a positive change in food habits, resulting in improved nutritionalstatus and in the prevention of nutrition-related problems through optimal useof the supplemental foods and other nutritious foods.
Local agencies are required to make nutrition education available at no cost to the clients. However,
receipt of food vouchers or checks is not contingent upon attendance at nutrition education. Nutrition
education may be provided directly by local WIC agencies or through agreements with other agencies.
WIC service providers have considerable latitude in choosing the form and content of nutrition education.
They may offer instruction on their choices of health and nutrition topics using appropriate education

WIC Nutrition Education Demonstration Study
8
strategies such as individual counseling, group classes, written materials, videos, or films. WIC nutrition
educators are encouraged to consider the ethnic, cultural, and geographic preferences of participants as
well as their educational and environmental limitations.
For adult participants, FNS regulations require WIC service agencies to offer at least two
nutrition education sessions during each six-month certification period. The regulations also say that,
when possible, nutrition education is to be offered directly to child participants as well as or in addition
to their parents and caretakers.
Nutrition Education for Preschoolers
Health-care professionals believe that lifelong eating habits and risk factors for chronic disease begin
in early childhood and that it is easier and more effective to teach healthy behaviors to preschoolers than
to try to change the unhealthy nutritional habits of adults (Lenfant, 1995). Nutrition education for
children is especially important today because, in two-career and single-parent families, many children
frequently select food with little adult supervision (Crockett and Sims, 1995). Most health promotion
organizations, including the American Heart Association, the National Institutes of Health, the Centers
for Disease Control and Prevention, the Nutrition Education and Training Program, and the American
Dietetic Association, now recommend that all children from preschool through twelfth grade receive
education about healthful eating habits (Singleton et al., 1992; CDC, 1996). Appendix A lists other
research reports on nutrition education for preschoolers.
Developing the Intervention
The developmental phase of this project included preparing two products for use with three- and four-
year-old WIC children: a nutrition education lesson and a child test.
The initial developmental stages of the preschool demonstration included a review of the most frequently
used standards for evaluating the nutritional health of the US population—the Dietary Guidelines for
Americans (USDA/HHS, 1995). The Dietary Guidelines, which recommend food choices to promote
health and decrease the risk of chronic disease for people two years of age and older, include six
recommendations that apply to children as well as adults. A seventh recommendation is for adults only
(Exhibit 2.1).

WIC Nutrition Education Demonstration Study
9
Exhibit 2.1
Dietary Guidelines for Americans, 1995
Eat a variety of foods.
Balance the food you eat with physical activity—maintain or improve your weight.
Choose a diet with plenty of grain products, vegetables, and fruits.
Choose a diet low in fat, saturated fat, and cholesterol.
Choose a diet moderate in sugars.
Choose a diet moderate in salt and sodium.1
The seventh Dietary Guideline applies only to adults: If you drink alcoholic beverages, do so in moderation.1
It appears, however, that the diets of many young Americans do not meet the nutrition standards in the
Dietary Guidelines. Several recent large-
scale studies have noted declines in fat intake among American preschool and primary school children
and adolescents, but currently reported fat intake—33 to 35 percent of total daily calories—still exceeds,
by 3 to 4 percentage points, the recommendation in the Dietary Guidelines (Luepker et al., 1996;
Nicklas, 1995; Devaney et al., 1995; CDC, 1996). The average diets of children and adolescents include
too much fat, saturated fat, and sodium and too few servings of fruits, vegetables, and calcium [CDC,
1996; Federation of American Societies for Experimental Biology (FASEB), 1995]. National surveys
indicate that overweight among America’s children is a growing problem and that children from lower
income, ethnically diverse populations are at greater risk—than are children of higher socioeconomic
status—of obesity, increased serum lipid levels, and food intakes that fail to meet the Dietary Guidelines
(Nicklas, 1995; FASEB, 1995; Bronner, 1996).

WIC Nutrition Education Demonstration Study
10
Objectives of the Intervention
Several expert nutrition educators worked with staff from FNS and Abt to formulate clear and specific
learning objectives. During the process, factors that were taken into consideration included: the
developmental appropriateness of objectives; the feasibility of successfully covering the objectives in
a thirty-minute, one-time class for three- and four-year-olds; and topics addressed by demonstration sites
in their adult nutrition education sessions and materials. The thirty-minute time limit for the intervention
was chosen to lessen burden on families by minimizing additional time in the WIC clinic. The parent
or caretaker could complete certification while the child attended the nutrition education lesson. Also,
thirty minutes is a maximum time frame for an educational intervention that takes into account the
developmental levels of three- and four-year-old children.
The three learning objectives for the demonstration incorporated concepts from the Food Guide Pyramid,
a colorful graphic developed by the USDA and USDHHS to illustrate the recommendations of the
Dietary Guidelines for Americans (USDA, 1992).
Objective 1 Food PyramidChildren will be able to identify the Food Pyramid.
Children will be able to distinguish the different food groups on the FoodGuide Pyramid.
Children will be able to identify and name foods in the food groups on theFood Guide Pyramid.
Children will understand that they should eat more food from the bottomsegment of the Food Pyramid and less food from the top.
Objective 2 VarietyChildren will understand that they need to eat a variety of foods to stay healthyand to grow.
Objective 3 Food ChoicesChildren will be able to correctly identify “anytime” foods and “sometimes”foods.
Children will understand that “anytime” foods should be eaten more often than“sometimes” foods.
Children will understand that “anytime” foods promote growth and healthbetter than “sometimes” foods.

WIC Nutrition Education Demonstration Study
This educational program was developed by child nutrition educator Barbara Mayfield with funding from USDA.1
The complete Kid's Club curriculum is a series of twenty-six lesson plans with supplementary activities, a songbook andcassette tape of nutrition songs, a storybook, puzzle, and six hand puppets. Parents are viewed as partners in the learningexperience and are provided with ideas to reinforce the lessons children learn from Kid’s Club.
11
Kid's Club
After clearly defining demonstration objectives, FNS chose Kid's Club as the basis for the educational
intervention.1
The goals of Kid's Club are consistent with widely applied educational techniques which emphasize
learning through social interaction and reinforcement. Kid’s Club goals include:
1. Providing an opportunity for children to learn one or more key ideas orconcepts about nutrition and/or health topics.
2. Promoting positive attitudes about good nutrition and health.
3. Encouraging positive nutrition and health behaviors among Kid's Clubparticipants.
At the end of each session, each participant will:
1. Know one or more ideas or concepts about food, nutrition, or health and beable to state this knowledge in answer to one or more question(s).
2. Feel good about what s/he learned and about the educational experience andbe eager to come again.
3. Demonstrate a willingness to try a positive nutrition or health behavior.
Adapting the Lesson
To develop the preschool intervention, material was drawn from three Kid's Club lessons: variety, the
food pyramid, and healthy versus junk foods. FNS, Abt Associates, and Barbara Mayfield cooperatively
developed the demonstration’s educational intervention.
The lesson was modified and refined during the course of pilot testing; revisions were based on children's
responses to different activities. For example, the Kid's Club story Treasures of the Pyramid was
initially shortened and then later omitted to hold the lesson to thirty minutes and to have more time for
hands-on activities. The terms “everyday” and “sometimes” were used at the start of pilot testing, but
WIC Nutrition Education Demonstration Study
12
we found that children seemed to be confused by the term “everyday”—often applying the term to foods
they wished to eat every day. Substituting “anytime”—to indicate certain foods could be eaten
anytime—alleviated this problem. Our choices about the use of visual aids, such as hand puppets and
food models, also changed as the lesson was revised.
Foodstuffs chosen for the lesson (and the child test) were items familiar to children and were also the
foods most frequently consumed by three- and four-year olds (USDA, 1995). The foods discussed in
the intervention include:
Grains Cereal, bread, rice, spaghetti or macaroni, crackersVegetables Lettuce, broccoli, tomatoes, carrots, green beansFruits Apple, orange, banana, grapes, melonMeat (protein) Hamburger, chicken, fish, eggs, peanut butterMilk Milk, yogurt, cheese
General Characteristics of the Demonstration’s Educational Intervention
The educational intervention for this demonstration included seven topics plus an introduction and a
closing. The seven topics are listed below. The educational objectives, defined earlier in this chapter,
are noted for each topic.
Objective 1
The Food Guide Pyramid
The five food groups on the pyramid
Identifying foods on the pyramid
Classifying foods into the five food groups
Objective 2
Eating a variety of these foods
Objective 3
Eating appropriate proportions from each food group
Moderation in eating—“anytime” and “sometimes” foods

WIC Nutrition Education Demonstration Study
13
Lesson components are described below. A copy of the final lesson appears in Appendix B.
Materials are colorful and appealing to capture children’s immediate interest.Children are told how eating well helps them to grow and stay healthy—atopic in which they are interested.
Different learning strategies are incorporated into the lesson. Self-learning ispromoted by allowing children to reach into WICCY Waccoon’s Wonder Boxand pull out a (surprise!) Food Guide Pyramid. Meaningful learning asks thechildren questions about the shapes of their names tags (triangle, square,circle) before “bridging” into the new concept (and shape) of the Food GuidePyramid. Concrete learning includes building a Food Guide Pyramid puzzleand singing a song about the five food groups.
Learning activities involve cognitive, affective, and physical domains. Thereis more emphasis, in this demonstration, on the cognitive domain because ourmission is to measure knowledge changes.
Information in the lesson is reinforced by a variety of means including theFood Guide Pyramid puzzle, a song about the five food groups, naming andclassifying food pictures into food groups, and telling parents what childrenlearned about the Food Guide Pyramid.
Each child is rewarded with a wooden puzzle of the Food Guide Pyramidwhich s/he may take home.
Expectations for the effectiveness of the demonstration lesson were based on previous experience with
Kid’s Club, as reported by its developer, as well as on a review of the literature describing preschool
nutrition education. It was expected that both three- and-four-year-olds would be developmentally ready
to learn about the Food Guide Pyramid and about the five food groups. Four-year-olds would be more
likely to grasp the concept of variety and were also expected to be more adept at classifying and
categorizing foods into food groups and as “sometimes” or “anytime.” The longer attention span of
four-year-old children should lead to that group displaying larger pretest-post-test differences than would
occur for three-year-olds.
Developing the Preschool Nutrition Education Test
Designing the test of nutrition knowledge required developing and validating a test composed of items
that are directly related to the educational objectives of this study and that are also appropriate for
WIC Nutrition Education Demonstration Study
14
developmental levels of children ranging from thirty-six to fifty-nine months of age. It was crucial that
test and intervention development follow parallel, iterative paths.
It is also useful to underscore here that the educational intervention and the test had to occur during a
single contact lasting about forty-five minutes and taking place at certification appointments. Scheduling
the intervention to coincide with certification ensured that children would be present—WIC child
participants are not required to pick up food vouchers or checks. The time limitation itself had two
goals: avoiding fatigue in children and limiting additional time families spent at the WIC agency.
The challenges for this test development process were threefold. The first was creating items that are
appropriate and useful across developmental ages ranging from thirty-six to fifty-nine months of age.
Moreover, these items must address specific educational objectives and be sensitive to a single brief
educational intervention. Finally, each item must interest children, and the test, in the aggregate, must
sustain each child's interest.
FNS and Abt developed a child test composed of ten items which were directly related to the three
educational objectives identified earlier in this chapter. A copy of the final testing instrument is in
Appendix C. Test items were carefully constructed and pilot tested to maintain children's interest in a
one-to-one interview during a ten- to fifteen-minute testing period.
Pilot Testing
A total of 100 children were tested in two stages: the item development stage and the final pilot test
stage. During test development, eight test forms were created and assessed. Several tasks (items) were
common to all test forms, but others were eliminated when they were found to be flawed.
The item development stage involved forty-seven children, twenty-one of whom were pretested and
twenty-six of whom were post-tested. The purpose of this stage of test preparation was to establish that
children in the target age group could respond appropriately to test items and that their ability to respond
would be enhanced following a brief educational intervention. During this stage, the educational
innovation was modified considerably, and some test items were added while others were revised or
discarded. At the conclusion of this iterative process, ten items were aggregated into another form for

WIC Nutrition Education Demonstration Study
15
pilot testing where the primary focus was establishing reliability and validity of the overall test as well
as for the items comprising the test.
The final pilot-testing phase involved fifty-three children: thirty were pretested and twenty-three were
post-tested. Children were tested at three local WIC agencies, a Head Start program, and a publicly
funded child care center—all in Massachusetts. A record was kept of the ages of children who were
pretested and post-tested in an effort to evenly distribute the pre- and post-tests across children of
different ages—young three-year-olds versus older four-year-olds, for example. Across all children
tested, in both stages, the average ages were 47.1 months for pretested children and 47.8 months for
post-tested children.
During the pilot test, nutrition education sessions for children were conducted by Abt staff with
experience in early childhood education. Initially, these sessions were taught by two-person teams
because we thought that children might be more comfortable in lessons with two adults. Working in
teams was also helpful as staff refined and revised the nutrition lesson. However, as the pilot testing
progressed, many of the sessions were taught by just one person. This approach was quite successful
and a closer approximation of the nutrition education to be offered at the demonstration sites.
Children were tested by the same individuals who taught the nutrition education sessions and by a college
student majoring in education. Children were usually engaged by the testing activities and seemed to
enjoy them. There were a few young three-year-olds who were unable to focus on the testing.
Again, the entire educational intervention and all testing occurred during a single contact lasting about
forty-five minutes. In the WIC agencies, the interventions coincided with certification appointments.
While children participated in the pilot test, their mothers handled certification. The parent(s) of each
participating WIC child received $10. At the other social service agencies, incentive payments were
given to the programs to use for special treats for the children. All pilot-tested children were given
snacks (animal crackers and juice) and coloring sheets of fruit pictures to take home.
Results of the Pilot Test

WIC Nutrition Education Demonstration Study
16
Mean pretest and post-test scores for the pilot test are summarized in Exhibit 2.2. The pilot test results
demonstrated that three and four-year-old children in the post-tested group could perform more capably
on most of the items if they had participated in instructional sessions. The complete test involved nine
items. One (item 4) had two parts, and one (item 9) had three alternative scoring
WIC Nutrition Education Demonstration Study
17
Exhibit 2.2
Pilot Test Results
Test Item Number Score DeviationaMean Standard
Item 1 Naming the food pyramid Pretest 51 0.22 0.46 Post-test 49 0.35 0.56
Item 2 Identifying the number of food groups Pretest 29 13.8 35.1 Post-test 23 69.6*** 51.1
Item 3 Selecting a plate of foods representing “variety” Pretest Post-test 30 23.3 43.0
23 43.5 50.7
Item 4n Naming foods from the five food groups Pretest 29 55.9 22.3 Post-test 23 75.7* 24.8
Items 4s Selecting companion foods from the samefood group Pretest 29 35.9 21.6 Post-test 23 33.0 28.0
Item 5 Correctly placing foods in food groups Pretest 29 24.8 17.4 Post-test 23 33.9 29.2
Item 6 Selecting food groups Pretest 42 38.1 39.5 Post-test 42 53.6* 37.9
Item 7 Selecting “anytime” foods Pretest 50 44.3 27.8 Post-test 47 43.7 31.8
Item 8 Reasons for eating “anytime” foods Pretest 51 0.49 1.05 Post-test 49 1.47* 1.68
Item 9 Food pyramid puzzle Time on task (seconds) Pretest 28 121.3 44.3 Post-test 23 98.1* 45.9 Pieces completed Pretest 28 3.54 2.33 Post-test 23 4.65* 1.97 Time to complete (seconds)b
Pretest 12 83.1 45.0 Post-test 15 70.5 30.8
*Difference between pretest and post-test significant at the p<.05 level.***Difference between pretest and post-test significant at the p<.001 level.NOTES See Appendix D for individual item analysis.a Number of subjects varies because there were several rounds of pilot-testing using different versions of the test so that all
subjects did not receive all items included in the final version of the test.b Reported only for subjects who completed the puzzle.

WIC Nutrition Education Demonstration Study
18
methods. Post-tested children had higher scores for three of the seven single-score items, one of the
parts of item 4, and for two of the three scoring methods applied to item 9. Only subitem 4S (selecting
companion foods from the same food group as the tester) and item 7 (selecting “anytime” foods from
a two-picture choice) failed to provide any evidence that the instruction was effective. Both items were
retained in the final test, however, because they were important elements of the lesson, and it was felt
that even failure to demonstrate effectiveness on these educational elements would be important to the
evaluation. One additional item was added to the final test because the item requiring a verbal
identification of the food pyramid was felt to be beyond the language skills of many of the younger
children. The new item was a request that the child point to a picture of the food pyramid placed among
a three-choice array. Content validity for the test items was assured because the items directly reflected
the content of the nutrition education lesson; construct validity was demonstrated for those items through
the pretest results reflecting the success of post-tested children relative to children tested prior to
educational sessions. Detailed information on overall and item-specific pilot test results appears in
Appendix D.
Implementing the Intervention
Using grant money from USDA, each demonstration site employed an individual to teach the preschool
classes. In November 1995, Barbara Mayfield, the original developer of Kid’s Club, traveled to both
sites to train the teachers and to demonstrate the lesson to other WIC staff. Staff from Abt and FNS also
attended the one-and-one-half day sessions.
Demonstration classes were offered several times each week during the data collection period which
began in February 1996 and ended in November 1996 (Site A) and October 1996 (Site B). For most
of the demonstration, child WIC participants were scheduled for either morning or afternoon sessions
and were tested on the days they attended classes. At both sites, six to eight children were scheduled for
each lesson to be sure that at least two children would attend. Upon arrival for the educational program
(which was scheduled to coincide with WIC certification appointments), children were randomly
assigned to either pretest or post-test. Children in the pretest group were tested prior to attending
nutrition education; children in the post-test group were tested after the lesson. Parents were able to
complete most certification activities during the lessons.

WIC Nutrition Education Demonstration Study
Observations of lessons were included in FNS’ design for the demonstration. Child testers began observations about2
eight weeks into the demonstration. The original goal, which was slightly exceeded, was twenty observations in eachsite—about one class per week of the data collection period.
19
Observations of the Preschool Intervention
Across the two study sites, fifty-one lessons were observed by the child testers. Using a standardized2
observation protocol, specific information about the process and content of the classes was recorded.
Information was collected about session length, attendance, amount of time devoted to each nutrition
topic, disruptions, environmental considerations, and the quality of interactions between nutrition
educators and children. A copy of the observation checklist is found in Appendix E.
Data on these observations are displayed in Exhibit 2.3 and discussed below. It is important to note that
these observations do not constitute a formally drawn sample of either total sessions or total minutes
devoted to nutrition education. Rather, these data are descriptive, offering an overview of the actual
conduct of the demonstration.
Session Length
Nutrition education sessions averaged 29 minutes in length, ranging from 21 to 45 minutes at the two
project sites. As might be expected, sessions were longer when the groups were larger.
At Site A, sessions were about six minutes shorter, on average, than at Site B. This difference reflects
Site B’s inclusion of the snack in the lesson. At Site A, the snack was provided after the lesson was
entirely finished, as in our original design. Test results indicate that this deviation did not affect the
educational content of the lesson. This approach merely reflects the personal teaching style of the
nutrition educator at Site B.
Attendance
During most observed sessions, classes were composed of two or three children. Occasionally, only one
child attended. The largest class size was five. Usually, four-to-six children were scheduled for
certification and class attendance. Child testers reported that some of the unobserved sessions included
as many as eight children.
WIC Nutrition Education Demonstration Study
20
Exhibit 2.3
General Characteristics of Kid’s Club Sessions
Characteristic Site A Site B
Session lengthMean 26 min. 32 min.(Range) (21-34) (26-45)
AttendanceChild participants
Mean 2.72 2.54 (Range) (1-5) (1-5)
Other children Mean 0.96 0.11 (Range) (0-7) (0-2)
Adults Mean 0.44 0.35 (Range) (0-2) (0-2) Attendance rate 84% 50%a
Number of sessions observed 25 26
This rate is calculated by dividing the number of child participants who attended Kid’s Club sessions by thea
number scheduled to attend.
More “extra” people attended the nutrition education sessions at Site A than at Site B, including adults
and other, often older, children who were friends or relatives of tested children. Site A averaged at least
one extra person per session while Site B had about one extra person at every other session. Individuals
had to attend the entire nutrition education session to be included in these counts. Parents who joined
in at the end of the each class were not counted as attending sessions.
Site A’s 84 percent show rate for certification appointments is substantially higher than the 50 percent
rate at Site B. A consequence of Site B’s higher no-show rate for certification appointments was the
need to overschedule children so that teaching-testing goals could be met.

WIC Nutrition Education Demonstration Study
21
Duration of Nutrition Topics
The nutrition education lesson was divided into seven topics plus a welcome and a closing. During the
sessions, child testers timed (using stopwatches) and recorded the time spent on each component. Time
devoted to each topic was similar across the two sites (Exhibit 2.4). In fact, there were only four topics
with differences of more than one minute. The nutrition educator at Site B spent about one minute longer
on the sections covering the Food Guide Pyramid and the five food groups and, as explained earlier,
additional time was spent in the last two sections of the lesson at Site B because the snack was served
before the instructor ended the lesson.
Involvement of Children
All of the children were attentive for the duration of the entire class in 57 percent of observed sessions
(64 percent in Site A and 50 percent in Site B). Observation data indicated that children were attentive
at least some of the time in 89 percent of the sessions. There was only one observation of one topic
where no child was attentive.
It seems reasonable to conclude, based on the observation data, that children were engaged by the
intervention. As just noted, in a majority of the observed classes, children were attentive throughout the
sessions. In the remaining observations (43 percent of the fifty-one observed classes), children were
attentive for about 80 percent of the topics.
Disruptions and Environment
Disruptions to the sessions were not a problem at either site, but, as might be expected in a program for
young children, some disruptions did occur. For both sites, 57 percent of nutrition education sessions
had at least one disruption and 35 percent had more than one. Interruptions occurred most often at the
start of lessons while adults were leaving and children entering the classrooms. Some predictable
disruptions for a group of young children are bathroom breaks, children missing their parents, and parent
interruptions to instruct their children.
Site A had disruptions in fewer sessions (40 percent) than Site B (73 percent). Site B had more
disruptions from people walking through the room, probably because of the room's location. At Site B,
teaching and testing took place in separate parts of the only available classroom. Sometimes

WIC Nutrition Education Demonstration Study
22
Exhibit 2.4
Duration of Lesson Topics
Topic Site A Site B(minutes) (minutes)
Welcome and introduction 2:24 1:46
Food pyramid 2:54 3:54*
Five food groups 4:32 5:43*
Food identification 3:00 3:06
Food classification 2:34 1:52
Variety review 2:29 2:52
Proportionality 2:33 2:58
Moderation 4:05 5:50* **
Closing 1:30 3:22* **
Total session length 25:52 31:32
* More than one minute difference in duration of topic between sites. ** Moderation, closing, and total session length are longer at Site B because the snack was distributed
between the moderation and closing sections at Site B and after the class at Site A.
individuals or child care classes walked through the room to locations in other parts of the building. In
contrast, Site A had two separate classrooms so that the nutrition education sessions and child tests were
conducted in separate spaces. Also, the rooms were not used as passageways. Although the limited
space at Site B complicated the logistics of teaching and testing, care was taken to maintain the quality
of the educational sessions and the testing process. As test results reported in Chapter Three clearly
indicate, Site B’s space constraints did not diminish the effectiveness of the lesson.
Child testers at both sites recorded adequate space, privacy, comfortable temperature, and bearable noise
levels during all nutrition education sessions.

WIC Nutrition Education Demonstration Study
23
Interactions Between Nutrition Educators and Children
Observers gave high ratings to the quality of the interactions between nutrition educators and WIC
children. In 96 percent of the sessions, the pace of presentation was considered appropriate for the
children. The following indicators of the quality of the interaction between nutrition educators and WIC
children were positive in all observed classes at both sites:
Educator provides opportunity for children to actively participate.
Educator maintains an enthusiastic attitude.
Educator is supportive of children during interaction.
Pace of presentation is appropriate to material.

In Chapter Two, we discussed implementation of the demonstration and noted the similarities in implementation of1
the nutrition education intervention across the two sites.
24
Chapter Three
Impact of the WIC Preschool Intervention
Before turning to demonstration results, it is helpful to review our quasi-experimental research design—a
separate-sample pretest-post-test design (Campbell and Stanley, 1963). The brevity of the intervention
followed by immediate post-testing strengthens the design’s internal validity so that we can attribute
knowledge differences to the education intervention and not to other factors or experiences intervening
between instruction and testing. For most of the demonstration period, child WIC participants were1
scheduled for either morning or afternoon lessons and were tested on the days they attended the lessons
which were held in conjunction with WIC certification. Using an automated program on laptop
computers, child testers randomly assigned children to either pretest or post-test. Randomization
increases the likelihood of equivalency across the two groups of children. Children assigned to pretest
were tested in one-to-one interviews before the lesson; children in the post-test groups remained after
the lesson for one-to-one testing. All children attended the educational intervention.
Sample
A total of 503 children were tested across the two sites at two test points. The final sample size was 497
children. We excluded from the analysis three pretests and three post-tests. The six tests were removed
from the final database because the individuals tested failed to respond to nine or more items either
verbally or non-verbally.
Exhibit 3.1 displays information on overall sample size by site and by test point. Slightly more child
tests were completed at Site A. Also, there is a considerable drop in number of post-tests at Site B. The
space problems described in Chapter Two accounted for this difference. At Site B, although there were
only two child testers, there was only one private space for testing. Children had to be tested
sequentially. This protocol was not a problem for pretests when one child could be tested while another
was certified. Then, all children attended the demonstration lesson. However, after the lesson, a number
of families could not stay for sufficient time for their children to be tested.

WIC Nutrition Education Demonstration Study
All t-tests are two-tailed—the more stringent default in SAS.2
The division is absolute year of age. That is, at forty-eight months, children were classified as four-year-olds.3
25
Exhibit 3.1
Sample Size by Test Point by Site
Site A Site B Total
Pretest 133 145 278
Post-test 126 93 219
Total 259 238 497
Demographics
Exhibit 3.2 displays demographic data on the demonstration’s child WIC participants. These data were
obtained from WIC application and certification forms at the two local agencies participating in the
demonstration.
The average age for all pretested children was 46 months; for post-tested children the average age was
47 months (t = -1.61, n.s.). Overall, 55 percent of the tests were conducted with children under four2
years of age—273 tests for under-fours versus 224 for children at least four years of age. The majority3
of the three-year-olds were closer to four years of age than to three. Males accounted for 57 percent of
the sample at Site A and for 50 percent of the sample at Site B.
Neither site had large proportions of persons of other races or ethnicities. For this analysis, information
on race/ethnicity is aggregated into three categories: white, black, and other. The “other” category
included ten American Indians/Alaskan Natives, eleven Asians or Pacific Islanders, twenty-six
Hispanics, five children listed as other on WIC certification forms, and seven respondents for whom
race/ethnicity was not reported. At Site A, 17 percent of tested children were reported as other; that
category accounted for only 4 percent of Site B’s tested children.
WIC Nutrition Education Demonstration Study
26
Exhibit 3.2
Demographic Characteristics of WIC Children in Nutrition Education Demonstration by Test Type and by Site
Age in Years Gender Race/Ethnicity
Three Four Male Female White Black Other1 2 3
Test Type Number Percent Number Percent Number Percent Number Percent Number Percent Number Percent Number Percent
Pretest
Site A 78 58.7 55 41.4 70 52.6 63 47.4 113 85.0 0 0 20 15.0
Site B 87 60.0 58 40.0 79 54.5 66 45.5 16 11.4 120 85.1 5 3.6
Post-test
Site A 62 49.2 64 50.8 77 61.1 49 38.9 100 79.4 3 2.4 23 18.2
Site B 46 49.5 47 50.5 43 46.2 50 53.8 16 17.8 70 77.8 3 4.4
Includes children aged thirty-six through forty-seven months.1
Includes children aged forty-eight through fifty-nine months.2
Other includes American Indian or Alaskan Native (ten children); Asian or Pacific Islander (eleven children); and Hispanic (twenty-six children). In addition, four children were reported as "other"3
race/ethnicity on WIC application and certification forms, and race/ethnicity was not reported for eight children. Because of these missing data, the totals for race/ethnicity for Site B are 141for pretest and 89 for post-test.
NOTES There was enough evidence to reject the hypothesis of independence for the following: race by site, race by test type, and site by test type. These results were expected because delayedpost-tests were conducted almost exclusively in Site A and because the caseload at Site A is predominantly white.
Total sample size is 497 children.
WIC Nutrition Education Demonstration Study
Most exhibits in this chapter present mean scores computed from the scaled test scores. In the text, we frequently4
report percentage of correct answers. These percentages were calculated by dividing the mean score by the possible maximumscore.
27
Results of statistical tests comparing demographic variables indicate age was independent of site (X =2
.17, n.s.) but not of test point (X = 4.99, p<.05) because more three-year-olds were pretested. Gender2
was independent of both site (X = 1.51, n.s.) and test point (X = .07, n.s.).2 2
Hypotheses of independence were rejected for race and site ( X = 336.64, p<.01) but not for race and2
test point (X = 5.42, n.s.) when the “other” race category was included. We noted in our general2
descriptions of the two demonstration sites that Site A had a predominantly white caseload while Site
B’s caseload was primarily African-American. Race/ethnicity was almost completely confounded by
site.
Finally, site was not independent of test point (X = 4.61, p<.05) because fewer post-tests were2
conducted in Site B.
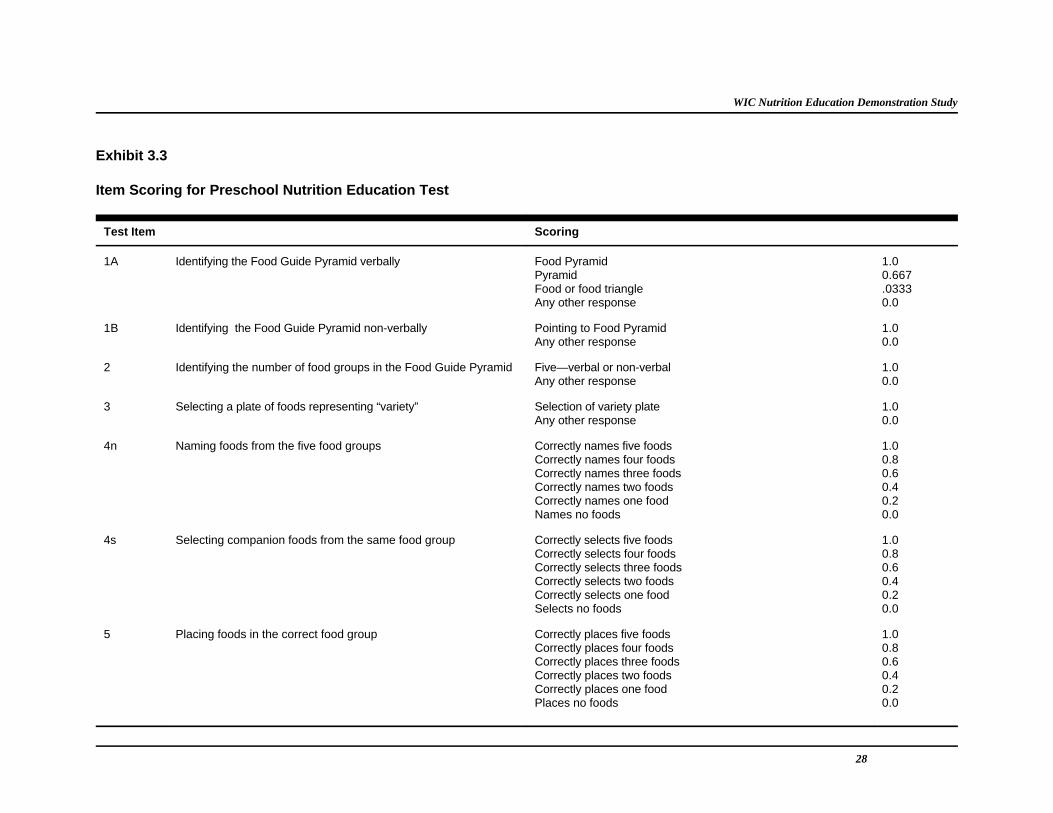
Analysis and Test Scoring
Child tests were scored using standardized protocols, and item scores were scaled to permit calculation
of a total score for each child test. The total maximum score for the child test is 11.0. Three items, 1b
(identifying the Food Guide Pyramid non verbally), 2 (identifying the number of food groups in the Food
Guide Pyramid), and 3 (selecting a plate of foods representing “variety”), are scored as correct or
incorrect. The open-ended responses required for Items 1a (identifying the Food Guide Pyramid
verbally) and 8 (reasons for eating “anytime” foods— verbally) are scored to measure the quality of the
child’s response. For example, for Item 1a, a respondent receives full credit (score of 1.0) for answering
food pyramid versus partial credit (scaled score of 0.667) for saying pyramid. Scores for Items 4n
(naming foods from the five food groups), 4s (selecting companion foods from the same food group),
5 (placing foods in the correct food group), 6 (selecting food groups from which to eat most often), 7
(identifying “anytime” foods), and 9 (completing the Food Guide Pyramid puzzle) are based on the
proportions of the subitems answered correctly. In addition, for Item 9, a separate Time to Complete
this task was computed in seconds. Finally, the time to complete the entire testing session was computed
by subtracting the start time from the end time; child testers routinely recorded start and end times.
Exhibit 3.3 displays scoring protocols for each item.4
WIC Nutrition Education Demonstration Study
28
Exhibit 3.3
Item Scoring for Preschool Nutrition Education Test
Test Item Scoring
1A Identifying the Food Guide Pyramid verbally Food Pyramid 1.0Pyramid 0.667Food or food triangle .0333Any other response 0.0
1B Identifying the Food Guide Pyramid non-verbally Pointing to Food Pyramid 1.0Any other response 0.0
2 Identifying the number of food groups in the Food Guide Pyramid Five—verbal or non-verbal 1.0Any other response 0.0
3 Selecting a plate of foods representing “variety” Selection of variety plate 1.0Any other response 0.0
4n Naming foods from the five food groups Correctly names five foods 1.0Correctly names four foods 0.8Correctly names three foods 0.6Correctly names two foods 0.4Correctly names one food 0.2Names no foods 0.0
4s Selecting companion foods from the same food group Correctly selects five foods 1.0Correctly selects four foods 0.8Correctly selects three foods 0.6Correctly selects two foods 0.4Correctly selects one food 0.2Selects no foods 0.0
5 Placing foods in the correct food group Correctly places five foods 1.0Correctly places four foods 0.8Correctly places three foods 0.6Correctly places two foods 0.4Correctly places one food 0.2Places no foods 0.0

Exhibit 3.3
(Continued)
WIC Nutrition Education Demonstration Study
Test Item Scoring
29
6 Selecting food groups from which to eat most often Correctly selects three food groups 1.0Correctly selects two food groups 0.667Correctly selects one food group 0.333Selects no food groups 0.0
7 Identifying “anytime” foods Correctly selects six “anytime” foods 1.0Correctly selects five “anytime”foods 0.833Correctly selects four “anytime” foods 0.667Correctly selects three “anytime” foods 0.050Correctly selects two “anytime” foods 0.333Correctly selects one “anytime” food 0.167Selects no “anytime” foods 0.0
8 Reasons for eating “anytime” foods “Anytime” foods help children grow strong and healthy 1.0“Anytime” foods help children grow strong or healthy“Anytime” foods are good for youChild indicates preference for “anytime” foodsAny other response
0.60.40.20.0
9 Completing the Food Guide Pyramid puzzle Correctly places all (six pieces) puzzle pieces 1.0Correctly places five puzzle pieces 0.833Correctly places four puzzle pieces 0.667Correctly places three puzzle pieces 0.050Correctly places two puzzle pieces 0.333Correctly places one puzzle piece 0.167Places no puzzle pieces 0.0

WIC Nutrition Education Demonstration Study
All tests of statistical significance (t-tests and chi-squares) were at the .05 significance/95 percent confidence interval.5
SAS procedures GLM (analysis of variance for unbalanced data) and REG (multivariate regression) were used for6
these analyses.
This calculation excludes fourteen children for whom test times were not obtained.7
30
Using scaled scores, we calculated average (mean) scores by test point, site, age, gender, and race-
ethnicity and then compared pretest with post-test scores. These analyses included consideration, using5
correlation coefficients, of the interactions between and among variables. These analyses controlled for6
test point, age, gender, and race-ethnicity. As might be expected from our descriptions of site and
sample demographics, race/ethnicity was almost completely confounded with site. Site A was virtually
all white, while Site B was predominantly African-American. Findings are presented by site.
All other group performance differences are described in terms of statistical significance and in terms
of the proportion of the pooled standard deviation. Typically, if an observed performance difference is
smaller than 20 percent of the standard deviation, it is considered too small to be meaningful.
Differences between 40 and 60 percent of the standard deviation are considered medium; differences
greater than 80 percent of the standard deviation are considered large (Cohen, 1969).
Child Test Results
We found a significant difference between the test scores for the pretest and the post-test groups
(Exhibit 3.4). Children in both sites had basically the same pretest scores—mean scores of 3.73 in Site
A and 3.75 in Site B—both representing 34 percent correct answers. On post-test, children correctly
answered 48 percent of the items (Site A) and 45 percent of the items (Site B). Average differences
between pretest and post-test scores were similar across sites (14 percent at Site A and 11 percent at Site
B). Children who attended the nutrition education lesson scored, between 11.0 and 14.0 percentage
points higher on the test of nutrition knowledge than did children tested before they attended the lesson.
Respondents required only slightly longer times to complete pretests than they needed to complete post-
tests—14.75 minutes versus 14.02 minutes. Nonetheless, this difference was statistically significant.7
These results were similar to the pilot test results described in Chapter Two.
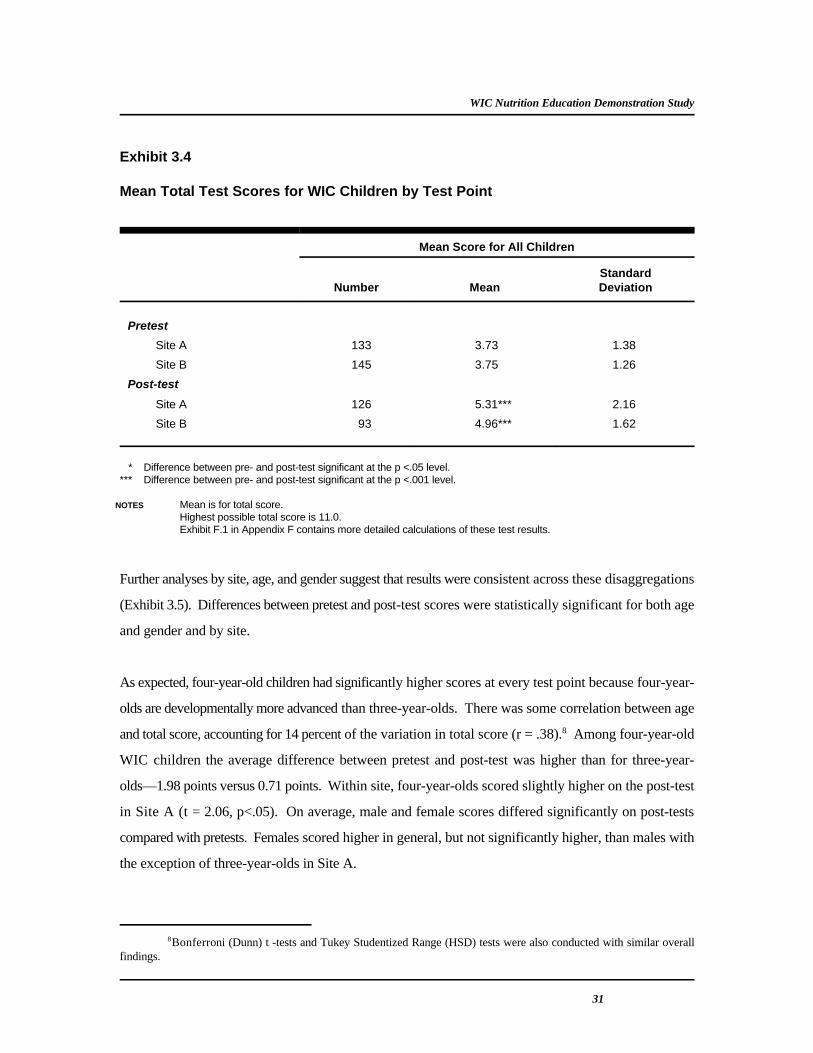
WIC Nutrition Education Demonstration Study
Bonferroni (Dunn) t -tests and Tukey Studentized Range (HSD) tests were also conducted with similar overall8
findings.
31
Exhibit 3.4
Mean Total Test Scores for WIC Children by Test Point
Mean Score for All Children
Number Mean DeviationStandard
Pretest
Site A 133 3.73 1.38
Site B 145 3.75 1.26
Post-test
Site A 126 5.31*** 2.16
Site B 93 4.96*** 1.62
* Difference between pre- and post-test significant at the p <.05 level.*** Difference between pre- and post-test significant at the p <.001 level.
NOTES Mean is for total score.Highest possible total score is 11.0.Exhibit F.1 in Appendix F contains more detailed calculations of these test results.
Further analyses by site, age, and gender suggest that results were consistent across these disaggregations
(Exhibit 3.5). Differences between pretest and post-test scores were statistically significant for both age
and gender and by site.
As expected, four-year-old children had significantly higher scores at every test point because four-year-
olds are developmentally more advanced than three-year-olds. There was some correlation between age
and total score, accounting for 14 percent of the variation in total score (r = .38). Among four-year-old8
WIC children the average difference between pretest and post-test was higher than for three-year-
olds—1.98 points versus 0.71 points. Within site, four-year-olds scored slightly higher on the post-test
in Site A (t = 2.06, p<.05). On average, male and female scores differed significantly on post-tests
compared with pretests. Females scored higher in general, but not significantly higher, than males with
the exception of three-year-olds in Site A.

WIC Nutrition Education Demonstration Study
32
Exhibit 3.5
Mean Total Test Scores for WIC Children by Test Point, for Age and Gender by Site
Mean Score by Age Mean Score by Gender
Three Years Four Years Male Female
Number Mean Deviation Number Mean Deviation Number Mean Deviation Number Mean DeviationStandard Standard Standard Standard
Pretest
Site A 78 3.40 1.13 55 4.21 1.57 70 3.74 1.43 63 3.73 1.34
Site B 87 3.55 1.11 58 4.06 1.42 79 3.63 1.39 66 3.90 1.09
Post-test
Site A 62 4.19* 1.72 64 6.39*** 1.99 77 5.06*** 2.25 49 5.71*** 1.97
Site B 46 4.19* 1.45 47 5.72*** 1.43 43 5.05*** 1.59 50 4.89*** 1.66
* Difference between pre- and post-test significant at the p <.05 level.*** Difference between pre- and post-test significant at the p <.001 level.
NOTES Mean is for total score.Highest possible total score is 11.0.Exhibit F.1 in Appendix F contains more detailed calculations of these test results.Exhibit F.2 and F.3 in Appendix F provide item-by-item mean scores disaggregated by gender.

WIC Nutrition Education Demonstration Study
33
Item-Specific Results
In this section, we present results for each item on the child test of nutrition knowledge. Average scores
are presented for each test point (pretest and post-test). Exhibits include mean scores by site and by age.
Item scoring is explained in Exhibit 3.3 and below.
Item 1a The tester shows the child a Food Guide Pyramid poster and asks: “What is thiscalled?”
The opening segment of the child nutrition lesson was an introduction to the Food Guide Pyramid which
identifies the shape and discusses graphic representations of the pyramid. The term food pyramid
recurred throughout this introductory section. For this item, the answer, “Food Pyramid,” received a
score of 1.0; ‘‘pyramid” a score of 0.667; and “food” or “food triangle” a score of 0.333. Any other
response received a score of zero. Mean scores appear in Exhibit 3.6.
For this item, for all children at both sites, average differences in pretest and post-test scores were
extremely large. Statistically significant differences occurred for both three-year-olds and four-year-olds.
Item 1b The tester shows the child a poster with three separate representations (includingthe Food Pyramid) and asks: “Which one of these is the Food Pyramid?”
This item was added after the pilot test was completed. During pilot-testing, it became clear that, after
the intervention, many children recognized the Food Guide Pyramid but could, or would, not say the
word pyramid. This item allowed non-verbal identification of the pyramid. If the child pointed to the
picture of the Food Guide Pyramid, s/he received a score of 1.0. Any other response was scored zero.
Average correct percentages appear in Exhibit 3.7.
The average differences between pretest and post-test were 20.1 percentage points (p<.001) for Site A
and 16.8 percentage points (p <or=.01 for site B. Surprisingly, the average difference between pretest
and post-test scores was statistically significant only for four-year-olds. This item was originally added
to provide younger children with opportunities to respond correctly if their verbal abilities were hindering
their responses. More three-year-old children answered correctly at post-test but differences were not
statistically significant.

WIC Nutrition Education Demonstration Study
34
Exhibit 3.6
Mean Test Scores for WIC Children in Nutrition Education Demonstration Study by Test Point and by Site by Individual Test Item
Item 1a Identifying the Food Guide Pyramid (verbally)
Mean Score for All Children Mean Score by Age
Three Years Four Years
Number Mean Deviation Number Mean Deviation Number Mean DeviationStandard Standard Standard
Pretest
Site A 133 .09 .15 78 .07 .14 55 .12 .16
Site B 145 .12 .20 87 .09 .19 58 .16 .21
Post-test
Site A 126 .49*** .42 62 .35*** .38 64 .62*** .42
Site B 93 .44*** .41 46 .35*** .39 47 .53*** .41
* Difference between pre- and post-test significant at the p < or = .05 level. *** Difference between pre- and post-test significant at the p < or = .01 level.
NOTES Mean is for item score.Highest possible item score is 1.0.

WIC Nutrition Education Demonstration Study
35
Exhibit 3.7
Test Scores for WIC Children in Nutrition Education Demonstration Study by Test Point and by Site by Individual Test Item
Item 1b Identifying the Food Guide Pyramid (non-verbally)
Score for All Children Score by Age
Three Years Four Years
Number Percent Correct Number Percent Correct Number Percent Correct
Pretest
Site A 133 63.2 78 62.8 55 63.6
Site B 145 55.2 87 58.6 58 50.0
Post-test
Site A 126 83.3*** 62 74.2 64 92.2***
Site B 93 72.0** 46 63.0 47 80.9***
* Difference between pre- and post-test significant at the p < or = .05 level. ** Difference between pre- and post-test significant at the p < or = .01 level. *** Difference between pre- and post-test significant at the p < or = .001 level.

WIC Nutrition Education Demonstration Study
36
Item 2 The tester asks: “How many food groups are there?”
The number of food groups was a recurring theme in the educational session. If the child’s response was
“five” or if the child held up five fingers, s/he received a score of 1.0. Any other response was incorrect
and scored zero.
Test results appear in Exhibit 3.8. Differences of 38.2 (Site A) and 42.3 (Site B) percentage points can
be observed between pretested and post-tested children (p = .001). It appears that exposure to the lesson
reliably increased the proportion of children who knew there were five food groups.
Item 3 The tester shows the child three plates of food—one containing five differentfruits, one with five different foods from the bread group, and one withrepresentatives of each of the five food groups, and asks: “Which of these plateshas different foods from all of the food groups?”
A segment of the lesson dealt with the concept of variety using food pictures (not models). The final
version of the pilot test adapted the three-plate question above. Selection of the variety plate scored 1.0;
all other responses were scored zero.
Three-and-four-year-old children did not seem to grasp the concept of variety (Exhibit 3.9). Research
indicates that kindergartners have difficulty understanding this complex concept. This finding applies
to variety within food groups and between food groups (Murphy et al., 1995), so it is not surprising that
we found no significant differences between pretest and post-test groups. In fact, the percentage of
correct answers across test points was so similar that it appears children randomly chose their answers.
Item 4n The tester shows the child a felt food picture and asks: “What is the name of thisfood?” REPEAT FOR A TOTAL OF FIVE FOODS, ONE FROM EACH FOOD GROUP.
Naming foods was part of the lesson. A child received 1.0 for correctly naming all five foods; 0.8 for
naming four foods; 0.6 for naming three foods; 0.4 for naming two foods; and 0.2 for naming one food
correctly. If a child failed to correctly name any of the foods, s/he received a score of zero.

WIC Nutrition Education Demonstration Study
37
Exhibit 3.8
Test Scores for WIC Children in Nutrition Education Demonstration Study by Test Point and by Site by Individual Test Item
Item 2 Identifying the Number of Food Groups (verbally)
Score for All Children Score by Age
Three Years Four Years
Number Percent Correct Number Percent Correct Number Percent Correct
Pretest
Site A 133 15.0 78 16.7 55 12.7
Site B 145 17.9 87 17.2 58 19.0
Post-test
Site A 126 53.2*** 62 37.1* 64 68.8***
Site B 93 60.2*** 46 41.3* 47 78.7***
* Difference between pre- and post-test significant at the p < or = .05 level. *** Difference between pre- and post-test significant at the p < or = .001 level.

WIC Nutrition Education Demonstration Study
38
Exhibit 3.9
Test Scores for WIC Children in Nutrition Education Demonstration Study by Test Point and by Site by Individual Test Item
Item 3 Selecting a Plate of Foods Representing “Variety”
Score for All Children Score by Age
Three Years Four Years
Number Percent Correct Number Percent Correct Number Percent Correct
Pretest
Site A 133 29.3 78 29.5 55 29.1
Site B 145 46.9 87 50.6 58 41.4
Post-test
Site A 126 23.0 62 21.0 64 25.0
Site B 93 55.9 46 54.4 47 57.5
* Difference between pre- and post-test significant at the p < or = .05 level. *** Difference between pre- and post-test significant at the p < or = .001 level.
NOTE For four-year-olds, at site B, difference for age is significant at the .10/significance/90 percent confidence level.
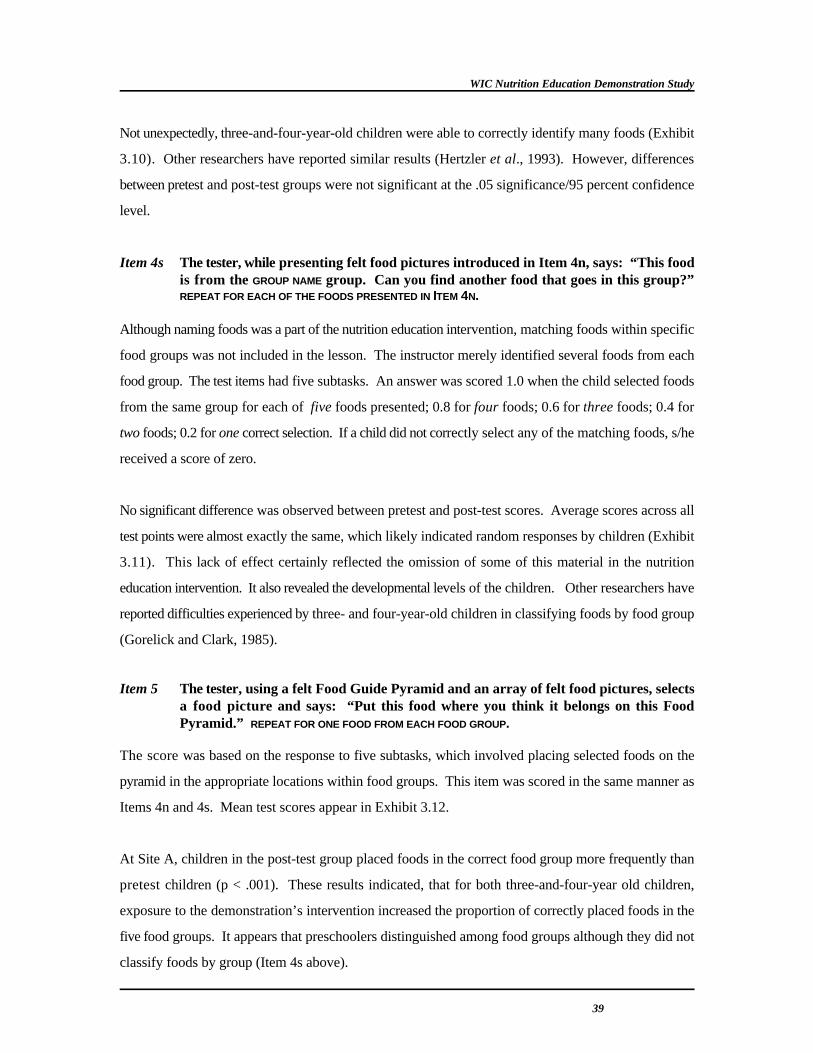
WIC Nutrition Education Demonstration Study
39
Not unexpectedly, three-and-four-year-old children were able to correctly identify many foods (Exhibit
3.10). Other researchers have reported similar results (Hertzler et al., 1993). However, differences
between pretest and post-test groups were not significant at the .05 significance/95 percent confidence
level.
Item 4s The tester, while presenting felt food pictures introduced in Item 4n, says: “This foodis from the GROUP NAME group. Can you find another food that goes in this group?”REPEAT FOR EACH OF THE FOODS PRESENTED IN ITEM 4N.
Although naming foods was a part of the nutrition education intervention, matching foods within specific
food groups was not included in the lesson. The instructor merely identified several foods from each
food group. The test items had five subtasks. An answer was scored 1.0 when the child selected foods
from the same group for each of five foods presented; 0.8 for four foods; 0.6 for three foods; 0.4 for
two foods; 0.2 for one correct selection. If a child did not correctly select any of the matching foods, s/he
received a score of zero.
No significant difference was observed between pretest and post-test scores. Average scores across all
test points were almost exactly the same, which likely indicated random responses by children (Exhibit
3.11). This lack of effect certainly reflected the omission of some of this material in the nutrition
education intervention. It also revealed the developmental levels of the children. Other researchers have
reported difficulties experienced by three- and four-year-old children in classifying foods by food group
(Gorelick and Clark, 1985).
Item 5 The tester, using a felt Food Guide Pyramid and an array of felt food pictures, selectsa food picture and says: “Put this food where you think it belongs on this FoodPyramid.” REPEAT FOR ONE FOOD FROM EACH FOOD GROUP.
The score was based on the response to five subtasks, which involved placing selected foods on the
pyramid in the appropriate locations within food groups. This item was scored in the same manner as
Items 4n and 4s. Mean test scores appear in Exhibit 3.12.
At Site A, children in the post-test group placed foods in the correct food group more frequently than
pretest children (p < .001). These results indicated, that for both three-and-four-year old children,
exposure to the demonstration’s intervention increased the proportion of correctly placed foods in the
five food groups. It appears that preschoolers distinguished among food groups although they did not
classify foods by group (Item 4s above).

WIC Nutrition Education Demonstration Study
40
Exhibit 3.10
Mean Test Scores for WIC Children in Nutrition Education Demonstration Study by Test Point and by Site by Individual Test ItemItem 4n Naming Foods
Mean Score for All Children Mean Score by Age
Three Years Four Years
Number Mean Deviation Number Mean Deviation Number Mean DeviationStandard Standard Standard
Pretest
Site A 133 .57 .25 78 .52 .24 55 .64 .25
Site B 145 .58 .23 87 .51 .22 58 .67 .22
Post-test
Site A 126 .62 .23 62 .59 .24 64 .64 .25
Site B 93 .60 .22 46 .52 .20 47 .68 .22
* Difference between pre- and post-test significant at the p < or = .05 level. *** Difference between pre- and post-test significant at the p < or = .001 level.
NOTES Mean is for item score.Highest possible item score is one.For three-year-olds, at Site A, difference for age is significant at the .10/significance/90 percent confidence level.
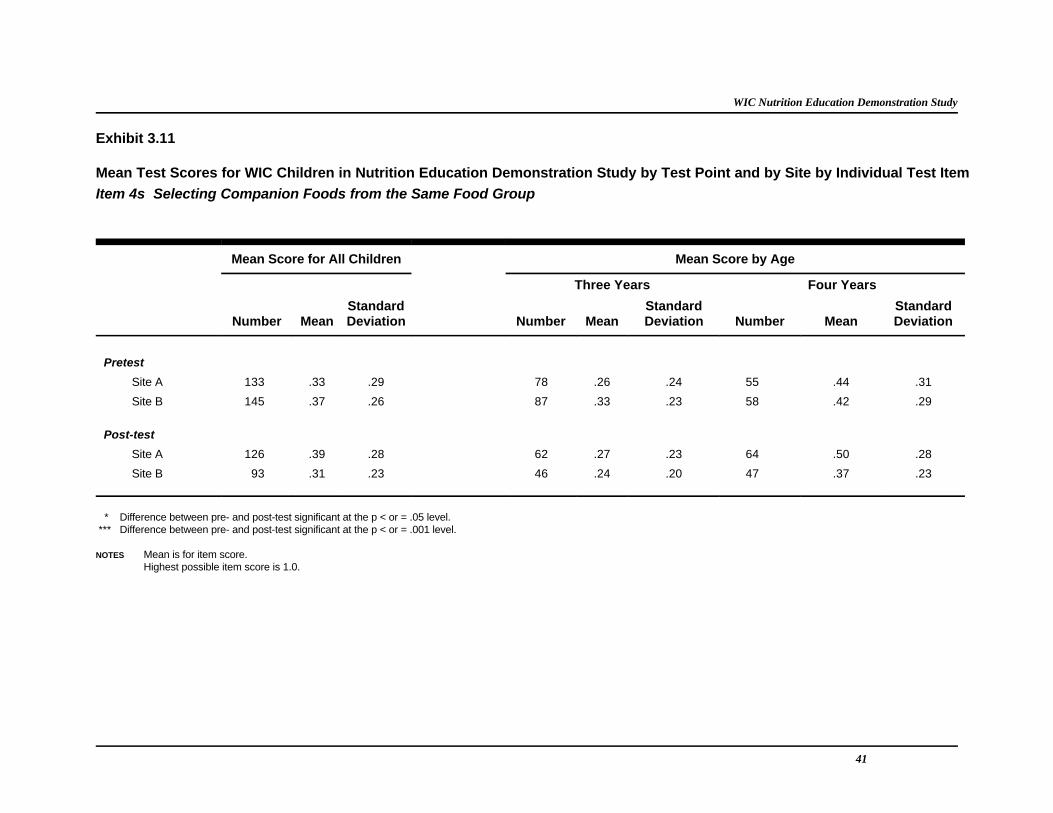
WIC Nutrition Education Demonstration Study
41
Exhibit 3.11
Mean Test Scores for WIC Children in Nutrition Education Demonstration Study by Test Point and by Site by Individual Test ItemItem 4s Selecting Companion Foods from the Same Food Group
Mean Score for All Children Mean Score by Age
Three Years Four Years
Number Mean Deviation Number Mean Deviation Number Mean DeviationStandard Standard Standard
Pretest
Site A 133 .33 .29 78 .26 .24 55 .44 .31
Site B 145 .37 .26 87 .33 .23 58 .42 .29
Post-test
Site A 126 .39 .28 62 .27 .23 64 .50 .28
Site B 93 .31 .23 46 .24 .20 47 .37 .23
* Difference between pre- and post-test significant at the p < or = .05 level. *** Difference between pre- and post-test significant at the p < or = .001 level.
NOTES Mean is for item score.Highest possible item score is 1.0.

WIC Nutrition Education Demonstration Study
42
Exhibit 3.12
Mean Test Scores for WIC Children in Nutrition Education Demonstration Study by Test Point and by Site by Individual Test ItemItem 5 Placing Foods in Correct Food Group
Mean Score for All Children Mean Score by Age
Three Years Four Years
Number Mean Deviation Number Mean Deviation Number Mean DeviationStandard Standard Standard
Pretest
Site A 133 .24 .21 78 .20 .17 55 .31 .25
Site B 145 .28 .20 87 .25 .18 58 .32 .24
Post-test
Site A 126 .42*** .31 62 .30* .27 64 .54*** .31
Site B 93 .27 .22 46 .26 .22 47 .29 .22
* Difference between pre- and post-test significant at the p < or = .05 level. *** Difference between pre- and post-test significant at the p < or = .001 level.
NOTES Mean is for item score.Highest possible item score is 1.0.

WIC Nutrition Education Demonstration Study
An alternative scoring method would employ percent of correct answers.9
43
Item 6 The tester, using the felt Food Guide Pyramid, points to the milk group and thebread group and asks: “From which food group, should you eat more often?”REPEAT FOR MEAT/VEGETABLE AND SWEET/BREAD GROUP COMPARISONS.
Identifying the larger food pyramid sections as the foods we should eat more often occurred throughout
the lesson. This score was based on the response to three subtasks—a score of 1.0 for three correct
selections; 0.667 for two; and .333 for one. An absence of correct selections was scored zero. See
Exhibit 3.13.
We observed, at Site A, a statistically significant seven percentage point difference for the pretest-post-
test comparison (p < .05). On this item, at both sites, four-year-olds outstripped three-year-olds by
considerable margins. Results indicated that, after exposure to the lesson, more older preschoolers
understood that they should eat more foods from certain food groups on the pyramid.
Item 7 The tester, using cards containing two pictures (for example, candybar/watermelon), says: “Each page has two pictures of food on it. One of thefoods is a food that is OK to eat anytime, but the other food should be eaten onlysometimes. Pick out the “anytime” food—the food that should be eaten moreoften.” REPEAT FOR A TOTAL OF SIX CHOICES BETWEEN “ANYTIME”AND “SOMETIMES”FOODS.
Identification of “anytime” and “sometimes” foods was another component of the intervention. In this
task, selection of the “anytime” food was the correct answer. Scoring for the six pairs of pictures was
1.0 for six correct answers; 0.833 for five; 0.667 for four; 0.5 for three; 0.333 for two; and, 0.167 for
one correct answer. If a child failed to select the “anytime” food for any of the subtasks, s/he received
a score of zero.9
No significant difference, at either site, was observed between pretested and post-tested children’s
scores. Item results appear in Exhibit 3.14.
A review of the research indicates other studies reported young children tended to select foods they want
to eat. Often, preschoolers did not apply their actual knowledge of appropriate dietary choices (Gorelick
and Clark, 1985; Anliker et al., 1990; Singleton et al., 1992; and Murphy et al., 1995). The

WIC Nutrition Education Demonstration Study
44
Exhibit 3.13
Mean Test Scores for WIC Children in Nutrition Education Demonstration Study by Test Point and by Site by Individual Test ItemItem 6 Selecting Food Groups
Mean Score for All Children Mean Score by Age
Three Years Four Years
Number Mean Deviation Number Mean Deviation Number Mean DeviationStandard Standard Standard
Pretest
Site A 133 .44 .28 78 .46 .29 55 .41 .27
Site B 145 .38 .30 87 .39 .30 58 .36 .31
Post-test
Site A 126 .51* .32 62 .44 .29 64 .58*** .33
Site B 93 .44 .29 46 .38 .29 47 .50* .27
* Difference between pre- and post-test significant at the p < or = .05 level. *** Difference between pre- and post-test significant at the p < or = .001 level.
NOTES Mean is for item score.Highest possible item score is 1.0.

WIC Nutrition Education Demonstration Study
45
Exhibit 3.14
Mean Test Scores for WIC Children in Nutrition Education Demonstration Study by Test Point and by Site by Individual Test ItemItem 7 Identifying “Anytime” Foods
Mean Score for All Children Mean Score by Age
Three Years Four Years
Number Mean Deviation Number Mean Deviation Number Mean DeviationStandard Standard Standard
Pretest
Site A 133 .49 .28 78 .45 .25 55 .55 .31
Site B 145 .45 .21 87 .46 .21 58 .45 .21
Post-test
Site A 126 .50 .33 62 .40 .29 64 .60 .33
Site B 93 .44 .25 46 .41 .23 47 .46 .26
* Difference between pre- and post-test significant at the p < or = .05 level. *** Difference between pre- and post-test significant at the p < or = .001 level.
NOTES Mean is for item score.Highest possible item score is 1.0.

WIC Nutrition Education Demonstration Study
46
cited researchers found open-ended questions to be more effective in measuring the “anytime-
sometimes” concept, as were tasks that asked the child to select foods for a doll and used language
asking which foods were “good” or “the right kind” to “help you grow.” Our objective in constructing
this item was to avoid any negative connotation for food items. As a result, we used language that may
have impeded our ability to capture children’s actual knowledge of moderation and appropriate dietary
choices.
Item 8 The tester, places two groups of food pictures in front of the child (three“anytime” and three “sometimes” foods), and says: “These are foods you can eatanytime. These three foods you eat sometimes. Why should you eat these foodsPOINT TO ANYTIME FOODS more often than these foods POINT TO SOMETIMES FOODS?”
Responses indicating that “anytime” foods help one to grow strong and healthy were given a score of
1.0; responses that “anytime” foods help one grow strong or healthy were scored 0.6; responses that
“anytime” foods are “good for you” were scored 0.4; and responses indicating children preferred
“anytime” foods (such as, “I like them better”) were scored 0.2. Any other response was scored 0.
At Site A, post-tested four-year-olds performed significantly better than did pretest children (p < .05).
Responses to this item (Exhibit 3.15) illustrated the point made in our discussion of Item 7. Preschoolers
will more frequently offer correct answers about “anytime” foods when asked open-ended questions
(Singleton et al., 1992). These results indicated that the demonstration’s intervention can help
preschoolers understand the concept of moderation as expressed by “anytime” versus “sometimes”
foods.
Item 9 The tester, using a wooden puzzle of the food pyramid, says: “I have this puzzlefor you to do. See, these pieces have pictures of different foods. This one hasfoods from the milk group, this one from the meat group, this one from thevegetable group, this one the fruit group, and this one has the bread group.These pieces fit into this puzzle board, and I'd like you to put the puzzle togetherfor me. OK? You can start now.” AFTER TWO AND ONE-HALF MINUTES, THE TESTER
DISCONTINUES THE ITEM AND COUNTS THE NUMBER OF PIECES PLACED CORRECTLY.
Scoring for this item was 1.0 for six correctly puzzle pieces; 0.833 for five; 0.667 for four; 0.5 for three;
0.333 for two; and, 0.167 for one correctly placed puzzle piece. A score of zero indicated no correctly
placed puzzle pieces.
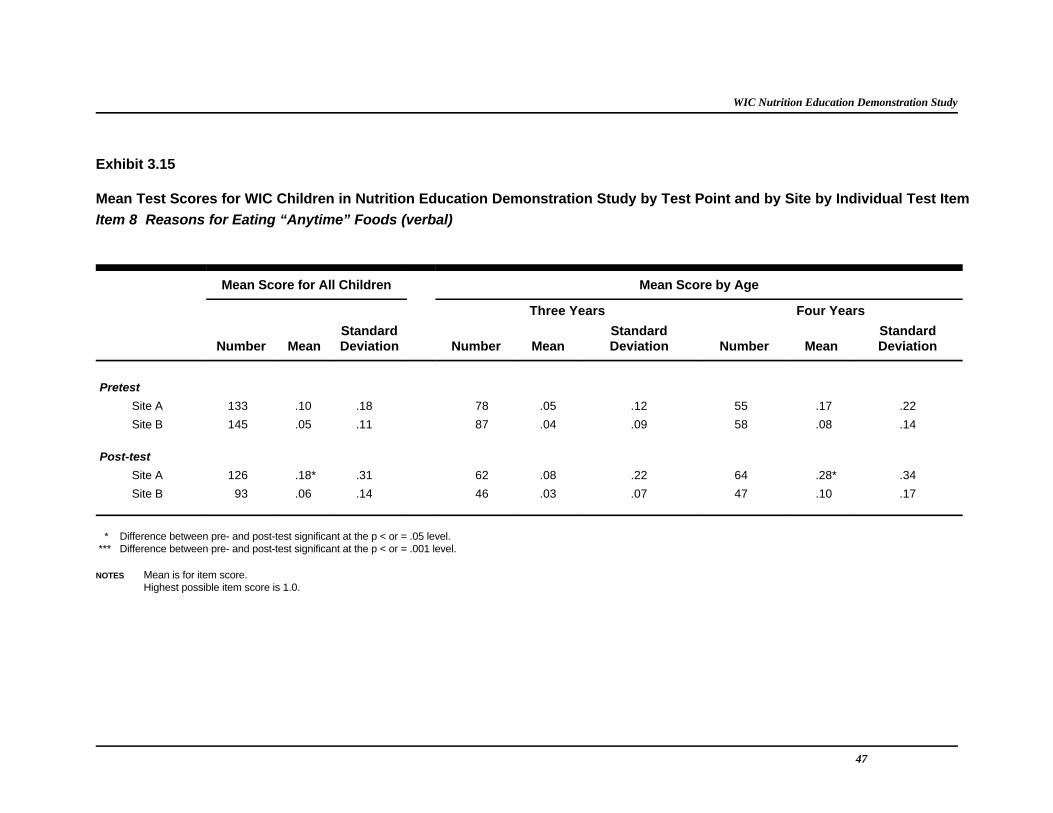
WIC Nutrition Education Demonstration Study
47
Exhibit 3.15
Mean Test Scores for WIC Children in Nutrition Education Demonstration Study by Test Point and by Site by Individual Test ItemItem 8 Reasons for Eating “Anytime” Foods (verbal)
Mean Score for All Children Mean Score by Age
Three Years Four Years
Number Mean Deviation Number Mean Deviation Number Mean DeviationStandard Standard Standard
Pretest
Site A 133 .10 .18 78 .05 .12 55 .17 .22
Site B 145 .05 .11 87 .04 .09 58 .08 .14
Post-test
Site A 126 .18* .31 62 .08 .22 64 .28* .34
Site B 93 .06 .14 46 .03 .07 47 .10 .17
* Difference between pre- and post-test significant at the p < or = .05 level. *** Difference between pre- and post-test significant at the p < or = .001 level.
NOTES Mean is for item score.Highest possible item score is 1.0.

WIC Nutrition Education Demonstration Study
48
At both sites, all post-tested children performed more efficiently on all indicators (score and time to
complete) for the puzzle task (Exhibit 3.16). Post-test scores (t = 6.63, p < .001) were higher on
average when compared with pretest scores.
Although not a test item, total time on task was calculated. On average, post-tested children completed
the puzzle faster than pretested children (t = 2.40, p < .05).
Item Summary
Exhibits 3.17 and 3.18 summarize mean item pretest and post-test scores by site.
At Site A, item-by-item results indicated positive effects from the nutrition education lesson on the
nutrition-related knowledge of three-and four-year-old children. Four of the nine items showed
statistically significant differences overall at the p < .001 level; six of the nine showed differences
significant at the p < .05 level. For both three- and four-year-olds, four items showed statistically
significant differences. Two additional items were significant only for four-year-olds (p < .05). Test
items that did not show statistically significant pre-post differences for either three-year-olds or four-
year-olds are: recognizing variety in food; naming foods and selecting companion foods; and selecting
“anytime” foods. At Site B, three item-by-item findings were statistically significant: verbally or non-
verbally identifying the Food Guide Pyramid; identifying the number of food groups; and completing
the Food Guide Pyramid puzzle. One item, selecting food groups, was statistically significant only for
four-year-olds.
An item-by-item variance analysis indicated that, at both sites, for seven of the nine items, age is the
important predictor variable. (See Exhibit F.4 in Appendix F.) Further item-specific analysis of age and
test point indicated statistically significant interaction effects for three test items (verbal or non-verbal
identification of the Food Guide Pyramid, identification of food groups, and selection of food groups).
See Exhibit F.5 in Appendix F.

WIC Nutrition Education Demonstration Study
49
Exhibit 3.16
Mean Test Scores for WIC Children in Nutrition Education Demonstration Study by Test Point and by Site by Individual Test ItemItem 9 Completing the Food Guide Pyramid Puzzle
Mean Score for All Children Mean Score by Age
Three Years Four Years
Number Mean Deviation Number Mean Deviation Number Mean DeviationStandard Standard Standard
Pretest
Site A 133 .39 .38 78 .30 .33 55 .53 .40
Site B 145 .33 .31 87 .21 .23 58 .51 .33
Post-test
Site A 126 .61*** .37 62 .44* .35 64 .78*** .32
Site B 93 .52*** .34 46 .41*** .28 47 .62 .36
* Difference between pre- and post-test significant at the p < or = .05 level. *** Difference between pre- and post-test significant at the p < or = .001 level.
NOTES Mean is for item score.Highest possible item score is 1.0.For four-year-olds, at Site B, difference for age is significant at the .10/significance/90 percent confidence level.

WIC Nutrition Education Demonstration Study
50
Exhibit 3.17
Summary of Item-Specific Mean Test Scores
Pretest Post-test
Site A % Correct Deviation % Correct DeviationMean Score or Standard Mean Score or Standard
1a. Identifying food pyramid (verbally) .09 .15 .49*** .42
1b. Identifying food pyramid (non-verbally) 63.2 83.3***
2. Identifying food groups 15.0 53.2***
3. Selecting variety plate 29.3 23.0
4n. Naming foods .57 .25 .62 .23
4s. Selecting companion foods .33 .29 .39 .28
5. Placing foods .24 .21 .42*** .31
6. Selecting food groups .44 .28 .51* .32
7. Selecting ”anytime” foods .49 .28 .50 .33
8. Reasons for eating “anytime” foods .10 .18 .18* .31
9. Completing puzzle .39 .38 .61*** .37
Number of children 133 126
* Difference between pre- and post-test significant at the p < or = .05 level. *** Difference between pre- and post-test significant at the p < or = .001 level.
NOTE Items 1b, 2, and 3 report the percent of correct answers. Items 1, 4n, 4s, 5, 6, 7, 8, and 9 are mean scores where a perfect score is 1.0.

WIC Nutrition Education Demonstration Study
51
Exhibit 3.18
Summary of Item-Specific Mean Test Scores
Pretest Post-test
Site B % Correct Deviation % Correct DeviationMean Score or Standard Mean Score or Standard
1a. Identifying food pyramid (verbally) .12 .20 .44*** .41
1b. Identifying food pyramid (non-verbally) 55.2 72.0**
2. Identifying food groups 17.9 60.2***
3. Selecting variety plate 46.9 55.9
4n. Naming foods .58 .23 .60 .22
4s. Selecting companion foods .37 .26 .31 .23
5. Placing foods .28 .20 .27 .22
6. Selecting food groups .38 .30 .44 .29
7. Selecting ”anytime” foods .45 .21 .44 .25
8. Reasons for eating “anytime” foods .05 .11 .06 .14
9. Completing puzzle .33 .31 .52*** .34
Number of children 145 93
* Difference between pre- and post-test significant at the p < or = .05 level. *** Difference between pre- and post-test significant at the p < or = .001 level.
NOTE Items 1b, 2, and 3 report the percent of correct answers. Items 1, 4n, 4s, 5, 6, 7, 8, and 9 are mean scores where a perfect score is 1.0.

52
Chapter Four
Conclusions About Demonstration Findings
The principal objectives of the child component of the WIC Nutrition Education Demonstration Study
were to assess: (1) the feasibility of providing nutrition education to three-and-four-year-old children
in WIC settings; and (2) the effect of a selected intervention on their nutrition knowledge.
Nutrition education can be provided to three- and four-year-old children in WIC settings. Study
results show that nutrition education can be provided to children while their mothers complete the WIC
certification process. There appeared to be ample time and space in the clinics for the nutrition education
intervention to take place. Data from standardized observation protocols indicate that children were, in
general, attentive during the nutrition intervention which was conducted by local WIC clinic staff. The
costs and sustainability of nutrition education interventions, without additional federal funding, remain
open questions.
Short interventions appear to be practical strategies for teaching WIC children about nutrition.
Most local WIC clinics and participants have limited time available for nutrition education. A thirty-
minute lesson, used in this demonstration, appears to satisfy this constraint. Moreover, it appears that
one half-hour is approximately the length of time that children can be attentive to the instruction. Given
this constraint, it is very important to select lesson content that is appropriate to three-and-four-year-old
children. (See below.)
The nutrition education intervention increased children�'�s knowledge on some WIC nutrition
topics but not others. Results indicate that children participating in the demonstration showed an
increase in their knowledge about the Food Guide Pyramid, food groups, and eating foods that help them
grow healthy and strong. Although the differences between pre- and post-tests were consistently higher
and statistically significant for the treatment groups, it should be pointed out that four of the eleven test
items dealt with the Food Guide Pyramid. Knowledge of a variety of foods, selecting companion foods,
and identifying "anytime" foods seemed to be unaffected by the intervention. As expected, four-year-old
children performed better on the tests than three-year-olds.
These findings appear to indicate that nutrition education for young children in WIC settings has
limitations and that the content of the interventions needs to be examined for appropriateness for this

WIC Nutrition Education Demonstration Study
53
age group. The test assessing children's nutrition knowledge should also be revisited.
Clinics may expect different levels of participation in nutrition education by children. The study
found substantial differences in the percentages of children who participated at the two demonstration
sites. This variation may have implications for resources needed to attract children and their parents to
participate in nutrition education and to maintain sufficient levels of participation to justify the
expenditure of funds.
More information is needed on the cost and sustainability of nutrition education for young
children in the WIC Program. For a number of reasons, the study was not able to collect sufficient
information to determine the cost and sustainability of the nutrition education intervention implemented
in this study. It appears, however, that significant additional resources would be required to maintain
such interventions at local WIC clinics. These resources include staff needed to schedule nutrition
lessons and provide instruction and testing, instructional materials, and physical space to conduct the
instruction.

WIC Nutrition Education Demonstration Study
54
References
American Dietetic Association. 1996. �Nutrition Education for the Public.� Journal of the AmericanDietetic Association, 96: 1183-1187.
American Dietetic Association. 1996. �Position of the American Dietetic Association: Child andAdolescent Food and Nutrition Programs.� Journal of the American Dietetic Association, 96(9): 913-917.
Anliker JA, ML Laus, KW Samonds, and VA Beal. 1990. �Parental Messages and the NutritionAwareness of Preschool Children.� Journal of Nutrition Education, 22: 24-29.
Bronner YL. 1996. �Nutritional Status Outcomes for Children: Ethnic, Cultural and EnvironmentalContexts.� Journal of the American Dietetic Association, (96)9:891-900,903.
Birch LL and DW Marlin. 1982. �I Don't Like it; I Never Tried It�: Effects of Exposure on Two-Year-Old Children's Food Preferences.� Appetite: the Journal of Intake Research, 3: 3533-60
Birch LL. 1980. �Effect of Peer Model's Food Choices and Eating Behavior on Preschoolers' FoodPreferences.� Child Development, 51: 489-496.
Birch LL, SI Zimmerman, H Hind. 1980. �The Influence of Social-Affective Context on the Formationof Children's Food Preferences.� Child Development, 51: 856-861.
Byrd-Bredbenner C, ML Marecic, J Bernstein. 1993. �Development of a Nutrition EducationCurriculum for HeadStart Children.� Journal of Nutrition Education, 25: 134-139.
Campbell, DT and JC Stanley. 1963. Experimental Quasi-Experimental Designs for Research. Chicago: Rand-McNally College Publishing Company.
Centers for Disease Control and Prevention. 1996. �Guidelines for School Health Programs to PromoteLifelong Healthy Eating.� MMWR, (No. RR-9): 1-45.
Cohen, J. 1969. Statistical Power Analysis for the Social Sciences. New York: Academic Press.
Connell DB, RR Turner, EF Mason. 1985. �Summary of Findings of the School Health EducationEvaluation: Health Promotion Effectiveness, Implementation, and Costs.� Journal of SchoolHealth, 55(8): 316-321.
Contento I, GI Balch, YL Bronner, DM Paige, SM Gross, LA Lytle, SK Maloney, CM Olson, SSSwadener, L Bisignani, SL White. 1995. �The Effectiveness of Nutrition Education andImplications for Nutrition Education Policy, Programs, and Research: A Review of Research.� Journal of Nutrition Education, 27: 275-422.
Crockett SJ and LS Sims. 1995. �Environmental Influences on Children's Eating.� Journal of

WIC Nutrition Education Demonstration Study
55
Nutrition Education, 7(5): 250-260.
Davis SE, EM Bassler, JV Anderson, JC Fryer. 1983. �A Nutrition Education Program for PreschoolChildren.� Journal of Nutrition Education, 15: 4-5.
Devaney BL, AR Gordon, JA Burghardt. 1995. �Dietary Intakes of Students.� American Journal ofClinical Nutrition, 61(1suppl): 205S-212S.
Essa EL, M Read, R Haney-Clark. 1988. �Effects of Parent Augmentation on Preschool Children'sKnowledge Scores. Child Study Journal, 18: 193.
Federation of American Societies for Experimental Biology (FASEB), Life Sciences Research Office. 1995. Third Report on Nutrition Monitoring in the United States, Volume 1. Prepared forInteragency Board for Nutrition Monitoring and Related Research. Washington, DC: USGovernment Printing Office.
Gelman, R. 1969. �Conservation Acquisition: A Problem of Learning to Attend to RelevantAttributes.� Journal of Experimental Child Psychology, 7: 186-187.
Gorelick MC and EA Clark. 1985. �Effects of a Nutrition Program on Knowledge of PreschoolChildren.� Journal of Nutrition Education,; 17: 88-92.
Hendricks C. 1989. The Impact of Preschool Health Curriculum on Children's Health Knowledge�. Journal of School Health, 59: 389-92.
Hertzler AA and K DeBord. 1994. �Preschoolers� Developmentally Appropriate Food and NutritionSkills.� Journal of Nutrition Education, 26: 166-167B.
Hertzler AA, J Bowen, S Hull. 1993. �Preschoolers� Reporting of Food Habits.� Journal of theAmerican Dietetic Association, 93 (10): 1159-1161.
Kennedy E, L Meyers, W Layden. 1996. �The 1995 Dietary Guidelines for Americans: An Overview.� Journal of the American Dietetic Association, 96: 234-237.
Kirks BA and C Hughes. 1986. �Long-term Behavioral Effects of Parent Involvement in NutritionEducation.� Journal of Nutrition Education, 18 (5): 203-206.
Klesges R, RJ Stein, LH Eck, TR Isbell, MS Klesges. 1991. �Parent Influence on Food Selection inYoung Children and Its Relationship to Childhood Obesity.� American Journal of ClinicalNutrition, 53: 859-864.
Koblinsky SA, JF Guthrie, L Lynch. 1992. �Evaluation of a Nutrition Education Program for HeadStartParents.� Journal of Nutrition Education, 24: 4-13.
Lawatsch DE. 1990. �A Comparison of Two Teaching Strategies on Nutrition Knowledge, Attitudesand Food Behavior of Preschool Children.� Journal of Nutrition Education, 22: 117-123.
Lenfant C. 1995. �Improving the Health of America's Youth: the NHLBI Perspective.� Journal ofHealth Education, 26: 6-8.

WIC Nutrition Education Demonstration Study
56
Luepker RV, CK Oerrt, SM McKinlay, PR Nader, GS Parcel, EJ Stone, LS Webber, JP Elder, HAFeldman, CC Johnson, SH Kelder, M Wu. 1996. �Outcomes of a Field Trial to Improve Children'sDietary Patterns and Physical Activity: the Child and Adolescent Trial for Cardiovascular Health(CATCH). Journal of the American Medical Association, 275 (10): 768-769.
Mayfield BJ. 1992. Kid's Club: Nutrition Learning Activities for Young Children. Delphi, Indiana: Noteworthy Publications.
Michela JL and IR Contento. 1984. �Spontaneous Classification of Foods by Elementary School-agedChildren.� Health Education Quarterly, 11 (1): 57-76.
Murphy AS, JP Youatt, SL Hoerr, CA Sawyer, SL Andrews. 1995. �Kindergarten Students� FoodPreferences Are Not Consistent with Their Knowledge of the Dietary Guidelines.� Journal of theAmerican Dietetic Association, 95 (2): 219-223.
Nicklas T. 1995. �Dietary Studies of Children: the Bogalusa Heart Study Experience.� Journal of theAmerican Dietetic Association, 95: 1127-1133.
Pestano-Binghay E, J Reis, M Walters. 1993. �Nutrition Education Issues for Minority Parents: ANeeds Assessment.� Journal of Nutrition Education, 25 (3): 144-146.
Public Health Service. 1991. Healthy People 2000: National Health Promotion and DiseasePrevention Objectives. Washington, DC: US Department of Health and Human Services, PublicHealth Service, DHHS publication no. (PHS) 91-50212.
Randall B, L Boast, L Holst. 1995. Study of WIC Participant and Program Characteristics 1994. Washington, DC: US Department. of Agriculture.
Reed DB. 1996. �Focus Groups Identify Desirable Features of Nutrition Programs for Low-IncomeMothers of Preschool Children. Journal of the American Dietetic Association, 96 (5): 501-503.
Rickard, KA, DL Gallahue, GE Gruen, M Tridle, N Bewley, K Steele. 1995. �The Play Approach toLearning in the Context of Families and Schools: An Alternative Paradigm for Nutrition and FitnessEducation in the 21st Century.� Journal of the American Dietetic Association, 96 (10): 1121-1126.
Singleton JC, CL Achterberg, BM Shannon. 1992. �Role of Food and Nutrition in the HealthPerception of Young Children.� Journal of the American Dietetic Association, 11: 67-70.
Society for Nutrition Education. 1995. �Joint Position of Society for Nutrition Education, the AmericanDietetic Association, and the American School Food Service Association: School-Based NutritionPrograms and Services.� Journal of Nutrition Education, 27: 58-61.
Turner RE and WD Evers. 1987. �Development and Testing of a Microcomputer Nutrition EducationLesson for Preschoolers.� Journal of Nutrition Education, 19: 104-108.
US Department of Agriculture. 1992. Food Guide Pyramid: A Guide to Daily Food Choices. Washington, DC: USDA, Human Nutrition Information Service, Home and Garden Bulletin No.252.

WIC Nutrition Education Demonstration Study
57
US Department of Agriculture, Agricultural Research Service. In press. Food and Nutrient Intakes inthe United States, 1 Day, 1989-91. Continuing Survey of Food Intakes by Individuals, 1989-91. NFS Report No. 91-2. U.S. Department of Agriculture, Agricultural Research Service,Washington, DC. USDA.
US Departments of Agriculture and Health and Human Services. 1995 Nutrition and Your Health:Dietary Guidelines for Americans, fourth edition. Washington, DC: USDA and USDHHS, Homeand Garden Bulletin No. 232.
Weiss EH and CL Kien. 1987. �A Synthesis of Research on Nutrition Education at the ElementarySchool Level.� Journal of School Health, 57(1): 8-13
Yperman AM and JA Vermeersch. 1979. �Factors Associated with Children's Food Habits.� Journalof Nutrition Education, 11(2): 72-76.

Appendix A
Research on Nutrition Education Theory and Practice
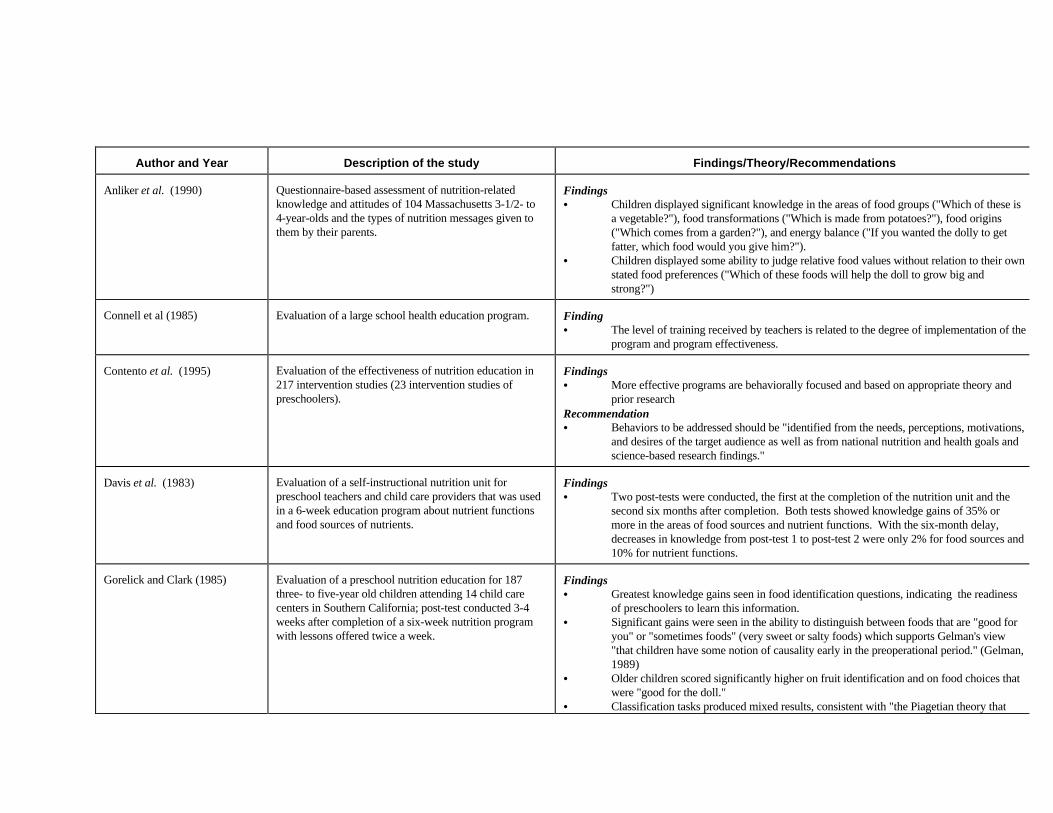
Author and Year Description of the study Findings/Theory/Recommendations
Anliker et al. (1990) Questionnaire-based assessment of nutrition-relatedknowledge and attitudes of 104 Massachusetts 3-1/2- to4-year-olds and the types of nutrition messages given tothem by their parents.
FindingsC Children displayed significant knowledge in the areas of food groups ("Which of these is
a vegetable?"), food transformations ("Which is made from potatoes?"), food origins("Which comes from a garden?"), and energy balance ("If you wanted the dolly to getfatter, which food would you give him?").
C Children displayed some ability to judge relative food values without relation to their ownstated food preferences ("Which of these foods will help the doll to grow big andstrong?")
Connell et al (1985) Evaluation of a large school health education program. FindingC The level of training received by teachers is related to the degree of implementation of the
program and program effectiveness.
Contento et al. (1995) Evaluation of the effectiveness of nutrition education in217 intervention studies (23 intervention studies ofpreschoolers).
FindingsC More effective programs are behaviorally focused and based on appropriate theory and
prior researchRecommendationC Behaviors to be addressed should be "identified from the needs, perceptions, motivations,
and desires of the target audience as well as from national nutrition and health goals andscience-based research findings."
Davis et al. (1983) Evaluation of a self-instructional nutrition unit forpreschool teachers and child care providers that was usedin a 6-week education program about nutrient functionsand food sources of nutrients.
FindingsC Two post-tests were conducted, the first at the completion of the nutrition unit and the
second six months after completion. Both tests showed knowledge gains of 35% ormore in the areas of food sources and nutrient functions. With the six-month delay,decreases in knowledge from post-test 1 to post-test 2 were only 2% for food sources and10% for nutrient functions.
Gorelick and Clark (1985) Evaluation of a preschool nutrition education for 187three- to five-year old children attending 14 child carecenters in Southern California; post-test conducted 3-4weeks after completion of a six-week nutrition programwith lessons offered twice a week.
FindingsC Greatest knowledge gains seen in food identification questions, indicating the readiness
of preschoolers to learn this information.C Significant gains were seen in the ability to distinguish between foods that are "good for
you" or "sometimes foods" (very sweet or salty foods) which supports Gelman's view"that children have some notion of causality early in the preoperational period." (Gelman,1989)
C Older children scored significantly higher on fruit identification and on food choices thatwere "good for the doll."
C Classification tasks produced mixed results, consistent with "the Piagetian theory that

Author and Year Description of the study Findings/Theory/Recommendations
children do not master the subtleties of classification until they enter the concreteoperational level at approximately age seven".
C Food groups may be difficult to categorize because of similarities in shape, taste, or colorof foods from different groups (grapes/peas, yams/melon, unpared potato/kiwi).
Guidelines for School HealthPrograms to Promote LifelongHealthy Eating (CDC, 1996)
Synthesis of recent research, theory, and practice forreport providing guidelines for a comprehensive,sequential school-based nutrition education program forpreschool through grade twelve.
FindingC Most nutrition education programs that result in behavioral change have been based on
social learning theory which seeks to positively effect attitudes and behavior and not justknowledge.
TheoryC Some social learning theory strategies include: promotion of positive attitudes and values
about health and nutrition and identifying the short-term benefits, which may have morevalue to children and interest them more than the long-term benefits.
Hendricks et al. (1989) Assessed pre/post knowledge differences in 214 childrenaveraging 4.7 years of age in 9 preschools; post-testsconducted 8 months after introduction of healthcurriculum that included a nutrition component.
FindingsC Experimental group had significant knowledge gains on nutrition items.RecommendationsC Use age-appropriate subject matter.C Involve parents.C Provide inservice training for teachers.C Activities should promote development of fine and gross motor, language, cognitive, self-
help, and social skills as well as healthful behavior.
Hertzler et al. (1993) Assessed ability of 30 preschoolers between age 2 years11 months and 5 years 6 months to report food habits.
FindingsC 3-year-olds can name foods served daily and count to one or two foods. C Four- and 5-year-olds should be able to name single foods served weekly, count to 8 or
10, and begin to deal with abstractions such as spatial volume and mixture names. C Older preschoolers (i.e. 5-year-olds) can classify foods by food group and name foods in
different forms.
Hertzler and DeBord (1994) Four nutrition education lessons were tested with childrenbetween 2-6 years of age for developmentalappropriateness
FindingsC 3-5-year-olds can learn the names of objects and begin to classify by size, color, shape,
and other attributesC 4-6-year-olds can group foods by the nutrients they contain (fat, vitamin A, iron, calcium)RecommendationsC Use a nutrition plan such as the Food Guide Pyramid as the basis of activities.C Teaching methods and materials should be developmentally appropriate for child.C "Telling" should only be used in emergencies.C Parental involvement is vital for reinforcement.
Lawatsch (1990) Two teaching strategies, benefit appeal and threatappeal, were investigated using modified fairy tales that
FindingsC Both groups had higher post-test knowledge scores than the control group, but the

Author and Year Description of the study Findings/Theory/Recommendations
encouraged eating vegetables with 103 New Jerseypreschoolers averaging 51 months of age.
benefit appeal group had the highest scores.C The benefit appeal group had higher food behavior assessment scores for selecting snacks
than children in the control group and higher scores for half of the snacks than the threatappeal group whereas the threat appeal group only had higher food behavior assessmentscores for half of the snacks than the control group.
RecommendationC Benefit appeal appears to be more effective at promoting knowledge gains and desirable
food choices than threat appeal, although threat appeal also produces a significant effect.
Mayfield (1992) 26-lesson preschool nutrition education curriculumdesigned for use in the WIC Program and pilot-tested in33 Indiana local WIC agencies.
RecommendationsC Opportunities should be provided for different kinds of learning: self-learning, which is
discovery or exploratory learning; meaningful learning that "bridges" between familiarand new information; and concrete/active learning that involves the five senses such astasting new foods, songs, movement, and other hands-on activities
C Goal is to promote positive atitudes, increased knowledge and healthful food andnutrition behaviors.
C Activities should be developmentally appropriate and involve fine motor, gross motor,language, social, and cognitive areas.
C Parents should be involved in nutrition education activities.
Michela and Contento (1984) Study of conceptions about nutrients and definitionsunderlying classification of foods into group in onehundred fifteen 5-11 year olds.
FindingsC Children in preoperational stage of cognitive development (5-6 year olds) generally
divided foods into groups based on two characteristics: sweets versus non-sweet foodsand liquids versus solids.
C Food groups selected by older children (mixed cognitive levels) included: sweets, meatand fish, fruits, vegetables, drinks, dairy, breads, grains, and meals. Food groups werebased on characteristics such as traditional categories, functional categories (snacks,lunch, etc.), nutritional quality, taste/texture, food unknown or never tried, foodpreferences, and miscellaneous.
Murphy et al. (1995) Evaluated 62 Michigan kindergarten students'understanding of the Dietary Guidelines in 12 focus-groupinterviews.
FindingsC Kindergartners understand the thrust of the Dietary Guidelines: increase the healthful
foods you eat and decrease intake of less healthful foods. C The term variety was not well understood by kindergartners. C Students could classify or group foods that they should eat more or less of (that have lots
of/or little fat, sugar, or salt).C Students stated high fat or sweet foods when asked, "What foods are not good for you?"
and responded that fruit, vegetables, and milk "are good for you". C Food preferences were not consistent with children's knowledge of the Dietary
Guidelines. In response to, "Are there any foods you like but think you shouldn't eat?"responses were primarily high-sugar foods such as candy, ice cream, gum, and pop.
C Children believe there are good and bad foods.

Author and Year Description of the study Findings/Theory/Recommendations
Rickard et al. 1995 Play approach used in two different, integrated nutritionand fitness education programs for obese children aged 5-6 and 7-10 years.
FindingsC Children and parents were enthusiastic about a nutrition and activity program using the
play approach with everyday activities related to active playing and happy, healthfuleating.
TheoryC Internal knowledge and intrinsic motivation are the primary determinants of healthful
choices and life habits.C The play approach is a process for learning that fosters intrinsic motivation for continued
successful and healthful life habits.C Play, the work of childhood, is pleasurable, freely chosen, an active process, nonliteral
(no right or wrong), and safe.Recommendations:C Learning should be child-centered (individualized) and education should be
developmentally appropriate.C Learning activities should include opportunities for play and self-discovery. C Tasks should involve entire child; that is, the cognitive, physical, and affective domains.C Peer interaction is an important source of learning.
Singleton et al. (1992) Evaluation of the role of food and nutrition in the healthperceptions in interviews of sixty 4-7 year olds using apretest/post-test, treatment and control design.
FindingsC When children were asked, "What are the right kind of foods?" they named specific
vegetables and fruits.C Children responded that "unhealthy foods" were foods high in sugar.C Analysis of open-ended questions showed a positive program effect, but analysis of
closed-ended questions indicated no program effect.RecommendationC Caution should be used if closed-ended, forced-choice evaluation procedures are utilized
with young children because they may underestimate the children's knowledge and theprogram's effectiveness.
Weiss and Kein (1987) Literature review of importance of teacher training,teaching strategies, parental involvement, curricularconcerns, administrative support, and social/culturalfactors on the impact of nutrition education.
RecommendationsC Teacher training should focus on teaching strategies in addition to nutrition content. C Nutrition education is most effective with a planned, organized curriculum based on a
theoretical framework. C Nutrition instruction should involve children directly and actively in the learning process.
C Peer education and parental support and participation are important influences onlearning and behavior.

Appendix B
Lesson PlanThe Food Guide Pyramid
WIC Nutrition Education Demonstration Study

THE FOOD GUIDE PYRAMIDSHOWS YOU WHAT TO EAT!!
A KID’S CLUB LESSON PLANfor USDA’s WIC Nutrition Education Demonstration Study
BY BARBARA J. MAYFIELD, M.S, R.D.
PURPOSE:
Children learn that the Food Guide Pyramid shows them nutritious foods to eat togrow well and stay healthy.
OBJECTIVES:
1. Food Pyramid: The Kid’s Club participant will be able to identify the FoodGuide Pyramid (FGP) as the “Food Pyramid.”(They will be able to locate the FGP when shown several graphics and will tryto say “Food Pyramid.”)
2. Variety: The Kid’s Club participant will know they need to eat manydifferent kinds of foods to grow well and stay healthy.
a. Five Food Groups: The children will know they need to eat foodsfrom all five of the food groups on the FGP.
b. Food Identification: The children will be able to correctly identifyone or more foods (in each of the segments) on the FGP.
c. Food Classification: The children may be able to classify similarfoods into appropriate food groups and may know the names of thefood groups on the FGP.
3. Proportionality: The Kid’s Club participant will know they need to eat morefood from the bigger sections found at the bottom of the FGP and less foodfrom the smaller sections at the top.
4. Moderation: The Kid’s Club participant will know that the foods in the fivefood group sections on the FGP (“anytime foods”) are better choices forgrowing and staying healthy and should be eaten more often than the foodsfound at the top of the FGP (“sometimes foods” such as candy and softdrinks).

WELCOME AND INTRODUCTION:
Attendance and name tags (use name tags cut in circle, square, and triangleshapes).
Sit in circle on the floor. May sit around small round plastic tablecloth or oncarpet squares (one per child).
Introduce self and Wicky puppet, greet each child by name.
ASSESSMENT QUESTIONS:
“Wicky’s Wonder Box” contains a triangle and a blank 3-dimensional pyramid.Use the pyramid found on page 35 of the storybook (The Kid’s Club Cubs and the Searchfor the Treasures of the Pyramid) by making a photocopy and folding it inside-out.
Wicky: “I have two shapes to show you in my Wonder Box today.”
(Hold up triangle.) “Does anyone know what this shape is?”
“Who has a name tag that is this shape?What other shapes do you see on our name tags?”
(Hold up the pyramid.)“Look at this shape. It isn’t flat like our triangle, is it?”
(Point out how each side of the shape is a triangle.)
“Does anyone know what it’s called? Have you ever seen one?”(allow for responses -- expect children to say:“triangle,” “hat,” “tent,” “roof,” etc., or nothing.)
If no one knows what it is, say...
“This shape is a pyramid. Can you say that with me?”
(Have them repeat the word.)
“Today in Kid’s Club we’re going to learn about a special kind ofpyramid that shows us what to eat to be healthy.”
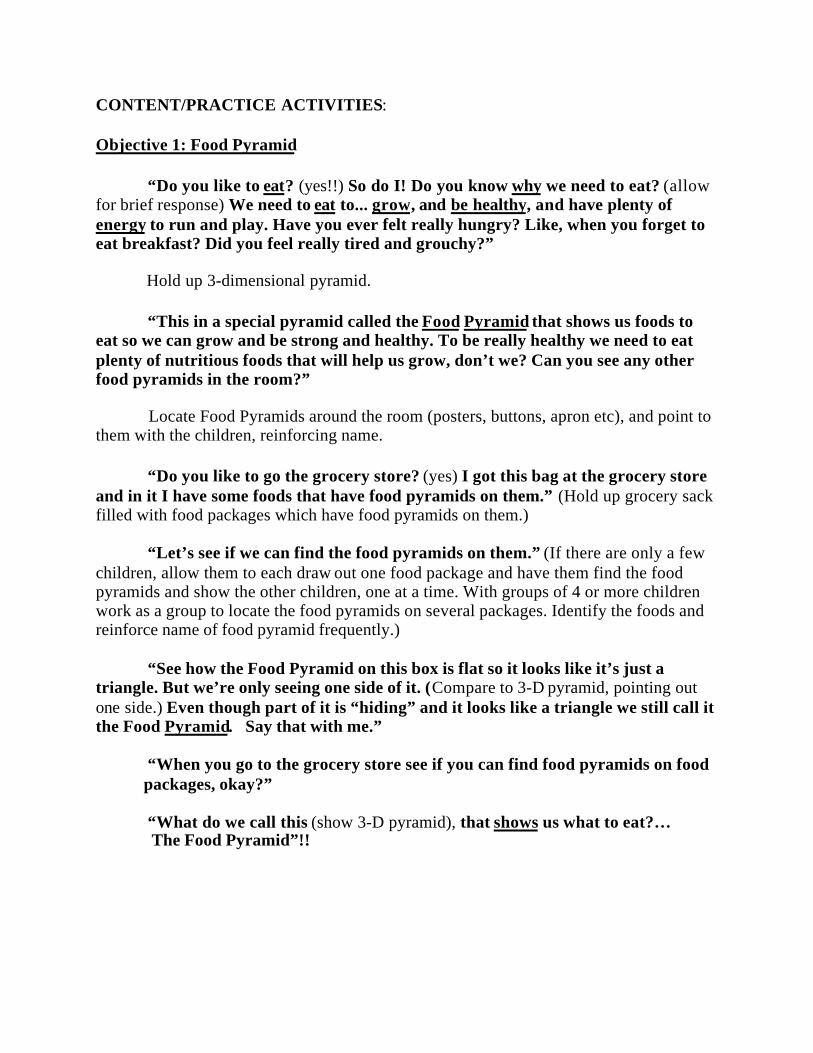
CONTENT/PRACTICE ACTIVITIES:
Objective 1: Food Pyramid
“Do you like to eat? (yes!!) So do I! Do you know why we need to eat? (allowfor brief response) We need to eat to... grow, and be healthy, and have plenty ofenergy to run and play. Have you ever felt really hungry? Like, when you forget toeat breakfast? Did you feel really tired and grouchy?”
Hold up 3-dimensional pyramid.
“This in a special pyramid called the Food Pyramid that shows us foods toeat so we can grow and be strong and healthy. To be really healthy we need to eatplenty of nutritious foods that will help us grow, don’t we? Can you see any otherfood pyramids in the room?”
Locate Food Pyramids around the room (posters, buttons, apron etc), and point tothem with the children, reinforcing name.
“Do you like to go the grocery store? (yes) I got this bag at the grocery storeand in it I have some foods that have food pyramids on them.” (Hold up grocery sackfilled with food packages which have food pyramids on them.)
“Let’s see if we can find the food pyramids on them.” (If there are only a fewchildren, allow them to each draw out one food package and have them find the foodpyramids and show the other children, one at a time. With groups of 4 or more childrenwork as a group to locate the food pyramids on several packages. Identify the foods andreinforce name of food pyramid frequently.)
“See how the Food Pyramid on this box is flat so it looks like it’s just atriangle. But we’re only seeing one side of it. (Compare to 3-D pyramid, pointing outone side.) Even though part of it is “hiding” and it looks like a triangle we still call itthe Food Pyramid. Say that with me.”
“When you go to the grocery store see if you can find food pyramids on foodpackages, okay?”
“What do we call this (show 3-D pyramid), that shows us what to eat?… The Food Pyramid”!!

Objective 2: Variety
a. Five Food Groups
Place laminated poster of the Food Pyramid (cut around pyramid shape) on thefloor in center of children.
“Do you see how the Food Pyramid has different sections like pieces in apuzzle? Foods that are alike are in the same food group. Let’s see what differentpieces we have.”
(Using a second poster cut into sections and laminated, hold up each food groupsection, beginning with the bread group, naming the group, and having the children findthe matching group on the poster. Lay “puzzle piece” over corresponding section on theposter. Talk about size and location of each piece.)
“There are lots of different kinds of foods we need to eat to grow and behealthy, aren’t there? Let’s count how many food groups there are.”
(Count to five and point to sections on FGP.) -
“All of these foods on the Food Pyramid are healthy, but we can’t eat justone kind of food. We need to eat foods from all 5 food groups everyday to grow andbe healthy. If we ate only foods from the ________ (name and point to a group) group wewouldn’t grow well and be healthy.”(repeat for several groups)
“We need to eat a variety of different foods everyday. We need to eat foodsfrom all the different food groups. Let’s count how many food groups we need toeat...”
Sing: “Five Healthy Food Groups”
Count with fingers as you sing. ‘Listen to talking on tape before and after songs:
“How many food groups are there? 1? 2? 3? 4? 5?”
(Shake head “no” to emphasize not 1, 2, 3, or 4.)

b. Food Identification
Game: “We’re Going On a Picnic”
Lay aside poster of the Food Pyramid and replace it with flannelboard of the FoodPyramid (mounted on foam core) in the middle of the circle of -children; or place secondpyramid on top of poster.
“Now let’s play a game to pick foods to help us grow. This pyramid doesn’thave pictures of foods on it. I’m going to put some pictures of foods in the differentspaces and we’ll take turns picking foods to take on an imaginary picnic. Do youlike to go on picnics? So do I? Everyone will get a turn to pick at least one food forour picnic, so please don’t pick up the pictures until it’s your turn, okay’?”
Place food pictures in piles on appropriate sections of the pyramid (have themsorted so this can be done quickly). Teacher begins with a small “picnic basket” and says:
“We’re going on a picnic and I’m going to pack ________________”(pick up a food, name it, and put it in the basket).
Pass the basket to child on the left (if that child is shy may decide to start on theright). Help them repeat the phrase:
“We’re going on a picnic and _________________ (child’s name) is going to pack.....”
Make sure children identify food they select before they place it in the picnicbasket. Have children with good verbal skills name the foods they selected, sayingsomething like:
“________________ (child’s name), what food did you pick?”
Ask children who are shy or have poorer verbal skills to agree with you as youname the food, saying something like:
“_______________ (child’s name), did you pick (cheese) for our picnic?”
After they make their selection, teacher can say something like:“_________________ (child’s name) picked ____________ (food), from the _____________ (name of food
group) group, that’s a food that will help you grow -- good choice!”
Continue around the circle until everyone has one or more turns. Then teachertakes the basket and removes all remaining foods off the pyramid and sets them aside.

c. Food Classification
Game continues...
“Let’s see what we packed for our picnic today.” Teacher pulls out a food,has the children name it and teacher places it on the pyramid where it belongs. Ifchildren are able to, allow them to tell you where to place the foods: “Do youremember where this food belonged on the Food Pyramid?” Reinforce names offood groups “That’s right. We packed cheese from the milk group.”.
Emphasize desirable characteristics of foods: variety of pretty colors, shapes,sizes, tastes, etc. If a child says they don’t like/eat a food, respond by saying that youlike the food and ask the group who else likes it. Mention that although they mightnot like it now they might like it the next time they try it.
When all foods have been named, teacher asks: “Do we have foods from all fivefood groups’?” (If not, which foods do we need?)
“That’s great! We packed a variety of different foods, what a greatpicnic!” (leave food pictures from picnic on flannelboard)
Variety Review:
“How many food groups are there?” (5) “We can’t eat just one kind offood to grow well and be healthy, can we?”
“Let me introduce you to two puppet friends, Katie and Kevin. They likeeating healthy foods but they don’t know about the Food Pyramid and thatthere are 5 different food groups...
“This is Kevin. Everyday he eats lots of good food, but he only eats foodsfrom the bread group. He has cereal, and bread, and waffles, and buns, andcrackers... but no foods from any other group. (show children a plate of food withfive foods from bread group, set aside with Kevin puppet next to it)
“This is Katie. Everyday she eats lots of good food, but she only eats foodsfrom the fruit group. She has cantaloupe, and oranges and grapes, and apples,and peaches but no foods from any other group” (show children a plate of foodwith five foods from the fruit group, set aside with Katie puppet next to it)
“Do you think Katie and Kevin will grow well and stay healthy by eatingonly fruit or only bread? ”

“Every food group gives us something different we need to grow and behealthy: so, if we don’t eat foods from all 5 food groups we’ll be missingsomething. ”
“I like to eat foods from all 5 food groups: bread, and chicken, and milk, andcorn, and an apple.”(show children a plate with one food from each food group, namingfoods).
Place 3 plates in front of you. “Which one of these plates has a variety ofdifferent foods from all 5 of the food groups on the Food Pyramid? ” (allow forresponses, name foods and food groups)
“And doesn’t that look more fun and interesting to eat than just one kind offood?! You wouldn’t want to eat just one kind of food all the time. It would be soboring and you wouldn’t grow as well.”
Set plates and puppets aside.
Objective 3: Proportionality
“Which space on the Food Pyramid is the biggest?”
“That’s right. This big space at the bottom is the biggest food group.”
“That means we need to eat more food from the Bread group than any other
food group.”
“Do you see how the space at the top of the Food Pyramid is the smallest?”
“That’s where we put sweet and fatty foods like candy and soda pop, butter
and jelly, and rich-gooey desserts. (Place examples in section.)
At this point children may express how much they like to eat these foods. Remindthem not to grab the pretend foods. Compare “anytime” and “sometimes” foods avoiding“good food-bad food” comparisons. This will introduce the concept of moderation. Selectcomments based on what children say and do:
“These foods at the top of the pyramid do taste good. I like to eat themsometimes, too.”

“I wouldn’t want to eat them all the time, would you? If I eat too many sweetthings, I get a tummy-ache. ”
“The foods in the five food groups down here not only taste delicious but weneed them to grow and stay healthy. We don’t need these foods up here to grow, dowe?” -
“These foods are okay to eat sometimes, but if we eat too much of them ourtummies won’t have room for all of the wonderful kinds of food we need to eateveryday to grow well and stay healthy. Have you ever eaten too many snacks orsweets before lunch or supper and not felt like eating?”
“This little tiny section helps us remember that when we eat these foods weshould eat just a little bit, or only eat them sometimes.”
“The size of every food group on the Food Pyramid helps us remember howmuch to eat... ”
“So… which should we eat more of -- milk…. or…breads? ” (Which is thebigger piece?)” (point to sections) “We need to eat more food from the bottom of theFood Pyramid.”
“Which should we eat more of -- sweets... or fruit? ” (Which is the biggerpiece?)” (point to sections) “We need to eat less food from the top of the FoodPyramid.”
“Which should we eat more of -- meat… or vegetables? ” (Which is the biggerpiece?)” (point to sections) “We need to eat more food from the bottom of the FoodPyramid.”
Objective 4: Moderation
Bring out Wicky puppet. “Sounds like you know a lot about healthy eating.Maybe you can help my friend here, Picky Piggy (wear puppet on other hand). Shelikes to eat lots of foods like this ” (point to samples of soda pop, candy, cookies, etc attop of FGP).
“Let’s help Picky learn about foods that help us grow. Let’s play a, littlegame to help Picky learn which foods help her grow well and stay healthy.”
“I’m going to put Picky here and Wicky here. (Place one puppet on each side infront of you.) I have some pairs of foods. I need you to help me show Picky which foodshelp her grow and stay healthy and can be eaten anytime. If it’s a healthy food thathelps you grow, that you can eat anytime, put it near Wicky because he really knowsabout eating healthy foods. If it’s a food that you don’t need to grow and should justbe eaten sometimes, put it next to Picky.”

(Use pairs of food pictures: candy bar and watermelon, cake and bread, cheeseand cookies, hard candy and apple, orange juice and soda pop, and cereal and doughnut.Work as a group but direct questions to individual children giving everyone a chance toparticipate in the decision-making process.)
Sample dialogue:
(When holding up healthier “anytime food” choice in pair:)“What’s this food called? Is it a food we can eat anytime? ”
“To help Picky remember that this food helps her grow well and stayhealthy, let’s reach our hands way up high (demonstrate) to show how big she’llgrow. Try that with me. Show Picky how big she’ll grow when she eats _____________ (Hold upa healthy food) Since this is a food that helps us grow, let’s put it by Wicky.”
(When holding up less-healthy “sometimes food” choice in each- pair:)What is this? Can we eat this anytime, or should we just eat this sometimes?Why should we only eat this sometimes? (Place near Picky.)
At the end of game put on Picky puppet and have her look over the foods nearWicky saying something like:‘I’ve never eaten _____________ before. It looks ______________ (pretty, tasty. etc.). Do you think I’ll likeit?... Ok. I’ll try it. I think I’ll have a little taste. (Pretend to “feed” Picky) Mmm, Ilike that!
(Put on Wicky puppet.)
Wicky: “Thanks kids. Well. Picky, these kids have shown you some wonderfulfoods for you to eat that will really help you grow better and keep youhealthier.”
Picky: “Thanks kids. Thanks Wicky. I’ll sure try to pick healthier foods to eateveryday now that I know all about the Food Pyramid.”

CLOSURE TO CLASS:
Let’s show our mums (dads, grandmas, etc.) some of the things we’ve learnedabout the Food Pyramid! (Invite parents’ to come and sit down.) Remove flannelgraphPyramid and foods, set aside.
Have Wicky review the lesson:
A. “What shows us what to eat?”(Hold up the 3-D Food Pyramid and/or poster. Have children find FGParound the room and on one or more food packages.) Show childrenstickers of FGPs. “Would you like a sticker? I’ll put- one of these oneach of you (may place on nametag).” Have each child say “foodpyramid” as you place a sticker on them.
2. Show the children each take-home gift as it is described. “We have somespecial gifts for each of you to take home. We have pictures of theFood Pyramid for you to take home and color, and handouts for yourparents so you can teach them the song we sang. We also have a puzzleof the Food Pyramid for each you. When you get home you can put allof the pieces of the food groups in the right places.”
3. “Can you tell your moms how many food groups there are?Just 1? Just 2? Just 3? Just 4? Five’? (hold up fingers)Can we eat food from just one food group, or do we need toeat foods from all 5 food groups?”(Review with plates.)
4. “Which food group has the biggest space on the Food Pyramid?Where is the smallest space? Should we eat more foods from the breadgroup or from the little space at the top? (point to spaces on puzzle)
5. “Should we eat a lot of food from the top of the Pyramid? Why not?Do we need these foods to grow? They’re okay to eat sometimes,right?”
“You sure have learned a lot about good foods to eat today. Before you gohome I have a snack for you.”
Children being post-tested will leave now. Be sure to tell them they will get theirsnack and gifts when they return.

Snack:
Select snack which allows children a small amount of food preparation experienceand includes foods from several food groups. Provide small cups of water with snack.
Craft:
If children are finished eating before their turn to be post-tested, provide crayons andfood pyramid handouts to color.
Pass out Message to Parents and other take-home gifts as they leave. Thank themfor their participation.
TEACHING MATERIALS:Shape name tags made from colored construction paper, equal number of squares,circles and triangles.Wicky Waccoon, Kid’s Club Cubs, and Picky Piggy puppetsPyramid apron for teacher to wear.
Available for $16.00 from the Columbus Dietetic Association. -
Write: Paula Ruzika, 128 Orchard Dr. Worthington, OH 43085Wicky’s Wonder BoxTriangle cut out of white poster board.Three-dimensional Food Guide Pyramids:
Blank one copied from back of Pyramid storybook. page 35, folded blankside out, may be cut down smaller.Printed one ordered from Dairy Council of Wisconsin, 999 Oakmont PlazaDr., Suite 510, Westmont, IL 60559 (1-800-325-9121), (called the “SwingingPyramid” available with milk or breakfast illustrations on other sides, cost$5.50 each)
Posters of the Food Guide Pyramid to hang around room--Use a variety from National Dairy Council, etc.For laminated poster and “puzzle pieces” order from:National Livestock and Meat Board
Box FGP-FN, 444 N. Michigan Ave., Chicago, IL 60611 ($1.50)Paper grocery sack with empty food packages with food pyramid graphic
depicted on them. May fill with styrofoam peanuts to maintain shape.

Flannelgraph FGP (mount on foam core) from Little Folk VisualsCan be purchased at school supply stores, or order fromTeacher’s Delight 1-800-726-9516
Toy foods for “variety” plates and for “sweets” samples:Bread, small cereal box, waffle, top of hamburger bun, crackers. Cantaloupe, orange,apple, red grapes, peach slice.Milk, 2 chicken legs, corn, apple, banana, and slice of bread. Cupcake, cookie, hardcandy, donut, small pop can.Purchase at toy store such as ‘Toys-R-Us” to include a variety. Suggested sets include:“Fisher Price Picnic Basket Super Set,’ “Mini Supermarket” Play Foods Set fromSky Kids, Inc. filling in with play sandwich sets and/or NASCO food models forcracker, etc. (NASCO 1-800-558-9595), a real package of cereal (such as a single-serve size of Cheerios), and a small can of soda pop (such as served to hospitalpatients).
Small basket (comes in Fisher Price picnic set)Food Picture cards from “Delicious Decisions” set (order from Wisconsin Dairy Council, kit
costs $14.95, see phone number above) Be sure to include milk, yogurt, cheese, fish,chicken, egg, pasta, bread, cereal, tomato, corn, lettuce, bananas, apple, and orange inpictures used in picnic game. See pairs for moderation section
Full-size paper plates (attach pretend foods)Food Guide Pyramid Stickers (100 cost $3.00)
Washington State Dairy Council4201 198th Street S.W., Suite 102, Lynwood, WA 98036Phone 206-744-1616, Toll free fax 1-800-470-1222
Pyramid puzzles (from NASCO)Ingredients for snack of choice and serving dishes as neededColoring sheets for children (photocopy page 37 in Pyramid storybook), crayonsMessage to Parents

THE FOOD PYRAMID SHOWS US WHAT TO EAT!!
The Food Pyramid helps us make healthy food choices. When you’re in thegrocery store with your child look for it on food packages. When you’re cooking or eatingwith your child talk about where different foods fit on the Pyramid. Teach your child thatthe foods they need to eat for health and growth belong in one of these five groups: breads,vegetables, fruits, milk, and meat. Compare the sizes of the different sections on thePyramid. Remind your child they are to eat more foods found in the big spaces with thebread, vegetable and fruit groups.
Teach your child that foods like soda pop and candy do not belong in the five foodgroups, and are not an essential part of a balanced diet (“we don’t need them to grow and behealthy”). They are found in the smallest space at the top of the Pyramid. Remind yourchild that this means they can eat these foods sometimes. Foods in the rest of the Pyramidcan be eaten anytime. Enjoy eating healthier food choices with your child.
Talk about how important it is to eat foods from all five food groups to have abalanced diet. A recent survey of American eating habits revealed that most Americans(older children and adults) eat fewer than the recommended number of servings in everyfood group except the meat group, and eat too many fats and sweets (MRCA InformationServices 1994). Preschool children generally eat too few servings in all groups except milkand eat too many sweets (JADA: Oct 1995).
Put your family ahead of the rest of the country by planning to have foods from allfive food groups at lunch and supper, and foods from at least three food groups at breakfast,every day. Fix a snack with your child using foods from all five healthy food groups. See ifyour child can show you on the Pyramid what food group each part of the snack is in.
Here’s an easy song to sing with your child at home to help them remember howmany healthy food groups are in the Food Pyramid:
FIVE HEALTHY FOOD GROUPS (Tune ‘Ten Little Indians”)
One healthy… two healthy… three healthy food groups...Four healthy... five healthy... all healthy food groups...Eat healthy foods from the Food Pyramid -- YES!!Eat healthy foods today!!
Song Lyrics: Copyright 1993, B.J. Mayfield, M.S., RD.Used with permission.

Appendix C
Test of Nutrition KnowledgeEducational Intervention for Children
WIC Nutrition Education Demonstration Study

PLACE
STICKER
HERE
Test for WIC Children
Final Version
CIRCLE ONE Pretest Post-test
CIRCLE ONE Male Female
YEARS MONTHS DAYS
Test date ________ ________ ________
Date of birth ________ ________ ________
Chronological age ________ ________ ________
START TIME ___________:___________

WIC Nutrition Education Demonstration Study
Child Test 1
BEFORE BEGINNING THE CHILD TEST, EXPLAIN TO PARENT THAT IT IS VERYIMPORTANT NOT TO TALK TO CHILD DURING THE TEST. PLEASE USE THEFOLLOWING SCRIPT.
Thank you for agreeing to let NAME OF CHILD answer ourquestions about food and nutrition. I am glad you will be withus because I think NAME OF CHILD will be more relaxed if youjoin us. Please don't help him/her to answer any of thequestions. It is very important that we find out what NAME OF
CHILD thinks about the questions all on his/her own. I amsure he/she knows a whole lot about food already, and he/shecan help us with our study.
SUGGEST THE PARENT/CARETAKER MAY WISH TO BRING READING MATERIALSTO THE TESTING SESSION.
IMPORTANT IF A CHILD OFFERS NO RESPONSE TO ANY QUESTION, THAT IS, DOES NOTANSWER AT ALL, BE SURE TO CIRCLE NO RESPONSE, OFTEN ABBREVIATEDAS NR.

WIC Nutrition Education Demonstration Study
Child Test 2
TASK 1A SHOW THE CHILD THE FOOD PYRAMID POSTER. SAY:
1A. What is this POINT TO POSTER called?
SCORE FOR TASK 1A CIRCLE RESPONSE
Food Pyramid
Pyramid
Food Triangle
Food
Triangle
Other SPECIFY _______________________________
No response
TASK 1B SHOW THE CHILD THE PICTURES OF THE FOOD PYRAMID, 4 FOOD GROUPS,AND FOOD BOWL. SAY:
1B. Which one of these is the Food Pyramid?
SCORE FOR TASK 1B CIRCLE RESPONSE
Food Pyramid
4 Food Groups
Food Bowl
No response

WIC Nutrition Education Demonstration Study
Child Test 3
TASK 2 LEAVE FOOD PYRAMID POSTER IN FRONT OF THE CHILD, BUT DO NOT DRAWATTENTION TO IT.
2. How many food groups are there? DO NOT POINT TO
POSTER.
SCORE FOR TASK 2 STATED NUMBER OF FOOD GROUPS ______________
No response
TASK 3 TURN FOOD PYRAMID POSTER AROUND SO THE CHILD CANNOT SEE THE POSTER.
SHOW THE CHILD THREE (3) PLATES OF FOOD: ONE WITH FIVE FOODS FROM
THE FRUIT GROUP, ONE WITH FIVE FOODS FROM THE BREAD GROUP, AND
ONE WITH ONE FOOD FROM EACH OF THE FIVE FOOD GROUPS. SAY:
3. I have three plates of food here. Which one of theseplates has different foods from all of the food groups?
SCORE FOR TASK 3 CIRCLE PLATE SELECTED.
Variety Plate
Fruit Plate
Bread Plate
No response

WIC Nutrition Education Demonstration Study
Child Test 4
TASK 4 LAY OUT FIFTEEN (15) FELT FOOD PICTURES, THREE (3) FROM EACH GROUP.FOR EACH TASK, CIRCLE THE CHILD'S RESPONSE.
PICK UP THE TOMATO AND SAY:
4A. What is the name of this food? This food is from thevegetable group. Can you find another food that goesin the vegetable group? Good!
SCORE FOR TASK 4A NAMED Y N NR SELECTED A VEGETABLE Y N NR
PICK UP THE PASTA AND SAY:
4B. What is the name of this food? This food is from thebread group. Can you find another food that goes inthe bread group? Good!
SCORE FOR TASK 4B NAMED Y N NR SELECTED A FOOD FROM BREAD GROUP Y N NR
PICK UP THE BANANA AND SAY:
4C. What is the name of this food? This food is from thefruit group. Can you find another food that goes in thefruit group? Good!
SCORE FOR TASK 4C NAMED Y N NR SELECTED A FRUIT Y N NR
PICK UP THE YOGURT AND SAY:
4D. What is the name of this food? This food is from themilk group. Can you find another food that goes in themilk group? Good!
SCORE FOR TASK 4D NAMED Y N NR SELECTED A FOOD FROM MILK GROUP Y N NR
PICK UP THE FISH AND SAY:
4E. What is the name of this food? This food is from themeat group. Can you find another food that goes in themeat group? Good!
SCORE FOR TASK 4E NAMED Y N NR SELECTED A FOOD FROM MEAT GROUP Y N NR

WIC Nutrition Education Demonstration Study
Child Test 5
TASK 5 LAY THE FELT PYRAMID FLAT ON THE DESK. SAY:
I'd like to play another game with you. On this big cloth, eachsection is different.
POINT TO THE FIFTEEN (15) FELT PICTURES OF FOOD. SAY:
These pictures fit onto the big cloth. I'll show you.
CORRECTLY PLACE THE FOLLOWING ITEMS FROM EACH OF THE FIVE FOODGROUPS ONTO THE PYRAMID:
ITEM
Yogurt (Milk Group)
Pasta (Bread Group)
Tomato (Vegetable Group)
Fish (Meat Group)
Bananas (Fruit Group)
PICK UP THE MILK FROM THE MILK GROUP. DO NOT NAME FOOD GROUP ORFOOD ITEM. SAY:
5. Put this food where you think it belongs on this FoodPyramid.
SCORE FOR TASK 5 REPEAT FOR THE REMAINING FOOD PICTURES IN THE ORDER LISTED BELOW.PLACE A CHECK BELOW FOR EACH CORRECTLY PLACED PICTURE. CIRCLE NRIF CHILD DOES NOT ANSWER AT ALL.
PLACEMENT
A. Milk ________ NR
B. Bread ________ NR
C. Corn ________ NR
D. Chicken ________ NR
E. Apple ________ NR
Great job! Let's play another game!
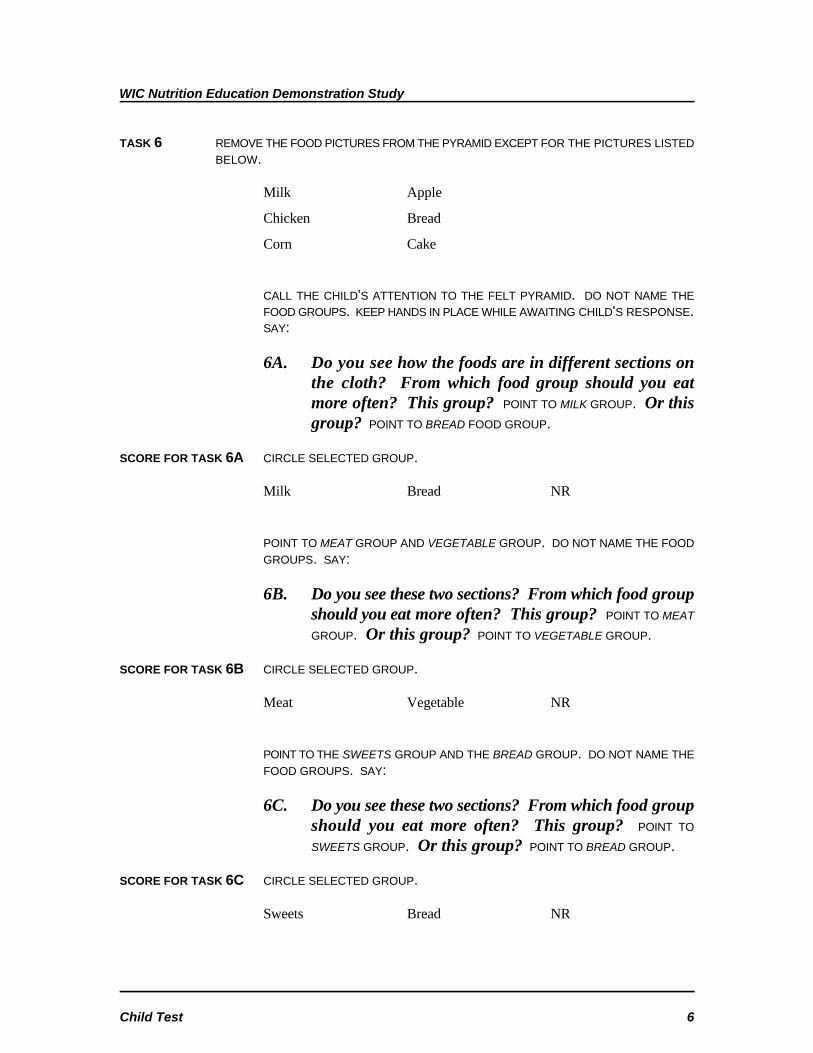
WIC Nutrition Education Demonstration Study
Child Test 6
TASK 6 REMOVE THE FOOD PICTURES FROM THE PYRAMID EXCEPT FOR THE PICTURES LISTEDBELOW.
Milk Apple
Chicken Bread
Corn Cake
CALL THE CHILD'S ATTENTION TO THE FELT PYRAMID. DO NOT NAME THEFOOD GROUPS. KEEP HANDS IN PLACE WHILE AWAITING CHILD'S RESPONSE.SAY:
6A. Do you see how the foods are in different sections onthe cloth? From which food group should you eatmore often? This group? POINT TO MILK GROUP. Or thisgroup? POINT TO BREAD FOOD GROUP.
SCORE FOR TASK 6A CIRCLE SELECTED GROUP.
Milk Bread NR
POINT TO MEAT GROUP AND VEGETABLE GROUP. DO NOT NAME THE FOODGROUPS. SAY:
6B. Do you see these two sections? From which food groupshould you eat more often? This group? POINT TO MEAT
GROUP. Or this group? POINT TO VEGETABLE GROUP.
SCORE FOR TASK 6B CIRCLE SELECTED GROUP.
Meat Vegetable NR
POINT TO THE SWEETS GROUP AND THE BREAD GROUP. DO NOT NAME THEFOOD GROUPS. SAY:
6C. Do you see these two sections? From which food groupshould you eat more often? This group? POINT TO
SWEETS GROUP. Or this group? POINT TO BREAD GROUP.
SCORE FOR TASK 6C CIRCLE SELECTED GROUP.
Sweets Bread NR
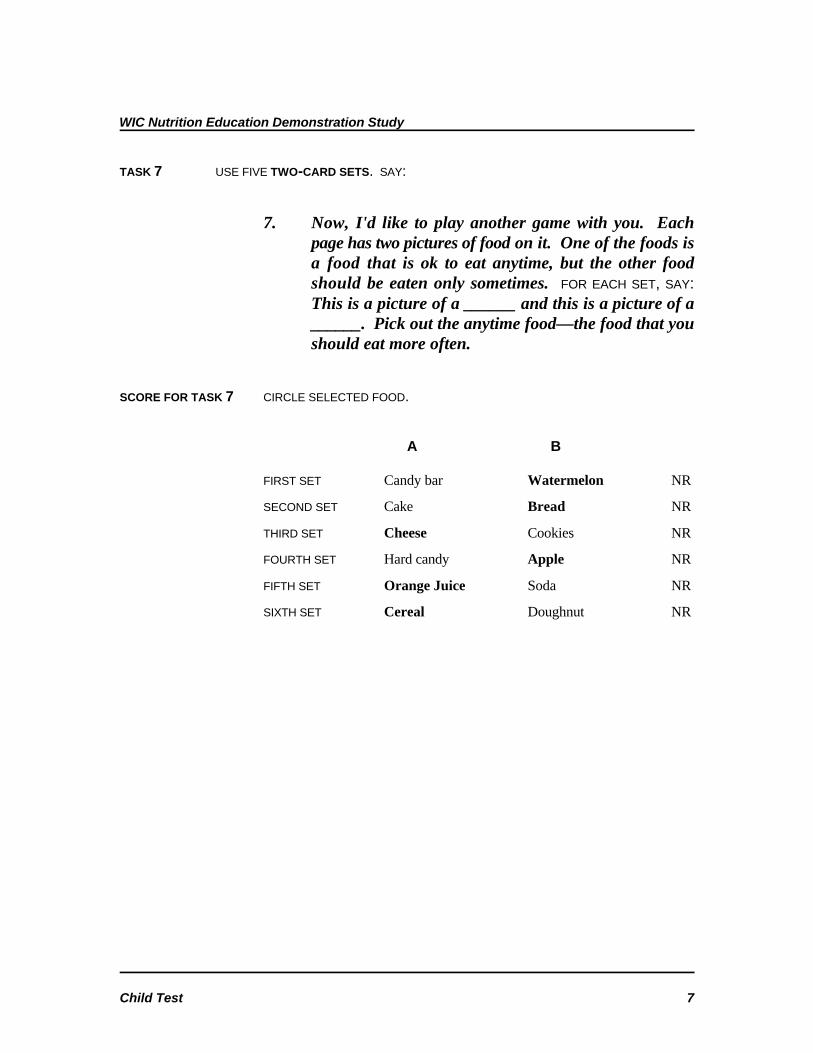
WIC Nutrition Education Demonstration Study
Child Test 7
TASK 7 USE FIVE TWO-CARD SETS. SAY:
7. Now, I'd like to play another game with you. Eachpage has two pictures of food on it. One of the foods isa food that is ok to eat anytime, but the other foodshould be eaten only sometimes. FOR EACH SET, SAY:This is a picture of a ______ and this is a picture of a______. Pick out the anytime food—the food that youshould eat more often.
SCORE FOR TASK 7 CIRCLE SELECTED FOOD.
A B
FIRST SET Candy bar Watermelon NR
SECOND SET Cake Bread NR
THIRD SET Cheese Cookies NR
FOURTH SET Hard candy Apple NR
FIFTH SET Orange Juice Soda NR
SIXTH SET Cereal Doughnut NR

WIC Nutrition Education Demonstration Study
Child Test 8
TASK 8 PLACE THE FOLLOWING TWO GROUPS OF FOOD PICTURES IN FRONT OF THE CHILD.POINT TO EACH FOOD PICTURE, NAMING EACH ONE. SAY:
This picture is juice, this picture is an apple... AND SO ON.
ANYTIME FOODS SOMETIMES FOODS
Juice Candy Bar
Apple Piece of Cake
Crackers Soda
POINT TO ANYTIME FOODS. SAY:
8. These foods you can eat anytime.
POINT TO SOMETIMES FOODS. SAY:
These foods you eat sometimes. Why should you eat thesefoods POINT TO ANYTIME FOODS more often than these foodsPOINT TO SOMETIMES FOODS?
SCORE FOR TASK 8 RECORD VERBATIM _________________________________________
______________________________________________________
______________________________________________________
______________________________________________________
No response

WIC Nutrition Education Demonstration Study
Child Test 9
TASK 9 SHOW THE CHILD THE FOOD PYRAMID PUZZLE AND THEN REMOVE THE PIECES. SAY:
Now, I have this puzzle for you to do. See, these pieces havepictures of different foods. This one has foods from the milkgroup, this one the meat group, this one the vegetable group,this one the fruit group, and this one has the bread group.
POINT TO EACH PIECE AS GROUPS ARE IDENTIFIED. SAY:
9. These pieces fit into this puzzle board, and I'd like youto put the puzzle together for me. OK? You can startnow.
BEGIN TIMING. ENCOURAGE IF NECESSARY. STOP TIMING WHEN PUZZLE ISCOMPLETE. CIRCLE THE NUMBER OF CORRECTLY PLACED PIECES AND
RECORD THE TIME TAKEN TO COMPLETE THE PUZZLE. IF CHILD DOES NOT
COMPLETE THE PUZZLE IN TWO AND ONE-HALF MINUTES, CIRCLE THENUMBER OF CORRECTLY PLACED PIECES AND RECORD 2.5 MINUTES FOR THETOTAL TIME.
SCORE FOR TASK 9 CIRCLE THE NUMBER OF CORRECTLY PLACED PIECES:
1 2 3 4 5 ALL NR
TOTAL TIME TO COMPLETE PUZZLE ______________
You've done a great job! Thank you for helping me.
END TIME ________:________

Appendix D
Results of Pilot Testing
WIC Nutrition Education Demonstration Study

The child tests of nutrition knowledge was pilot tested in two local WIC agencies in Massachusetts during
July and August 1995. As we describe in this appendix, because of revisions to the child test, pilot
testing on the child test continued into the early winter of 1995 at a Head Start program and in a publicly
funded child care center. Both facilities are located in Boston, Massachusetts.
At local WIC agencies, most children were recruited when they appeared for certification appointments.
Because some child-testing was combined with testing for the prenatal component of the WIC Nutrition
Education Study, when prenatal volunteers brought their children to the pilot-testing sessions, Abt staff
recruited and tested all eligible children. At the Head Start and child care programs, Abt arranged to test
children on specific days of several weeks.
Half of the children were tested without receiving any nutrition education (pretests); the other half were
tested after receiving nutrition education (post-tests). A record was kept of the ages of children who
were pretested and post-tested in an effort to distribute the pre- and post-tests evenly across children of
different ages—young threes versus old fours, for example.
Nutrition education sessions for children were conducted by four Abt staff persons with prior
professional experience in early childhood education. One of the staff persons has a background in early
childhood education, and another is a nutritionist with a background in preschool nutrition education.
The nutrition education sessions were initially conducted by teams of two people working together
because it was thought that children might be more comfortable in lessons with two adults. Working in
teams was also helpful as staff refined and revised the nutrition lesson. However, as the pilot testing
progressed, many of the sessions were taught by just one person. This approach was quite successful
and a closer reflection of the nutrition education that was offered at the demonstration sites.
The nutrition education sessions were designed to teach the three objectives for children described in this
report: identifying a variety of foods; food groups/the Food Pyramid; and food choices—anytime versus
sometimes foods. We began pilot testing using the terms everyday and sometimes. Children seemed
to be confused by the term everyday—often applying the term to foods they wished to eat every day.
Using anytime and sometimes seemed to alleviate this problem. As described in Chapter Two of this
report, the Kid’s Club curriculum, developed by Barbara Mayfield, was used as a basis for the nutrition
education session with ideas coming primarily from the lessons on variety, the Food Pyramid, and
healthy versus junk foods. The Kid’s Club story, Treasures of the Pyramid, was shortened to meet a
time limit of about thirty (30) minutes for the session. Two of the Kid’s Club puppets, WICCY
Waccoon and Picky Piggy, were used. Children seemed to enjoy the nutrition education sessions very
much and often wanted to continue to play with the materials after the sessions were completed.
The tests for children were conducted by five Abt staff: the four individuals who taught the nutrition
education sessions to children and a college student majoring in education. Testing occurred in one-to-
one settings. The child test requires about fifteen (15) minutes to complete. Children were usually
engaged by the testing activities and seemed to enjoy them. There were a few young three-year-olds who
seemed to have difficulty focusing on the testing.
After each child's test was conducted, the child's parent signed a receipt and was given $10.00 for
participating in the study. All children were given a snack of animal crackers and juice and a coloring
sheet of fruit pictures to take home.
Pilot-Testing Procedures
For all pilot testing, children were randomly assigned to either pretest or post-test. No child received a
pretest and a post-test. In all, a total of 100 children were tested in two stages—item development stage
and final pilot test stage. Eight test forms were developed. Several tasks (items) were common to all
forms, but others were eliminated when they were found to be flawed. The analysis below includes data
for all children who were exposed to individual items; discarded items are briefly described and the
rationale for their rejection is discussed.
The item development stage involved forty-seven children—(twenty-one pretests and twenty-six post-
tests). The purpose of this stage of test preparation is establishing that children in the target age groups
could respond appropriately to test items, and ascertaining, at a preliminary level, that their ability to
respond would be enhanced following a brief educational intervention. The intervention itself was
substantially modified during this period. Test items were altered, discarded, and added as judged
necessary by the test development team. At the conclusion of this iterative process, a set of items were
aggregated into a final pilot test. The final pilot-testing phase involved fifty-three children—thirty
pretests and twenty-three post-tests. Across all children tested, in both stages, the average ages were
47.1 months for pretested children and 47.8 months for post-tested children (t=0.54, not significant).

In the discussion which follows, each item (or task) in the child assessment battery is separately
considered. Performance differences between children who were tested prior to instruction and those
individuals tested following instruction are described both in terms of statistical significance and in terms
of the proportion of the pooled standard deviation. Typically, if an observed performance difference is
smaller than 20 percent of the standard deviation, it is considered too small to be educationally
meaningful. Differences between 40 and 60 percent of the standard deviation are considered "medium,"
and those differences greater than 75 percent of the standard deviation are considered "large."
Child Pilot Test Results
A copy of the pilot-tested version of the child nutrition test appears in Appendix C. Shortened versions
of test items appear in the discussion below.
Task 1 The tester shows the child the Food Pyramid Poster and asks: "What is this called?"
The opening segment of the child nutrition education intervention is an introduction to the Food Pyramid
which identifies the shape and discusses graphic representations of the pyramid. The term "Food
Pyramid" recurs frequently throughout the education period. We found, both during the intervention and
testing, that children in the target age range have difficulty enunciating the word "pyramid." For this
item, responses were scored three points for "Food Pyramid"; two points for "pyramid"; one point for
"food" or "food triangle." Across all children tested, only one (post-tested) child received a score of two
points, and no children received three points for this item.
As shown in Exhibit D.1, a difference of 0.13 (approximately 0.25 of the pooled standard deviation)
points was observed between pre- and post-test groups. The most frequent scoring response produced
by both pretest and post-test groups for this questions was "food." The results for this question suggest
that we can expect a small increase (one-tailed t=1.28, p=.10) in identification of the Food Pyramid,
despite the likelihood that very few children can accurately state that the graphic is the "Food Pyramid."
The significance test for this item indicated marginal success in item development. The testers believe,
however, that an alternate item might clarify whether or not children in this age group could successfully
identify the Food Pyramid following an educational intervention. They suggest a task involving
presentation of three pictures (the Food Pyramid, four food groups, and a food bowl) and asking:
"Which of these is the Food Pyramid?" It is thought this approach will produce a response based on
recognition rather than verbal production. We have developed that task (numbered 1B) for use in the
evaluation.

Exhibit D.1
Identifying the Food Pyramid
Number Mean Score DeviationStandard
Pretest 51 0.22 points 0.46
Post-test 49 0.35 points 0.56
Task 2 The tester asks the child: "How many food groups are there?"
This item was introduced in the final stage of pilot testing. The number of food groups is a recurring
theme in the educational session. Five is the only correct response.
A difference of over 55 percent in correct responses was observed favoring post-tested children (one-
tailed t=3.21, p=.001). (See Exhibit D.2.) This result demonstrates that exposure to the intervention
can reliably increase the proportion of children, in the target age range, who state the correct response.
Exhibit D.2
Identifying the Number of Food Groups
Number Percent Correct DeviationStandard
Pretest 29 13.8 35.1
Post-test 23 69.6 51.1
Task 3 The tester shows the child three plates of food (one containing five fruits, one with fiveexamples from the bread group, and one with representatives of each of the five foodgroups) and says: "I have three plates of food here. Which one of these plates hasdifferent foods from all of the food groups?"
A correct response is selection of the variety plate. A segment of the intervention deals directly with the
concept of variety and nearly duplicates this test item. During the item development stage, each child
was presented with a display of food pictures and asked to give the examiner pictures "that you need to
eat to grow and stay healthy." That task was rejected because the majority of both pre- and post-test

children simply gave examiners all the pictures that were presented.
A difference of over 20 percent (approximately 44 percent of the pooled standard
deviation) in correct responses was observed favoring post-tested children (one-tailed
t=1.56, p=.06). (See Exhibit D.3.) This result suggests that the correct response can be
marginally increased for children in the target age range.
Exhibit D.3
Selecting a Plate of Foods Representing "Variety"
Number Percent CorrectStandardDeviation
Pretest 30 23.3 43.0Post-test 23 43.5 50.7
Task 4 The tester shows the child a felt food picture and asks: "What is the name ofthis food? This food is from the NAME OF GROUP. Can you find anotherfood that goes in the NAMED GROUP?" (Repeat for a total of five foods,one from each food group.)
The two item components, naming foods and selecting foods from appropriate groups,
are separately scored. Although naming foods is a part of the educational intervention,
identifying other foods in the food groups is not. A different version of the "selection"
task was included in the item development phase of the pilot test. Modifications represent
efforts to clarify the item itself and to enhance scoring procedures.
Children in the post-test group named foods correctly 20 percent more frequently than
pretest children (one-tailed t=3.02, p=.002). However, no pre-post-test differences were
observed in selecting foods from the correct food groups (one-tailed t=-0.41, p=.34).
Results for this task are summarized in Exhibit D.4.

Exhibit D.4
Naming Foods and Selecting Companion Food fromthe Same Food Group
Number Percent CorrectStandardDeviation
Naming foodsPretest 29 55. 9 22.3Post-test 23 75.7 24.8
Selecting foodsPretest 29 35.9 21.6Post-test 23 33.0 28.0
Task 5 The tester, using a felt Food Pyramid, gives the child a felt food picture andsays: "Put this food where you think it belongs on this Food Pyramid."(Repeat for a total of five foods, one from each food group.)
A response is scored correct when the child places the selected food in the appropriate
location on the pyramid. As with Task 4, a different version of this task was included in
the item development phase of the pilot test. The present task evolved from efforts to
streamline testing procedures and to increase the clarity of the question and the scoring of
the task.

Children in the post-test group placed foods in the correct group approximately 9 percent more
frequently than pretest children (t=1.39, p=.08). Although the statistical significance level for this test
suggests only marginally superior performance for the post-tested children, the observed difference is
approximately 40 percent of the pooled standard deviation, demonstrating a small increase in children's
understanding of the types of foods contained in the various food groups. Percentages of correct
responses for this task are shown in Exhibit D.5.
Exhibit D.5
Placing Foods in Correct Food Groups
Number Percent Correct DeviationStandard
Pretest 29 24.8 17.4
Post-test 23 33.9 29.2
Task 6 The tester, using the felt Food Pyramid, points to the bread group and the milk group andasks: "Do you see how the foods are in different sections on the cloth? From which foodgroup should you eat more often? This group? Or this group?" (Repeat formeat/vegetable and sweets/fruit group comparisons.)
This item was included in test forms for both stages of the pilot test. Identification of the larger Food
Pyramid sections as the "foods we should eat more often" is practiced during the intervention. A correct
response is naming or pointing to the food group from which more daily servings should be eaten.
As shown in Exhibit D.6, a difference of over 15 percent in correct responses was observed favoring
post-tested children (one-tailed t=1.97, p=.03).
After the pilot test was completed, the sweets/fruit group comparisons was changed to a sweets/bread
group question. The testing staff believe that this question is a better test of proportionality and provides
the child with a clearer choice.
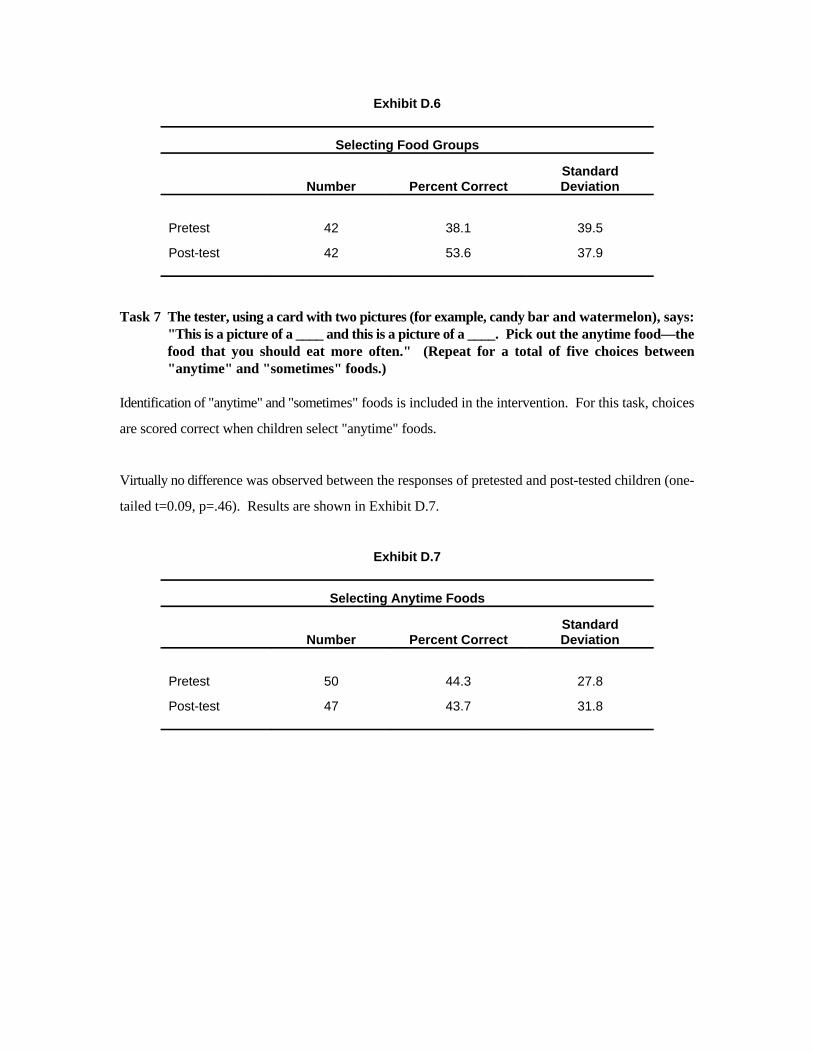
Exhibit D.6
Selecting Food Groups
Number Percent Correct DeviationStandard
Pretest 42 38.1 39.5
Post-test 42 53.6 37.9
Task 7 The tester, using a card with two pictures (for example, candy bar and watermelon), says:"This is a picture of a ____ and this is a picture of a ____. Pick out the anytime food—thefood that you should eat more often." (Repeat for a total of five choices between"anytime" and "sometimes" foods.)
Identification of "anytime" and "sometimes" foods is included in the intervention. For this task, choices
are scored correct when children select "anytime" foods.
Virtually no difference was observed between the responses of pretested and post-tested children (one-
tailed t=0.09, p=.46). Results are shown in Exhibit D.7.
Exhibit D.7
Selecting Anytime Foods
Number Percent Correct DeviationStandard
Pretest 50 44.3 27.8
Post-test 47 43.7 31.8
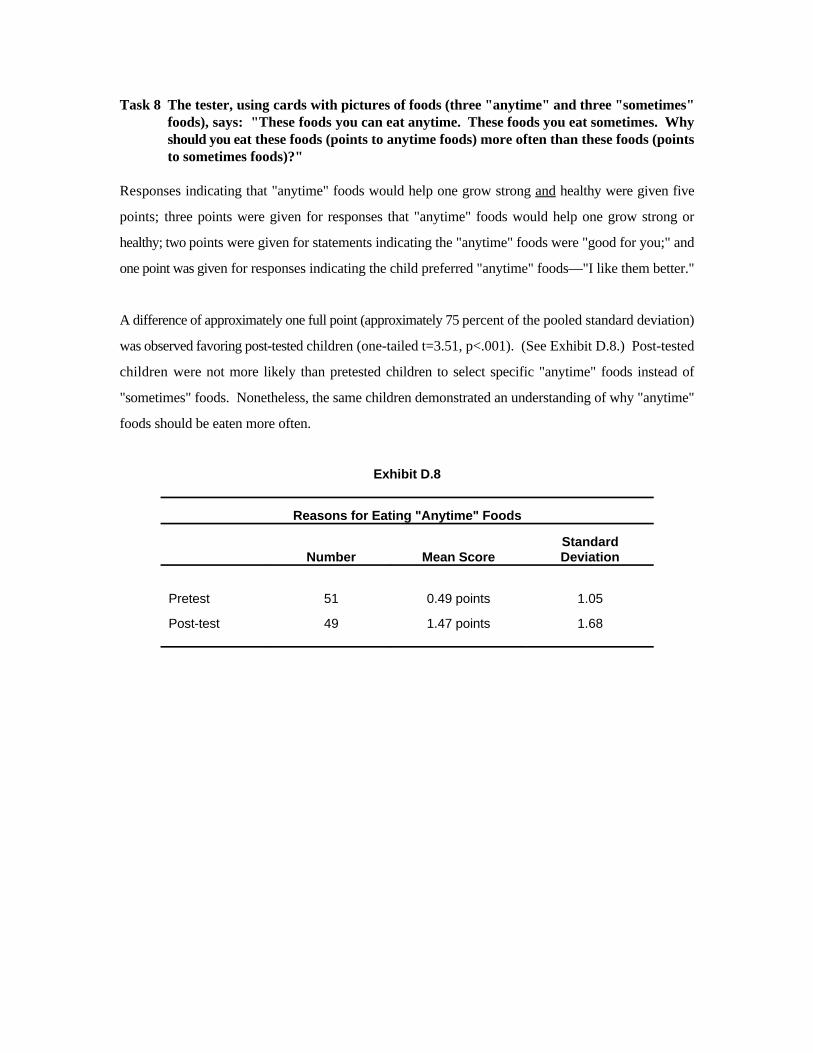
Task 8 The tester, using cards with pictures of foods (three "anytime" and three "sometimes"foods), says: "These foods you can eat anytime. These foods you eat sometimes. Whyshould you eat these foods (points to anytime foods) more often than these foods (pointsto sometimes foods)?"
Responses indicating that "anytime" foods would help one grow strong and healthy were given five
points; three points were given for responses that "anytime" foods would help one grow strong or
healthy; two points were given for statements indicating the "anytime" foods were "good for you;" and
one point was given for responses indicating the child preferred "anytime" foods—"I like them better."
A difference of approximately one full point (approximately 75 percent of the pooled standard deviation)
was observed favoring post-tested children (one-tailed t=3.51, p<.001). (See Exhibit D.8.) Post-tested
children were not more likely than pretested children to select specific "anytime" foods instead of
"sometimes" foods. Nonetheless, the same children demonstrated an understanding of why "anytime"
foods should be eaten more often.
Exhibit D.8
Reasons for Eating "Anytime" Foods
Number Mean Score DeviationStandard
Pretest 51 0.49 points 1.05
Post-test 49 1.47 points 1.68

Task 9: The tester, using a wooden puzzle of the Food Pyramid, says: “Now, I have this puzzle foryou to do. See, these pieces have pictures of different foods. This one has foods from themilk group, this one from the meat group, this one from the vegetable group, this one thefruit group, and this one has the bread group. These pieces fit into the puzzle board, and I’dlike you to put the puzzle together for me. OK? You can start now.” (Time to completepuzzle. After 2.5 minutes, discontinue and count correctly placed pieces.)
Four performance indices were scored, and differences between pretest and post-test
groups were examined. First, the total “time on task” for all children was computed,
using 150 seconds for those children who did not complete the puzzle. Second, the
number of correctly placed pieces, for each child, was counted. Third, we calculated the
proportion of each group who completed the puzzle. Finally, we examined time-to-
complete for only those children who successfully placed all puzzle pieces.
Post-tested children performed more efficiently on all indicators for this task, including
the proportion of children who completed the puzzle within 2.5 minutes—42.9 percent
for pre-tested children versus 65.2 percent for post-tested children (X2 =2.53, p=.06).
Also, the difference in number of correctly placed pieces was statistically significant
(one-tailed t=1.82, p=.04). For one time-on-task, the observed difference was significant
(one-tailed t=1.83, p=.03), amounting to approximately 50 percent of the pooled standard
deviation. However, the difference in time-to-complete for those children who did
complete the puzzle was not significant (one-tailed t=0.86, p=.20). Results for Task 9 are
summarized in Exhibit D.9.
Exhibit D.9
Performance Indicators for Food Pyramid Puzzle
Number Mean ScoreStandardDeviation
Time on taskPretest 28 121.3 seconds 44.3Post-test 23 98.1 seconds 45.9
Pieces completedPretest 28 3.54 pieces 2.33Post test 23 4.65 pieces 1.97
Time to completePretest 12 83.1 seconds 45.0Post test 15 70.5 seconds 30.8

Pilot-Test Summary
The pilot test examining the effects of special nutrition education for WIC children
provided evidence that three-and-four-year-old children tested after the intervention were,
in most instances, better able to accomplish education-related tasks. Three test items fall
outside this result. These items are: Task 4B-Selecting foods from the same food group
as a sample selection; Task 7-selecting the “anytime” food from a pair of food pictures;
and Task 9C-time to complete the puzzle for those children who were able to correctly
place all pieces. Despite the lack of findings in the pilot test, these three items were
retained, with the other items, in the test for demonstration study.
Exhibit D.10t-Statistics by Individual Test Item
Test Item t-statistic p-valueTask 1Naming Food Pyramid
1.28 .10
Task 2Identifying number of food groups
3.21 .001
Task 3Selecting a plate of foods representing“variety”
1.56 .06
Task 4NNaming foods from the food groups
3.02 .002
Task 4SSelecting companion foods from the samefood group
.41 .34
Task 5Placing foods in correct food groups
1.39 .08
Task 6Selecting food groups
1.97 .03
Task 7Selecting “anytime” foods
.09 .46
Task 8Reasons for eating “anytime foods”
3.51 .001
Task 9Time on TaskPieces completedTime to complete
1.831.82 .86
.03
.04
.20

Appendix E
Observation ChecklistWIC Nutrition Education Demonstration Study
OBSERVATION CHECKLIST
Child Session
WIC Nutrition Education Demonstration Study
SESSION IDENTIFICATION
1. Agency ID #____#____# 2. Site ID #____#____# 3. Field Observer ID #____#____#____#
4. Date of Observation #____#____# #____#____# #____#____# Month Day Year
5. Start Time #____#____# : #____#____#
Attendance
6. Expected attendance #____#____# 7. Actual attendance #____#____#8. Girls #____#____# 9. Boys #____#____#
10. Other children #____#____#11. Adults #____#____#
EXCLUDING EDUCATORS, TESTERS, OBSERVERS

TOPICS COVERED
Elapsed for Involvement Type of NotTime Topic of Children* Disruption* Covered
Time
12. Welcome and Introduction (page 2)**
13. Objective 1: Food Pyramid (page 3)
14. Objective 2a: Five Food Groups (page 4)
15. Objective 2b: Food Identification (page 5)
16. Objective 2c: Food Classification (page 6)
16a. Variety Review (pages 6 and 7)
17. Objective 3: Proportionality (pages 7 and 8)
18. Objective 4: Moderation (pages 8 and 9)
19. Closing (page 10)
Page numbers refer to script for Kids' Club lesson.*Use codes listed below.
CodesInvolvement of Children Disruption Type1 No children involved or attentive 0 No disruptions2 More than one child not involved or not attentive 1 Entry of new participant(s)3 One child not involved or not attentive 2 Entry of adult(s)4 All children involved and attentive 3 Other
SPECIFY IN MARGIN
ENVIRONMENT
Yes No
20. Space is of adequate size
21. Space is private enough so that outside noise does not disrupt session
22. Temperature is comfortable—not too warm or too cold
23. Noise level in room is low enough that all children can easily hear instructor

EDUCATOR/CHILD INTERACTION
Yes No
24. Educator provides opportunities for all children to actively participate
25. Most children actively participate
26. Educator maintains an enthusiastic attitude
27. Educator is supportive of children during interactions
28. Pace of presentation is appropriate to material
29. Pace of presentation is appropriate for children in session
30. End Time #____#____# : #____#____#
COMMENTS
EXPLAIN ALL NO ANSWERS AND FURTHER DESCRIBE THE SESSION HERE.

Appendix F
Detailed Tables of Mean Scores and Tests ofStatistical Significance
WIC Nutrition Education Demonstration Study

WIC Nutrition Education Demonstration Study
F-1
Exhibit F.1
Mean Test Scores and Tests of Statistical Significance for All Test Types by Age,Site, and Gender
Pretest Post-test*
Number Mean Standard Number Mean Standard t-statistic p <Deviation Deviation
Total 278 3.74 1.32 219 5.16 1.95 9.22 .001
Three years 165 3.48 1.12 108 4.19 1.60 4.02 .001
Four years 113 4.13 1.49 111 6.11 1.80 8.95 .001
Site A 133 3.73 1.38 126 5.31 2.16 6.95 .001
Site B 145 3.75 1.26 93 4.96 1.62 6.10 .001
Male 149 3.68 1.40 120 5.05 2.03 6.27 .001
Female 129 3.81 1.21 99 5.30 1.86 6.89 .001
* Difference between pretest and post-test.** Difference between pretest and delayed post-test.
NOTES Mean is for total score.Highest possible score is 11.

WIC Nutrition Education Demonstration Study
F-2
Exhibit F.2
Mean Test Scores and Tests of Statistical Significance by Item and Gender
Pretest Post-test*
Number Mean Standard Number Mean Standard t statistic p valueDeviation Deviation
Item 1a
Male 149 .11 .20 120 .47 .42 8.59 .0001
Female 129 .10 .15 99 .47 .42 8.48 .0001
Item 4n
Male 149 .57 .23 120 .61 .24 1.30 .193
Female 129 .58 .25 99 .62 .22 1.18 .238
Item 4s
Male 149 .34 .26 120 .36 .26 0.68 .499
Female 129 .36 .28 99 .34 .26 0.57 .568
Item 5
Male 149 .27 .23 120 .36 .28 2.94 .004
Female 129 .25 .18 99 .35 .29 2.98 .003
Item 6
Male 149 .39 .30 120 .50 .31 2.95 .003
Female 129 .43 .29 99 .46 .30 0.69 .488
Item 7
Male 149 .46 .24 120 .45 .31 0.49 .623
Female 129 .48 .26 99 .51 .27 0.78 .437
Item 8
Male 149 .07 .14 120 .15 .28 2.98 .003
Female 129 .08 .16 99 .10 .22 0.86 .390
Item 9
Male 149 .35 .35 120 .55 .36 4.64 .0000
Female 129 .37 .34 99 .59 .36 4.76 .0000
* Difference between pretest and post-test.** Difference between pretest and delayed post-test.
NOTES Mean is for item score.Highest possible item score is 1.0.

WIC Nutrition Education Demonstration Study
F-3
Exhibit F.3
Percent Correct and Tests of Statistical Significance by Item and Gender
Pretest Post-test*
Number Correct Number Correct Statistic p ValuePercent Percent Chi Square
Item 1b
Male 149 59.1 120 80.8 14.67 .001
Female 129 58.9 99 75.8 7.10 .008
Item 2
Male 149 14.1 120 49.2 39.13 .001
Female 129 19.4 99 64.7 48.23 .001
Item 3
Male 149 39.6 120 30.8 2.24 .136
Female 129 37.2 99 44.4 1.22 .270
* Difference between pretest and post-test.** Difference between pretest and delayed post-test.

WIC Nutrition Education Demonstration Study
F-4
Exhibit F.4
F-Tests for Significance of Age on Test Scores
Item F Value p > F
1a Naming food pyramid (verbally) 23.65 .0001
1b Naming food pyramid (non-verbally) 1.94 .16
2 Identifying food groups 15.27 .0001
3 Selecting variety plate 0.05 .82
4n Naming foods 33.59 .0001
4s Selecting companion foods 46.72 .0001
5 Placing foods 30.24 .0001
6 Selecting food groups 1.77 .18
7 Selecting “anytime” foods 12.14 .0005
8 Reasons for eating “anytime” foods 39.85 .0001
9 Completing puzzle 84.13 .0001
Total Score 79.99 .0001
NOTES For individual items, the null hypothesis is that the coefficient on age is statistically significant.
For total score, the null hypothesis is that the coefficient on age is statistically significant controlling forgender, site, and test type.

WIC Nutrition Education Demonstration Study
SAS procedure GLM (analysis of variance for unbalanced data) was used for these analyses.1
. F-5
Exhibit F.5
F-Tests for Significance of Age by Test Point Interactions on Test Scores
Item F Value p > F
1a Naming food pyramid (verbally) 8.04 .0048
1b Naming food pyramid (non-verbally) 6.38 .0118
2 Identifying food groups 21.92 .0001
3 Selecting variety plate .74 .3885
4n Naming foods .39 .5326
4s Selecting companion foods 1.58 .2097
5 Placing foods 1.02 .3126
6 Selecting food groups 10.03 .0016
7 Selecting “anytime” foods 2.19 .1399
8 Reasons for eating “anytime” foods 1.74 .1878
9 Completing puzzle .05 .8231
Total Score 19.25 .0001
NOTES For individual items, the null hypothesis is that the coefficient on age is statistically significant.
For total score, the null hypothesis is that the coefficient on age by test type is statistically significantcontrolling for gender and site.
Analyses of variance and covariance included test point (pretest versus post-test), age, gender, and site.1
Test point (F-value = 86.74, p </=.001) and age (F-value = 79.99, p</=.001) are the important
predictor variables. When we control for test point (pretest versus post-test) and age, site (F-value =
1.06, n.s.) and gender (F-value = 2.46, n.s.) are not statistically significant. (See Exhibit F.4 in
Appendix F for the significance of each item by age.) Further analyses of age and test point indicate a
strong interaction between these two variables (F value = 19.25, p</=.001). Mean pretest scores for
three- and four-year-olds are statistically similar. However, mean post-test scores for four-year-olds are
much higher than the mean scores for three-year-olds.