wider working paper 2019/52
TRANSCRIPT

WIDER Working Paper 2019/52
Moving up the copper value chain in Southern Africa
Neva Makgetla, Saul Levin, and Sithembiso Mtanga*
July 2019

* All authors: Trade & Industrial Policy Strategies (TIPS), Pretoria, South Africa; corresponding author: Neva Makgetla,[email protected].
This study has been prepared within the UNU-WIDER project Southern Africa—Towards Inclusive Economic Development (SA-TIED).
Copyright © UNU-WIDER 2019
Information and requests: [email protected]
ISSN 1798-7237 ISBN 978-92-9256-686-9 https://doi.org/10.35188/UNU-WIDER/2019/686-9
Typescript prepared by Luke Finley.
The United Nations University World Institute for Development Economics Research provides economic analysis and policy advice with the aim of promoting sustainable and equitable development. The Institute began operations in 1985 in Helsinki, Finland, as the first research and training centre of the United Nations University. Today it is a unique blend of think tank, research institute, and UN agency—providing a range of services from policy advice to governments as well as freely available original research.
The Institute is funded through income from an endowment fund with additional contributions to its work programme from Finland, Sweden, and the United Kingdom as well as earmarked contributions for specific projects from a variety of donors.
Katajanokanlaituri 6 B, 00160 Helsinki, Finland
The views expressed in this paper are those of the author(s), and do not necessarily reflect the views of the Institute or the United Nations University, nor the programme/project donors.
Abstract: Southern African countries—mainly Zambia and the Democratic Republic of the Congo—account for around a seventh of global production of copper. In the 2010s, they imported over a third of the associated capital goods and components from South Africa. Given this strength, some observers suggest that the South African capital goods industry could do more to support copper fabrication in the region. Theoretically, investing in production of semi-manufactures (principally wire, cable, and tubing) would promote industrialization and enhance value-add. In practice, however, unit prices have only been slightly higher for semis than for refined copper, limiting scope for fabrication—especially as local manufacturers obtain copper essentially at international prices. In any case, the South African capital goods industry is centred on mining, not metalworking machinery. It can only compete with overseas suppliers if it obtains increased financial support for exports and for research and development.
Key words: capital equipment, copper, industrialization, industrial clusters, mineral beneficiation, Southern African Development Community, value chains
JEL classification: L52, L6, L7, O14
Acknowledgements: This working paper was produced by Trade & Industrial Policy Strategies (TIPS) for the programme Southern Africa – Towards Inclusive Economic Development (SA-TIED), under the work stream on Regional Growth for Southern Africa’s Prosperity. TIPS acknowledges the support of the SA-TIED programme for this working paper, with special thanks to UNU-WIDER and the South African Department of Trade and Industry.

1
1 Southern Africa in the global copper value chain
In the 2010s, Southern Africa has been a significant centre for the production and refining of copper. In 2015, it accounted for around 10 per cent of global ore and concentrates production and 6 per cent of refined copper metal. The Democratic Republic of the Congo (DRC) and Zambia contributed almost all of this production, with a small amount coming from South Africa, as shown in Figure 1.
Figure 1: Production from mines (ores and concentrates) and refined metals in Southern Africa, in thousand tonnes and as a percentage of world total
Note: * Source provides mine data for Zimbabwe, Botswana, and Zambia and refined production data for all Southern African countries only until 2015. For this reason, the percentage of world production includes only the DRC, Zambia, and South Africa.
Source: Authors’ construction based on, for 1990 to 2011, Matos et al. (2015: ‘Copper; World Mine and Refinery Production, by Country’); for 2011–15, US Geological Survey (2015: tables 20 and 21); for 2016–18, US Geological Survey (2019: 53).
In the international copper value chain, Southern African copper producers are positioned principally as basic commodity suppliers. As outlined in Figure 2, copper goes through five main production phases: mining; producing concentrates through smelting and chemical processes; refining into basic metal; processing into semi-manufactures such as wire, tubes, rolled scrap, and castings, often involving alloys; and finally, further manufacture into cable for use in construction and utilities, as well as incorporation into final products such as cars, electronics, and electrical machinery.
Historically, economies of scales for semi-manufactures and final products have been smaller than for modern copper mines. Because they do not lose much bulk in the manufacturing process, they do not benefit significantly from proximity to refineries. As a result, when copper mining, smelting, and refining largely moved to African and Latin American countries in the twentieth century, further processing did not develop near the mines. Instead, it remained near manufacturing hubs—initially in Europe and North America and, from the 1990s, increasingly in China. From colonial days, virtually all Southern African copper was exported as concentrates or more or less pure metal.

2
Figure 2: The copper value chain, with shares in end use by weight
Source: Authors’ construction based on Copper Alliance (2018).
This division of labour reduced the value-add from copper in the mining countries of the Global South. The unit price for exports provides an indicator of how processing increased the value of copper. The main differences emerged between concentrates and refined copper and between semi-manufactures and final products. Moving into semi-manufactures generated comparatively limited gains.
As Figure 3 shows, in 2017 the unit price per tonne of refined metals was between 2.5 and 4 times as high as the unit price for concentrates. The differential was likely higher in practice because exported ores and concentrates often contained by-products that were not reported on export, in a form of transfer pricing. The global unit price of semi-manufactures was, however, only around a fifth higher than that of refined metal. For Southern Africa, the differential fell to just 10 per cent, in part because of the high quality of the refined product and in part because of the limited range of semi-manufactures exported.
The value of incorporation into final products is harder to evaluate, since they use a range of other inputs as well as gaining from intangible additions such as design and branding. The complexity and diversity of these products mean that often it is not possible to calculate a unit price per tonne. That said, the reported unit price of South African car exports in 2017 was around four times the unit price of semi-manufactured copper; the unit price of valves was over three times as high; and the unit price of transformers was 2.5 times as high. In contrast, the export price of insulated cable was only marginally higher than that of bare copper wire.

3
Figure 3: 2017 unit prices for exports by type in US dollars per tonne
Note: SA = South Africa.
Source: Authors’ construction based on ITC (no date): ‘Exports of Copper Products in Tonnes and in US Dollars’.
Both Zambia and the DRC process only a small share of their total copper production into semi-manufactures. Moreover, as mining production climbed in the 2010s, the share of semi-manufactured exports fell.1 In 2017, exports of semi-manufactures—almost exclusively copper wire—constituted under 2 per cent of Zambian copper exports by value, down from a high of 8 per cent in 2005. For the DRC, they were under 0.5 per cent, down from over 4 per cent from 2003 to 2005, as shown in Figure 4. South Africa was a small copper producer in comparison with these two countries, but in value terms it exported more copper semi-manufactures.
The DRC exported a relatively high share of its output as concentrates, while Zambia exported primarily refined metal. Trade data for the 2010s indicates that the average price per tonne for the DRC’s concentrates was just over a quarter of that for refined copper. As a result, the DRC’s total copper export revenue in 2017 came to US$6 billion, compared with US$8 billion for Zambia, although the DRC produced more tonnage and had richer ores.
Taken together, Zambia and South Africa accounted for half a per cent of international semi-manufactured copper exports in 2017. Zimbabwe produced some cables but did not report any exports, and the DRC’s exports of semi-manufactures remained negligible. In contrast, the European Union contributed 40 per cent of semi-manufactured copper exports, followed by China, Taiwan, and the US at between 6 per cent and 10 per cent each. China was the largest producer of semi-manufactures, based in large part on imported copper ores and metals. It did not export most of its semi-manufactures output directly, however, but rather incorporated them in equipment and appliances sold overseas.
1 Zambian exports of plate are counted as raw metal because it appears that, before 2013, they were in fact misclassified cathodes—that is, first-stage refined copper metal (World Bank 2011: 19).

4
Figure 4: Zambian, DRC, and South African exports of copper products by type and other semi-manufactures, in billions of constant (2017) US dollars and as a percentage of total, excluding scrap
Notes: Constant US dollar value deflated with US CPI (Consumer Price Index). Data for South African exports especially of semi-manufactures before 2013 are probably understated, as they exclude exports to other Southern African Customs Union (SACU) members; from 2010, when figures are available, these countries accounted for around a seventh of South African semi-manufactures exports. Zambian exports of plate and rod (HS 7409; HS = Harmonized System) are counted as raw metal because it appears that before 2013 they were in fact misclassified cathodes (World Bank 2011: 19).
Source: Authors’ construction based on ITC (no date): ‘Exports of Copper Ores and Products at HS 4-Digit Level in US Dollars’.
In these circumstances, calls to extend processing of copper in Southern Africa to semi-manufactures to diversify exports and increase regional value-add date back to the 1970s. Increased beneficiation has featured in virtually every Zambian development plan and policy, although its prioritization has varied widely (see BOZ 2017: 8; Lombe 2018; Mining Indaba 2018: 24; ROZ 2006, 2012; World Bank 2011). The DRC has not stressed fabrication as much as Zambia has, presumably because it still does not refine all of its exports. Still, in 2017, the DRC temporarily banned exports of copper concentrates in an effort to incentivize local refining (see Mining Indaba 2018: 58).
The strategy of expanding production of copper semi-manufactures in order to increase returns raises two research questions.
First, the desirability of these efforts depends on both their likelihood of success and the opportunity costs in terms of forgone investment in other industries. The following section of this paper assesses these issues. It concludes, in line with earlier analyses (see World Bank 2011), that copper fabrication offers some opportunities, but not a central route to industrialization in the region.
Second, any extension of copper processing could foster industrial deepening by growing demand for the Southern African capital goods industry. In practice, although Zambia and the DRC have supplied some capital inputs and services to their mines, South Africa has still dominated regional production of machinery. In the 2010s, it has provided over a third of machinery imported by Zambia and the DRC, mostly for mining. Effective strategies to link investment in semi-

5
manufactures production to the South African capital goods industry would require a more coherent regional approach centred on improved financing and institutional support for exporters, as well as higher levels of funding for technological development. Achieving policy co-ordination would in turn necessitate that all of the affected countries benefit. These issues are reviewed in Section 3.
2 The potential for expanding copper fabrication
This section outlines first the demand-side constraints on copper fabrication in Southern Africa, and then challenges on the supply side.
2.1 Demand-side constraints
Two interrelated factors have dampened demand for Zambian and South African copper semi-manufactures from 2015. The fall in international commodity prices after 2011 saw a sharp drop in the price of semi-manufactures globally, including for Southern African producers. At the same time, it brought about a marked slowdown in GDP growth in Southern Africa, and in particular in construction and infrastructure investment—both of which were central users of copper inputs.
Internationally, demand for semi-manufactures derives primarily from two sources: the generation and transmission of electricity, and the production of machinery and equipment. Globally, in 2017, around half of copper ended up as cable and wire for construction, utilities, and electrical and electronic equipment. The rest mostly went into machinery, ranging from cars, air conditioners, computers, and other consumer goods to motors, industrial transformers, and other capital equipment. Around 15 per cent was used for tubes and valves, mostly for plumbing. Some 60 per cent of production came from wire mills, while most of the rest took the form of tubes, rods, and plates, around half of which were alloys (see Figure 5).
From 2011 to 2017, Zambian revenues from exports of semi-manufactured copper products fell by a third in constant US dollars. In tonnage, Zambian exports did not change—the fall resulted virtually entirely from the decline in unit prices in real terms with the end of the commodity boom in 2011 (see Figure 6). In contrast, South African exports climbed by almost 50 per cent in volume terms from 2011 to 2017, although its unit prices also dropped by a third. These trends meant that, in constant dollar terms, regional exports of semi-manufactures as a whole fell from a high of almost US$250 million in 2011 to around US$175 million in 2017.

6
Figure 5: Major uses of semi-manufactured copper products, 2017, in million tonnes and as percentage of total by weight
Source: Authors’ construction based on Copper Alliance (2018).
Figure 6: Zambian exports of wire and insulated cable, and South African exports of wire, pipes, and cable, in thousand tonnes and unit export prices in constant (2017) US dollars, 2011–17
Note: Constant US dollar value deflated with US CPI, rebased to 2017.
Source: Authors’ construction based on ITC (no date): ‘Exports of Wire, Pipes and Insulated Cable by Zambia and South Africa in Tonnes and in US Dollars’.

7
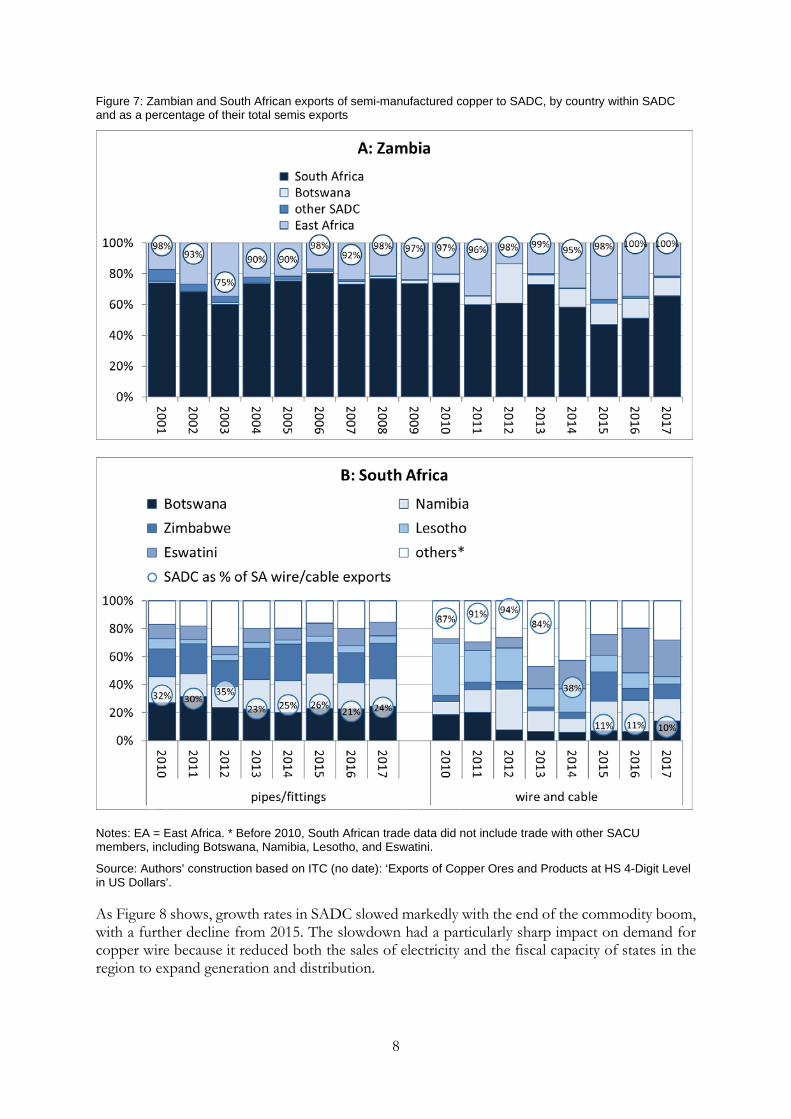
During this period virtually all Zambian exports of copper semi-manufactures went to the Southern African Development Community region (SADC), with about two thirds to South Africa alone (see Figure 7). Most of the rest was sold to East Africa. In contrast, the bulk of South African exports went overseas. In 2017, SADC bought a quarter of South African copper pipe exports and a tenth of its wire and cable exports. The bulk of South African exports of pipes and fittings went to the United Arab Emirates, which functioned as a clearing-house for other countries, while from 2015 most of its exports of bars and shapes went to Korea, China, and Japan. It is possible that some sales recorded as South African exports represented shipments from Zambia.
Both Metal Fabricators of Zambia PLC (ZAMEFA), the dominant Zambian semis manufacturer, and South African producers have complained of a slowdown in domestic and regional demand since around 2015. The trend reflects both a decline in infrastructure investment, in turn reflecting slower growth with the end of the commodity boom, and increased competition from imports, especially from China.
8
Figure 7: Zambian and South African exports of semi-manufactured copper to SADC, by country within SADC and as a percentage of their total semis exports
Notes: EA = East Africa. * Before 2010, South African trade data did not include trade with other SACU members, including Botswana, Namibia, Lesotho, and Eswatini.
Source: Authors’ construction based on ITC (no date): ‘Exports of Copper Ores and Products at HS 4-Digit Level in US Dollars’.
As Figure 8 shows, growth rates in SADC slowed markedly with the end of the commodity boom, with a further decline from 2015. The slowdown had a particularly sharp impact on demand for copper wire because it reduced both the sales of electricity and the fiscal capacity of states in the region to expand generation and distribution.

9
Figures on trade point to the difficulty Zambian semis producers have in competing with larger, more-established, and better-financed international competitors. Imports of semis and cable tracked the commodity boom and economic growth, with a surge before 2011 and then a marked fall. South Africa accounts for most imports of semis, in part for autos and capital equipment, but only 40 per cent of regional imports of cable.
South African imports comprised nine-tenths of SADC’s total foreign purchases of copper wire in 2017, which totalled US$360 million. As Figure 9 shows, Zambia’s share in South Africa’s wire imports dropped from a high of over 80 per cent in 2006 to 20 per cent in 2017.2 In contrast, its share in wire imports by SADC countries excluding South Africa came to around half between 2006 and 2015, and rose above 60 per cent over the following two years as the value of wire imports fell. In the same period, South Africa lost market share. Between 2006 and 2017, its share in wire imports by other SADC countries shrank from 15 per cent to 5 per cent.
Figure 8: Growth rates in continental SADC during and after the commodity boom
Notes: Data excludes Mauritius and the Seychelles. Figures in brackets indicate share in regional economy.
Source: Authors’ construction based on World Bank (2019): series on GDP in constant (2010) US dollars.
2 The fall in Zambia’s market share is exaggerated in the data by the aggregation of imports by SACU members, especially Namibia and Botswana, into South African imports before 2010, as shown in Figure 9. Figure 9 shows, however, that Zambian exports to SADC, including SACU after 2010, were too small to change the trend substantially.

10
Figure 9: Imports of copper wire by South Africa and other SADC countries by exporting country, 2001–17, in constant (2017) US dollars
Notes: Constant US dollar value deflated with US CPI, rebased to 2017. Before 2010, figures for South African imports include other SACU members (Botswana, Lesotho, Namibia, and Eswatini).
Source: Authors’ construction based on ITC (no date): ‘Exports of Copper Wire at HS 4-Digit Level in US Dollars’.
SADC imports of cable are larger than wire imports, and far more open to overseas companies. They came to just over US$800 million in 2017 (excluding optical fibre). That was down from over US$900 million in 2011. Imports account for around half of the South African cable market, and, apart from Zambia, SADC countries depend primarily on imported cable. From the early 2000s until 2011, imports from China grew particularly rapidly, mostly at the expense of South African producers.
SADC countries other than South Africa accounted for 60 per cent of regional cable imports from 2001 to 2017. They bought just over 25 per cent of their cable from South Africa in 2017, down from almost 50 per cent 15 years earlier. South Africa’s proportional loss in this period essentially benefited Chinese imports, which rose from virtually zero to 20 per cent of SADC cable imports. Similarly, China’s share in South African cable imports climbed from 5 per cent in 2002 to 18 per cent in 2017. In contrast, Zambia’s share in South Africa’s cable purchases dropped from a short-lived high of 14 per cent in 2005 to 2 per cent in 2017. Its sales to other SADC countries were fairly stable after 2011, however. Other overseas countries, mostly Europe and the US, provided around half of cable imports for SADC, including South Africa, throughout this period (see Figure 10).

11
Figure 10: Imports of cable by South Africa and other SADC countries by exporting country, 2001–17, in constant (2017) US dollars
Notes: Constant US dollar value deflated with US CPI. Before 2010, figures for South African imports include other SACU members (Botswana, Lesotho, Namibia, and Eswatini). The data exclude fibre-optic cable; they also exclude ignition sets for the auto industry assembled in Botswana and exported to South Africa, which are counted as cable in the data.
Source: Authors’ construction based on ITC (no date): ‘Exports of Insulated Cable at HS 6-Digit Level in US Dollars’.
SADC imports of copper pipes and fittings are much smaller than those of wire, totalling US$60 million in 2017, down around 40 per cent from 2011 in constant dollar terms. South Africa accounted for two-thirds of the total. Its share dropped from over 70 per cent in 2002 to around 50 per cent in 2017, while China’s share climbed from 5 per cent to 16 per cent. South African producers provided mostly pipes, but fittings were largely imported from overseas. In constant US dollars, South African imports of copper pipes and fittings climbed from around US$12 million in 2002 to US$71 million in 2011, then fell back to US$40 million in 2017 as demand slowed with the end of the commodity boom (see Figure 11).

12
Figure 11: Imports of copper pipes and fittings by South Africa and other SADC countries by exporting country, 2001–17, in constant (2017) US dollars
Notes: Constant US dollar value deflated with US CPI. Before 2010, figures for South African imports include other SACU members (Botswana, Lesotho, Namibia, and Eswatini).
Source: Authors’ construction based on ITC (no date): ‘Exports of Copper Tubes and Fittings at HS 4-Digit Level in US Dollars’.
While Southern Africa is the main export market for Zambian semis, and also significant for South Africa, it accounts for under 1 per cent of international cable, pipe, and fittings exports, and 2 per cent of wire exports. In theory, although domestic and regional demand are critical for establishing any new capacity, international markets could provide opportunities for greater, longer-term growth. From this standpoint, the existing export market understates potential, since copper semis are often produced and used domestically on a large scale, especially in Europe, China, and the US.
As Figure 12 shows, global exports of semis and cable saw rapid growth in the early 2000s, but flattened out after the global financial crisis in 2008/09. In constant US dollars, semis exports climbed around 20 per cent a year from 2001 to 2008, then declined at over 3 per cent annually. Cable (excluding transmission sets and fibre-optic) rose 13 per cent yearly from 2001 to 2008, then stagnated.

13
Figure 12: International exports of semis and cable in constant (2017) US dollars, 2001 to 2017
Notes: Constant US dollar value deflated with US CPI. * excludes ignition sets for the auto industry and optical fibre cable.
Source: Authors’ construction based on ITC (no date): ‘Exports of Insulated Cable, Wire, Pipes/Tubes and Fittings at HS 4-Digit Level in US Dollars’.
The decline in global exports from 2008 resulted from a combination of the decline in unit prices, as shown in Figure 12, and slow growth in the volume of sales. From 2001 to 2008, semis and cable exports in tonnes climbed between 3 per cent and 6 per cent a year, then essentially flattened out. Data for exports by quantity were incomplete, especially for cable, as reflected in Figure 13.
Figure 13: Exports of semis and selected types of cable in millions of tonnes, for years with available data between 2001 and 2017
Note: For cable, only products at the HS 8-digit level for which data on exports in tonnes are available are included—that is, winding wire and electric conductors under HS codes 854411/59/60/854441/9 in the ITC data.
Source: Authors’ construction based on ITC (no date): ‘Exports of Insulated Cable, Wire, Pipes/Tubes and Fittings at HS 4-Digit Level in Tonnes’.

14
The prospects for global demand have faced somewhat contradictory factors in the medium and long run. Slower Chinese growth in recent years has weighed on the copper value chain, reducing both the quantities demanded and prices. In the longer run, however, technological shifts, as well as expanding electrification and growth in formal housing in the Global South, will bolster demand. Cleaner energy sources and electric cars require substantially more copper inputs than earlier technologies.
In sum, slower growth since the end of the commodity boom, and especially from 2015, seemed likely to depress demand for semis and cable in Southern Africa. A similar trend has emerged globally, with lower exports from 2008 in both value and volume. In Southern Africa, the impact on regional producers was aggravated by the South African shift away from Zambia to overseas suppliers. In the longer run, electrification, the introduction of green technologies, and growth in manufacturing of machinery and equipment are expected to boost demand across Southern Africa and the Global South. The question is whether local producers can successfully compete for these markets. That in turn depends on their ability to overcome supply-side constraints.
2.2. Supply-side constraints
The argument for increased production of semis in Southern Africa, and particularly in Zambia, effectively assumes that local production of copper metal could offset other constraints on local processing. In practice, the higher cost of manufacturing and transport from Zambia appears to have more than equalized the relatively small differential in the unit price of semis compared with that of basic refined copper. Internationally, most copper semis production is located near to demand rather than the raw-materials supply (see World Bank 2011: 7ff). Still, some expansion in copper processing occurred after the end of the commodity boom, in part in response to government policies aimed at establishing Zambia as a copper fabrication hub in the region. Success would, however, require alleviation of a range of constraints, especially around regulatory frameworks, electricity, and logistics, and in the longer run a step-up in technological capacity and measures to reduce the price of copper for local fabricators.
In the 2010s, the Zambian copper fabrication industry has contributed under 1 per cent of GDP, had around 40 enterprises, employed fewer than 1,000 people, used under 20,000 tonnes of copper, and contributed about 0.1 per cent of GDP.
ZAMEFA is by far the largest semis producer in Zambia. It was established as a state-owned company in the 1960s; privatized to a US investor in the 1990s; then sold to Reunert, a South African cable producer, in 2016. In the mid-2010s, it produced mostly copper bar and wire, using around 2 per cent of Zambia’s total copper production to supply around 12,500 tonnes of wire, cable, and rod. Its 2018 sales came to US$125 million, but it has made a loss in two out of the past four years. It has just over 300 employees (ZAMEFA 2018: 14). As early as the 1980s, observers noted that ZAMEFA had neither primarily local managers nor its own research and development capacity, which meant that technological spillovers were limited and it depended largely on foreign expertise for repairs and maintenance (Mpaisha 1988: 90).
In addition to ZAMEFA, two other plants opened in the mid-2010s to produce cable, while an established producer, Kavino, closed. The cable producers, Zalco and Neelkanth, invested US$15 million each in cable production in the mid-2010s. Neelkanth started production in 2016, manufacturing 4,800 tonnes of copper rod annually, with around 180 workers. It planned to expand to over 8,000 tonnes and 400 workers. In 2017, it said it was exporting to South Africa as well as other countries in Southern and East Africa. Its owner, the Tanzanian group Motisun, produces steel and building materials in Tanzania, Uganda, and Mozambique (Zambia Daily Mail 2017a, 2017b). Zalco had been producing metal products in Zambia since 2006, but substantially
15
expanded cable production from 2014. It anticipated a move into other copper products as well, including pipes, specifically citing the national policy of increasing downstream production from copper (Zambia Daily Mail 2014).
Zambia also had a cluster of small copper and alloy foundries, largely to support the mines (World Bank 2011). They used mostly imported scrap and alloys, since supplies in Zambia were limited. The largest foundry was the Non-Ferrous Metalworks (Zambia), which was founded in the 1960s and had over 50 workers in the mid-2010s (Non-Ferrous Metalworks (Z) Ltd 2012). The foundries experienced an upsurge when the commodity boom revitalized Zambian mining, but times were harder from 2011.
In 2009, an Egyptian-owned company, Elsewedy, entered a joint venture with the electricity utility ZESCO (which held 40 per cent of the local company) to produce transformers. It used imported copper sheets, however, because Zambia did not produce them (ROZ 2012: 18). According to Elsewedy’s annual reports, from 2015 to 2017 it sold around US$5 million a year to ZESCO and a similar amount to construction companies—around 0.5 per cent of the group’s global revenues. It is not clear, however, what percentage of these sales was imported, since the company also acted as a procurement agent for ZESCO.
In 2017 a Chinese–Zambian joint venture invested US$15 million in the production of electric equipment for industry, which in practice meant ZESCO and the mines. Its technology was sourced from its Chinese partner, RongZheng Electrical Equipment. Although the factory would initially manufacture 300 switch gears annually, the ultimate aim was to supply the region with a broader range of goods, including transformers (Afrizam, no date; Zambia Daily Mail 2017c, 2018).
Downstream copper fabrication in Zambia has faced a variety of constraints.
The main justification for local copper fabrication is access to local copper inputs. In practice, however, the mining companies sell metal to local users not at a cost-plus price, but at the international price less transport costs with a regional premium (World Bank 2011: 25). In effect, as in the South African iron, coal, and chrome value chains, the mines capture most of the rents rather than local downstream producers. As a result, processing companies do not gain much from proximity to the mines. In addition, the copper used in fabrication is typically almost two-fifths recycled. Since Zambia generates only limited scrap, it is mostly imported (World Bank 2011: 12).
Infrastructure shortcomings add to the challenges of manufacturing in Zambia. Electricity is often unreliable, and a policy of moving towards cost-reflective prices has led to higher costs (see BOZ 2017: 60, 62). Extrusion processes require stable, quality electricity supply; unanticipated interruptions can damage both the equipment and the product. The commodity boom brought a rapid increase in electricity demand in central Africa; its end brought constraints to government finances and borrowing. Both of these trends have made it harder to maintain the national electricity system.
In addition, 95 per cent of Zambian transport was by road in 2018. Poor maintenance of the roads, which have been damaged by overweight freight, and long delays at borders add to the cost of exports. In theory, bulk exports like copper semis and cable would be cheaper (and more environmentally friendly) by rail, but by the mid-2010s the government aimed to increase the share of rail to 30 per cent, based in part on technical support from the South African parastatal Transnet (see Reuters 2018).

16
In 2018, copper fabrication also suffered severely from delays in tax refund schemes, especially as slowing growth squeezed government revenues. ZAMEFA argued that it made losses in 2018 almost entirely as a result of long delays in refunds on value-added tax (VAT) and a duty drawback scheme. The sums involved equalled around a sixth of its sales revenue. ZAMEFA dealt with the resulting cash-flow problems by reducing its exports, but argued that the situation threatened its long-term sustainability (ZAMEFA 2018: 5). In 2019, delays in VAT rebates led to closure of a zinc mine in Kabwe and affected the wire producer Zalco (Zambia Daily Mail 2019).
Severe delays in tax refunds largely offset various government incentives introduced in this decade. Zambia banned the export of copper scrap to reduce costs to its foundry cluster (ROZ 2012: 12). Less successfully, a Chinese mining company built a smelter with an industrial park in Chambishi in 2017 as a Special Economic Zone, with incentives especially for foreign direct investment. Copper fabrication was a priority area for the park, but it appeared as of 2019 that the project has largely stalled. There has been no consistent official reporting on the Zone, but its publicity figures suggest that employment and investment did not grow significantly after the end of the commodity boom (see Ancharaz 2013; Fessehaie and Rustomjee 2018: 409; UNDP 2015: 72; Xiaoyang 2015; Zeng 2016: 3). From 2018, the government reduced company tax for enterprises that fabricate local copper from 35 per cent to 15 per cent (ZAMEFA 2018: 7). It also introduced stricter standards for imports, but policing them has proved difficult.
Zambia’s copper fabrication industry has faced the broader challenge of being a latecomer in the context of a regional economy that is too small to sustain producers in every country. A 2012 policy for the industry argued that it would have to reach ‘critical mass’, which in turn would require out-competing neighbouring countries (ROZ 2012: 14). Foundries could be quite small, but the minimum economy of scale for wire and tube production came to 10,000 tonnes a year (World Bank 2011: 27ff.), just below ZAMEFA’s production in 2018 and substantially larger than either that of Neelkanth or Zalco.
In contrast to Zambia, South Africa has had a small but competitive copper cluster, centred primarily on pipes (but not fittings) and cable. South African production of copper products can be estimated at roughly in the order of R9 billion (US$640 million) in 2015—around four times the size of the Zambian industry.3 Imported copper metal, mostly from Zambia, contributed around a quarter of the raw material used, with the rest produced locally as a by-product from various other minerals and at a copper mine at Palaborwa. In 2019, South Africa had almost 60 medium-sized and large cable producers employing over 10,000 workers; about 50 manufacturers of pumps, valves, and related equipment, which used a variety of metals including copper and copper alloys; and over 80 foundries using 14,000 tonnes of copper (estimated from WOW, no date). Competing against these established producers has proved difficult for Zambian firms (Hampwaye et al. 2015: 19).
A regional value chain approach to copper fabrication could assist in developing a stronger industry in Zambia. Such a strategy would, however, require decisive action especially from the South African government to promote imports from Zambia rather than overseas. It would also entail difficult decisions about the division of labour in copper fabrication between South African and Zambian companies.
3 Statistics South Africa aggregates copper semis with other metal products. The value of semis production given is estimated as 10% above the value of refined metal, in line with the figures for unit export prices for the region (see Figure 3).
17
Even with this kind of support, developing a copper fabrication industry on a large scale would require more consistent and co-ordinated government support, especially to reduce the cost of copper metal inputs, improve infrastructure, invest in high-level skills, and ensure more efficient tax systems (see ROZ 2012). Militating against much greater support are the realities that the industry would generate relatively few jobs and require substantial sums for capital equipment, while the added value of semis over cathodes is relatively limited. In practice, fabrication is listed as a priority in the various government industrial policy proposals and the Seventh National Development Plan, but that approach has been contested (see BOZ 2018: 8). Proposals for industrialization have tended to emphasize diversification through the agricultural value chain instead (see BOZ 2017; ROZ 2018).
3 The South African capital goods industry and copper fabrication in Zambia
South Africa could help the Zambian copper manufacturing industry compensate for its latecomer status by supporting it in acquiring technologies and skills. The process would be mutually beneficial, since it would boost the South African capital goods industry while promoting increased value-add for Zambian copper. Achieving this end would, however, have to address some key constraints. In particular, metal-fabricating machinery has not been a particularly strong area for South African capital goods producers, which has historically focused on mining customers. In addition, financing for South African capital goods exports has remained limited, while foreign investors in Zambia have often encouraged imports from related overseas companies. The South African government also could not afford to fund research and development on the scale of competitor countries. Finally, smaller South African companies have often lacked capacity to maintain export relationships.
This section first provides an overview of the South African capital goods industry. It then reviews trends in capital goods exports to Zambia and the main challenges they have faced.
3.1 The South African capital goods industry
The South African capital goods industry developed initially primarily to support mining, which remained its core strength in the 2010s (see Kaplan 2011). In 2016, the South African Capital Equipment Export Council (SACEEC) said that 60 per cent of its members supplied the mining industry with goods or services, while 40 per cent focused exclusively on mining (East African Mining News 2017).
Capital equipment accounted for around 8 per cent of manufacturing value-added in South Africa in the 2010s, up from around 6 per cent in the preceding decade, as shown in Figure 14. Its evolution reflected the disruption of the 2008/09 global financial crisis, as well as the mining boom up until 2011. Production of capital equipment reportedly grew, in aggregate, by almost 6 per cent a year from 2000 to 2008, levelled out after the global financial crisis in 2008/09, then dropped 2.3 per cent a year from 2012 to 2016.

18
Figure 14: Value-added in capital equipment, 1994–2016, in billions of constant (2016) rand
Note: Constant rand value deflated by calculating the deflator used in the sources from figures in current and constant rand, and then rebasing to 2016.
Source: Authors’ construction based on Statistics South Africa (2018): GDP P0441, annual quarter and regional revisions, Q4 2016; series on manufacturing subsectors in current and constant rand; and Quantec (2018): series on value added in current and constant rand.
Capital goods saw a decline in return on assets from around 2007, with a sharp drop during the 2008/09 global financial crisis and a more gradual decline from the end of the commodity boom in 2011. The return on assets peaked at 14 per cent in 2007 but fell to 3 per cent in 2016 (calculated from Statistics South Africa 2018). Lower profits have resulted in declining investment in the industry. In constant rand, the value of assets in the production of capital equipment climbed just 18 per cent from 2009 to 2015, while assets in the rest of manufacturing rose 67 per cent. As a result, the share of capital equipment in total manufacturing assets fell from 10 per cent to 8 per cent over this period (calculated from Statistics South Africa 2018).
In 2018, the South African capital goods industry had around 5,000 companies with 75,000 to 80,000 employees: an average of around 15 each (calculated from SARS 2017: sheet A3.4.1; and Statistics South Africa 2018). Like the rest of South African manufacturing, the industry was quite concentrated, with a few companies employing over a thousand workers. Depending on the subsector, in capital goods production the top five companies accounted for between a third—the norm for manufacturing as a whole—and three-quarters of revenue (see Figure 15). Concentration was highest in sections of electrical equipment manufacturing.
The top manufacturers of capital equipment in South Africa are virtually all linked to foreign original equipment manufacturers (OEMs), either as subsidiaries or through licences. Usually it has not been possible to determine the import content of their sales in South Africa. Leading companies in the 2010s included Bell Equipment, Joy, Actom, and Howden.

19
Figure 15: Share of top five companies in larger subsectors of capital equipment in 2014
Source: Authors’ construction based on Statistics South Africa (2018): ‘Manufacturing Industry: Financial, 2014. Pretoria’, table 9, p. 33ff.
As in Zambia, a number of smaller companies have had a crucial role in designing and installing capital equipment for companies and utilities, in manufacturing specialized products, and in providing after-sales maintenance, service, and repair. These companies have played a central role in ensuring a responsive, flexible supply of capital equipment. Many are in a symbiotic relationship with the dominant mining, construction, infrastructure, and manufacturing companies.
The SACEEC has indicated that it has 81 members providing machinery, components, and after-market services to the copper value chain in the SADC region. They range in size from the subsidiaries of major brand names in earth-moving to small suppliers of specialized equipment.
In sum, South Africa has a small capital goods industry by international standards, with areas of excellence. It faced significant headwinds as the end of the commodity boom brought a slowdown to the regional economy, and especially to its major customers in the mining industry, utilities, and construction.
3.2. Constraints on South African exports of metalworking machinery to Southern Africa
South Africa has been a leading source of capital goods for Zambia and for the rest of SADC in the 2010s, although its share fell sharply during the period when mining expanded rapidly during the commodity boom. Exports to Zambia accounted for over a tenth of South African machinery exports, if catalytic converters (mostly going to Europe) are excluded. South African capital goods exports to the region centred on mining equipment (see Kaplan 2011). Equipment for metal fabrication was a relatively small component, constituting only a modest share of total capital goods exports to Zambia and to SADC as a whole. This situation reflects both the comparatively limited demand for downstream equipment and increased competition from overseas suppliers in the past 15 years.
The value of Zambian imports of all capital equipment (excluding computers) from South Africa came to around US$400 million in 2017, or some R6 billion. A significant share of these products were, however, only assembled in South Africa, mostly by subsidiaries of overseas brands. As Figure 16 shows, Zambian imports of South African capital goods climbed steeply until 2013, despite a downturn during the global financial crisis, but then dropped by around 40 per cent from 2011 to 2015 before levelling out by 2018. In this period, South Africa’s share in Zambian capital

20
goods imports (excluding computers) fell from over half to a third. Still, they accounted consistently for just over a tenth of South Africa’s total exports of machinery. Through the 2010s, SADC as a group has bought 60 per cent of all South African capital equipment exports excluding catalytic converters and computer equipment, worth US$2.3 billion or around R30 billion in 2018.
Figure 16: Imports of machinery by Zambia and the rest of SADC from South Africa and the rest of the world, 2001–17, in constant US dollars
Notes: Category excludes computers and office equipment. Constant dollars value deflated with average annual US CPI. * Before 2010; does not include exports to any SACU countries.
Source: Authors’ construction based on ITC (no date): data for chapter 84.
The trade data underscore the dominance of mining equipment in South Africa’s capital goods exports. The analysis relates to products under categories in the Harmonized System (HS) for pumps; grinding and crushing machines; earth-moving, digging, and material-handling equipment; and foundry and metalworking machinery. These imports provide an indication of trends in trade in mining equipment, although, with the exception of grinding and crushing machines, such equipment is also used extensively in infrastructure and construction.
As Figure 17 shows, South Africa dominated sales of capital equipment for the mining value chain in Southern Africa until 2017. Its share fell from the early 2000s, however, while the regional slowdown brought a sharp fall in the total value of these imports by other SADC countries. The bulk of South African exports of capital goods supported mining and refining, centring on pumps and grinding, earth-moving, and material-handling machinery. Southern African imports of machine tools, foundry equipment, and metalworking machinery were much smaller—an average of US$165 million a year between 2015 and 2017, compared with US$1.5 billion for other equipment used in the mining value chain. South Africa provided a third of mining-related capital goods imports by SADC, but less than a fifth of imports of machinery for metalworking and foundries.

21
Figure 17: Imports of capital equipment for the mining value chain by SADC countries excluding South Africa, by exporting country, in billions of constant (2018) US dollars and as a percentage of total for major product groups

22
Notes: Data in constant dollars are deflated using average US dollar CPI for the period, rebased to 2018. Before 2010, trade figures exclude South African exports to SACU and are therefore not comparable with later statistics. The graphs use three-year totals because the project-based nature of investment leads to significant annual variations. * Includes cranes, conveyer belts, and forklifts.
Source: Authors’ construction based on ITC (no date): ‘Exports of Insulated Cable, Wire, Pipes/Tubes and Fittings at HS 4-Digit Level in US Dollars’.
As Figure 18 shows, the pattern of capital goods imports by Zambia largely paralleled SADC trends. In 2016 to 2018, South Africa provided around 20 per cent of metalworking equipment, compared with between 25 per cent and 40 per cent of foundry, grinding, material-handling, and earth-moving machinery, and 60 per cent of pumps and fittings. In every category, however, South Africa’s share had declined while China’s had grown. In constant US dollars, the value of Zambian imports of capital goods for the mining value chain climbed rapidly during the commodity boom then fell sharply, mostly because of a decline in purchases of earth-moving equipment.

23
Figure 18: Zambian imports of capital goods for the mining value chain, by exporting country, in billions of constant (2018) US dollars and as a percentage of total for major product groups

24
Notes: Data in constant dollars are deflated using average US dollar CPI for the period, rebased to 2018. The graphs use three-year totals because the project-based nature of investment leads to significant annual variations. (a) Includes cranes, conveyer belts, and forklifts.
Source: Authors’ construction based on ITC (no date): ‘Exports of Insulated Cable, Wire, Pipes/Tubes and Fittings at HS 4-Digit Level in US Dollars’.
Analysis of South Africa reveals comparative advantage points to its relative strength in capital goods for mining rather than metal fabrication (Figure 19). Heavy equipment for mining ranged between 0.1 per cent and 0.3 per cent of South African exports in 2017, although the share had decreased somewhat with the end of the commodity boom. Forklifts and conveyers comprised under 0.1 per cent, around the same as for other upper-middle-income economies other than China. For metal-fabrication equipment, in contrast, South African exports came to well under 0.01 per cent of its total foreign sales. Of these three categories of capital goods, only mining equipment made up a larger share of exports for South Africa than for China.

25
Figure 19: South Africa’s revealed comparative advantage compared with other upper-middle-income economies for equipment used in the mining value chain, 2001 to 2017
Note: Comparative advantage is the share of South African exports compared with other upper-middle-income countries (UMIC) and China. Note that the scale on the charts differs substantially.
Source: Authors’ construction based on ITC (no date): data for relevant sections of HS chapter 84.
In short, within the relatively small market for metalworking exports in Southern Africa, South Africa has lost ground throughout the 2010s. This reflects a number of constraints: limited export finance and ties to new companies compared with competitors from other countries; the South African government’s limited fiscal space for supporting research and development; the difficulties of expanding into new markets for the relatively small companies providing specialized machine tools and foundry inputs; and the tendency for producers to focus on the

26
larger markets for mining and, in the case of digital equipment, on customer, banking, and security systems rather than on capital goods.
Internationally, exports of capital goods, which require large and often long-term financing packages, have relied relatively heavily on public export insurance and, in many cases, credit in the 2010s. In this context, the share of export finance provided by China and India has tended to climb relatively rapidly, while that provided by Europe and the US has remained comparatively stable. South Africa established an export credit agency, the Export Credit Insurance Corporation (ECIC), in 2004, but it has remained far smaller relative to exports than other major suppliers of capital equipment to Zambia.
In 2018, estimates suggest that in China, state export insurance covered 18 per cent of exports, up from under 3 per cent a decade earlier. In India, the state covered 10 per cent of exports (David 2018: 154). In contrast, German credit insurance fell from around 10 per cent in 1960 to 1.3 per cent in 2017 (Euler Hermes 2018: 4). The US EXIM Bank covered a similar share of exports in 2014, but by 2018 had downsized to 0.3 per cent due to political challenges (EXIM 2018: 4). In contrast, as Figure 20 shows, in 2018, South Africa’s ECIC covered just 0.005 per cent of South African exports, excluding commodities, and 0.008 per cent of exports to Zambia.
Figure 20: ECIC total exposure as percentage of exports, with and without commodities, and exposure to Zambia as percentage of exports to Zambia, 2005–18
Note: * Excludes mining, basic metals, and agricultural exports.
Source: Authors’ construction based on ECIC annual reports for relevant years; concentrations of insurance risk in notes to the financial statements.
As Table 1 shows, the (limited) available data suggest that, in 2016, despite its relatively small size, South Africa was able to compete on export credit insurance to Zambia. The figures for China are understated, however, because data are available only for the Chinese Exim Bank, and not for the export credit agency Sinosure.

27
Table 1: Export credit insurance extended to Zambia, foreign direct investment (FDI) stock, and other foreign equity and debt, in millions of US dollars, 2016
Exposure by export credit agency
FDI in Zambia Other foreign equity and debt
South Africa 350 1,413 1,990
China (Exim only) 300 1,969 1,033
US 73 n/a 234
India 48 n/a n/a Germany n/a 450 n/a
Source: Authors’ construction based on, for South Africa export credit exposure, ECIC (2016: 93); for US export credit exposure, EXIM (2016: 9). Other information from BOZ (2018: 25ff.).
Although South African export credit insurance was fairly high for sales to Zambia from 2013 to 2018, it fluctuated substantially over the years, as Figure 21 shows. ECIC does not publish its lending by industry or project, so it is not possible to determine whether metal-fabrication producers benefited substantially from the loans. It appeared that most of its lending to Zambia financed inputs for mining, including construction services.
Figure 21: ECIC lending to Zambia and overall in constant (2017) rand, 2004–18
Note: Constant rand value deflated with average annual CPI.
Source: Authors’ construction based on ECIC annual integrated reports for relevant years.
In addition to higher funding for export credit, foreign countries, especially in the Global North, have been able to provide substantially greater support for research and development than South Africa. For instance, in 2016 Sweden spent €25 million on ‘world-class research’ in mining-related areas, while generally promoting collaboration between businesses and researchers. Finland has invested €30 million in private companies and public research institutes to make the country a global leader in the sustainable use of mineral resources (Dobbs et al. 2013: 82). In 2018/19, in contrast, South Africa’s entire budget for the Centre for Scientific and Industrial Research (CSIR) and Technology Innovation Agency (TIA) came to US$132 million (National Treasury 2018). The
28
published information does not provide specifics, but neither the CSIR nor the TIA have prioritized machine tools or other metalworking equipment.
In 2018/19, the CSIR planned to spend a total of R93 million, or around US$7 million, to support industrial technologies, which includes ‘engineered assembled products’ with a range of other areas such as agro-processing, pharmaceuticals, advanced materials, and Industry 4.0 (CSIR 2018: 36, 39). The TIA also does not publish a detailed budget by project or industry, but it has apparently prioritized mining equipment, the green economy, and biotechnologies in health, agriculture, and manufacturing. In that context it funded a project to develop cleaner steel processing, but it did not report any other projects related to capital equipment (TIA 2018: 54ff.).
In addition to these broader programmes, the South African Department of Trade and Industry (the dti) invested R140 million (around US$10 million) to support technological development especially among relatively small companies in 2017/18. It is not clear, however, whether any of these resources supported the development of technologies for metalworking (the dti 2018: 21).
Producers of capital goods have often argued that non-South African companies favour capital goods from their home countries, although there is virtually no published data on this issue. Because ZAMEFA is owned by a South African company, it seems unlikely that it would favour overseas equipment unfairly. The new cable producers in Zambia in the 2010s were owned by Chinese and Tanzanian companies, however. It is not possible to determine the share of South African ownership in the cluster of engineering firms supporting the mines.
Finally, many South African producers of capital equipment are relatively small and specialized. That makes it difficult for companies to sustain export markets, even in neighbouring countries, and to meet demand for some products.
As noted above, the average metalworking enterprise has around 15 workers, although the largest capital goods producers has over a thousand. Absent support from a dedicated marketing agency, whether through a cluster institution or government, it would likely prove difficult for many to identify and pursue clients, manage the financial and logistical arrangements required for exports, and provide ongoing maintenance and support. This lack of capacity has tended to counteract the advantages of proximity for many smaller South African producers of capital goods. The dti has noted that its research in the Copperbelt pointed to ‘the importance of the South African government working with exporters of capital goods to provide a far more complete package of support, particularly in terms of skills upgrading and supporting local manufacturers’ (the dti 2017: 70).
The capital equipment export council, SACEEC, is one of a suite of sector export councils established since the late 1990s as a public–private partnership with the dti. The council assists members to identify opportunities, facilitate participation in the dti’s trade promotion activities, enable potential customers to find South African producers, and liaise with government. It has also aimed to promote clusters within the industry. However, none of its clusters were an easy fit with producers of machine tools and metalworking machinery. It had a cluster for mining equipment, but it did not extend downstream to semi-manufactures (Essack and Lydall 2016: 5).
In the early 2000s, the dti initiated two programmes that were more focused on capital goods for metalworking—the National Tooling Initiative and the National Foundry Technology Network. Although these programmes included export support, they prioritized skills development and assisting individual foundries to upgrade their production systems. They apparently did not have extensive programmes to promote exports or support investments in other SADC countries (the dti 2018: 103, 121).

29
4. Learning for regional industrial policy
Industrial policy has to both work ahead of the market and realize when new industries or clusters will not prove viable. For Southern Africa, as long as copper producers pay the international price for local copper, there is little justification for expanding downstream processing. In these circumstances, production of semis and cable seems viable only to meet regional demand, with limited scope for deep-sea exports.
In theory, under these conditions a sensible division of labour in the region should have emerged, in which Zambia would prioritize semis and cable, and South Africa would supply equipment and technological support. In practice, however, the theoretical benefits of regional cooperation in the long run have run up against the potential costs to existing producers. On the one hand, established South African companies have competed with Zambian enterprises for the regional cable and wire market. On the other, Zambian semis and cable producers have often been able to obtain more favourable financing as well as competitive products from overseas suppliers.
In these circumstances, an integrated value chain has seemed unlikely to emerge in the absence of more coherent and large-scale government policies at both the domestic and the regional levels. Key steps towards promoting greater cooperation have included:
• Developing a policy of regional, not just national, preferences in procurement of cable as well as inputs for copper semi-fabrication; and
• Increasing support for South African capital goods producers outside of the mining value chain, especially smaller businesses, particularly around financing, marketing, and after-care support for smaller producers.
As with any policy, an effective strategy would have to take into account the relatively limited resources and institutional capacity for implementation. Developing support agencies for South African capital goods manufacturers, and targeted finance, would require both prioritization and resources, as well as responsiveness to business needs. A strategy would also have to manage the trade-offs for stakeholders by ensuring broader benefits. In particular, South African producers and users of cable would have to accept a larger share of imports from Zambia, and Zambia would have to incentivize greater use of South African inputs.

30
References
Afrizam. (no date). ‘Afrizam Electrical Equipment Limited’. Lusaka: Afrizam. Available at: https://sites.google.com/view/afrizamee/home (accessed April 2019).
Ancharaz, V. (2013). ‘Can Chinese SEZs Spur Industrial Development in Africa?’ Bridges Africa, 2(6), 9 September.
BOZ (2017). Foreign Private Investment & Investor Perceptions in Zambia—2017. Lusaka: Bank of Zambia (BOZ).
BOZ (2018). Foreign Private Investment & Investor Perceptions in Zambia—2018. Lusaka: Bank of Zambia.
Copper Alliance (2018). ‘Global 2018 Semis End Use Data Set’. Washington, DC: International Copper Association (ICA). Available at: https://copperalliance.org/trends/global-2018-semis-end-use-data-set (accessed March 2019).
CSIR (2018). ‘CSIR Strategic and Annual Performance Plan for 2018/19’. Presentation to the Parliamentary Portfolio Committee on Science and Technology, 25 April. Available at: www.pmg.org.za (accessed April 2019).
David, V. (2018). ‘Economic Development and Protecting Trade’. In Berne Union Yearbook 2018. London: Berne Union.
Dobbs, R., J. Oppenheim, A. Kendall, F. Thompson, M. Bratt, and F. Van der Mare (2013). Reverse the Curse: Maximizing the Potential of Resource-Driven Economies. London: McKinsey Global Institute.
the dti (2017). Industrial Policy Action Plan 2017/18–2019/20. Part 2: The Engine Room of Change. Pretoria: Department of Trade and Industry (the dti).
the dti (2018). 2017/18 Annual Incentive Report. Pretoria: Department of Trade and Industry.
East African Mining News (2017). ‘Offshore Markets Sustain SA Capital Equipment Companies’. East African Mining News, 5 October.
ECIC (2016). ECIC Integrated Report 2015/16. Centurion: Export Credit Insurance Corporation (ECIC).
Essack, H., and M. Lydall (2016). ‘Regional Market Development and Opportunities to Advance Exports for Mineral Processing Equipment Firms in South Africa’. Presentation to Economic Research Advisory Network First Annual Conference, Port Elizabeth. Available at: www.thedti.gov.za (accessed April 2019).
Euler Hermes (2018). ‘Exportgarantien Jahresbericht 2017’. Hamburg: Euler Hermes.
EXIM (2016). Annual Report. Washington, DC: Export–Import Bank of the United States (EXIM).
EXIM (2018). Annual Report. Washington, DC: Export–Import Bank of the United States.
Fessehaie, J., and Z. Rustomjee (2018). ‘Resource-Based Industrialisation in Southern Africa: Domestic Policies, Corporate Strategies and Regional Dynamics’. Development Southern Africa, 35(3): 404–18.
Hampwaye, G., W.C. Kaleng’a, and G. Siame. (2015). ‘Regional Mineral Value Chains: Implications for Zambia’s Copper Sector Industrialization-Oriented Beneficiation’. Paper presented at the Regional Industrialisation and Regional integration TIPS Annual Forum 2015, Johannesburg. Pretoria: TIPS.
31
ITC (International Trade Centre) (no date). ‘Trade Map’. Geneva: ITC. Available at: www.trademap.org (accessed March 2019).
Kaplan, D. (2011). ‘South African Mining Equipment and Related Services: Growth, Constraints and Policy’. MMCP Discussion Paper 5. Cape Town: University of Cape Town.
Lombe, W. (2018). ‘Local Content in Zambia: A Faltering Experience?’ WIDER Working Paper 2018/118. Helsinki: UNU-WIDER.
Matos, G.R., with L.D. Miller and J.J. Barry (2014), ‘Historical Global Statistics for Mineral and Material Commodities’. US Geological Survey Data Series 896. Reston, VA: USGS. Available at: https://www.usgs.gov/centers/nmic/historical-global-statistics-mineral-and-material-commodities (accessed March 2019).
Mining Indaba (2018). MACIG: The Official Mining in Africa Country Investment Guide 2018. Cape Town: Investing in Africa Mining Indaba.
Mphaisha, C.J.J. (1988). ‘Public Enterprise and Development: A Study of the Metal Fabricators of Zambia’. Journal of Black Studies, 19(1): 79–96.
National Treasury (2018). ‘Estimates of National Expenditure 2018/9’. Pretoria: National Treasury. Available at: www.treasury.gov.za (accessed April 2019).
Non-Ferrous Metalworks (Z) Ltd (2012). ‘About Us’. Ndola: Non-Ferrous Metaol Works (Z) Ltd. Available at: http://www.nonferrousmetalszambia.com/about_us (accessed April 2019).
Reuters (2018). ‘Transnet to Lease Rolling Stock to Zambia Railways’. Engineering News (Johannesburg), 8 February.
Quantec (2018). ‘The EasyData Service’. Pretoria: Quantec. Available at: https://www.quantec.co.za/easydata (accessed September 2017).
ROZ (2006). Vision 2030. Lusaka: Republic of Zambia (ROZ). Available at: www.mcti.gov.zm (accessed April 2019).
ROZ (2012). Industry Strategy for Engineering Products. Lusaka: Ministry of Commerce, Trade and Industry.
ROZ (2018). National Industrial Policy 2018. Lusaka: Ministry of Commerce, Trade and Industry.
SARS (2017). ‘SARS 2017 Tax Statistics—CIT’. Pretoria: SARS (South African Revenue Service). Available at: www.sars.gov.za (accessed March 2019).
Statistics South Africa (2018). ‘Annual Financial Statistics’. Pretoria: Statistics South Africa. Available at: www.statssa.gov.za (accessed September 2018).
TIA (2018). Annual Report 2017/18. Pretoria: Technology Innovation Agency (TIA).
UNDP (2015). ‘If Africa Builds Nests, Will the Birds Come? Comparative Study on Special Economic Zones in Africa and China’. Working Paper 06.2015. New York: UNDP (United National Development Programme).
US Geological Survey (2015). ‘USGS Minerals Yearbook 2015’, volume I: Commodity Report. Reston, VA: USGS. Available at: https://minerals.usgs.gov (accessed March 2019).
US Geological Survey (2019). ‘Mineral Commodity Summaries: Copper’. Reston, VA: USGS. Available at: https://minerals.usgs.gov (accessed March 2019).
World Bank (2011). ‘What Is the Potential for More Copper Fabrication in Zambia?’ Report 62379-ZM. Washington, DC: World Bank.

32
World Bank (2019). ‘World Development Indicators’. Washington, DC: World Bank. Interactive data set. Available at https://databank.worldbank.org/data/reports.aspx?source=world-development-indicators# (accessed April 2019).
WOW (no date). ‘Report Generator’. Johannesburg: WOW (Who Owns Whom). Available at: https://reportgenerator.woweb.co.za (accessed April 2019).
Xiaoyang, T. (2015). ‘How Do Chinese “Special Economic Zones” Support Economic Transformation in Africa?’ London: ODI (Overseas Development Institute).
Zambia Daily Mail (2014). ‘Zalco Invests $15 Million’. Zambia Daily Mail, 27 October.
Zambia Daily Mail (2017a). ‘CB Gets Massive Capital Ventures’. Zambia Daily Mail, 19 July.
Zambia Daily Mail (2017b). ‘Promote Local Products’. Zambia Daily Mail, 4 July.
Zambia Daily Mail (2017c). ‘Electrical Equipment-Manufacturing Plant to be Established’. Zambia Daily Mail, 31 October.
Zambia Daily Mail (2018). ‘Electrical Equipment Imports to Cut’. Zambia Daily Mail, 10 April.
Zambia Daily Mail (2019). ‘Sable Zinc Closure Saddens KCCI’. Zambia Daily Mail, 4 December.
ZAMEFA (2018). ‘Metal Fabricators of Zambia PLC. Directors’ Report and Consolidated Financial Statements for the 9 Month Period ended 30 September 2018’. Lusaka: Metal Fabricators of Zambia Plc.
Zeng, D.Z. (2016). ‘Multi-Facility Economic Zones in Zambia: Progress, Challenges and Possible Interventions’. Working Paper. Washington, DC: World Bank.