wikipedia bare-metal cluster to serve alexandros kosiaris ... · separated etcd clusters (3...
TRANSCRIPT
Building a Kubernetes on Bare-Metal Cluster to Serve
Wikipedia
Alexandros KosiarisGiuseppe Lavagetto

Outline
● Introduction● Rationale● Cluster setup● Networking● Monitoring● Service deployment
pipeline

Introduction● WMF is the organization running the
infrastructure supporting Wikipedia and other projects
● 17 Billion page views monthly● 43 Million edits per month● 323k new registered users monthly
Intro (2)● 2 Primary DCs (Ashburn, Dallas)● 3 Caching DCs (San Francisco, Amsterdam,
Singapore)● ~1200 hardware machines● ~100 VMs
● Size of engineering: ~160 people● SRE team: ~ 20 people (4 dedicated to the
application layer)

Reasons for introducing kubernetes
2014
2018

Also ● Elasticity● Single-node failure management● Containers● Power to deployers!
● More moving parts● New paradigm(™)● Containers
But
Why on bare metal ?
No public cloud
● User’s privacy guarantee● Already maintaining our own
infrastructure and CDN● Costs
No private cloud
● We actually run kubernetes on OpenStack , for a different project
● Reducing moving parts● No practical advantages for production services
Cluster setup (1)● We build our own Debian packages
○ Kubernetes 1.7 (on the way to 1.8 upgrade)○ Calico 2.2.0○ Etcd 2.2.1 (scheduled upgrade to 3.x)
● Configure all cluster components via Puppet○ TLS included○ But not the kubernetes resources!
● API servers are set up highly available (2 per cluster)○ Kube-scheduler and kube-controller-manager run on the same hosts as apiserver
● 2 production clusters (1 per primary DC), 1 staging● Separated Etcd clusters (3 servers, DC-local, on Ganeti VMs) ● Kube-proxy in iptables mode● Docker as the runtime, but interested in rkt

Cluster setup (2)● RBAC enabled since day #1 (we delayed rolling out a bit for that)● 1 namespace per application/service● Token-auth-file authentication● Standard admission controllers for our version enabled● Firewalling enabled on all nodes via ferm.
○ This works better than we feared!

Networking diagram

Networking● Machines distributed per rack row for redundancy● For backwards compatibility reasons we wanted to avoid overlay networking for pods
○ And calico fitted very nicely our networking model● Calico BGP speakers on every node and the 2 routers● No BGP Full mesh (cause the next hop is the router)
○ But will possibly have row specific full mesh● RFC1918 10.x/8 address for the pods, but fully routable in our network.● RFC1918 10.x/8 address for the Service IPs too, but:
○ Those are effectively just reservations○ Are there to avoid surprises
● Pods have IPv6 address as well. Thank you Calico!○ net.ipv6.conf.all.forwarding=1○ net.ipv6.conf.eth0.accept_ra=2
Network Policies● Kubernetes 1.7 does not support egress (but 1.8 does)● But Calico does.● Also does not allow changing a NetworkPolicy resource● Alternative: We ‘ve patched calico-k8s-policy controller 0.6.0 (the python one)
○ Added reading a config file containing an enforced standard egress policy○ Populate the file using a ConfigMap○ Patch is minimal: 14 LoC in total○ But also already deprecated. Next version is in Go
Ingress● What about Ingress?
○ Evaluated it and decided to hold on it for now. We don’t even need the niceties yet.
● Use in-house python daemon running on load balancers (PyBal)○ We do NodePort with externalIPs○ Manages kernel LVS DR entries○ Monitors endpoints and pools/depools promptly○ BGP with the routers (fast depool of load balancers)○ Highly configurable○ Operationally lightweight (etcd/confd configuration population)
● A lot of expertise in house regarding PyBal, reusing it sounded the best approach● Open Source: https://github.com/wikimedia/PyBal

Metrics collection● Infrastructure (Prometheus)
○ The discovery mechanisms rule○ Polling all API servers ○ Polling all kubelets○ Polling kubelet cAdvisors as well (hello kubernetes 1.7.3!!!)
● Applications (Prometheus, yes that too!)○ Applications historically used statsd ○ prometheus_statsd_exporter in a sidecar container, applications talk to localhost :-)○ Prometheus discovers and polls all pods
● https://grafana.wikimedia.org/dashboard/db/kubernetes?orgId=1

Alerting● Prometheus again! Albeit only partly● Still on icinga 1.11.6● Started by using check_prometheus_metric.sh
○ And it did not support floats○ Rewrote the whole thing in python
● Add in Puppet and the checks can be a bit intimidating to look at ○ query => "scalar(\
sum(rate(kubelet_runtime_operations_latency_microseconds_sum{\ job=\"k8s-node\", instance=\"${::fqdn}\"}[5m]))/ \ sum(rate(kubelet_runtime_operations_latency_microseconds_count{\ job=\"k8s-node\", instance=\"${::fqdn}\"}[5m])))",
● Swagger spec based monitoring to instrument checks○ https://github.com/wikimedia/operations-software-service-checker
Streamlined Service DeliveryThe use of Kubernetes and containers allows to re-think the way software is tested and run at all stages of
its life, and make everyone’s life a bit easier. From the developer having to set up their local dev
environment, to the build and deployment of artifacts, all our focus is on removing toil.

Basic requirements
Developers don’t need to know the nuances of dockerfiles, or of Kubernetes. They need to develop and test software in a computing environment as close as possible to the production one.
Deployers need to be confident the artifact they’re deploying is thoroughly tested, and its build process is automated and reproducible. They also need a standardized, simple tool for progressively deploying new versions


DevelopmentBlubber allows easy (and standardized!) creation of docker images for development, testing and release
Helm chart scaffolding - generates a standard structure of an helm chart usable locally in minikube, in CI and production
The resulting helm chart can be deployed to minikube locally

Build/verify/stageWhen a release is tagged:
1. Test image is built, unit/integration tests are run2. Production image is built and simple e2e tests are run3. Image is published to the registry4. The new release gets deployed to the staging
environment using the same helm chart as in production
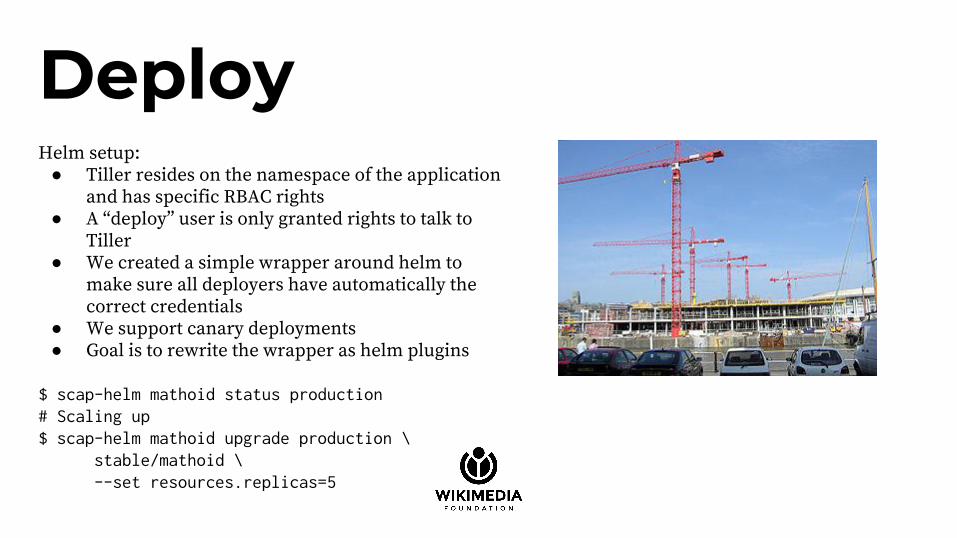
DeployHelm setup:● Tiller resides on the namespace of the application
and has specific RBAC rights● A “deploy” user is only granted rights to talk to
Tiller● We created a simple wrapper around helm to
make sure all deployers have automatically the correct credentials
● We support canary deployments● Goal is to rewrite the wrapper as helm plugins
$ scap-helm mathoid status production# Scaling up$ scap-helm mathoid upgrade production \ stable/mathoid \ --set resources.replicas=5
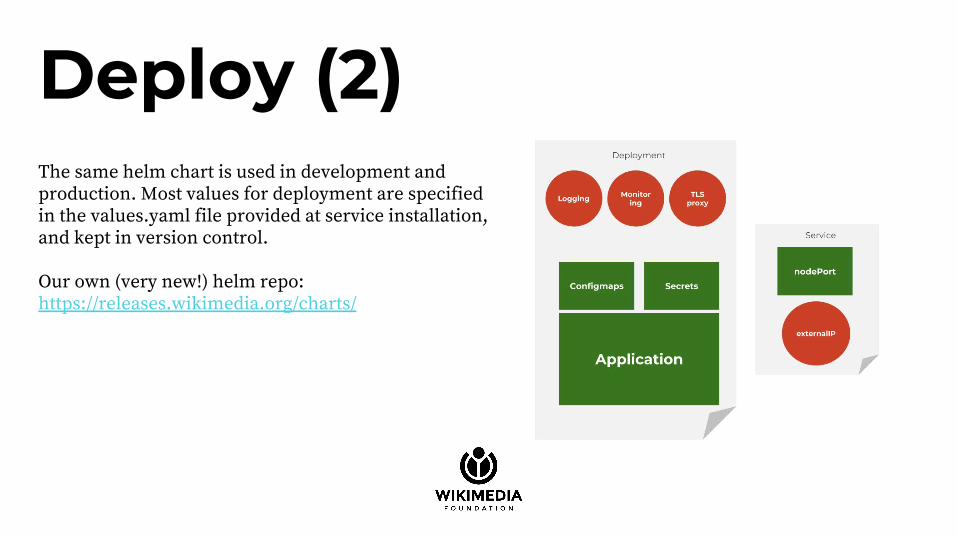
Deploy (2)The same helm chart is used in development and production. Most values for deployment are specified in the values.yaml file provided at service installation, and kept in version control.
Our own (very new!) helm repo: https://releases.wikimedia.org/charts/

Questions ?

We are hiring!!!https://jobs.wikimedia.org

THANK YOU