will lent, research & policy analyst, solar energy...
TRANSCRIPT
Will Lent, Research & Policy Analyst, Solar Energy Industries Association Andrew Krulewitz, Solar Analyst; Editor, PVNews, GTM Research Cory Honeyman Solar Analyst, GTM Research
June 27, 2013

Antitrust Reminder As a trade association of competitors, SEIA must comply with and be mindful of antitrust laws. It is important that competitively sensitive matters are not discussed on this call, including product prices or costs; sales terms or conditions; production levels; sales territories; marketing plans; industry forecasts; or bid terms. If any such topic is raised, I will stop the conversation and, if necessary, end the call. For more information, SEIA’s antitrust guidelines are available on our website.
June 25, 2013 © 2013 Solar Energy Industries Association® 2
About SEIA • Founded in 1974
• U.S. National Trade Association for Solar Energy • 1,000 member companies from around the world • Members from across 50 states • Largest companies in the world as well as small
installers • Our Mission: Build a strong solar industry to power
America
• Our Goal: 10 gigawatts (GW) of annual installed solar capacity in the U.S. by 2015
June 25, 2013 © 2013 Solar Energy Industries Association® 3
Solar in America: Strong and Getting Stronger • 119,000 American workers in solar – more than double the
number in 2009 – at 5,600 companies across the country
• One of the fastest growing sectors of the U.S. economy – 2012 installations grew 76% over 2011
• Q1 2013 was the largest first quarter on record. PV market installed 723 MW, growing 33% over last year
• Over 8,500 MW of cumulative installed solar electric capacity, enough to power 1.3 million average American homes
June 25, 2013 © 2013 Solar Energy Industries Association® 4

U.S. Solar Business Locations
June 25, 2013 © 2013 Solar Energy Industries Association® 5
Solar Market Insight: Q1 2013 • Detailed data on markets in
top 28 states plus DC available in full report.
• Free executive summary provides national aggregate data on installations, pricing, manufacturing and demand forecasts.
• Full report for sale (50% discount to SEIA members) includes quarterly forecasts as well as detailed market segment and state data.
June 25, 2013 © 2013 Solar Energy Industries Association® 6

SEIA/GTM Research Partnership • Industry need for up-to-date and reliable market data
– Market reports issued every quarter
• Member discount: benefit for SEIA members – Reliable market intelligence
– Member discount makes SMI the most affordable market research available
• Data to support SEIA’s advocacy mission • SEIA-GTM conferences • Email questions to [email protected] or
June 25, 2013 © 2013 Solar Energy Industries Association® 7
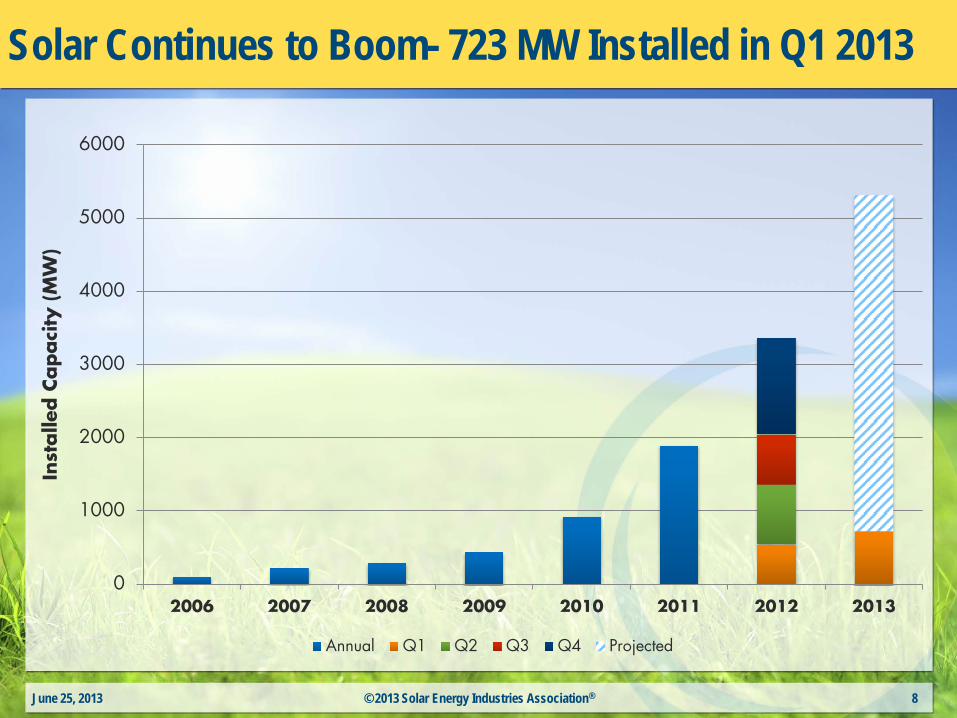
Solar Continues to Boom- 723 MW Installed in Q1 2013
June 25, 2013 © 2013 Solar Energy Industries Association® 8
0
1000
2000
3000
4000
5000
6000
2006 2007 2008 2009 2010 2011 2012 2013
Inst
alle
d C
apaci
ty (M
W)
Annual Q1 Q2 Q3 Q4 Projected
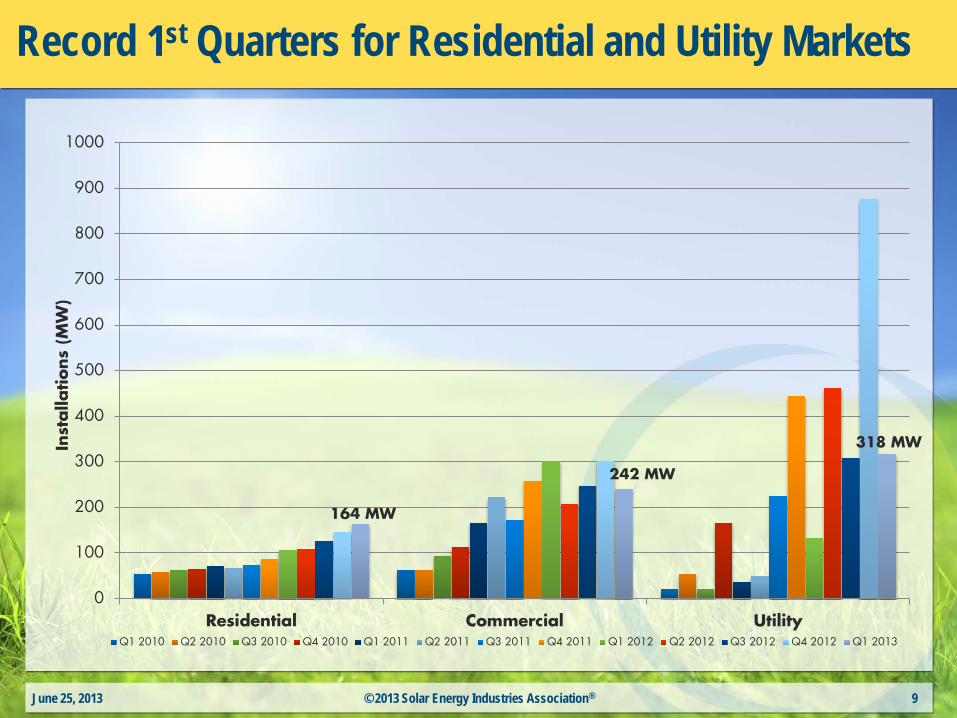
Record 1st Quarters for Residential and Utility Markets
June 25, 2013 © 2013 Solar Energy Industries Association® 9
164 MW
242 MW
318 MW
0
100
200
300
400
500
600
700
800
900
1000
Residential Commercial Utility
Inst
alla
tions
(MW
)
Q1 2010 Q2 2010 Q3 2010 Q4 2010 Q1 2011 Q2 2011 Q3 2011 Q4 2011 Q1 2012 Q2 2012 Q3 2012 Q4 2012 Q1 2013
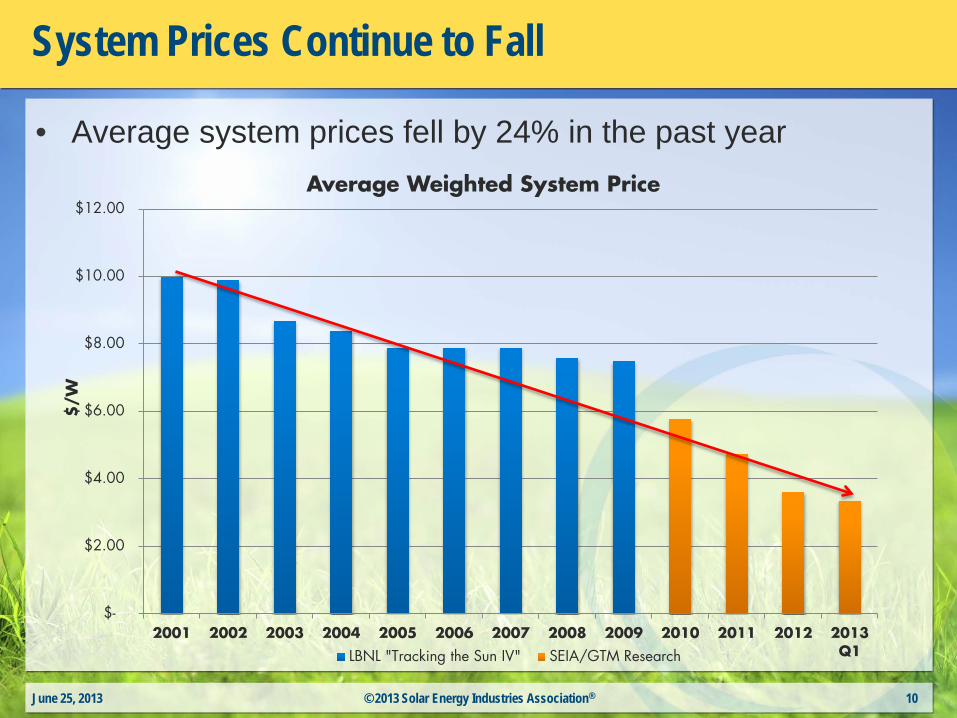
System Prices Continue to Fall
• Average system prices fell by 24% in the past year
June 25, 2013 © 2013 Solar Energy Industries Association® 10
$-
$2.00
$4.00
$6.00
$8.00
$10.00
$12.00
2001 2002 2003 2004 2005 2006 2007 2008 2009 2010 2011 2012 2013Q1
$/W
Average Weighted System Price
LBNL "Tracking the Sun IV" SEIA/GTM Research
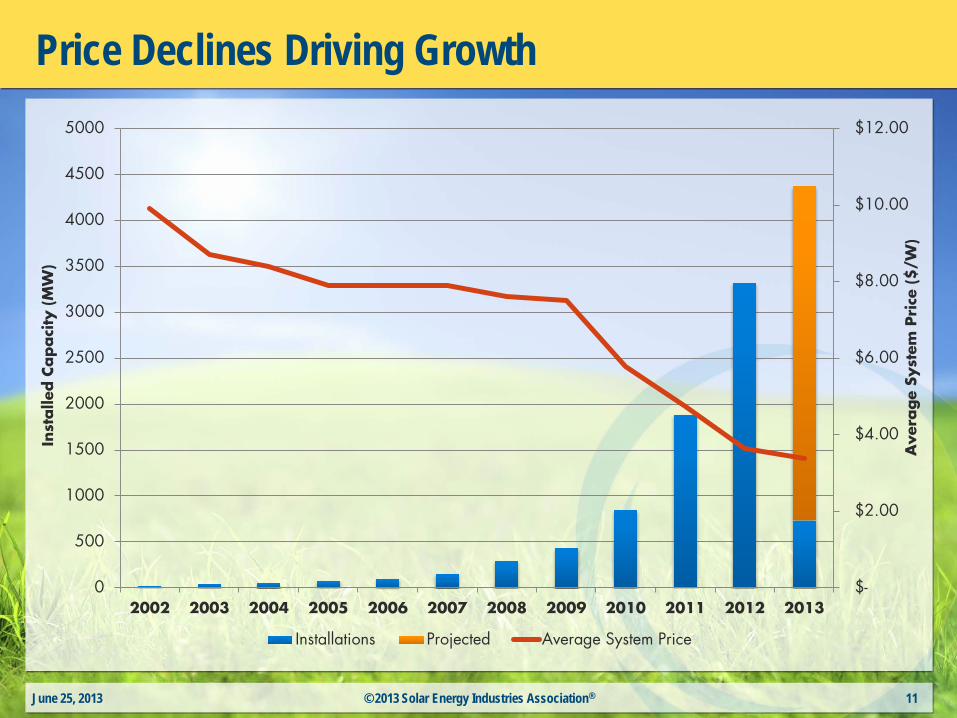
Price Declines Driving Growth
June 25, 2013 © 2013 Solar Energy Industries Association® 11
$-
$2.00
$4.00
$6.00
$8.00
$10.00
$12.00
0
500
1000
1500
2000
2500
3000
3500
4000
4500
5000
2002 2003 2004 2005 2006 2007 2008 2009 2010 2011 2012 2013
Ave
rage
Syst
em P
rice
($/W
)
Inst
alle
d C
apaci
ty (M
W)
Installations Projected Average System Price

Average Residential System Price Below $5.00/W
June 25, 2013 © 2013 Solar Energy Industries Association® 12
$0.00
$1.00
$2.00
$3.00
$4.00
$5.00
$6.00
$7.00
($/W
)
Average Residential System Price by State- Q1 2013

Average Commercial System Below $4.00/W
June 25, 2013 © 2013 Solar Energy Industries Association® 13
$0.00
$1.00
$2.00
$3.00
$4.00
$5.00
$6.00
$7.00
($/W
)
Average Commercial System Price by State- Q1 2013
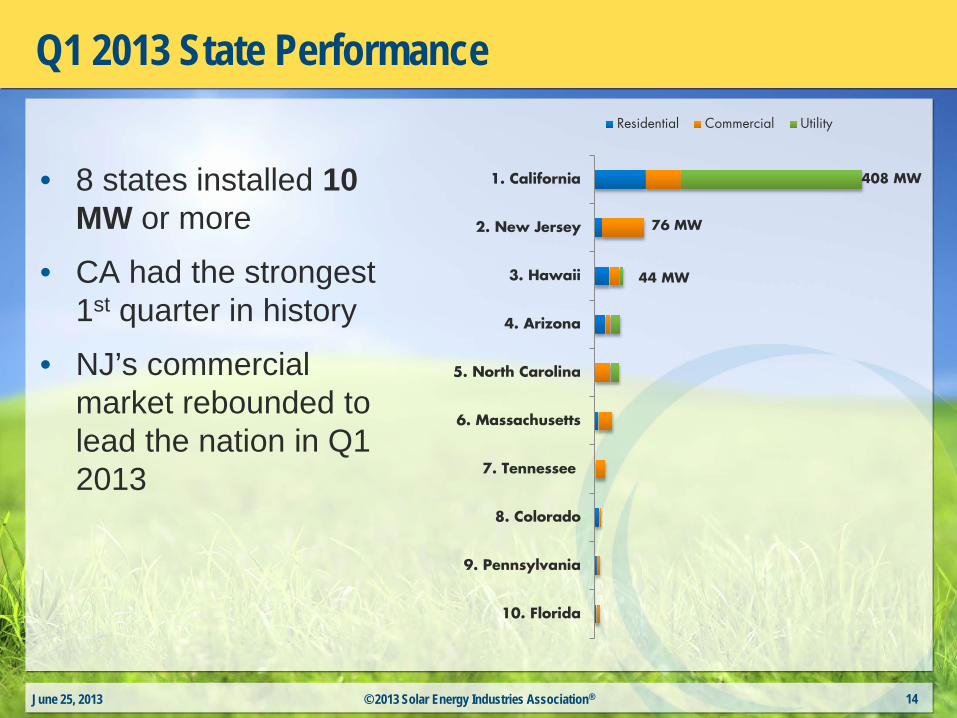
Q1 2013 State Performance
• 8 states installed 10 MW or more
• CA had the strongest 1st quarter in history
• NJ’s commercial market rebounded to lead the nation in Q1 2013
June 25, 2013 © 2013 Solar Energy Industries Association® 14
76 MW
44 MW
408 MW
10. Florida
9. Pennsylvania
8. Colorado
7. Tennessee
6. Massachusetts
5. North Carolina
4. Arizona
3. Hawaii
2. New Jersey
1. California
Residential Commercial Utility
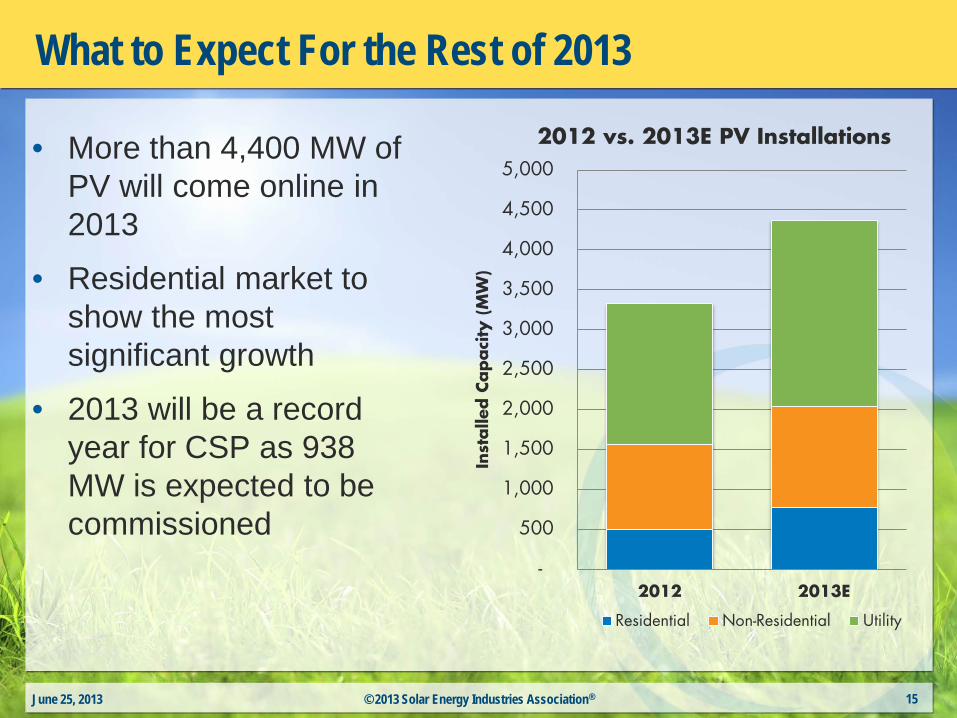
What to Expect For the Rest of 2013
• More than 4,400 MW of PV will come online in 2013
• Residential market to show the most significant growth
• 2013 will be a record year for CSP as 938 MW is expected to be commissioned
June 25, 2013 © 2013 Solar Energy Industries Association® 15
-
500
1,000
1,500
2,000
2,500
3,000
3,500
4,000
4,500
5,000
2012 2013E
Inst
alle
d C
apaci
ty (
MW
)
2012 vs. 2013E PV Installations
Residential Non-Residential Utility
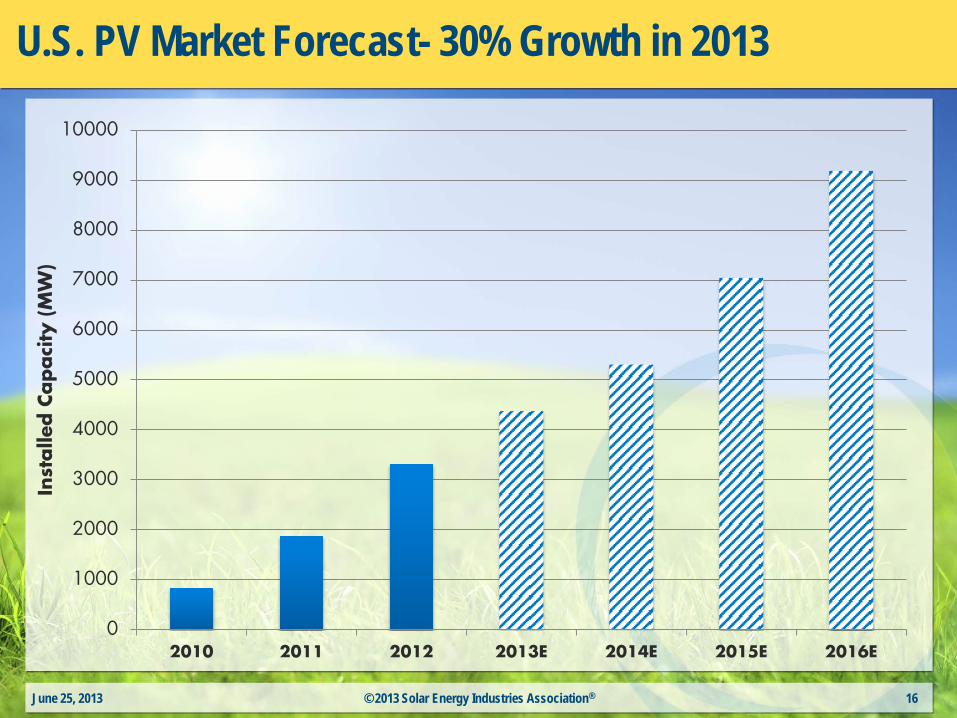
U.S. PV Market Forecast- 30% Growth in 2013
June 25, 2013 © 2013 Solar Energy Industries Association® 16
0
1000
2000
3000
4000
5000
6000
7000
8000
9000
10000
2010 2011 2012 2013E 2014E 2015E 2016E
Inst
alle
d C
apaci
ty (M
W)
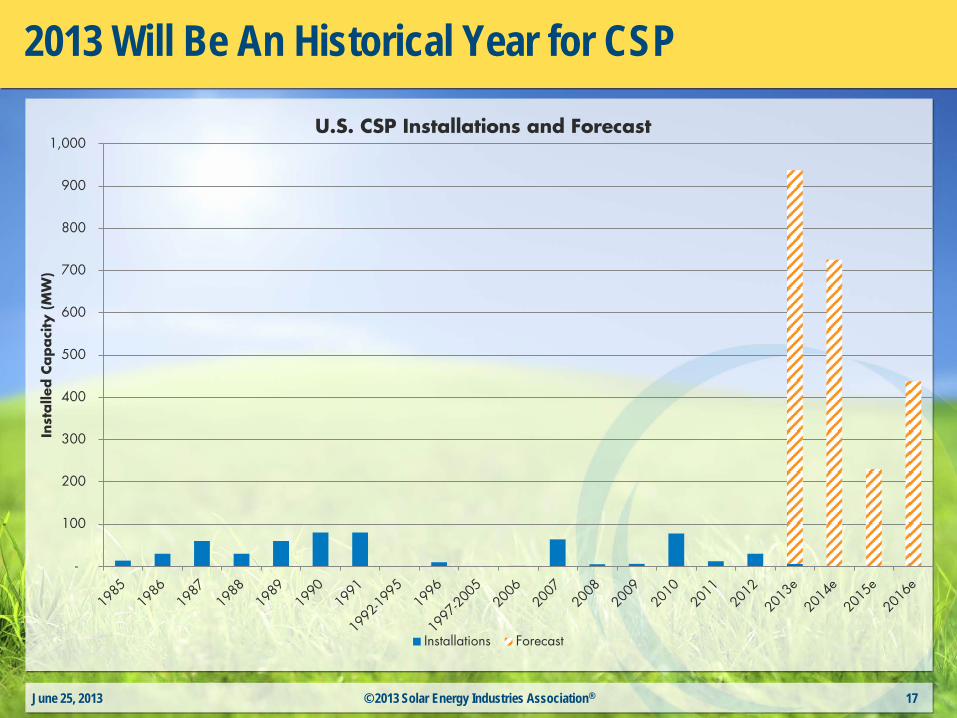
2013 Will Be An Historical Year for CSP
June 25, 2013 © 2013 Solar Energy Industries Association® 17
-
100
200
300
400
500
600
700
800
900
1,000
Inst
alle
d C
ap
aci
ty (
MW
)
U.S. CSP Installations and Forecast
Installations Forecast
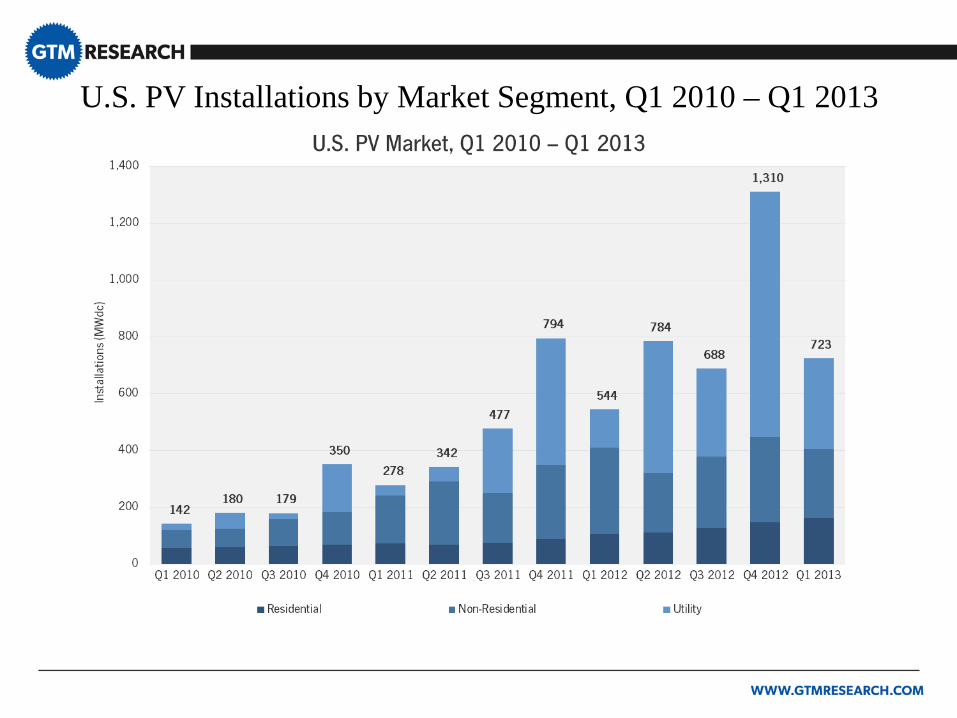
U.S. PV Installations by Market Segment, Q1 2010 – Q1 2013

Market Segment Trends, Q1 2012 – Q1 2013 • The residential market
continued its steady and incremental growth, up 11% quarter-over-quarter
• Commercial installations
dipped 20% compared to last quarter; NJ was the only major market to see growth
• The utility market dropped quarter-over-quarter, primarily supported by 276.8 MW installed in CA
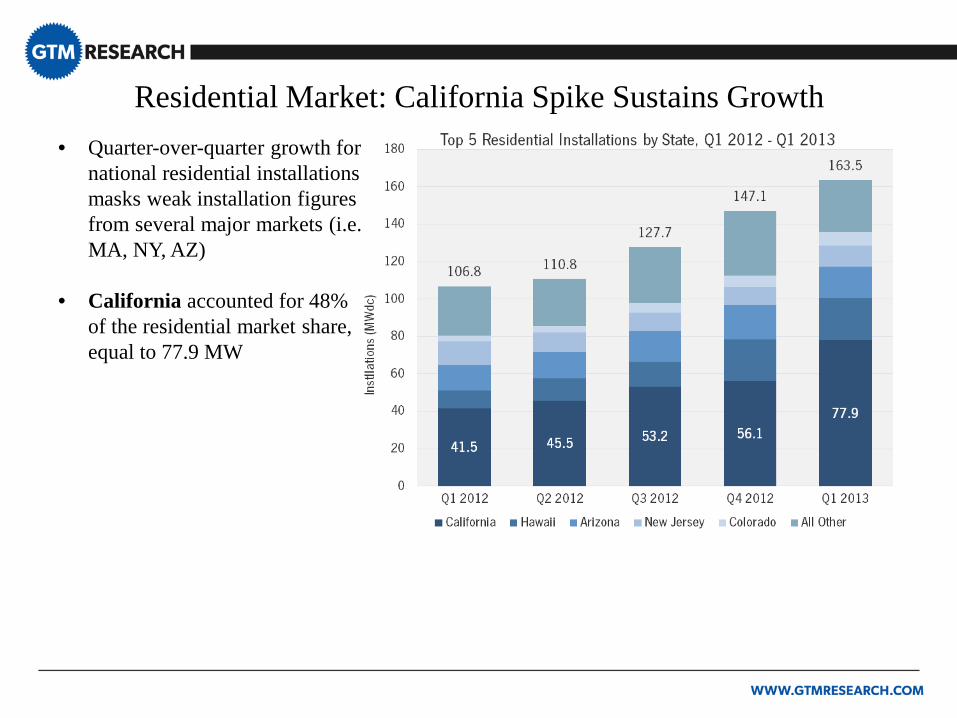
Residential Market: California Spike Sustains Growth
• Quarter-over-quarter growth for national residential installations masks weak installation figures from several major markets (i.e. MA, NY, AZ)
• California accounted for 48% of the residential market share, equal to 77.9 MW
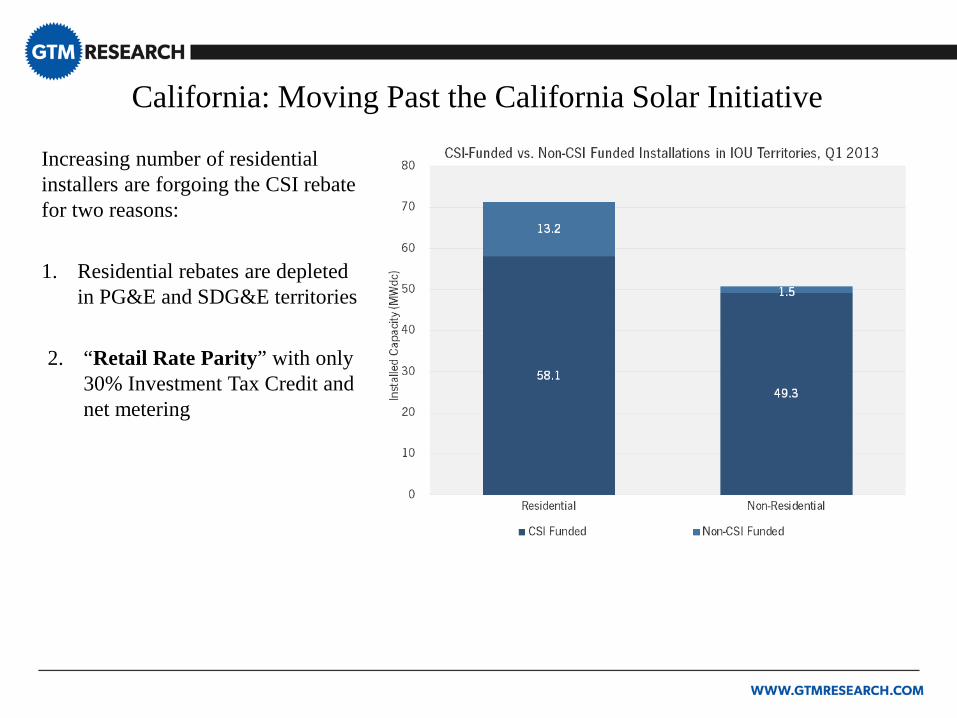
California: Moving Past the California Solar Initiative
Increasing number of residential installers are forgoing the CSI rebate for two reasons: 1. Residential rebates are depleted
in PG&E and SDG&E territories 2. “Retail Rate Parity” with only
30% Investment Tax Credit and net metering
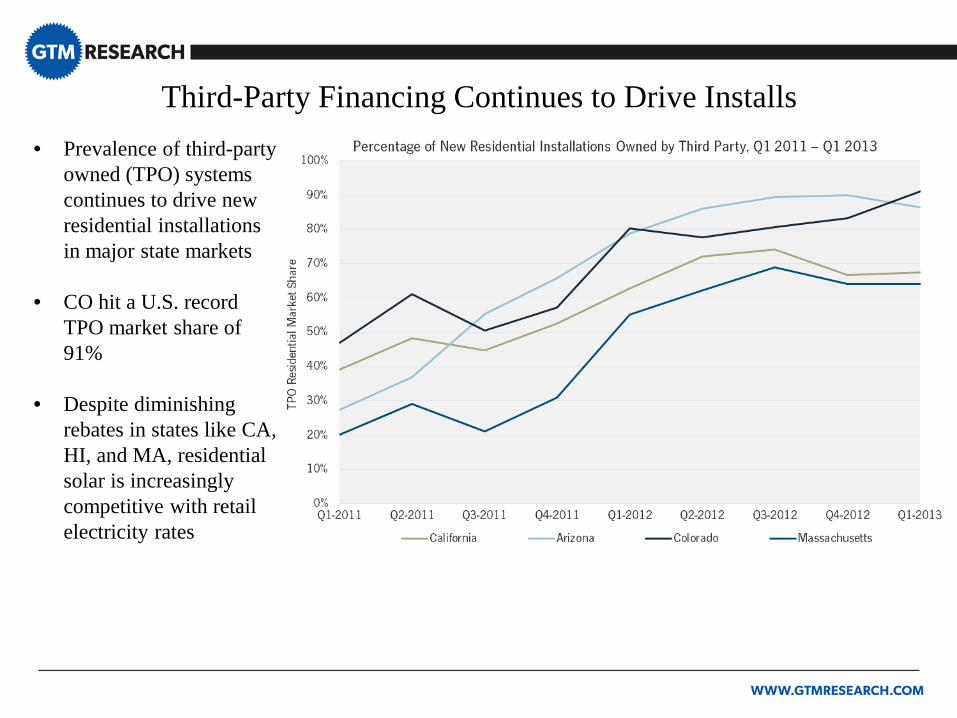
Third-Party Financing Continues to Drive Installs • Prevalence of third-party
owned (TPO) systems continues to drive new residential installations in major state markets
• CO hit a U.S. record
TPO market share of 91%
• Despite diminishing rebates in states like CA, HI, and MA, residential solar is increasingly competitive with retail electricity rates
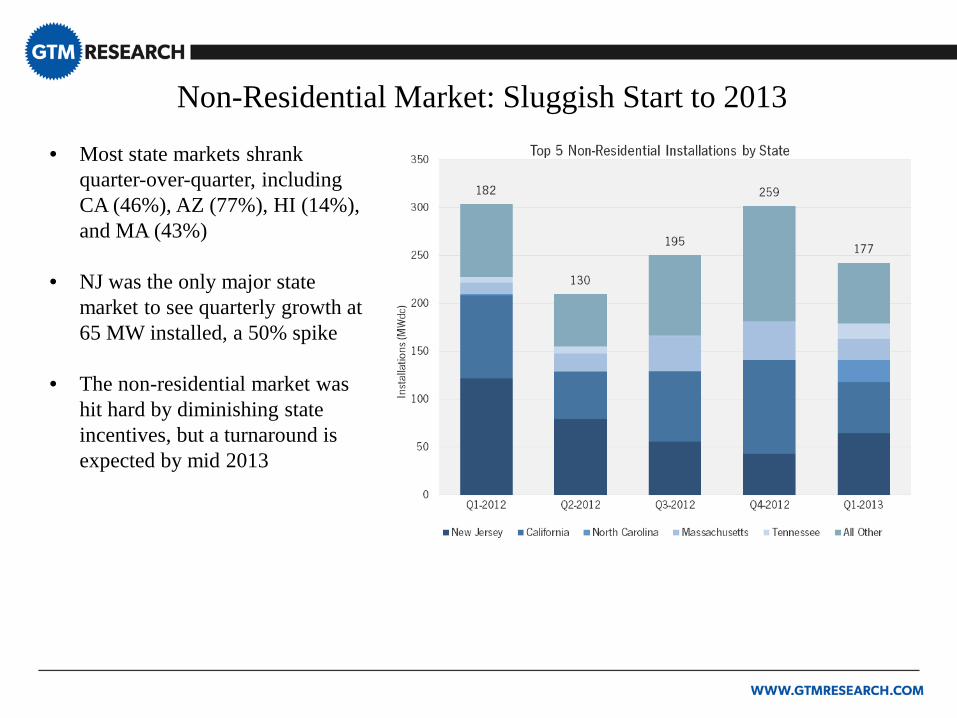
Non-Residential Market: Sluggish Start to 2013
• Most state markets shrank quarter-over-quarter, including CA (46%), AZ (77%), HI (14%), and MA (43%)
• NJ was the only major state market to see quarterly growth at 65 MW installed, a 50% spike
• The non-residential market was hit hard by diminishing state incentives, but a turnaround is expected by mid 2013

U.S. Utility Market – Top 10 Q1 Projects Completed
Project Name Developer Capacity (MWdc) State Power Offtaker EPC Firm
Antelope Valley Solar Ranch One – Phase II First Solar 79 CA Pacific Gas &
Electric First Solar
Alpine Solar Project NRG Energy 76 CA Pacific Gas & Electric First Solar
Catalina Solar – Phase I EDF Renewable Energy 67 CA San Diego Gas &
Electric Bechtel
Borrego Springs Solar I NRG Energy 30 CA San Diego Gas & Electric
Sunora Energy Solutions
SPS Atwell Island Samsung America, ENCO 23 CA Pacific Gas &
Electric Quanta Services
APS AZ Sun – Foothills Solar Plant – Phase 1
Arizona Public Service 15 AZ Arizona Public
Service AMEC
Fuquay Farm Strata Solar, Canadian Solar 6 NC Progress Energy
Carolinas Strata Solar
Kalaeloa Solar One Keahole Solar Power 6 HI Hawaiian Electric
Company -
Belwood Solar Farm Strata Solar 5 NC Duke Energy Carolinas Strata Solar
Southern Vermont Energy Park Solar
SVEP Solar Project Company 3 VT - RGS Energy
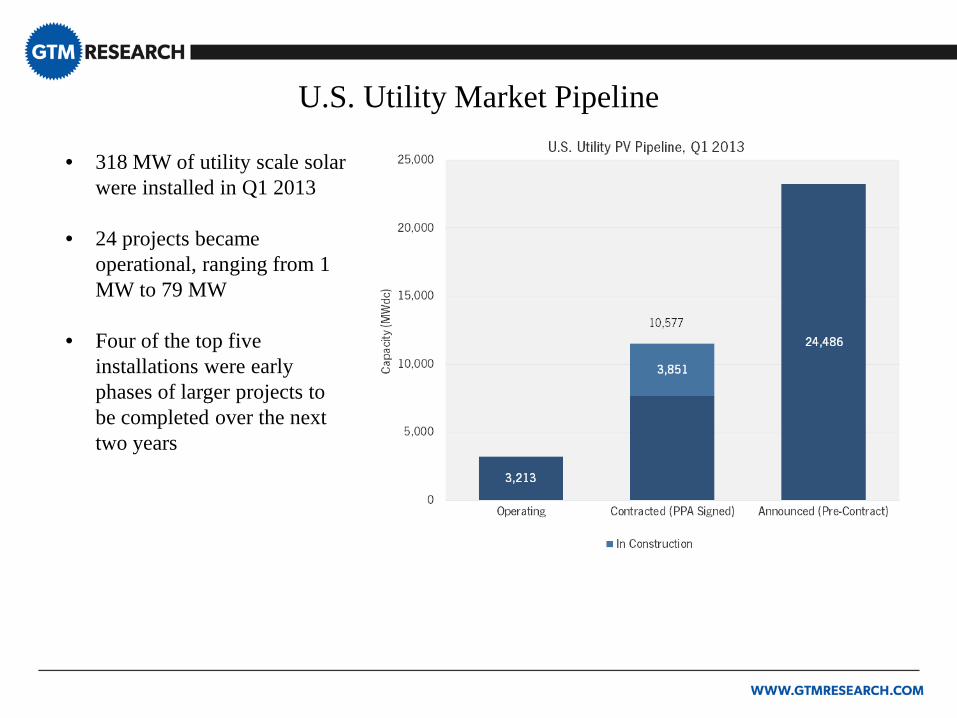
U.S. Utility Market Pipeline
• 318 MW of utility scale solar were installed in Q1 2013
• 24 projects became operational, ranging from 1 MW to 79 MW
• Four of the top five installations were early phases of larger projects to be completed over the next two years
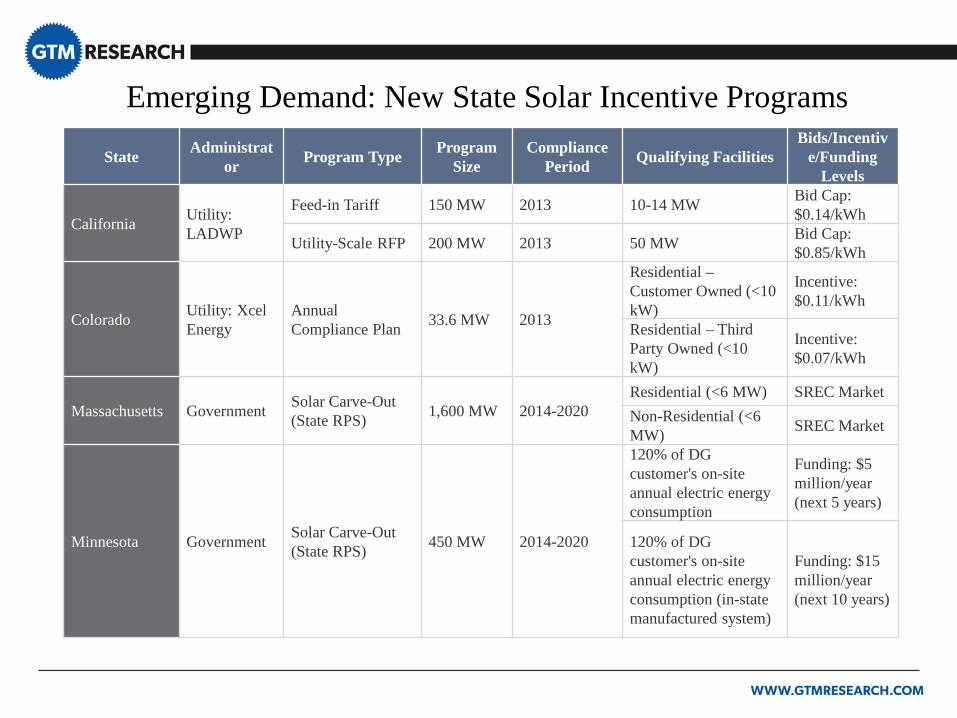
Emerging Demand: New State Solar Incentive Programs
State Administrator Program Type Program
Size Compliance
Period Qualifying Facilities Bids/Incentiv
e/Funding Levels
California Utility: LADWP
Feed-in Tariff 150 MW 2013 10-14 MW Bid Cap: $0.14/kWh
Utility-Scale RFP 200 MW 2013 50 MW Bid Cap: $0.85/kWh
Colorado Utility: Xcel Energy
Annual Compliance Plan 33.6 MW 2013
Residential – Customer Owned (<10 kW)
Incentive: $0.11/kWh
Residential – Third Party Owned (<10 kW)
Incentive: $0.07/kWh
Massachusetts Government Solar Carve-Out (State RPS) 1,600 MW 2014-2020
Residential (<6 MW) SREC Market Non-Residential (<6 MW) SREC Market
Minnesota Government Solar Carve-Out (State RPS) 450 MW 2014-2020
120% of DG customer's on-site annual electric energy consumption
Funding: $5 million/year (next 5 years)
120% of DG customer's on-site annual electric energy consumption (in-state manufactured system)
Funding: $15 million/year (next 10 years)
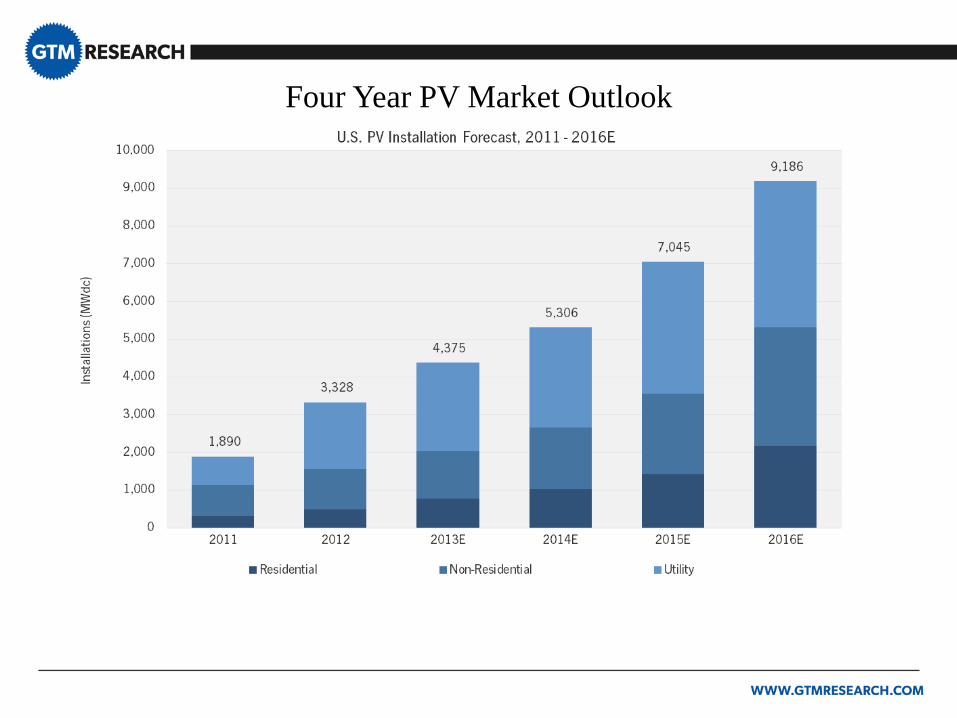
Four Year PV Market Outlook
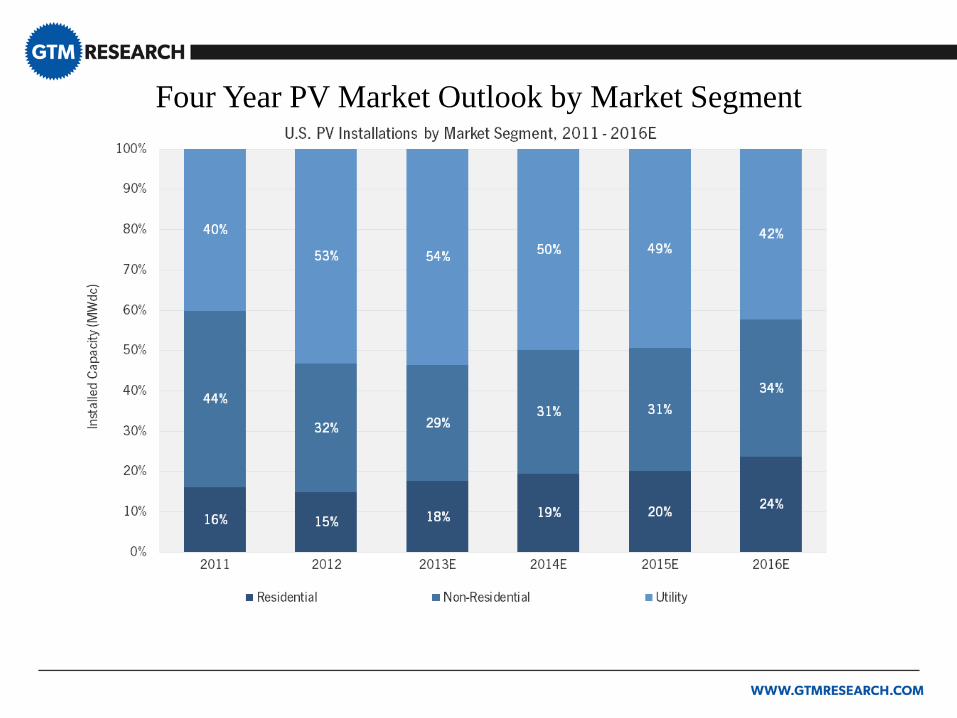
Four Year PV Market Outlook by Market Segment
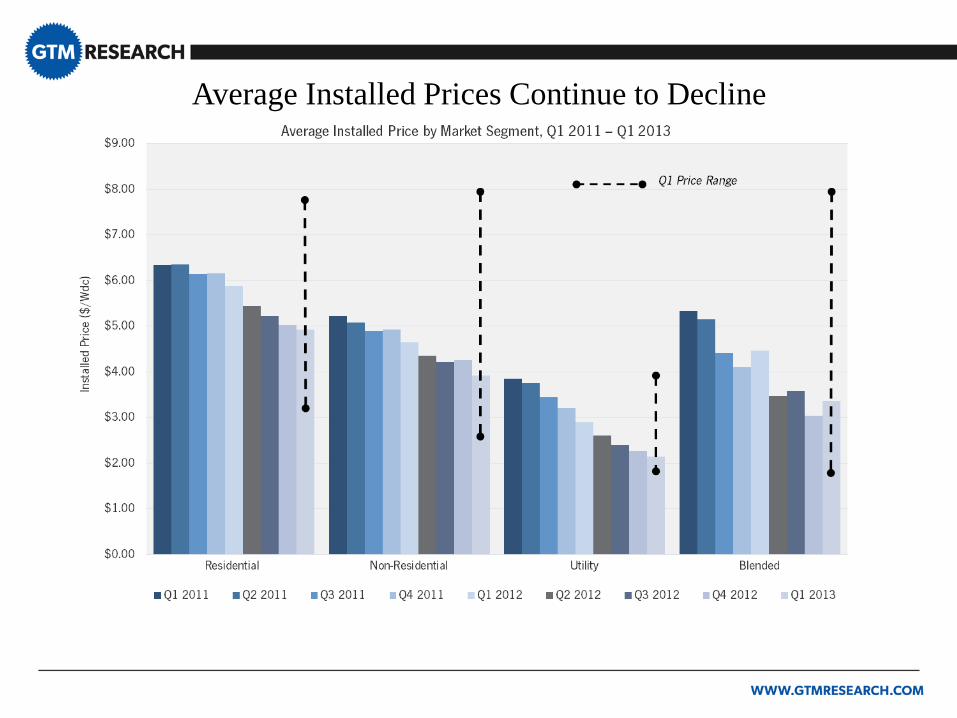
Average Installed Prices Continue to Decline
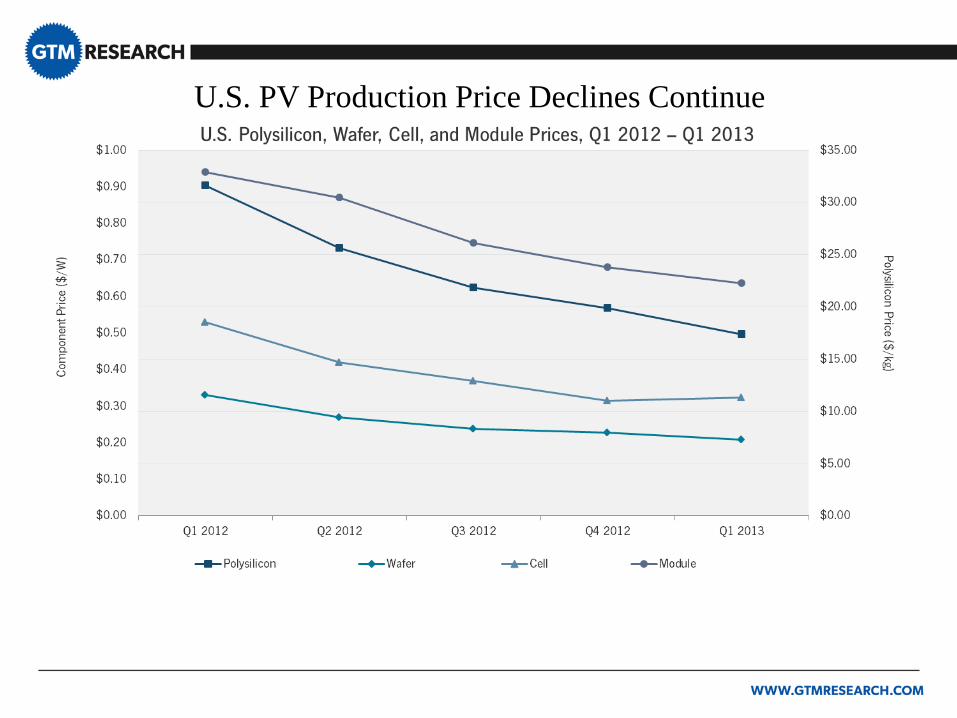
U.S. PV Production Price Declines Continue
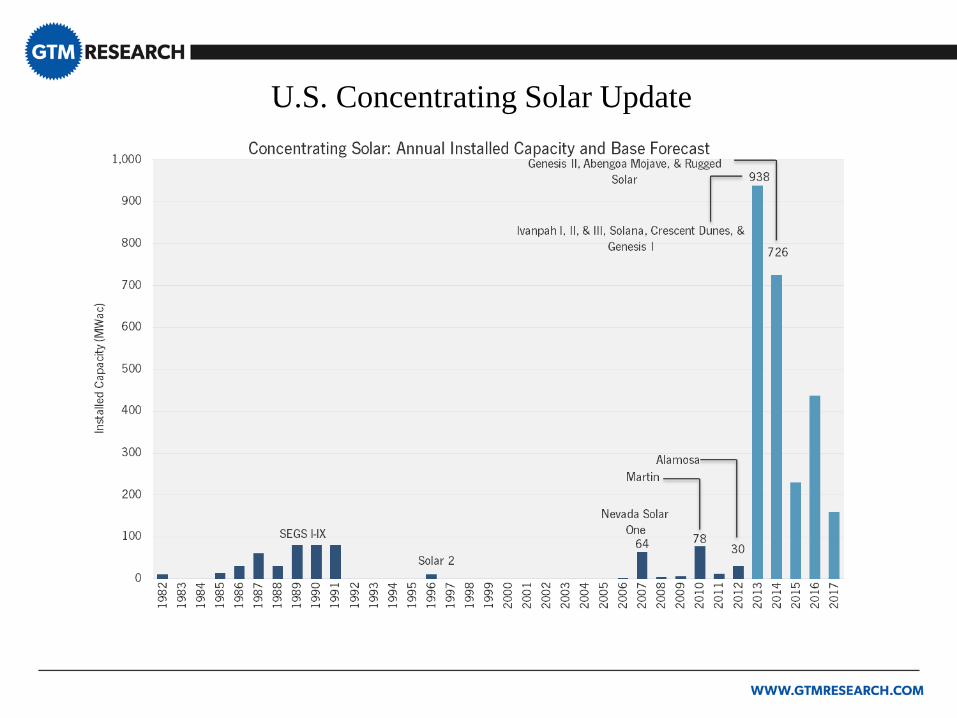
U.S. Concentrating Solar Update
Thank You & Contact Info
Justin Baca, Director of Research Will Lent, Research and Policy Analyst
Contact: [email protected]
Andrew Krulewitz, Solar Analyst Cory Honeyman, Solar Analyst Contact: [email protected]
For more information about purchasing the full SEIA/GTM Research U.S. Solar Market Insight Q1 2013™ report, please visit www.gtmresearch.com/ussmi or email Justin Freedman ([email protected])