will natural gas prices decouple from oil prices …will natural gas prices decouple from oil prices...
TRANSCRIPT

Will Natural Gas Prices Decouple from Oil Prices across the Pond?
Reinout De Bock and José Gijón
WP/11/143

© 2011 International Monetary Fund WP/11/143
IMF Working Paper
Middle East and Central Asia
Will Natural Gas Prices Decouple from Oil Prices across the Pond?1
Prepared by Reinout De Bock and José Gijón
Authorized for distribution by Joël Toujas-Bernaté
June 2011
Abstract
We show that US natural gas prices have decoupled from oil prices following substantial institutional and technological changes. We then examine how this interrelationship has evolved in Europe using data for Algeria, one of Europe’s key gas suppliers. Taking into account total gas exports and cyclical conditions in partner countries, we find that gas prices remain linked to oil prices, though the nexus has loosened. Both high oil prices and a modest industrial recovery in partner countries have kept gas exports at low levels in recent years, suggesting changing market forces. The paper then shows how such shifts can have important macroeconomic implications for a big gas exporter such as Algeria.
JEL Classification Numbers: C32, E31, F37, F41, Q43
Keywords: Natural gas; Commodity prices; Gas exporters; Energy economics; Algeria; Oil; Vector autoregressions
Author’s E-Mail Address: [email protected]; [email protected]
1We are grateful to Francesca Castelli, Reda Cherif, Joël Toujas-Bernaté and seminar participants at the Middle East and Central Asia department for very helpful comments. We also thank our counterparties at the Central Bank of Algeria for the many discussions and help with data. All errors are the sole responsibility of the authors.
This Working Paper should not be reported as representing the views of the IMF.
The views expressed in this Working Paper are those of the author(s) and do not necessarily represent those of the IMF or IMF policy. Working Papers describe research in progress by the author(s) and are published to elicit comments and to further debate.

2
Contents Page I. Introduction ........................................................................................................................... 3
II. Global Increase in Production and Producers ...................................................................... 5
III. Gas versus Oil prices in the US .......................................................................................... 6
A. A Loosening Link ............................................................................................................ 6
B. Econometric Model .......................................................................................................... 7
C. Spillover of Oil Price Shock on Gas Price ....................................................................... 8
D. Spillover of Gas Price Shock on Oil Price ..................................................................... 10
IV. The European Market from Algeria’s Perspective ........................................................... 10
A. Contracted and Spot Gas Prices versus Brent Oil .......................................................... 10
B. Composition and Destination ......................................................................................... 11
C. Cyclical Links with Gas Buyers ..................................................................................... 12
D. Econometric Analysis .................................................................................................... 13
E. Co-integrating Relationship for Gas Exports ................................................................. 15
F. Subsample Analysis ........................................................................................................ 15
V. Macroeconomic Implications under Different Scenarios .................................................. 17
VI. Conclusion and Policy Implications ................................................................................. 19
References ............................................................................................................................... 21
Figure 1. Algerian Gas Export Volumes and Prices 2000-10 ................................................... 4 Figure 2. Global Gas Production 1990-2009 ............................................................................ 5 Figure 3. US Oil and Gas Prices 1990-2010 ............................................................................. 6 Figure 4. US Oil and Gas Prices 1990-2010 (Energy Equivalent) ........................................... 7
Figure 5. IRF of US Gas Price after an Oil Price Shock........................................................... 8
Figure 6. Variance Decompositions of US Gas Prices ............................................................ 9
Figure 7. IRF of US Oil Price after a Gas Price Shock ........................................................... 10 Figure 8. Oil and Gas prices in Algeria 2000-10 .................................................................... 11 Figure 9. Share and Composition of Gas Exports................................................................... 11
Figure 10. Algeria's Natural Gas Export Markets, 2001-09 ................................................... 12 Figure 11. Algeria's Exports and Industrial Production of Gas Buyers, 2001-10 .................. 12 Figure 12 Over-contracted gas buyers in 2010 ....................................................................... 13
Figure 13. IRF of Export Volumes after a shock to Oil Price and Industrial Production .. 14
Figure 14. IRF Algerian Gas Prices after a shock to Oil Price and Industrial Production 14
Figure 15. Variance Decompositions of Algeria’s Gas Exports and Prices ........................ 15
Figure 16. Accumulated IRF of Algerian Gas Exports to Oil Price and IP Shocks ............. 16
Figure 17. Subsample Variance Decomposition of Algeria’s Gas Exports ......................... 16
Figure 18. Accumulated IRF of Algerian Gas Price to Oil Price and IP Shocks .................. 16
Figure 19. Subsample FEV Decomposition of gas prices .................................................... 17 Figure 20. Algeria’s economic indicators under the baseline and alternative scenarios ........ 19

3
I. INTRODUCTION
Recent developments in regional gas markets across the world point to important structural changes. In 2009, the United States (US), one of the world’s top producers and the largest producer of non-conventional gas, became self-sufficient in terms of natural gas needs largely on the back of a sharp increase in non-conventional gas production. In the last two decades unconventional US production has more than quadrupled, currently amounting to about half of US production. Moreover, the growing trade of liquefied natural gas (LNG), market liberalization in several countries, changes in the supply chain and falling transportation costs, have eroded barriers between regionally segmented markets in the largest gas consuming markets (Asia, Europe, and North America).2 In select markets with growing numbers of non-utility gas purchasers (US and Europe), spot gas price indexation has appeared as an alternative to traditional pricing based on long-term and oil-price indexed contracts. Finally, new emerging markets have increased global supply and eroded the market share of traditional gas producers.
Using Structural Vector Autoregressions (SVAR), we find evidence of a looser link between oil and gas prices in the US since the mid 2000s. 3 Historically US gas prices have been indexed to spot oil prices but industry and media reports have interpreted the recent underperformance of gas prices versus oil prices in North American gas markets as an indication of an important structural shift. Our econometric work shows that oil price shocks still have a positive and significant effect on gas prices since 2005, but the response became less long-lived. Forecast error variance (FEV) decompositions also hint at a less important role for oil prices shocks as a driving force for gas prices. Oil price shocks do not longer dominate the FEV of gas prices.
Turning to Europe, the 2009 recession depressed gas demand at levels of 2004, the steepest contraction since 1970. Demand did not recover to pre-crisis levels in 2010 despite an unusually cold winter, leaving major gas buyers in Europe over-contracted in volume terms.4 Downward pressure on spot natural gas prices at European interconnection hubs reflected a combination of weak fundamentals such as low demand, high inventories, excess capacity and competition from other energy sources. However, the indexation of contracted gas prices to spot oil prices rather than spot gas prices remains a key feature of the European gas market, raising two related questions;
What has been the role of the weak economic recovery in reducing gas demand in Europe?
2 We refer to Neumann (2009) for a detailed discussion.
3 While correlations can be very indicative, SVARs have the additional advantage that they capture dynamic patterns present in the data and allow for a structural interpretation of shocks to a particular variable. Villar and Joutz (2006) and Brown and Yucel (2008) find a quantitative effect of changes in crude oil on natural gas prices. Both studies do not reproduce Impulse Response Functions or examine the effect of sample breaks in recent years. 4 See Barysch (2010) and Schels (2010).
4
Is it possible that the oil indexation of contracted gas prices made gas usage less competitive as oil prices recovered, putting some downward pressure on demand? If the second effect dominates, higher oil prices rather than a weak economic recovery are an important factor behind lower gas demand. Looking forward, the decoupling of gas prices from oil prices witnessed in the US could then take place in Europe as a changing buyer base puts pressure on suppliers to sell at prices reflecting total gas supply, new gas deregulation laws, environmental concerns and cost of other energy sources rather than the evolution of spot oil.
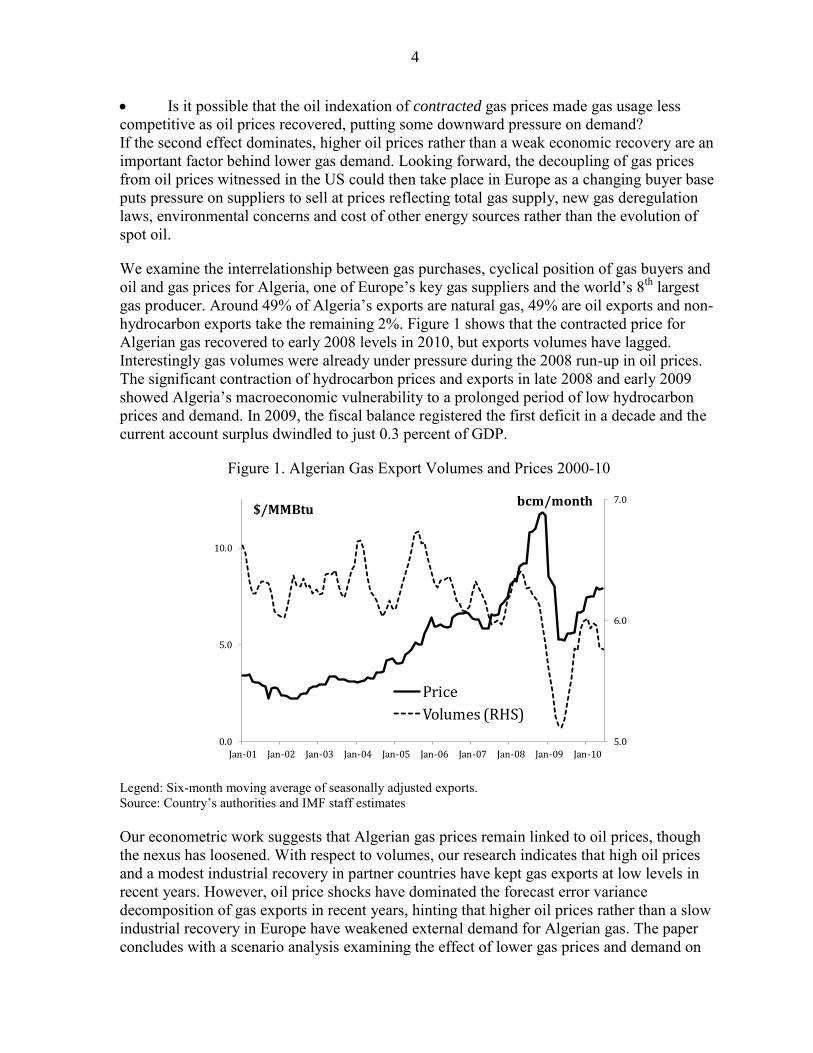
We examine the interrelationship between gas purchases, cyclical position of gas buyers and oil and gas prices for Algeria, one of Europe’s key gas suppliers and the world’s 8th largest gas producer. Around 49% of Algeria’s exports are natural gas, 49% are oil exports and non-hydrocarbon exports take the remaining 2%. Figure 1 shows that the contracted price for Algerian gas recovered to early 2008 levels in 2010, but exports volumes have lagged. Interestingly gas volumes were already under pressure during the 2008 run-up in oil prices. The significant contraction of hydrocarbon prices and exports in late 2008 and early 2009 showed Algeria’s macroeconomic vulnerability to a prolonged period of low hydrocarbon prices and demand. In 2009, the fiscal balance registered the first deficit in a decade and the current account surplus dwindled to just 0.3 percent of GDP.
Figure 1. Algerian Gas Export Volumes and Prices 2000-10
Legend: Six-month moving average of seasonally adjusted exports. Source: Country’s authorities and IMF staff estimates
Our econometric work suggests that Algerian gas prices remain linked to oil prices, though the nexus has loosened. With respect to volumes, our research indicates that high oil prices and a modest industrial recovery in partner countries have kept gas exports at low levels in recent years. However, oil price shocks have dominated the forecast error variance decomposition of gas exports in recent years, hinting that higher oil prices rather than a slow industrial recovery in Europe have weakened external demand for Algerian gas. The paper concludes with a scenario analysis examining the effect of lower gas prices and demand on
5.0
6.0
7.0
0.0
5.0
10.0
Jan-01 Jan-02 Jan-03 Jan-04 Jan-05 Jan-06 Jan-07 Jan-08 Jan-09 Jan-10
Price
Volumes (RHS)
$/MMBtubcm/month

5
Algeria’s external receipts and fiscal account. We show that a recovery encompassing higher oil prices but a modest recovery in gas prices and demand would have a sizable impact on Algeria’s fiscal and external balances.
The paper is organized as follows. Section II provides background information on the recent increase in global gas production. Section III analyses the evolution of oil versus gas prices in the US. Section IV examines the drivers of Algerian gas exports and prices before evaluating the macroeconomic implications of different scenarios for gas demand and prices in Section V. Section VI concludes.
II. GLOBAL INCREASE IN PRODUCTION AND PRODUCERS
Global gas output increased substantially in the past two decades (Figure 1). With the exception of 2009, production increased every year since 1990. Producers in emerging markets outside the former Soviet Union have driven the expansion of global gas production. These producers have doubled their share in global gas production from 19 percent in 1990 to 39 percent in 2009. European producers and non-EU OECD (mostly the US and Canada) have seen their share in total production decline.
Figure 2. Global Gas Production 1990-2009
Source: British Petroleum Statistical Review of World Energy, June 2010.
During the last five years, the share of non-EU OECD producers has recovered. The main reason is the production of significant amounts of non-conventional gas in the US. This gas is mostly produced from shale deposits, and its production has increased more than four fold since 1990. The production of shale gas started over 100 years ago but became economically profitable only in recent years. Higher natural gas prices and technological advances in drilling have led to increased investments in shale gas exploration. In turn, lower well risks pushed up production and profit margins. The economic success in North American shale gas
2.0
2.5
3.0
3.5
4.0
0
500
1,000
1,500
2,000
2,500
3,000
3,500
4,000
1990 1991 1992 1993 1994 1995 1996 1997 1998 1999 2000 2001 2002 2003 2004 2005 2006 2007 2008 2009
OECD
FSU
Other EM
Algeria
Algeria's share (%, RHS)
bcm/year

6
production has stimulated the exploration of shale gas in Europe (Austria, Germany, Hungary, Poland, Sweden, and the U.K), China, Canada, and India.5
Algeria’s gas production is stable but its share in global gas production has been on a downward trend since the early 2000s (Figure 2). Nonetheless Algeria remains the world’s 8th largest producer and is a key supplier for European gas markets. Natural gas represents nearly 49 percent of total exports, oil exports cover another 49 percent and non-hydrocarbon exports amount to less than 2 percent. Hydrocarbon exports are the key source of fiscal revenues and foreign exchange. The importance of natural gas for its economy has made Algeria an active player in the Gas Exporters Countries Forum (GECF) which attempts to create an OPEC-like organization for the gas market (MEES (2010)).
III. GAS VERSUS OIL PRICES IN THE US
A. A Loosening Link
The behavior of US gas prices relative to oil prices reflects the latest developments in energy markets. Figure 3 presents the US$ evolution of the US Wellhead gas price reported by the Energy Information Administration (EIA) versus the Western Texas Intermediate oil price (WTI). In general gas prices co-move strongly with oil prices. However, as oil prices recovered after the 2008 crisis, there has been a marked decoupling with gas prices.
Figure 3. US Oil and Gas Prices 1990-2010
Sources: EIA, Haver and IMF staff estimates.
Figure 4 presents the US$ evolution of the US Wellhead gas price reported by the Energy Information Administration (EIA) versus the Western Texas Intermediate oil price (WTI) in energy equivalent Million British Thermal Units (MMBTU).6 Oil prices doubled from $ 6.7
5 Chapter 11 of IEA (2009) provides further information on non-conventional gas production.
0
25
50
75
100
125
150
0
5
10
15
Jan-00 Jan-02 Jan-04 Jan-06 Jan-08 Jan-10
US Henry Hub US LNG M
Wellhead WTI (RHS)
$/MMBtu$/bbl

7
per MMBTU in February 2009 to $ 13.7 in August 2010. Wellhead gas prices, on the other hand, registered a more modest increase of 44 percent from $2.9 per MMBTU in September 2009 to $4.2 in August 2010.
Figure 4. US Oil and Gas Prices 1990-2010 (Energy Equivalent)
Sources: EIA, Haver and IMF staff estimates.
Additional supply of non-coventional gas, the weak economic recovery and high storage levels, are the main reasons behind the relative weakness of US gas prices. Pydrol and Baron (2003) also argue that direct fuel switching capabilities between natural gas and residential fuel have become relatively limited. Furthermore, the expansion of non-conventional gas production has cut almost all the needs of LNG imports. Some argue that it has also put downward pressure on gas prices in other regions (EIA (2009) and IEA (2010)), leaving Asia and Europe as key destinations for the growing supply of LNG. In the case of Europe, there is some evidence that pipeline suppliers such as Norway’s Statoil and Russia’s Gazprom have been forced to renegotiate contracts (Barysch (2010)).
B. Econometric Model
The impact of a change in the spot oil price (WTI) on gas prices can be statically examined with a Vector Auto-Regression (VAR). The variables included in the VAR are
ln( ),ln( ) '.t t tZ Wellhead WTI We cannot reject the hypothesis that this period’s value equals last period’s value plus a random error for both oil and gas prices. Each series could contain a so-called “unit root”. However, statistical tests indicate that a combination of the
6 The EIA’s wellhead price is the sales price obtainable from a third party in an arm’s length transaction. It pertains to all transactions occurring in the United States and covers purchase commitments of all durations.
0.0
5.0
10.0
15.0
20.0
25.0
Jan-90 Jan-92 Jan-94 Jan-96 Jan-98 Jan-00 Jan-02 Jan-04 Jan-06 Jan-08 Jan-10
Wellhead
WTI price
$/MMBTU

8
two series moves in tandem along a trend, i.e. they are co-integrated. The reduced-form VAR is then:
1, ( ') ,p
t j t j t t tjZ c Trend B Z u E u u V (1)
where c is a constant, Trend a time trend and tZ is the matrix with variables. The inverse of the Choleski factor of the variance-covariance matrix V can be used to identify structural shocks that are orthogonal to each other. Given the ordering of the variables in tZ this corresponds to the assumption that on impact an innovation in the spot oil price has a zero effect on gas prices. 7
C. Spillover of Oil Price Shock on Gas Price
To assess if there was a shift in the impact of oil prices on gas prices, we estimate the VAR for two sub-samples: (1) 1990m1-2004m12 and (2) 2005m1-2010m9.8 During the latter period there has been a steady increase in the production of non-conventional gas from shale formations. For the first period, the Impulse Response Function (IRF) to a one standard deviation perturbation in the orthogonal oil shock generates a persistent and long-lived response of gas prices (panel A of Figure 5). Panel B displays a less long-lived response in the latter period. The lower panels of the figure show the accumulated IRF. Table 1 prints the accumulated responses of both gas prices and oil prices shocks to an orthogonal oil shock. The responses are lower in the second period for both gas and oil prices, though confidence intervals are wide as shown in Figure 5.
Figure 5. IRF of US Gas Price after an Oil Price Shock
7 We get similar results if we order the variables differently.
8 The analyses for 1990-2004 and 2000-2004 show similar impulse response functions and forecast error variance decompositions.
-0.05
0
0.05
0.1
1 13 25 37
(A) Jan. 1990- Dec. 2004
-0.05
0
0.05
0.1
1 13 25 37
(B) Jan. 2005- Sept.2010

9
Legend: Standard error bands for the 95 percent confidence interval. Source: IMF staff estimates
Table 1. Accumulated Response of Gas and Oil Prices to a Structural Oil Shock
1990-2004 2004-2010
Months Gas price Oil price Gas price Oil price
6 23.4 51.1 23.9 54.6
12 53.4 83.5 49.0 71.0
24 79.6 110.2 52.5 71.5
36 87.1 117.8 52.3 71.4
48 89.2 120.0 52.3 71.4
Legend: Responses are in percent to a one standard deviation orthogonal oil price shock Forecast error variance (FEV) decompositions suggest that oil price shocks are becoming a less important driver of gas prices (Figure 6). In the earlier sample period, the FEV of natural gas prices at lower frequencies is primarily driven by oil prices (Panel A). In recent years own shocks have explained most of the FEV of gas prices (Panel B). The results are consistent with a weakening impact of spot oil prices on US natural gas prices.
Figure 6. Variance Decompositions of US Gas Prices
Legend: Standard error bands for the 95 percent confidence interval. Source: IMF staff estimates
-0.25
0
0.25
0.5
0.75
1
1.25
1.5
1.75
1 13 25 37
(C) Jan. 1990- Dec. 2004Accumulated IRF
-0.25
0
0.25
0.5
0.75
1
1.25
1.5
1.75
1 13 25 37
(D) Jan. 2005- Sept.2010Accumulated IRF
0.0
20.0
40.0
60.0
80.0
100.0
1 13 25 37
Wellhead WTI oil
(A:) Jan. 1990 Dec. 2004
0.0
20.0
40.0
60.0
80.0
100.0
1 13 25 37
Wellhead WTI oil
(B) Jan. 2005-Sept.2010

10
D. Spillover of Gas Price Shock on Oil Price
We also examine if the response of oil prices to an orthogonal gas shock has changed. To the extent that buyers can substitute, an excess supply of gas could push down oil prices as buyers switch to gas.9 For the earlier part of our sample, the IRF to a one standard deviation perturbation in the orthogonal gas shock does not generate a response on oil prices significantly different from zero (panel A of Figure 7). Panel B displays a more pronounced response in recent years, suggesting that low gas prices have exerted some downward pressure on oil prices. However, FEV decompositions indicate that gas price shocks have not been an important driver of oil prices thus far.
Figure 7. IRF of US Oil Price after a Gas Price Shock
Legend: Standard error bands for the 95 percent confidence interval. Source: IMF staff estimates
IV. THE EUROPEAN MARKET FROM ALGERIA’S PERSPECTIVE
A. Contracted and Spot Gas Prices versus Brent Oil
Compared to the US, Algeria’s gas prices have tracked spot oil prices more closely. Figure 8. Oil and Gas prices in Algeria 2000-10 shows that contracted export prices for Algerian gas and spot oil (Brent in US$ per MMBTU) co-move strongly, even in recent years. 10 Contrary to the US gas market there is no apparent decoupling between gas and oil prices. This is in line with anecdotic evidence that most of Algeria’s gas is purchased under oil-indexed contracts.
9 In addition, some of the shale formations also contain natural gas liquids so producers need to consider the evolution of gas versus oil prices.
10 Brent prices and the Algerian export oil price behave very similarly.
-0.05
0
0.05
0.1
1 13 25 37
(A) Jan. 1990- Dec. 2004
-0.05
0
0.05
0.1
1 13 25 37
(B) Jan. 2005- Sept.2010

11
Figure 8. Oil and Gas prices in Algeria 2000-10 (A) Contracted and Zeebrugge spot with Brent (B) In Energy Equivalent Terms
Source: Country’s authorities, Haver and IMF staff estimates
B. Composition and Destination
The recent recovery in Algerian gas prices has not been matched by volumes. Panel A of Figure 8 shows that annual production has remained more or less stable during the last decade but exports have been declining while domestic consumption is on the rise. In turn, panel B shows that neither type of gas exports (LNG or natural gas) has increased during the last decade and export volumes have decreased in the past years.
Figure 9. Share and Composition of Gas Exports
Sources: Country’s authorities and IMF staff estimates. While exports have declined in recent years, export markets have become more concentrated. The gazoducs linking Algeria with Spain and Italy have made these two countries the largest export destinations (Figure 10). The pipelines ensure very stable export destinations with long-term contracts indexed to oil prices and guaranteed minimum purchases. On the other hand LNG exports to the US and Belgium, which represented 10 percent of Algeria’s total
0
25
50
75
100
125
150
0
5
10
15
Jan-00 Jan-02 Jan-04 Jan-06 Jan-08 Jan-10
Algeria natgas
Zeebrugge
Brent (RHS)
$/MMBtu $/bbl
0.0
5.0
10.0
15.0
20.0
25.0
Jan-94 Jan-96 Jan-98 Jan-00 Jan-02 Jan-04 Jan-06 Jan-08 Jan-10
Natural gas average export price
Brent price
$/MMBTU
0.0
25.0
50.0
75.0
100.0
2001 2002 2003 2004 2005 2006 2007 2008 2009
(A) Algeria's natural gas production, 2001-09 (in billions of cm3)
Consumption Exports
0.0
1.0
2.0
3.0
4.0
5.0
6.0
7.0
Jan-01 Jan-02 Jan-03 Jan-04 Jan-05 Jan-06 Jan-07 Jan-08 Jan-09 Jan-10
(B) Algeria's monthly exports of gas Jan 2001-August 2010
( in billions cm3)
LNG Natural gas

12
gas exports in 2005, have stopped in the last years. In the case of the US, the lack of demand reflects higher non-conventional gas production.
Figure 10. Algeria's Natural Gas Export Markets, 2001-09
Sources: IEA and IMF staff estimates
C. Cyclical Links with Gas Buyers
Although long-term contracts and pipelines ensure stable export markets, Algerian gas export are dependent on cyclical conditions in its gas buyers. Figure 11 plots the 3-month moving average of Algeria’s natural gas exports and the buyers’ export-weighted average headline industrial production (IP). The crisis of 2008 and the collapse of industrial gas demand in Europe sharply reduced Algeria’s gas exports. Following an unusually cold winter in 2010, the modest industrial recovery, especially in Spain and Italy, has kept natural gas export at relatively low levels.
Figure 11. Algeria's Exports and Industrial Production of Gas Buyers, 2001-10
Legend: Industrial Production (IP) is 3-month Moving Average. Source: Country’s Authorities, Haver and IMF staff Estimates.
0%
25%
50%
75%
100%
2001 2002 2003 2004 2005 2006 2007 2008 2009
Belgium
US
UK
Turkey
Portugal
France
Spain
Italy
75.0
100.0
Jan-01 Jan-02 Jan-03 Jan-04 Jan-05 Jan-06 Jan-07 Jan-08 Jan-09 Jan-10
IP Importers (MA) Exports (MA)
Jan 2008 = 100

13
As pointed out in Schels (2010), another indication of the unexpected low demand for natural gas in Europe is that natural gas buyers purchased only the minimum volume required by long-term gas supply contracts. Figure 12 shows that Italy and Spain, Algeria’s two biggest gas buyers, were substantially over-contracted in 2010.
Figure 12 Over-contracted gas buyers in 2010
Source: WM, BofA Merrill Lynch Global Commodity Research and Schels (2010)
D. Econometric Analysis
This subsection uses a VAR to examine the interrelations between Algeria’s natural gas exports, prices, spot oil prices, and economic activity in partner countries. The monthly variables included in this multivariate VAR are (in natural logs over 2000m1-2010m8): ln( ),ln( / ),ln( / ),ln( ) '.Gas Gas US US
t t t t tZ Q P CPI Brent CPI IP (2)
The variable Gas
tQ is Algeria’s monthly volume exports, /Gas US
tP CPI is the real gas price (Algeria’s export price deflated by US CPI), / US
tBrent CPI the real oil price and tIP is export-weighted headline IP in Algeria’s gas buyers. As before, statistical tests fail to reject the hypothesis that these variables contain a unit root but indicate co-integration along a trend. The reduced-form VAR is:
1, ( ') ,p
t j t j t t tjZ c Trend B Z u E u u V (3)
where c is a constant, Trend a time trend and tZ is the matrix with variables. The inverse of the Choleski factor of the variance-covariance matrix V can be used to identify structural shocks that are orthogonal to each other.11
The IRFs in Figure 13 show that there is a positive short-run effect of oil prices on gas exports, which subsequently turns negative at lower frequencies. This suggests that high oil-
11 We get similar results if we order the variables differently.

14
indexed contract prices can depress demand and is in line with recent industry analyses of the European gas markets (Schels (2010)). One of the reasons is that oil-indexed gas prices make gas-intensive manufacturing less competitive. In addition, renewable energy and nuclear output offer reliable alternatives for gas-fired power generation. Following the recession and the subsequent recovery in spot oil prices, utilization rates in gas-fired power generation have remained low. On the other hand, there is a general positive effect of a pick-up in importers’ industrial production on Algerian gas exports (Panel B).
Figure 13. IRF of Export Volumes after a shock to Oil Price and Industrial Production
Legend: Standard error bands for the 95 percent confidence interval. Source: IMF staff estimates.
Turning to gas prices, we find that there is a positive effect of oil prices and IP in importing countries on natural gas prices (Figure 14). The response of contracted gas prices to spot oil is quantitatively similar to what we observed in the US.
Figure 14. IRF Algerian Gas Prices after a shock to Oil Price and Industrial Production
Legend: Standard error bands for the 95 percent confidence interval. Source: IMF staff estimates.
-0.015
-0.01
-0.005
0
0.005
0.01
0.015
0.02
1 13 25 37
(A) Oil price shock
-0.015
-0.01
-0.005
0
0.005
0.01
0.015
0.02
1 13 25 37
(B) IP shock
-0.05
0
0.05
0.1
1 13 25 37
(A)Oil price shock
-0.05
0
0.05
0.1
1 13 25 37
(B) IP shock

15
The FEV analysis also indicates that the level of oil prices matters for gas export volumes though own shocks dominate (Figure 15). In the case of gas prices, Panel B shows that oil price shocks explain most of the FEV of gas prices at frequencies lower than six months.
Figure 15. Variance Decompositions of Algeria’s Gas Exports and Prices
Source: IMF staff estimates.
E. Co-integrating Relationship for Gas Exports
We also imposed a co-integrating relationship on the VAR. The co-integrated vector leads to the following relationship between gas exports, gas prices, oil prices and industrial production in export markets (t-stats between parentheses):
(8.27) (8.86) (3.26)
ln( ) 4.23 1.09ln( / ) 1.03ln( / ) 0.63ln( )Gas Gas US US
t tQ P CPI Brent CPI IP
(4)
In line with the IRF analysis, there is a positive link between export volumes and real gas prices whereas higher oil prices tend to depress gas demand in the long run and growth in industrial production tends to boost it. All coefficients are significantly different from zero.
F. Subsample Analysis
We carry out two subsamples estimates for (1) 2000m1- 2004m12 and (2) 2005m1- 2010m8. The subsample analysis hints at a changing role for oil prices and IP as drivers for Algerian gas demand. Figure 16 shows that the negative effect of oil prices on gas exports at certain frequencies only arises in the second sub-sample. IP has a positive effect in both subsamples. The FEV decompositions in Figure 17 show that at lower frequencies oil price shocks explain most of the FEV of gas exports in the later period.
0.0
20.0
40.0
60.0
80.0
100.0
1 13 25 37
(A) Gas exports
Exports Gas price Oil price IP
0.0
20.0
40.0
60.0
80.0
100.0
1 13 25 37
Exports Gas price Oil price IP
(B) Gas Price

16
Figure 16. Accumulated IRF of Algerian Gas Exports to Oil Price and IP Shocks
Source: IMF staff estimates.
Figure 17. Subsample Variance Decomposition of Algeria’s Gas Exports
Source: IMF Staff Estimates
The positive effects of oil price shocks on gas prices became less long-lived in Algeria (accumulated IRFs in Figure 18). However, the FEVs in Figure 19 show that, in contrast to the US, oil price shocks still dominate.
Figure 18. Accumulated IRF of Algerian Gas Price to Oil Price and IP Shocks
Source: IMF staff estimates
-0.015
-0.01
-0.005
0
0.005
0.01
0.015
0.02
0.025
0.03
0.035
1 13 25 37
(A) Oil price2005-2010
2000-2004
0
0.005
0.01
0.015
0.02
0.025
1 13 25 37
(B) IP 2005-2010
2000-2004
0.0
20.0
40.0
60.0
80.0
100.0
1 13 25 37
(A) Jan. 2000-Dec. 2004
Exports Gas price Oil price IP
0.0
20.0
40.0
60.0
80.0
100.0
1 13 25 37
(B) Jan. 2005-August 2010
Exports Gas price Oil price IP
-0.1
0
0.1
0.2
0.3
0.4
0.5
0.6
1 13 25 37
(A) Oil price
2005-2010
2000-2004
-0.1
0
0.1
0.2
0.3
0.4
0.5
0.6
1 13 25 37
(B) IP
2005-2010
2000-2004

17
Figure 19. Subsample FEV Decomposition of gas prices
Source: IMF staff estimates.
V. MACROECONOMIC IMPLICATIONS UNDER DIFFERENT SCENARIOS
The previous section examined the interrelationships between Algerian gas demand, gas prices, spot oil prices and industrial production in gas buyers. The link between the prices for Algerian gas and spot oil remains strong even after the global crisis of 2008 and the increase in production of non-conventional gas in North America. However, some of the evidence hints at a slower recovery in gas prices for Algeria. Efforts to turn the Gas Exporters Countries Forum (GECF) into an OPEC for natural gas, are another indication of this potential trend. Moreover, in the case of Algeria the threat of lower gas prices is coupled with declining export volumes and growing domestic demand, making the issue all the more pressing for Algerian authorities.
To assess the potential impact of a fall in natural gas exports and prices, we evaluate a medium-term macroeconomic scenario which assumes that gas prices would fall to US levels and export volumes would decline. This scenario could be overly pessimistic due to the current long-term structure of Algerian gas contracts and the hitherto absence of substantial non-conventional gas production in Europe. However, it offers a good illustration of what could happen if non-conventional gas production would take off in Europe and across the world in five to ten years.
Figure 20 presents the current scenario together with two alternative scenarios. The first alternative scenario assumes an average gas price kept real at current US levels (the 2010 nominal price increasing with inflation in advanced economies) and constant export volumes. The second alternative scenario makes the same price assumption but incorporates an annual fall in natural gas export volumes of 5 percent per year.12 The data show an important 12 A 5 percent fall corresponds to a scenario where a boom of non-conventional gas production in Europe or a glut in global LNG supply entails a gradual fall of Algerian gas exports. We do not expect this to occur in the next five years but we wish to examine the macroeconomic impact using the current medium term
(continued…)
0.0
20.0
40.0
60.0
80.0
100.0
1 13 25 37
Exports Gas price Oil price IP
(A) Jan. 2000- Dec. 2004
0
20
40
60
80
100
1 13 25 37
Exports Gas price Oil price IP
(B) Jan. 2005-August 2010

18
deterioration of the fiscal balance (-0.9 of GDP and -2.0 of GDP in alternative scenarios 1 and 2 versus 3.2 of GDP in the base scenario in 2015), the current account (2.5 of GDP and 4.0 of GDP in alternative scenarios 1 and 2 versus 10.1 of GDP in the base scenario in 2015), the oil stabilization fund (Fonds de Regulation de Recettes, FRR) (11.4 of GDP and 14.5 of GDP in alternative scenarios 1 and 2 versus 30.1 of GDP in the base scenario in 2015) and international reserves (182 billion US$ and 191billion US$ in alternative scenarios 1 and 2 versus 247 billion US$ in the base scenario in 2015).
Table 2. Current Assumptions and alternative scenarios for Algeria’s gas prices
macroeconomic assumptions. That said, despite increasing capacity Algeria’s average gas exports have been declining in the past years (by 6 percent with respect to 2000 levels).
Current assumptions 2009 2010 2011 2012 2013 2014 2015
International oil price (US$/bbl) 61.8 79.0 94.8 96.3 95.8 95.8 96.0
Gas price for Algeria's exports (US$/MMBTU) 6.6 7.9 9.6 9.8 9.7 9.7 9.7
Algeria's exports in volume (billion of cm3) 53.7 53.8 53.8 53.8 53.8 53.8 53.9
Alternative scenario 1: fall in prices and volumes constant 2009 2010 2011 2012 2013 2014 2015
International oil price (US$/bbl) 61.8 79.0 94.8 96.3 95.8 95.8 96.0
Gas price for Algeria's exports (US$/MMBTU) 6.6 7.9 4.4 4.5 4.5 4.6 4.7
Algeria's exports in volume (billion of cm3) 53.7 53.8 53.8 53.8 53.8 53.8 53.9
Alternative scenario 2: fall in prices and 5 percent fall in volumes 2009 2010 2011 2012 2013 2014 2015
International oil price (US$/bbl) 61.8 79.0 94.8 96.3 95.8 95.8 96.0
Gas price for Algeria's exports (US$/MMBTU) 6.6 7.9 4.4 4.5 4.5 4.6 4.7
Algeria's exports in volume (billion of cm3) 53.7 53.8 51.1 48.5 46.1 43.8 41.6

19
Figure 20. Algeria’s economic indicators under the baseline and alternative scenarios
Source: IMF staff estimates.
VI. CONCLUSION AND POLICY IMPLICATIONS
This paper assesses recent developments in natural gas markets. Econometric analysis shows that the tight link between US gas and spot oil prices has weakened. This decoupling coincided with a significant increase in the production of non-conventional gas (especially shale gas) in the US. The additional supply has discontinued plans for sizable LNG imports into the US, and some even suggest that the US could turn into a significant gas exporter. Conversely, the impact of spot oil prices on Algeria’s contracted gas price remains strong but export volumes are under pressure. Oil prices and industrial activity have a significant and important impact on Algerian natural gas prices. Although long-term contracts and pipelines to main markets ensure demand stability, recent developments in international gas markets and a slow recovery in partner countries has led to declining export volumes.
-9.0
-7.0
-5.0
-3.0
-1.0
1.0
3.0
5.0
2009 2010 2011 2012 2013 2014 2015
Fiscal deficit(in percent of GDP)
Alternative scenario 2
Alternative scenario 1
Current projections
0.0
5.0
10.0
15.0
2009 2010 2011 2012 2013 2014 2015
Current account(in percent of GDP)
20.0
25.0
30.0
35.0
40.0
45.0
50.0
2009 2010 2011 2012 2013 2014 2015
FRR (in percent of GDP)
100.0
150.0
200.0
250.0
300.0
350.0
2009 2010 2011 2012 2013 2014 2015
International Reserves(in billion US$)

20
Even with a continued recovery of oil prices, Algerian gas priced at US levels and tepid demand would have a sizable effect on Algeria’s economy. A medium-term scenario analysis assumes an increase in non-conventional gas production on the European continent or a global glut in LNG supply. Under this constellation, natural gas prices are kept constant in real terms at current US prices and exports fall by 5 percent per year. Our current assumptions imply a significant negative impact on Algeria’s macroeconomic balances. The recent turmoil in the Middle East underscores the relevance of this type of analysis. The spot price for natural gas at the Zeebrugge hub fell ten percent in the first quarter of 2011, whereas the Brent oil price moved up sharply as markets priced in the Libyan oil supply disruption.
The development of alternative gas production in Europe is not imminent and would take five to ten years. However, the recent European legislation to liberalize the gas market and the current political unrest in North Africa and the Middle East could bring a boost to recent efforts to develop a European shale gas industry. Aside from economic viability, policymakers also have to take environmental concerns into consideration, such as the effects on local drinking water and carbon emissions of a significant move towards shale gas. For countries with a significant share of natural gas exports, this paper shows the dangers of relying on a limited basket of exports and the importance of a diversified tradable sector.

21
REFERENCES
Barysch, Katinka (2010), “Shale gas and EU energy security” Center for European Reform http://centreforeuropeanreform.blogspot.com/2010/06/shale-gas-and-eu-energy-security.html British Petroleum (2009), Statistical Review of World Energy, June 2009. British Petroleum (2010), Statistical Review of World Energy, June 2010. Brown, Stephen and Mine Yucel (2008), “What drives natural gas prices”, The Energy
Journal, Vol 29(2), pp 45-60. Energy Information Administration (EIA) (2009), International Energy Outlook, 2009. International Energy Agency (IEA) (2009), World Energy Outlook, Energy Information Administration. International Energy Agency (IEA) (2010), World Energy Outlook, Energy Information Administration, November 2010. International Energy Agency (IEA) (2010), “Presentation to the CSIS on Medium term oil and gas markets” http://www.iea.org/\speech\2010\Cronshaw_MTOGM_CSIS.pdf MIT Energy Initiative (2010), “The future of natural gas: an interdisciplinary MIT study” MIT Energy Initiative, Massachusetts institute of technology, 2010. http://web.mit.edu/press/2010/natural-gas MEES (2010), “Algeria to push for gas output cut”, Middle East Economic Survey, Vol LIII (12), pp 1-2. Neumann, Anne (2009), “Linking Natural Gas Markets – Is LNG doing its job?”, The Energy
Journal, Vol 30 (special I), pp 187-200. Pydrol, John and Bob Baron (2003), “Fuel switching potential of electric generators; a case study”, Energy Modeling Forum Working Paper 20.3, Stanford University. Schels, Sabine et al. (2010), “High oil prices squeezing European gas buyers”, Global
Energy Weekly, 8 October 2010, Bank of America, Merrill Lynch. Villar, Jose, and Frederick Joutz (2006), “The relationship between crude oil and natural gas prices”, Energy Information Administration, Office of Oil and Gas, October 2006.