will they answer the phone if they know it’s will they answer the phone if they know it’s us?...
TRANSCRIPT

United States
Department of
Agriculture
National
Agricultural
Statistics
Service
Research and
Development Division
Washington DC 20250
RDD Research Report
Number RDD-13-01
August 2013
Will They Answer the
Phone if They Know It’s
Us? Using Caller ID to
Improve Response Rates
Heather Ridolfo
Jeff Boone
Nancy Dickey
This report has been prepared for limited distribution to the research community outside the U.S.
Department of Agriculture (USDA). The views expressed herein are not necessarily those of NASS or
USDA.

i
EXECUTIVE SUMMARY
Survey response rates for telephone surveys have been declining over the last several decades.
Two leading sources of nonresponse are refusals and inaccessibles. While the amount each factor
contributes to nonrepsonse can vary across surveys, refusals often account for a larger portion of
nonresponse. At the National Agricultural Statistics Service (NASS), refusal and inaccessible
rates have steadily increased over time, although refusal rates tend to be higher than inaccessible
rates. However, a different trend has emerged for the Quarterly Agriculture Survey (QAS).
Refusal rates increased steadily from 1991-2001, after which they began to decline. During this
same time period inaccessible rates increased and in 2008 surpassed refusal rates. Two factors
occurred during this time period that may have caused inaccessible rates to rise. First, there was
rapid rise in the availability of call screening technology. Respondents, who are increasingly
burdened with surveys and telemarketer calls, may be using this technology to screen their phone
calls. Second, NASS moved toward centralized data collection. As a result, respondents for the
QAS were more likely to be called from NASS’ National Operations Center (NOC) in St. Louis
rather than state field offices. Calls placed from the NOC display a Missouri (MO) telephone
number with the identifier “Ag Counts” or some other text such as “unknown number” on
respondents’ caller ID, which may influence their decision to answer the phone. In this study, we
examined whether calling respondents using in-state area codes and recognizable identifiers
improved the number of answered calls and whether it improved response rates for the
September and December 2012 QAS.
The first of two experiments was conducted on the September 2012 QAS. In this experiment half
of the Nebraska (NE) sample assigned to the NOC was called using an in-state NE area code and
half of the sample was called using an out-of-state MO area code. Using an in-state area code
(NE) did not improve the response rate for this survey in September.
The second experiment was conducted on the December 2012 QAS. Two states were selected for
this experiment – Ohio (OH) and Minnesota (MN) – in order to attain a larger sample size. In
both states, half of the sample assigned to the NOC was called using an in-state area code and
half was called using an out-of-state MO area code. Calling respondents using an in-state area
code led to a small, but significant improvement in answered calls. However, respondents who
were contacted using an in-state area code were more likely to refuse to participate in the survey
than those called using an out-of-state MO area code. Respondents in this experiment were also
surveyed on their use of caller ID. Approximately 1/3 of the sample had caller ID and reported
looking at it before answering our call. Respondents reported seeing a variety of information
displayed on their caller ID, and 49 percent of these respondents indicated that the information
displayed on their caller ID influenced their decision to answer the call. These respondents
indicated that they were more willing to answer the phone when the call was identified as
coming from an in-state area code (MN/OH), Ag Counts, or USDA, and less willing to answer
ii
the call when the call was identified as an unknown listing. Overall respondents preferred the use
of “USDA” to identify our calls over other identifiers.

iii
RECOMMENDATIONS
1. To improve response rates, it is not necessary to contact respondents using in-state area
codes.
2. Use a recognizable identifier, such as “USDA” when contacting respondents.
3. Explore alternative ways to improve response rates.

iv
TABLE OF CONTENTS
1. INTRODUCTION ...............................................................................................................1
2. EXPERIMENT 1 .................................................................................................................4
2.1 Method .....................................................................................................................4
2.2 Results ......................................................................................................................5
3. EXPERIMENT 2 .................................................................................................................9
3.1 Method .....................................................................................................................9
3.2 Results ....................................................................................................................10
3.3 Caller ID Questions................................................................................................14
4. DISCUSSION ......................................................................................................................18
4.1 Limitations .............................................................................................................18
4.2 Implications............................................................................................................19
5. RECOMMENDATIONS .....................................................................................................20
6. REFERENCES ....................................................................................................................21
APPENDIX A: September QAS Enumerator Debriefing .......................................................23
APPENDIX B: Caller ID Use Questions .................................................................................24
APPENDIX C: December QAS Enumerator Debriefing ........................................................26

1
Will They Answer the Phone If They Know It’s Us?
Using Caller ID to Improve Response Rates
Heather Ridolfo1
Jeff Boone2
Nancy Dickey1
Abstract
Survey response rates have been declining over the last several decades. In terms of telephone
surveys, this decline is often attributed to the wide availability of call screening technologies and
respondents’ reluctance to answer calls from unknown numbers. This has led some to posit that
calling respondents from local area codes (or familiar area codes) and using identifiers that are
both recognizable and trustworthy may improve survey response rates. In fact, anecdotal
evidence within our own agency has suggested that this may be the case; however, research
outside of our agency has produced mixed findings in regards to these claims. At the National
Agricultural Statistics Service, we conducted a series of experiments to determine if the
information presented on caller ID would influence response rates. Specifically, we examined
whether calling respondents using in-state area codes rather than out-of-state area codes and
different identifiers (i.e., USDA versus Ag Counts) improved response rates. In addition, we
surveyed respondents regarding their use of caller ID and its influence on their decision to
answer our call. In this report, we discuss the findings from this study and their implications.
Key Words: QAS, Nonresponse, Caller ID
1. INTRODUCTION
Survey response rates for telephone surveys have declined over the last couple of decades
(Tourangeau 2004; Curtin, Presser and Singer 2005; Brick and Williams 2013). While declines
in response rates may not always impact response bias, it can increase the cost of survey
production due to additional calls that must be placed until a response is attained (Tourangeau
2004; Curtin, Presser and Singer 2005; Callegaro, McCutcheon, and Ludwig 2006) and therefore
is worthy of examining. The two leading sources of nonresponse are refusals to participate in
surveys and noncontacts (or inaccessibles) (Groves and Couper 1998). The amount of
nonresponse attributable to these two factors varies across surveys. For example, Curtin and
colleagues (2005) found refusals and inaccessibles accounted for almost equal amounts of
nonresponse to the Survey of Consumer Attitudes for the years 1996-2004; however,
inaccessible rates increased at a slower rate in comparison to refusals over this time period.
Conversely, in their examination of the National Health Interview Survey and the National
Household Education Survey during a similar time period (1996-2007), Brick and Williams
(2013) found refusals accounted for a much larger percentage of nonresponse than inaccessibles.
At the National Agricultural Statistics Service (NASS), refusal and inaccessible rates for our
1 Heather Ridolfo and Nancy Dickey are Survey Statisticians at the National Agricultural Statistics Service,
Research and Development Division, 3251 Old Lee Highway, Room 305, Fairfax, VA 22030. 2Jeff Boone was a
Survey Statistician at the National Agricultural Statistics Service. The authors would like to thank Jeff Stone,
Vernisha Bethea, Vito Wagner, Judy Hawkins, and Marisa Reuber for their help with this project.

2
surveys have steadily increased over time, although refusal rates tend to be higher than
inaccessible rates. However, an interesting trend in nonresponse to the Quarterly Agriculture
Survey (QAS) has emerged in recent years. Refusal rates for this survey increased steadily from
1991-2001, after which they began to decline. During this same time period, inaccessible rates
increased as well and continued rising. In 2007, the two converged and in the following years,
inaccessible rates were slightly higher than refusals (See Figure 1).
Declining response rates may be attributed to a number of factors such as greater demand for
respondents due to increased telemarketing calls and survey research, the rise of technologies
that can be used to screen out unwanted calls (i.e., answering machines and caller identification
(ID)) (Tuckel & O’Neill 2001; Tourangeau 2004), and the decline in the number of landline
telephones (Blumberg and Luke 2013) coupled with cell phone respondents’ reluctance to incur
the cost of the call (Kempf and Remington 2007). Changes in the social climate over time, which
may impact trust in government and other survey organizations, may also contribute to the
decline in response rates. Brick and Williams (2013) examined the changes in the social climate
that could lead to lower community cohesiveness and their effects on survey response. They
found survey nonresponse rates to be negatively correlated with living in communities that had
greater concentrations of families with young children and positively correlated with living in
communities that had more single person households and longer average commute times.
However, they also found nonresponse to be negatively correlated with living in communities
with higher violent crime rates, which does not provide support for the argument that less
cohesive social climates contribute to lower response rates. Experimental research has found
minimal support for the relationship between changing attitudes toward privacy and
confidentiality within the general population and survey response rates (Singer and Presser
2008). Furthermore, as Brick and Williams (2013) point out, even if change in social climate was
a plausible explanation for increases in nonresponse, it still would not explain differences in
nonresponse rates for face-to-face and telephone surveys. It’s plausible that a number of the
factors cited above are contributing to the decline in response rates. In this study, we focus on the
relationship between call screening and response rates.
0
5
10
15
20
19
91
19
92
19
93
19
94
19
95
19
96
19
97
19
98
19
99
20
00
20
01
20
02
20
03
20
04
20
05
20
06
20
07
20
08
20
09
20
10
20
11
20
12
20
13
Figure 1. Nonresponse in the QAS: 1991-2013
Refusal Inaccessible
3
As discussed above, a number of surveys witnessed a notable decline in response rates from the
mid-1990s to the present. During this same time period, there was a rapid increase in the use of
call screening technologies in households (Tuckel & O’Neill 2001). If respondents are screening
calls, it may be beneficial to contact them using phone numbers and identifiers that are both
recognizable and trustworthy. Within NASS, anecdotal evidence suggests that this strategy may
be effective in increasing the number of contacts and response rates. For example, the Montana
data collection center (DCC) implemented the use of cell phones with Montana area codes to
conduct surveys in the various states they were assigned. This office was able to obtain
additional responses on these telephones which they attributed to the telephone number
displaying on respondents’ caller ID rather than the identifier which typically displayed on caller
ID for calls placed from their call center (i.e., “GSA”). The Wyoming DCC also implemented
the use of cell phones programmed with in-state area codes for the states they were assigned to
call, and perceived this to be an effective strategy in improving their response rates. However,
these DCCs did not empirically test the use of in-state area codes and only a limited number of
studies have been done outside of our agency to empirically test this relationship.
The small number of studies that have examined the relationship between caller ID and response
rates has not provided conclusive evidence. Some studies that examined the overall effect of
caller ID on response rates did not find strong support for this relationship (Link and Oldendick
1999; Baron and Khare 2007). Link and Oldendick (1999) surveyed respondents on whether or
not the information displayed on their caller ID influenced their decision to answer the call and
found that, for the majority of respondents, the information displayed had no effect. However,
when it did matter, respondents indicated that they were more hesitant to answer the phone when
the number displayed was an out of area number or the listing was unknown. Some survey
methodologists have posited that the identifier associated with the phone number that appears on
caller ID will affect response rates, rather than the phone number itself. To test this, Baron and
Khare (2007) conducted an experiment on the National Immunization Survey to see if
identifying the call as originating from “NORC U CHICAGO” versus a general identifier (i.e.,
Toll free number) had an effect on response rates. No difference in response rates was found for
these two identifiers. However, other studies found using trustworthy identifiers for outgoing
calls increased response rates (Callegaro, McCutcheon, and Ludwig 2006; Okon, Moore, and
Bates 2008). Okon, Moore, and Bates (2008) found programming calls placed from the Census
Bureau call center to be identified as “Census Bureau” rather than “unknown caller” somewhat
improved efficiency (number calls made) and response rates for their surveys. Gallup also
experimented with its outgoing identifier but found its effect on response rates to be mixed. For
studies on impatient and outpatient customer satisfaction, Gallup found using “Gallup” and
“Gallup Poll” on caller ID to identify their organization had a negative effect on response rates.
But for bank and discount store customer satisfaction surveys, it helped increase response rates
(Callegaro, McCutcheon, and Ludwig 2006).
Inconsistencies in the effect of caller ID on response rates across these studies may be
attributable to the survey organization and the type of respondents involved in these studies, as
well as the particular identifier used. For example, respondents familiarity with and trust in the
survey organization may influence whether or not they ultimately decide to answer a call
(Callegaro, McCutcheon, and Ludwig 2006). Not surprisingly, a study conducted at NASS found
respondents who hold negative views of our organization are less likely to respond to our

4
surveys (McCarthy, Johnson, and Ott 1999). In these cases, providing a recognizable identifier
when conducting telephone surveys may not improve response rates. The effect of caller ID on
response rates may also be influenced by characteristics of the respondents themselves. For
example, Tuckel and O’Neill (2001) found young adults, racial minorities, homemakers, those
who have never married, households with children, and those living in more urban areas are
more likely to use call screening methods than other groups of respondents. Similarly, Link and
Oldendick (1999) found young respondents, African American respondents, households with
young children and households with three or more adults are more likely to screen incoming
calls. Undercoverage of and lower response rates for farms operated by African Americans,
American Indians, and women have been found for NASS surveys and the Census of Agriculture
(The Council on Food, Agricultural and Resource Economics (C-FARE) 2007; National
Research Council 2008). In part, difficulty identifying these farms and persuading them to
participate in our surveys may be due to past events that led to distrust in our organization among
these demographic groups. As mentioned above, using recognizable identifiers alone may not
improve the accessibility and response rates for these groups of respondents.
In this report we focus on addressing the recent increase in inaccessible rates for the QAS. It is
plausible that increased respondent burden (due to our own surveys and outside survey
organization/telemarketing), recent organizational shifts within NASS2, and the rise in
technologies to screen unwanted calls are attributing to the rise in inaccessible rates for this
survey. We focus on one element that may reduce inaccessible rates: call screening via caller ID.
More specifically, we seek to answer two research questions: Are respondents more likely to
answer the phone if they are contacted using a telephone number with an in-state area code? Are
respondents more likely to participate in a survey if they are contacted using a telephone number
with an in-state area code?
2. EXPERIMENT 1
2.1 Method
In September 2012, we conducted a preliminary experiment, which examined the effect of caller
ID on response outcomes and completion rates. In total, 1,452 Nebraska (NE) records were
assigned to the National Operations Center (NOC) for the September QAS. This experiment
consisted of a simple between subjects design in which half of the Nebraska sample for the
September QAS assigned to the NOC was called using landline telephones that were
programmed to display an out-of-state Missouri (MO) area code on caller ID and the other half
of the sample was called using cell phones that were programmed to display an in-state NE area
code. There are currently three area codes in the state of NE. The area code 402, which covers
the largest portion of the sample and should be familiar to most residents of the state, was chosen
for this experiment. For both area code groups, the statement “Ag Counts” was also programmed
to display with the phone number. Twelve enumerators were randomly selected to call the NE
records. These enumerators were provided a landline telephone programmed with a MO area
code and a cell phone programmed with the NE 402 area code. Prior to calling respondents, the
2Due to a recent organizational shift at NASS, farmers and ranchers will increasingly be
contacted by enumerators using telephones numbers with out-of-state area codes.

5
enumerators checked the Blaise instrument to see which phone to use to call respondents.
Respondents who were called using cell phones were read a disclosure statement prior to data
collection, which indicated the security risks associated with collecting data via a cell phone and
were asked for their permission to be interviewed over the cell phone: “I am calling you on a cell
phone which may be less secure than a land line. Are you comfortable providing your data?” If
respondents refused to be interviewed over a cell phone, attempts were made to contact them
again using a landline telephone. After data collection, enumerators were surveyed regarding
their experiences and opinions regarding the use of cell phones and in-state area codes for this
survey. A copy of this questionnaire can be found in Appendix A. Calling for the experiment
took place between August 30, 2012 and September 12, 2012.3
2.2 Results
The NOC made a total of 2,884 attempts to reach 1,452 NE respondents. There was no
difference in the number of attempts (i.e. call attempts leading to busy signals, no answers,
contacts with person or answering machine) made for the two calling groups. On average, the
NOC attempted to contact respondents using an out-of-state MO area code 3.24 times, and using
an in-state NE area code 3.27 times.
Table 1 presents call outcomes by area code. No significant difference was found between the
two area code calling groups (X2 =5.001, df=5, p=.416).
Table 1. Call Outcomes by Area Code for NE September QAS (N=2,884)
Out-of-State Area Code (MO) In-State Area Code (NE)
Count Percent Count Percent
Started Interview1 442 32.57 465 30.45
No Answer 211 15.55 225 14.73
Busy 30 2.21 45 2.95
Answering Machine 485 35.74 581 38.05
Disconnected 1 0.07 0 0.00
Scheduled Appointment2 188 13.85 211 13.82
Total 1357 100.00 1527 100.00 1Started Interview = partial and complete interviews, refusals, and appointments made after
interviewer started the interview 2Scheduled Appointment = appointments scheduled prior to starting the interview
No significant difference was found between the two area code groups in terms of attempts that
led to an answered call (X2=1.441, df=1, p=.230). Out of the 1,357 attempts made to contact
respondents using an out-of-state MO area code, 46.50 percent were answered. Of the 1,527
attempts made to contact respondents using an in-state NE area code 44.27 percent were
answered (see Table 2).
3 Callouts began on September 12, 2012. Callouts refer to a period at the end of the calling period when states can
request records be returned to their offices for data collection. Respondents included in the callouts are not included
in the experiment analyses.
6
Table 2. Attempts Leading to an Answer by Area Code For NE September QAS (N=2,884)1
Out-of-State Area Code (MO) In-State Area Code (NE)
Count Percent Count Percent
Answer1 631 46.50 676 44.27
No Answer2
726 53.50 851 55.73
Total 1357 100.00 1527 100.00 1Answer = a call that yields an interview (partial or complete), a disconnect, or an appointment
2No Answer = a call that yields a no answer, busy signal, or answering machine
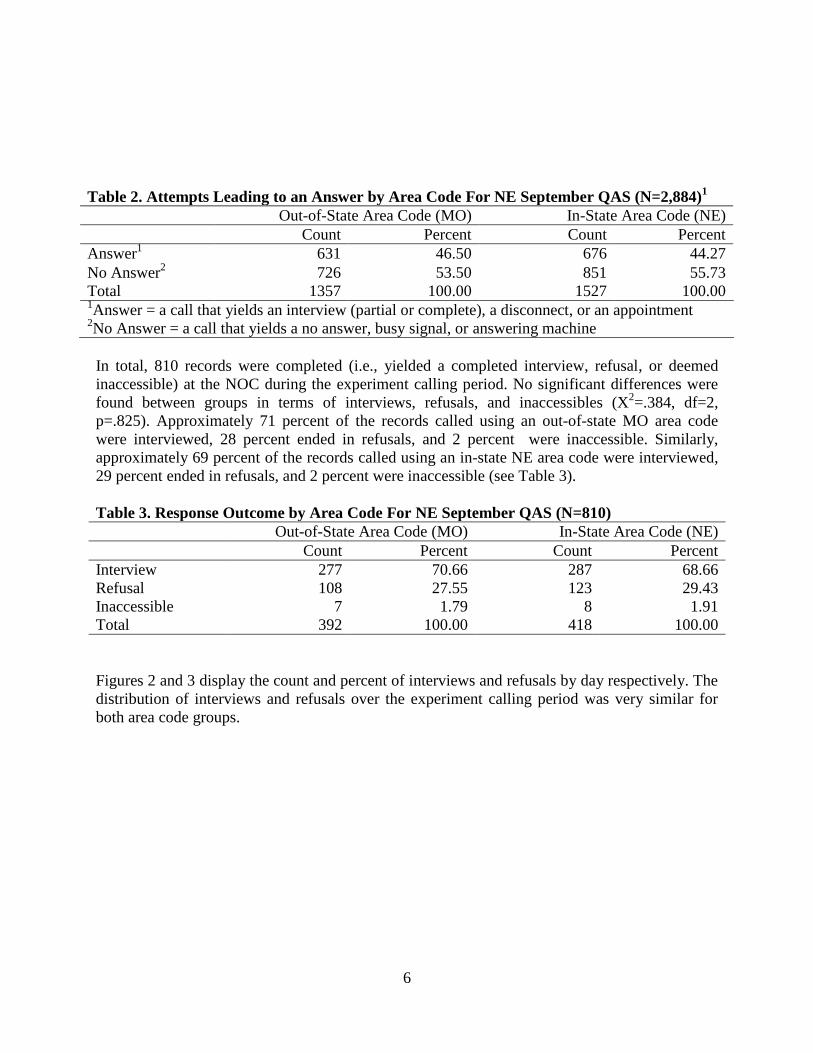
In total, 810 records were completed (i.e., yielded a completed interview, refusal, or deemed
inaccessible) at the NOC during the experiment calling period. No significant differences were
found between groups in terms of interviews, refusals, and inaccessibles (X2=.384, df=2,
p=.825). Approximately 71 percent of the records called using an out-of-state MO area code
were interviewed, 28 percent ended in refusals, and 2 percent were inaccessible. Similarly,
approximately 69 percent of the records called using an in-state NE area code were interviewed,
29 percent ended in refusals, and 2 percent were inaccessible (see Table 3).
Table 3. Response Outcome by Area Code For NE September QAS (N=810)
Out-of-State Area Code (MO) In-State Area Code (NE)
Count Percent Count Percent
Interview 277 70.66 287 68.66
Refusal 108 27.55 123 29.43
Inaccessible 7 1.79 8 1.91
Total 392 100.00 418 100.00
Figures 2 and 3 display the count and percent of interviews and refusals by day respectively. The
distribution of interviews and refusals over the experiment calling period was very similar for
both area code groups.

7

8
Although we had hoped to see a steeper rise in response early in the data collection period for
those called using an in-state area code (NE), this was not the case. No difference was found in
the cumulative response rates for calls made using an out-of-state MO area code versus an in-
state NE area code over the calling period (Figure 4).
There were 387 additional records (not reported above) that were attempted at least once at the
NOC but completed in the NE FO due to callouts.4 Of these, 65 were completed using a mail
questionnaire, 1 was completed using an in-person interview, 308 were completed by telephone,
and 13 were completed using an “other” method. This led to a response rate of 77.27 percent for
records that were contacted by telephone from the NE FO (Table 4).
Table 4. Response Outcome for NE Records
Contacted by Telephone from the NE FO
Count Percent
Interview 238 77.27
Refusal 67 21.75
Inaccessible 3 00.97
Total 308 100
We were interested in whether there was an improvement in response rates for records that were
initially called from the NOC (using an out-of-state area code) and then when called from the NE
FO using an in-state area code. Table 5 displays the response outcome for calls placed from the
NE FO by the area code used in the initial contact (i.e., MO area code vs. NE area code) at the
NOC. No significant difference was found in the response outcome (X2=2.617, df=2, p=.270).
4 FOs have the option of retrieving records from NOC toward the end of the calling period. This is referred to as
callouts.
9
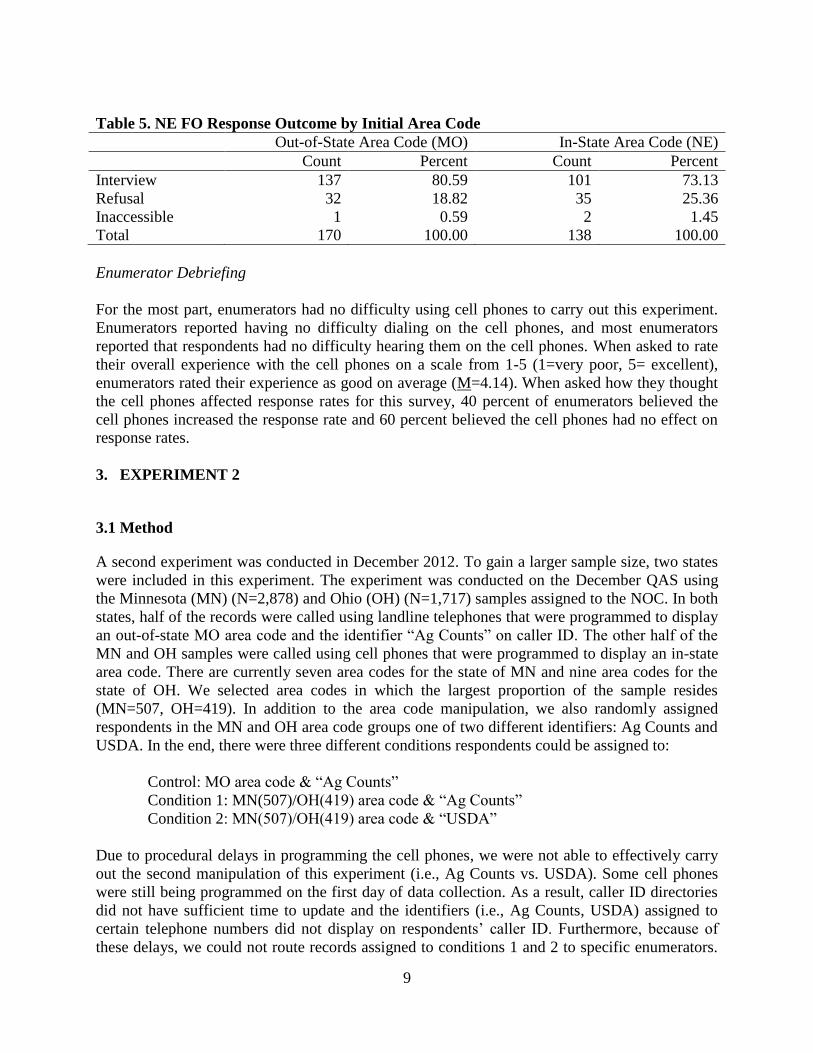
Table 5. NE FO Response Outcome by Initial Area Code
Out-of-State Area Code (MO) In-State Area Code (NE)
Count Percent Count Percent
Interview 137 80.59 101 73.13
Refusal 32 18.82 35 25.36
Inaccessible 1 0.59 2 1.45
Total 170 100.00 138 100.00
Enumerator Debriefing
For the most part, enumerators had no difficulty using cell phones to carry out this experiment.
Enumerators reported having no difficulty dialing on the cell phones, and most enumerators
reported that respondents had no difficulty hearing them on the cell phones. When asked to rate
their overall experience with the cell phones on a scale from 1-5 (1=very poor, 5= excellent),
enumerators rated their experience as good on average (M=4.14). When asked how they thought
the cell phones affected response rates for this survey, 40 percent of enumerators believed the
cell phones increased the response rate and 60 percent believed the cell phones had no effect on
response rates.
3. EXPERIMENT 2
3.1 Method
A second experiment was conducted in December 2012. To gain a larger sample size, two states
were included in this experiment. The experiment was conducted on the December QAS using
the Minnesota (MN) (N=2,878) and Ohio (OH) (N=1,717) samples assigned to the NOC. In both
states, half of the records were called using landline telephones that were programmed to display
an out-of-state MO area code and the identifier “Ag Counts” on caller ID. The other half of the
MN and OH samples were called using cell phones that were programmed to display an in-state
area code. There are currently seven area codes for the state of MN and nine area codes for the
state of OH. We selected area codes in which the largest proportion of the sample resides
(MN=507, OH=419). In addition to the area code manipulation, we also randomly assigned
respondents in the MN and OH area code groups one of two different identifiers: Ag Counts and
USDA. In the end, there were three different conditions respondents could be assigned to:
Control: MO area code & “Ag Counts”
Condition 1: MN(507)/OH(419) area code & “Ag Counts”
Condition 2: MN(507)/OH(419) area code & “USDA”
Due to procedural delays in programming the cell phones, we were not able to effectively carry
out the second manipulation of this experiment (i.e., Ag Counts vs. USDA). Some cell phones
were still being programmed on the first day of data collection. As a result, caller ID directories
did not have sufficient time to update and the identifiers (i.e., Ag Counts, USDA) assigned to
certain telephone numbers did not display on respondents’ caller ID. Furthermore, because of
these delays, we could not route records assigned to conditions 1 and 2 to specific enumerators.

10
Consequently, a respondent may have been assigned to condition 1 prior to data collection, but
called under condition 2 during data collection (or vice versa).
Fifty-two enumerators were randomly selected to call MN and OH. These enumerators were
provided a landline telephone programmed with an out-of-state MO area code and a cell phone
programmed with either an in-state area code.5 Prior to calling respondents, the enumerators
checked the Blaise instrument to see which phone to use when calling respondents. As in the first
experiment, respondents who were called using cell phones were read a disclosure statement
prior to data collection, which indicated the security risks associated with collecting data via a
cell phone and were asked for their permission to be interviewed over the cell phone: “I am
calling you on a cell phone which may be less secure than a land line. Are you comfortable
providing your data?” If respondents refused to be interviewed over a cell phone, attempts were
made to contact them again using a landline telephone. Enumerators were asked to indicate on
the Blaise instrument which telephone they were using to call respondents at each dial attempt.
Data were later outputted on the phone used to call respondents on the first and last call attempt.
This allowed us to track whether respondents were called under the assigned conditions (i.e.,
control vs. condition 1 or 2) and adjust our analyses accordingly.
At the end of the December QAS, we asked respondents from MN and OH about their use of
caller ID (see Appendix B). As in the preliminary experiment, enumerators were surveyed
regarding their experiences and opinions regarding the use of cell phones and in-state area codes.
A copy of this questionnaire can be found in Appendix C. Calling for this experiment took place
between November 29, 2012 and December 7, 2012. Callouts began on December 12, 2012.
Respondents included in the callouts are not included in the experiment analyses. Data for MN
and OH were combined in the analyses.
3.2 Results
The NOC made a total of 5,805 attempts to reach 3,148 respondents in MN and OH. There was
no difference in the number of attempts (i.e. call attempts leading to busy signals, no answers,
contacts with person or answering machine) made for the two calling groups. On average, the
NOC attempted to contact respondents in these states using an out-of-state MO area code 1.78
times, and an in-state area code 1.74 times.
The call outcomes are presented in Table 6. A significant difference was found between the two
calling groups (X2 = 47.58, df=5, p<.001). Twenty-six percent of calls placed using an in-state
area code led to a started interview, whereas 20 percent of calls placed using an out-of-state MO
area code led to a started interview. Conversely, more calls placed using an out-of-state MO area
code were unanswered or picked up by answering machines than calls placed using an in-state
area code.
5 Some records from MN and OH were routed to enumerators outside of the enumerator group selected for the
experiment. This occurred for a variety of reasons; however it typically occurred when appointments were scheduled
for particular records. In these cases the enumerators called respondents using landline telephones regardless of the
condition they were assigned. This was tracked in the Blaise instrument and accounted for in the analyses.

11
Table 6. Call Outcomes by Area Code for MN and OH December QAS (N=5,805)
Out-of-State Area Code (MO) In-State Area Code (MN/OH)
Count Percent Count Percent
Started Interview1 732 20.04 560 26.02
No Answer 570 15.60 315 14.64
Busy 95 2.60 89 4.14
Answering Machine 1814 49.66 921 42.80
Disconnect 87 2.38 62 2.88
Scheduled Appointment2 355 9.72 205 9.53
Total 3653 100.00 2152 100.00 1Started Interview = partial and complete interviews, refusals, and appointments made after the
interviewer started the interview 2Scheduled Appointment = appointments scheduled prior to starting the interview
Respondents who were called using an in-state area code were significantly more likely to
answer the phone (X2=23.73, df=1, p<.001). Out of the 3,653 attempts made to contact
respondents using an out-of-state MO area code, 32.14 percent were answered. Of the 2,152
attempts made to contact respondents using in-state area codes 38.43 percent were answered (see
Table 7).
Table 7. Attempts Leading to an Answer by Area Code for MN and OH December QAS
(N=5,805)
Out-of-State Area Code (MO) In-State Area Code (MN/OH)
Count Percent Count Percent
Answer1 1174 32.14 827 38.43
No Answer2 2479 67.86 1325 61.57
Total 3653 100.00 2152 100.00 1Answer = a call that yields an interview (partial or complete), a disconnect, or an appointment
2No Answer = a call that yields a no answer, busy signal, or answering machine
Although respondents were more likely to answer the phone when called using an in-state area
code, they were less likely to participate in the survey (X2=18.95, df=1, p<.001). Approximately
67 percent of the records called using an out-of-state MO area code were interviewed and 33
percent ended in refusals. Approximately 56 percent of the records called using in-state area
codes were interviewed and 44 percent ended in refusals (see Table 8).
Table 8. Response Outcome by Area Code for MN and OH December QAS (N=1937)
Out-of-State Area Code (MO) In-State Area Code (MN/OH)
Count Percent Count Percent
Interview 868 66.56 357 56.40
Refusal 436 33.44 276 43.60
Total 1304 100.00 633 100.00

12
Figures 5 and 6 display the count and percent of interviews and refusals by day respectively. The
distribution of interviews and refusals over the experiment calling period was similar for both
area code groups.
0
50
100
150
200
250
300
350
Figure 5. Count of Interviews and Refusals by
Day
MN/OH - Interview
MN/OH - Refusal
MO - Interview
MO - Refusal
0
0.1
0.2
0.3
0.4
0.5
0.6
0.7
0.8
0.9
1
Figure 6. Percent of Completes and Refusals by
Day MN/OH - Interview
MN/OH - Refusal
MO - Interview
MO - Refusal

13
As in the first experiment, the cumulative response rates for the two area code groups were
similar across the data collection period (Figure 7).
There were 849 additional records (not reported above) that were attempted at least once at the
NOC but completed in the MN and OH FOs due to callouts. Of these, 409 were completed using
a mail questionnaire, 2 were completed using an in-person interview, 38 were completed by web,
and 400 were completed by telephone. This led to a response rate of 6 percent for records that
were contacted by telephone from the MN and OH FOs (Table 9).
Table 9. Response Outcome for MN/OH Records
Contacted by Telephone from the MN/OH FOs
Count Percent
Interview 23 5.75
Refusal 17 4.25
Inaccessible 360 90.00
Total 400 100.00
Once again, we were interested in seeing if response rates improved for records originally
contacted at the NOC using an out-of-state area code and then were called in the FOs using in-
state area code. Table 10 shows the response outcome for calls placed from the MN/OH FOs by
the area code used in the initial contact (i.e., MO area code vs. MN/OH area code) at the NOC.
No significant difference was found in response outcome (X2=5.11, df=2, p=.08).

14
Table 10. MN/OH FO Response Outcome by Initial Area Code
Out-of-State Area Code (MO) In-State Area Code (MN/OH)
Count Percent Count Percent
Interview 8 3.83 15 7.85
Refusal 12 5.74 5 2.62
Inaccessible 189 90.43 171 89.53
Total 209 100.00 191 100.00
3.3 Caller ID Questions
Of the 1,225 respondents interviewed by the NOC, 1,005 were administered the caller ID
questions following the survey and of these 55 percent reported having caller ID. Fifty-seven
percent of the respondents who had caller ID reported looking at it before answering the call and
75 percent of these respondents could recall what was displayed. As shown in Table 11, there
was considerable variation in what respondents reported seeing on their caller ID. No
respondents reported seeing USDA and MN/OH number on caller ID. Furthermore, there were a
number of respondents who reported seeing information on their caller ID that was inconsistent
with the area code/identifier enumerators reported using when contacting them (see bolded
numbers).
Table 11. Distribution of Information Reported on Respondents’ Caller ID (N=226)
Area Code
Out-of-State (MO) In-State (MN/OH)
MO number 44 8
MN/OH number 14 45
“Ag Counts” 22 0
“USDA” 2 3
“Ag Counts” and MO number 16 2
“Ag Counts” and MN/OH number 9 2
“USDA” and MO number 2 1
Unavailable number 7 0
Unknown cell phone caller 10 4
Out of area number 10 0
Other 12 10
Refused/Don’t know 2 1
Total 150 76
Note: Bold numbers indicate instances where the area code/identifier viewed on respondents’
caller ID did not match enumerators’ report of area codes/identifiers used to contact them.
Next, we examined whether the information displayed on respondents’ caller ID affected their
perceived willingness to answer the telephone call. Nearly 51 percent of respondents indicated
that the information displayed on their caller ID had no influence on their decision to answer the
call, whereas 20 percent indicated the information displayed made them more hesitant to answer
the phone and approximately 29 percent indicated that the information displayed made them
more willing to answer the call (Table 12). Respondents, who indicated that the information

15
displayed on caller ID influenced their decision to answer the call, were more willing to answer
when the call was identified as coming from an in-state number, Ag Counts, or USDA, and less
willing to answer the call when the call was identified as an unknown listing or other.6
Table 12. Information Displayed on Caller ID and Willingness to Answer
More Hesitant More Willing No Influence Total
Overall 44
20.37%
62
28.70%
109
50.93%
215
Specific Display
MO Number 7
14.29%
7
14.29%
35
71.43%
49
MN/OH Number 6
10.34%
19
32.76%
33
56.90%
58
Ag Counts 9
19.15%
22
46.81%
16
34.04%
47
USDA 0
0.00%
6
66.67%
3
33.33%
9
Listing Unknown 13
41.94%
6
19.35%
12
38.71%
31
Other 9
42.86%
2
9.52%
10
47.62%
21
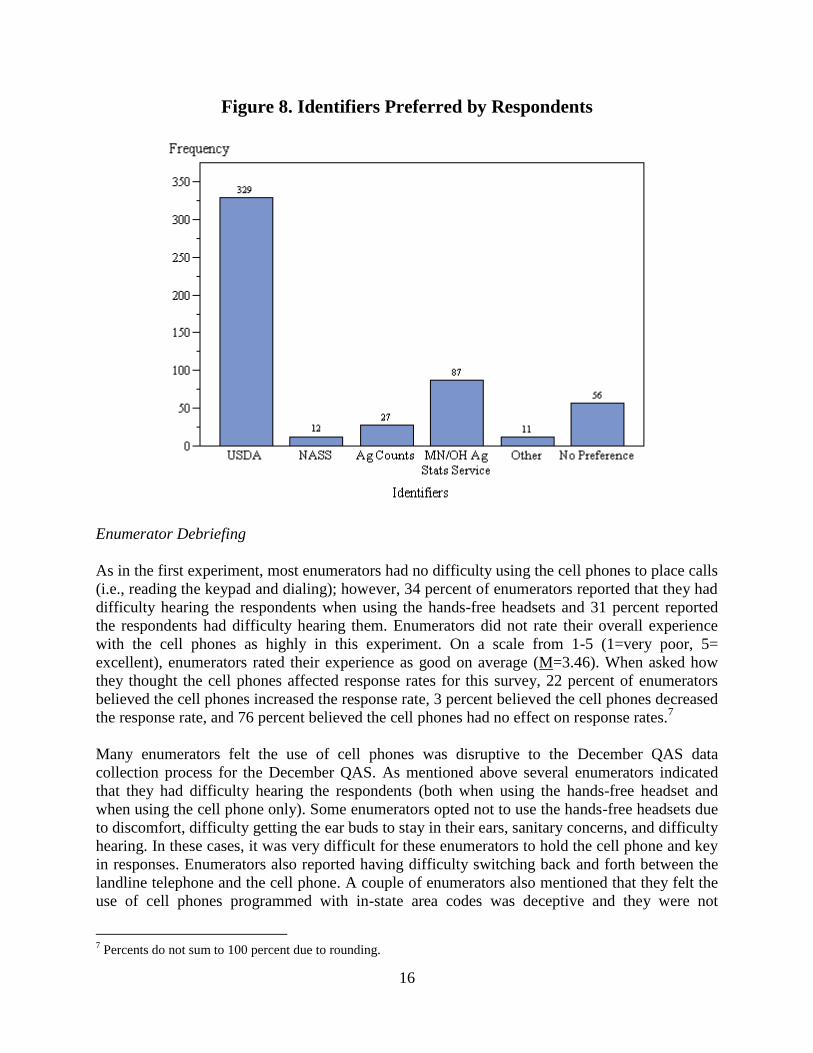
Respondents were also surveyed to see how they would prefer we identify ourselves when
contacting them in the future. The vast majority of respondents indicated that they would prefer
it if we identified ourselves as the USDA (see Figure 8).
6 Information displayed on caller ID was coded as “other” in cases where respondents reported seeing phone
numbers from area codes not included in the experiment (i.e., 509 (Washington), 517 (Michigan), 269 (Michigan)),
cases where respondents could recall seeing a number only but could not recall the number itself, or cases where
enumerators selected the other category but did not elaborate on what the respondents reported seeing on caller ID.
16
Figure 8. Identifiers Preferred by Respondents
Enumerator Debriefing
As in the first experiment, most enumerators had no difficulty using the cell phones to place calls
(i.e., reading the keypad and dialing); however, 34 percent of enumerators reported that they had
difficulty hearing the respondents when using the hands-free headsets and 31 percent reported
the respondents had difficulty hearing them. Enumerators did not rate their overall experience
with the cell phones as highly in this experiment. On a scale from 1-5 (1=very poor, 5=
excellent), enumerators rated their experience as good on average (M=3.46). When asked how
they thought the cell phones affected response rates for this survey, 22 percent of enumerators
believed the cell phones increased the response rate, 3 percent believed the cell phones decreased
the response rate, and 76 percent believed the cell phones had no effect on response rates.7
Many enumerators felt the use of cell phones was disruptive to the December QAS data
collection process for the December QAS. As mentioned above several enumerators indicated
that they had difficulty hearing the respondents (both when using the hands-free headset and
when using the cell phone only). Some enumerators opted not to use the hands-free headsets due
to discomfort, difficulty getting the ear buds to stay in their ears, sanitary concerns, and difficulty
hearing. In these cases, it was very difficult for these enumerators to hold the cell phone and key
in responses. Enumerators also reported having difficulty switching back and forth between the
landline telephone and the cell phone. A couple of enumerators also mentioned that they felt the
use of cell phones programmed with in-state area codes was deceptive and they were not
7 Percents do not sum to 100 percent due to rounding.

17
comfortable with this manipulation. Finally, several enumerators indicated that the placement of
the survey questions on respondents’ use of caller ID was awkward. Enumerators were instructed
to administer these questions after thanking respondents for their participation in the survey and
offering them a copy of the results. This was done to reduce the impact of these questions on the
data collection for the QAS. However, enumerators felt this was a very awkward transition and
indicated that it would have been easier for them to administer these questions prior to thanking
respondents for their participation.
4. DISCUSSION
The purpose of this research was to examine whether calling respondents using an in-state area
code and a recognizable identifier would increase the number of answered calls and the response
rate for the September and December QAS. Using an in-state area code led to a small
improvement in answered calls; however, it did not improve response rates. By using in-state
area code, we may have persuaded respondents who would have otherwise ignored our calls to
answer the phone but we could not persuade them to participate in our survey. It was also
hypothesized that using an in-state area code would reduce the number of calls that were needed
to reach a respondent. However, no differences in the number of calls placed were found
between those respondents who were contacted using in-state area codes and those who were
contacted using out-of-state area codes. Respondents were also surveyed on their use of caller
ID. Based on data, we learned that very few respondents had caller ID and used it to screen calls.
While we were not able to effectively test whether using recognizable identifiers increased the
number of answered calls and the response rate, we did learn that respondents feel more inclined
to answer the phone when called from an in-state area code, or a recognizable identifier such as
Ag Counts or USDA, and overall they would prefer that we identify ourselves as USDA when
contacting them in the future.
4.1 Limitations
There were several limitations to this research. First, all of the states we called in these
experiments had multiple area codes in use. While we attempted to select an area code that
covered the largest portion of the state where the surveyed famers/ranchers reside, it’s possible
that the area codes we selected were not familiar or local to some respondents. Furthermore, it’s
not uncommon for an operator to reside in a different state from where the farm operations are
located. In these cases, manipulating the area code used may not have made a difference in
persuading these respondents to answer the phone. Any attempt to use local area codes would
need to consider what “local” would mean in practice.
Cell phones were used instead of our Voice over Internet Protocol (VOIP) system due to the time
and monetary costs associated with changing the VOIP system for these experiments. Although
cell phones were a cost-saving alternative to changing the VOIP, they presented their own
logistical challenges. First, we had to rely on the cell phone provider to assign area codes and
identifiers to the phones. A number of the cell phones were programmed incorrectly, and as a
result some phones were still being programmed to display the appropriate area codes and
identifiers on the first day of data collection. This delay did not allow sufficient time for
telephone carriers to update their databases which send information to respondents’ caller ID.

18
Subsequently, the identifiers (AG counts and USDA) we assigned to the two cell phone groups
in the second experiment did not display on most respondents’ caller ID. When the cell phones
were programmed well in advance of the calling period, we still had little control over the
information displayed on respondents’ caller ID. In order to display identifiers on caller ID, third
party databases, which can charge fees, need to be accessed. Some telephone carriers do not
access these databases, particularly when calls originate from cell phones (Wikipedia, 2013).
Instead carriers will display the phone number along with the identifier “unavailable” or the city
and/or state in which the phone number is based.
Using cell phones also made it very difficult to track the mode of calling (i.e., whether
respondents were called using in-state vs. out-of-state area code) during the experiments. The
late programming of the cell phones also made it difficult for our call center to assign cases to
enumerators for the three different conditions in the December QAS experiment, which then
limited our ability to control and track the execution of the experimental design. Had we used
our VOIP system to carry out this experiment, we may have had more control over programming
the phones (i.e., how and when they were programmed) and tracking the calls made.
Another limitation of using cell phones to carry out these experiments was that enumerators were
required to read a disclosure statement to respondents before beginning the survey, which
disclosed any potential risks of sharing information over a cellular network. This disclosure
statement may have led some respondents to refuse to participate in the survey due to privacy
concerns. Conducting this type of experiment using a landline telephone would eliminate the
need for this disclosure statement and more closely match typical telephone call center
operations.
Finally, only respondents who answered the phone and participated in the QAS were
administered the additional survey questions on caller ID use. As a result, we don’t know if
those who did not answer the phone or refused to participate in the QAS used caller ID to screen
our calls.
4.2 Implications
Despite these limitations, this research indicates that changing the area code (and possibly the
identifier) when calling respondents does not appear to be a cost-effective way to improve the
number of answered calls and the response rates for our surveys. In order to implement such a
change in our call centers, a number of steps would need to be taken, many of which are resource
intensive. First, a procedure would need to be put in place for selecting area codes to use for each
survey. This would involve analyzing the survey samples to determine which area code(s) would
be local or familiar to the majority of respondents in the survey. However, as mentioned above,
even if this step was taken, it does not guarantee that the area code(s) selected is local or familiar
to the respondents. In addition to selecting an area code, significant resources would need to be
invested to change the VOIP system, as this system would need to be updated for every survey
conducted out of our call centers. Finally, these changes would potentially impact only a small
percentage of our samples since many respondents do not have caller ID, and many of those who
do, do not use it to screen calls. Therefore, given the small improvement in answered calls, the
lack of improvement in response rates, and the amount of logistical challenges to implementing

19
such a change, this does not appear to be a cost-effective way to improve the number of
answered calls and response rates. Instead our efforts would be better spent exploring alternative
ways to improve response rates to our surveys.
5. RECOMMENDATIONS
1. Do not take action to match the area code for outgoing calls with respondents’ area codes.
2. Use a recognizable identifier, such as “USDA,” for all outgoing calls.
3. Explore alternative ways to improve response rates.

20
6. REFERENCES
Barron, M., and Khare, M., (2007), “Manipulating Caller ID for Higher Survey Response in
RDD Surveys,” in American Statistical Association Proceedings of the Section on Survey
Research Methods, pp. 3957-3962.
Blumberg, S. J., and Luke, J. V., (2013), “Wireless Substitution: Early Release of Estimates
from the National Health Interview Survey, July-December 2012,” Hyattsville, MD:
National Center for Health Statistics.
Brick. J. M., and Williams, D., (2013), “Explaining Rising Nonresponse Rates in Cross-
Sectional Surveys,” The ANNALS of the American Academy of Political and Social
Science, 645, 36-59.
Callegaro, M., McCutcheon, A. L., and Ludwig, J., (2006), “Who’s Calling? The Impact of
Caller ID on Telephone Survey Response,” in American Statistical Association
Proceedings of the AAPOR – ASA Section on Survey Research Methods, pp. 3822-3824.
The Council on Food, Agricultural and Resource Economics (C-FARE), (2007), “Improving
Information about America’s Farms & Ranches: A Review of the Census of Agriculture,”
Washington, DC.
Curtin, R., Presser, S., and Singer, E., (2005), “Changes in Telephone Survey Nonresponse over
the Past Quarter Century,” Public Opinion Quarterly, 69 (1), 87-98.
Groves, R. M., and Couper, M. P., (1998), Nonresponse in Household Surveys, New York:
Wiley.
Kempf, A. M., and Remington, P. L., (2007), “New Challenges for Telephone Survey
Research in the Twenty-First Century,” Annual Review of Public Health, 28, 113-126.
Link, M. W., and Oldendick, R. W., (1999), “Call Screening – Is It Really a Problem for
Survey Research,” Public Opinion Quarterly, 63 (4), 577-589.
McCarthy, J. S., Johnson, J. V., and Ott, K., (1999), “Exploring the Relationship
Between Survey Participation and Survey Sponsorship: What do Respondents and
Nonrespondents Think of US,” Fairfax, VA: National Agricultural Statistics Service.
National Research Council, (2008), Understanding American Agriculture: Challenges for the
Agricultural Resource Management Survey, Panel to Review USDA’s Agricultural
Resource Management Survey. Committee on National Statistics, Division of Behavioral
and Social Sciences and Education. Washington, DC: The National Academies Press.
Okon, A., Moore, J. C., and Bates, N., (2008), ““Census Bureau” vs “Unknown
Caller” – Caller ID Displays and Survey Cooperation,” Research Report Series (Survey
Methodology #2008-5), Washington DC: U.S. Census Bureau.
21
Singer, E., and Presser, S., (2008), “Privacy, Confidentiality, and Respondent Burden as
Factors in Telephone Survey Nonresponse,” in Advances in Telephone
Survey Methodology, eds. J. M. Lepkowski, C. Tucker, J. M. Brick, E. de Leeuw, L.
Japec, P.J. Lavrakas, M.W. Link, and R.L. Sangster, Hoboken, NJ: Wiley, pp. 449-470.
Tourangeau, R., (2004), “Survey Research and Societal Change.” Annual Review of
Psychology, 55, 775-801.
Tuckel, P., and O’Neill, H., (2001), “The Vanishing Respondent in Telephone Surveys,” in
Proceedings of the Annual Meeting of the American Statistical Association.
Wikipedia, (2013), Caller ID, Retrieved January 25, 2013 (http://en.wikipedia.org/wiki/
Caller_ID).

22
APPENDIX A: September QAS Enumerator Debriefing
September 2012 Enumerator Questionnaire
Cell Phone Evaluation
NATIONAL
AGRICULTURAL
STATISTICS
SERVICE
Please evaluate your experience with the use of the cell phones for the September Agricultural Survey.
1. Could you clearly read the keypad on the cell phone?
1 Yes 3 No
2. Did you have any difficulty dialing on the cell phone?
1 Yes 3 No
3. Did you have any difficulty hearing the respondent through the headsets provided?
1 Yes 3 No
4. Did the respondent have difficulty hearing you on the cell phone?
1 Yes 3 No
5. Did you have any issues with the cell phone being disconnected during the survey?
1 Yes 3 No
6. For this survey, please rate your overall experience with the cell phone
1 Very Poor 2 Poor 3 Neutral 4 Good 5 Excellent
7. In your opinion, did calling on cell phones increase, decrease, or have no effect on response rates for this survey?
1 Increased 2 Decreased 3 Had no effect
8. Comment on any other information pertaining to the use of the cell phones.
1 Yes - Comments – Enter on the lines below 3 No Comments
______________________________________________________________________________
______________________________________________________________________________
______________________________________________________________________________
______________________________________________________________________________
ENUMERATOR: __________________________________ DATE: ____________________
23
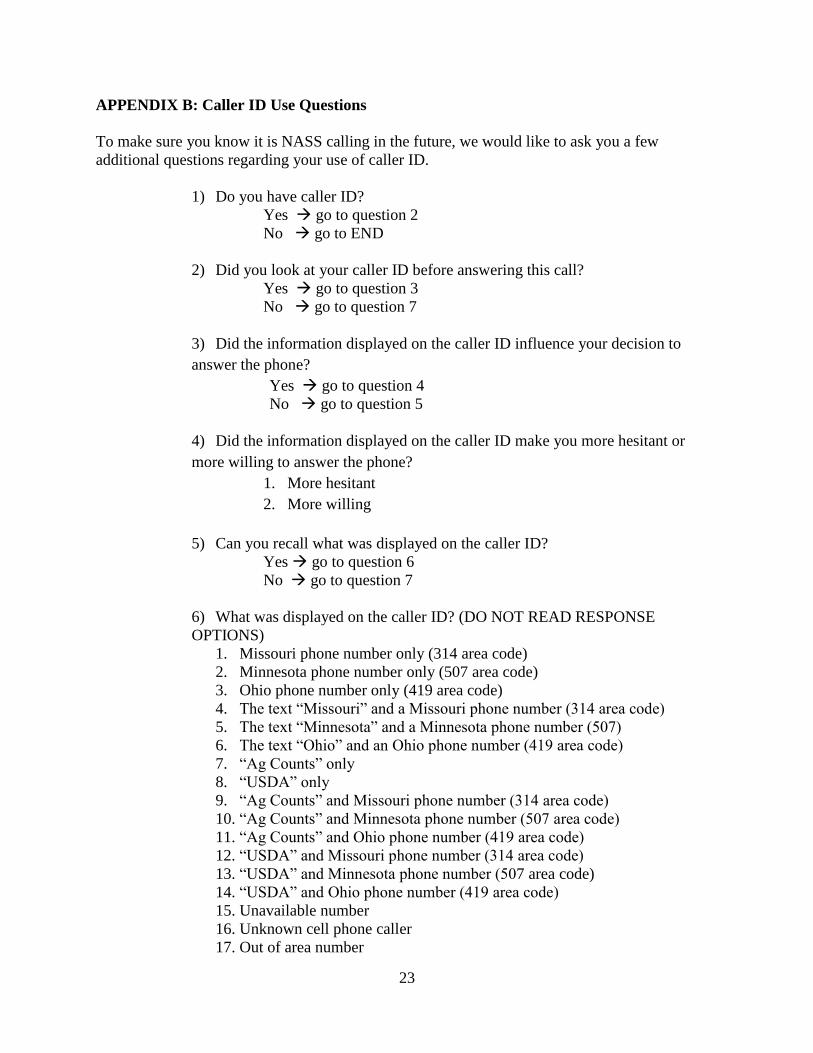
APPENDIX B: Caller ID Use Questions
To make sure you know it is NASS calling in the future, we would like to ask you a few
additional questions regarding your use of caller ID.
1) Do you have caller ID?
Yes go to question 2
No go to END
2) Did you look at your caller ID before answering this call?
Yes go to question 3
No go to question 7
3) Did the information displayed on the caller ID influence your decision to
answer the phone?
Yes go to question 4
No go to question 5
4) Did the information displayed on the caller ID make you more hesitant or
more willing to answer the phone?
1. More hesitant
2. More willing
5) Can you recall what was displayed on the caller ID?
Yes go to question 6
No go to question 7
6) What was displayed on the caller ID? (DO NOT READ RESPONSE
OPTIONS)
1. Missouri phone number only (314 area code)
2. Minnesota phone number only (507 area code)
3. Ohio phone number only (419 area code)
4. The text “Missouri” and a Missouri phone number (314 area code)
5. The text “Minnesota” and a Minnesota phone number (507)
6. The text “Ohio” and an Ohio phone number (419 area code)
7. “Ag Counts” only
8. “USDA” only
9. “Ag Counts” and Missouri phone number (314 area code)
10. “Ag Counts” and Minnesota phone number (507 area code)
11. “Ag Counts” and Ohio phone number (419 area code)
12. “USDA” and Missouri phone number (314 area code)
13. “USDA” and Minnesota phone number (507 area code)
14. “USDA” and Ohio phone number (419 area code)
15. Unavailable number
16. Unknown cell phone caller
17. Out of area number

24
18. Other: _____________
7) When we call you in the future, how would you prefer we identify ourselves on
your caller ID?
1. USDA
2. NASS
3. Ag Counts
4. Minnesota/Ohio Agricultural Statistics Service
5. Something else: ____________________
END
25
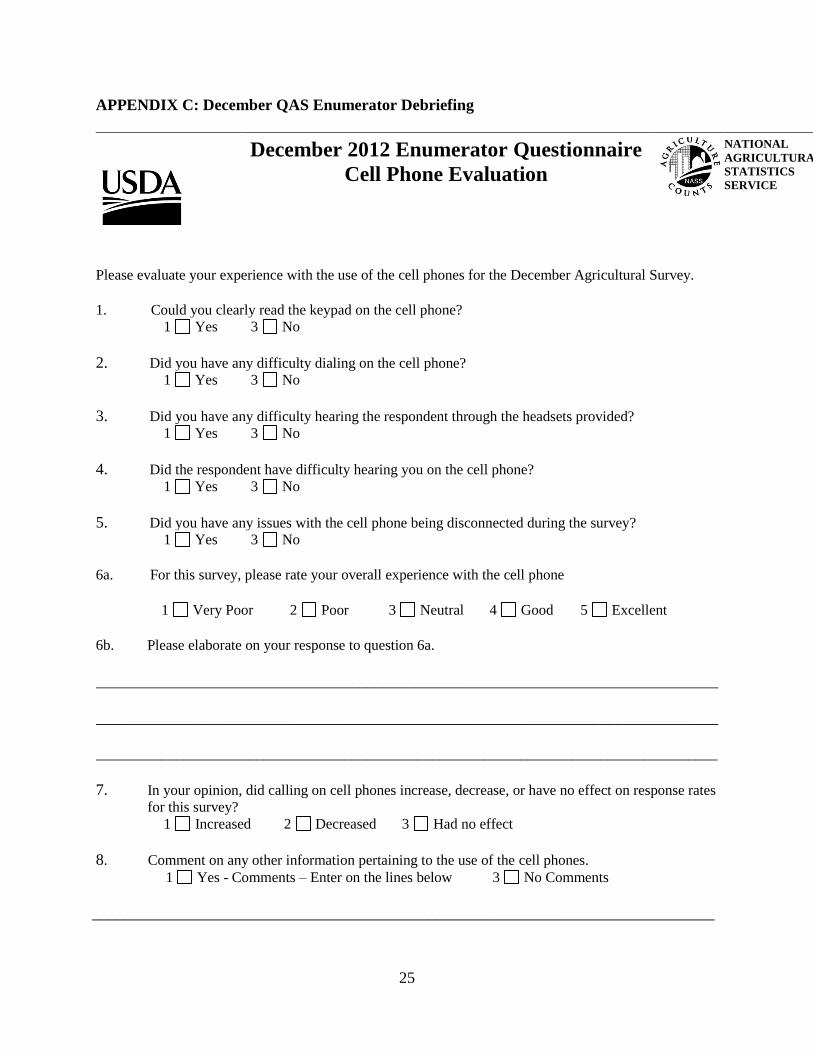
APPENDIX C: December QAS Enumerator Debriefing
December 2012 Enumerator Questionnaire
Cell Phone Evaluation
NATIONAL
AGRICULTURAL
STATISTICS
SERVICE
Please evaluate your experience with the use of the cell phones for the December Agricultural Survey.
1. 1. Could you clearly read the keypad on the cell phone?
1 Yes 3 No
2. Did you have any difficulty dialing on the cell phone?
1 Yes 3 No
3. Did you have any difficulty hearing the respondent through the headsets provided?
1 Yes 3 No
4. Did the respondent have difficulty hearing you on the cell phone?
1 Yes 3 No
5. Did you have any issues with the cell phone being disconnected during the survey?
1 Yes 3 No
6a. For this survey, please rate your overall experience with the cell phone
1 Very Poor 2 Poor 3 Neutral 4 Good 5 Excellent
6b. Please elaborate on your response to question 6a.
______________________________________________________________________________
______________________________________________________________________________
_____________________________________________________________________________________
7. In your opinion, did calling on cell phones increase, decrease, or have no effect on response rates for this survey?
1 Increased 2 Decreased 3 Had no effect
8. Comment on any other information pertaining to the use of the cell phones.
1 Yes - Comments – Enter on the lines below 3 No Comments
______________________________________________________________________________

26
______________________________________________________________________________
_____________________________________________________________________________________
ENUMERATOR: __________________________________ DATE: ____________________