will this budget lead markets to new highs?
TRANSCRIPT
Union Budget 2017-18
Will this BUDGET lead markets
to New Highs?
Budget Special – Sectoral Overview (Technical Report)
2017-18
Research Team
Sectoral Overview (Technical) Auto & Auto Ancillaries
Ruchit Jain 022-3935 7600 Extn: 6554 [email protected]
( 2 )
Sectoral Overview (Technical) – Auto & Auto ancillaries
February 14, 2017 2
Index
Nifty Auto 3
Tata Motors 4
Maruti 5
Relative Strength Analysis (Bajaj Auto, Hero Motoco & TVS Motor) 6
Bajaj Auto 7
Hero Motoco 8
TVS Motor 9
Relative Strength Analysis (Exide Ind & Amara Raja Batteries) 10
Exide Industries 11
Amara Raja Batteries 12
Relative Strength Analysis (MRF, Ceat & Apollo Tyres) 13
MRF 14
Ceat 15
Apollo Tyres 16
Motherson Sumi 17
( 3 )
Sectoral Overview (Technical) – Auto & Auto ancillaries
February 14, 2017 3
Rationale:
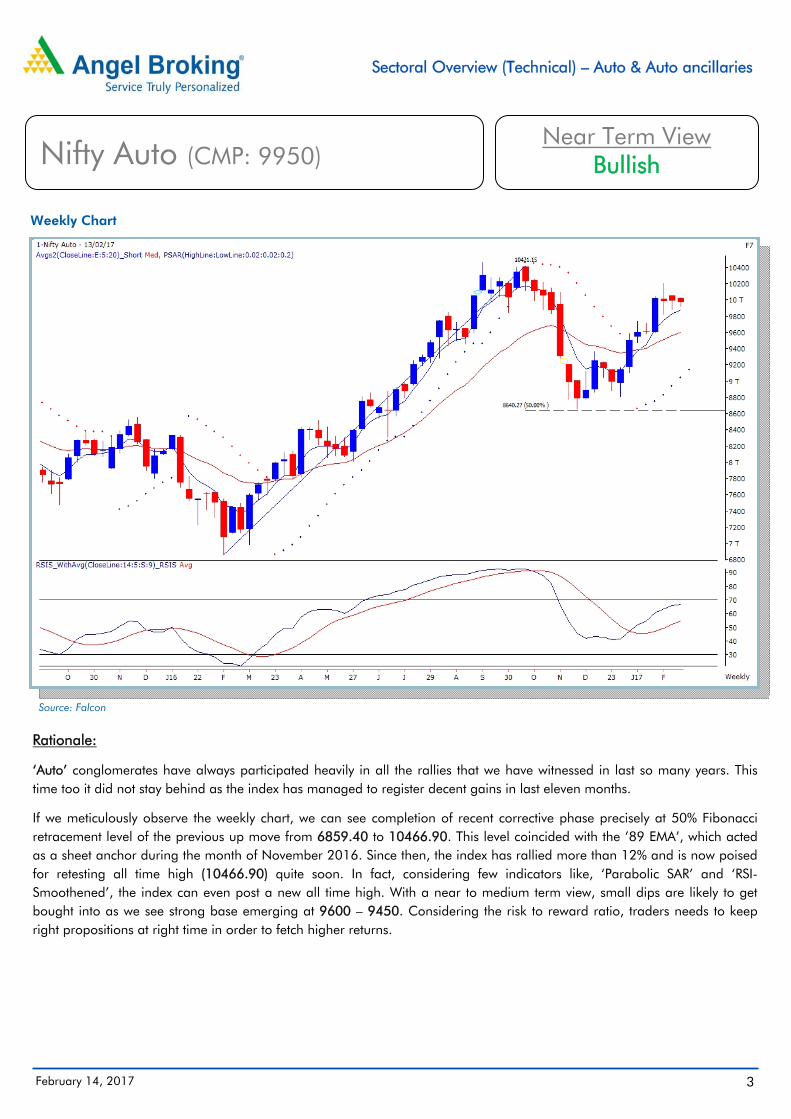
‘Auto’ conglomerates have always participated heavily in all the rallies that we have witnessed in last so many years. Thistime too it did not stay behind as the index has managed to register decent gains in last eleven months.
If we meticulously observe the weekly chart, we can see completion of recent corrective phase precisely at 50% Fibonacciretracement level of the previous up move from 6859.40 to 10466.90. This level coincided with the ’89 EMA’, which actedas a sheet anchor during the month of November 2016. Since then, the index has rallied more than 12% and is now poisedfor retesting all time high (10466.90) quite soon. In fact, considering few indicators like, ‘Parabolic SAR’ and ‘RSI-Smoothened’, the index can even post a new all time high. With a near to medium term view, small dips are likely to getbought into as we see strong base emerging at 9600 – 9450. Considering the risk to reward ratio, traders needs to keepright propositions at right time in order to fetch higher returns.
Weekly Chart
Source: Falcon
Nifty Auto (CMP: 9950) Near Term View
Bullish
( 4 )
Sectoral Overview (Technical) – Auto & Auto ancillaries
February 14, 2017 4
Rationale:
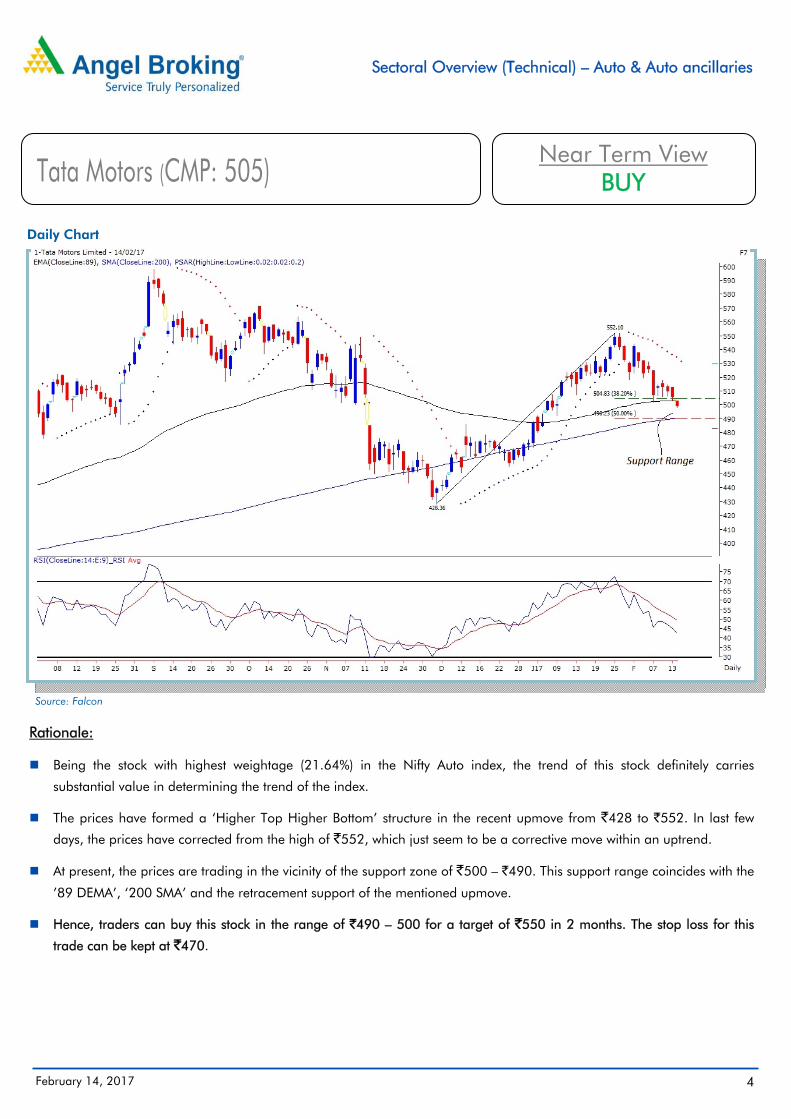
Being the stock with highest weightage (21.64%) in the Nifty Auto index, the trend of this stock definitely carries
substantial value in determining the trend of the index.
The prices have formed a ‘Higher Top Higher Bottom’ structure in the recent upmove from `428 to `552. In last few
days, the prices have corrected from the high of `552, which just seem to be a corrective move within an uptrend.
At present, the prices are trading in the vicinity of the support zone of `500 – `490. This support range coincides with the
’89 DEMA’, ‘200 SMA’ and the retracement support of the mentioned upmove.
Hence, traders can buy this stock in the range of `490 – 500 for a target of `550 in 2 months. The stop loss for this
trade can be kept at `470.
Daily Chart
Source: Falcon
Tata Motors (CMP: 505) Near Term View
BUY
( 5 )
Sectoral Overview (Technical) – Auto & Auto ancillaries
February 14, 2017 5
Rationale:
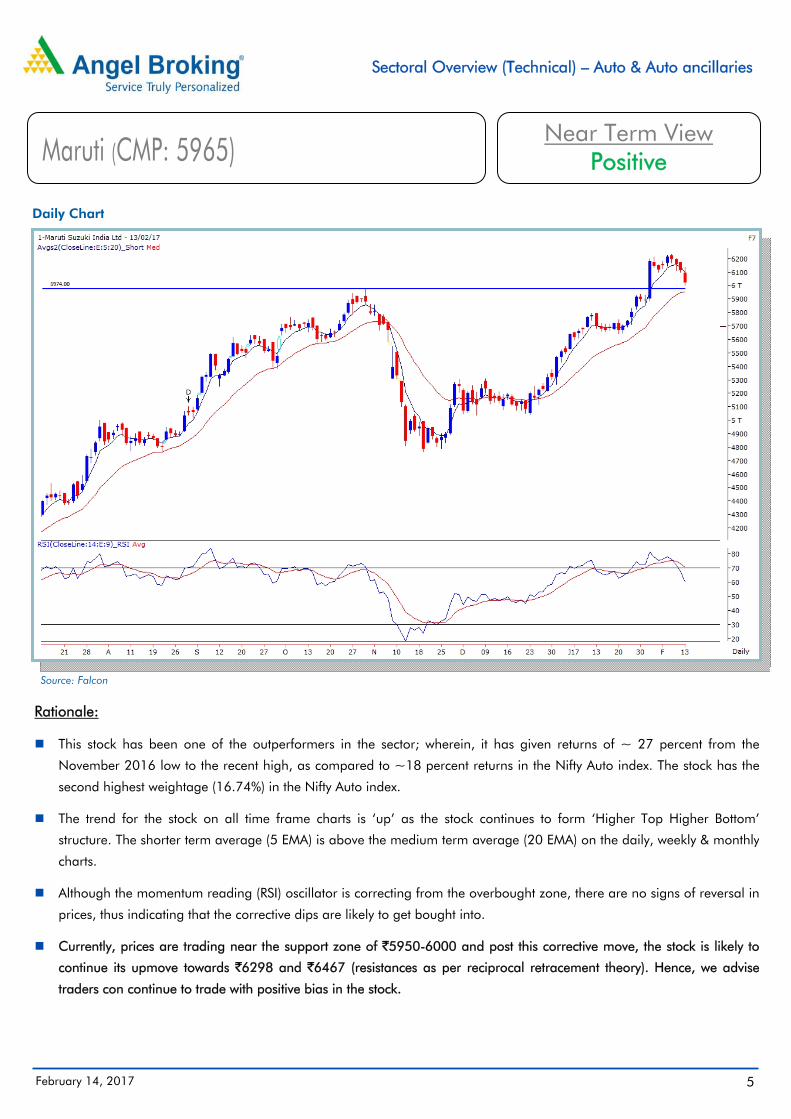
This stock has been one of the outperformers in the sector; wherein, it has given returns of ~ 27 percent from the
November 2016 low to the recent high, as compared to ~18 percent returns in the Nifty Auto index. The stock has the
second highest weightage (16.74%) in the Nifty Auto index.
The trend for the stock on all time frame charts is ‘up’ as the stock continues to form ‘Higher Top Higher Bottom’
structure. The shorter term average (5 EMA) is above the medium term average (20 EMA) on the daily, weekly & monthly
charts.
Although the momentum reading (RSI) oscillator is correcting from the overbought zone, there are no signs of reversal in
prices, thus indicating that the corrective dips are likely to get bought into.
Currently, prices are trading near the support zone of `5950-6000 and post this corrective move, the stock is likely to
continue its upmove towards `6298 and `6467 (resistances as per reciprocal retracement theory). Hence, we advise
traders con continue to trade with positive bias in the stock.
Daily Chart
Source: Falcon
Maruti (CMP: 5965) Near Term View
Positive
( 6 )
Sectoral Overview (Technical) – Auto & Auto ancillaries
February 14, 2017 6
Key Obervations:
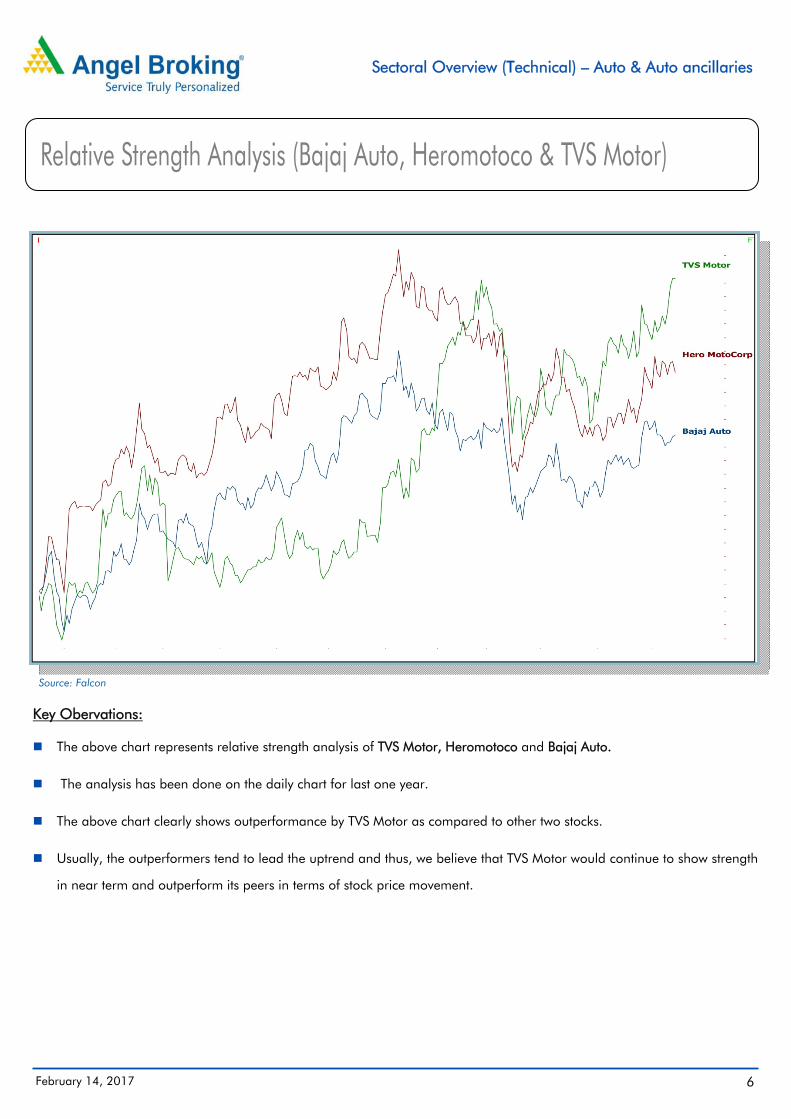
The above chart represents relative strength analysis of TVS Motor, Heromotoco and Bajaj Auto.
The analysis has been done on the daily chart for last one year.
The above chart clearly shows outperformance by TVS Motor as compared to other two stocks.
Usually, the outperformers tend to lead the uptrend and thus, we believe that TVS Motor would continue to show strength
in near term and outperform its peers in terms of stock price movement.
Source: Falcon
Relative Strength Analysis (Bajaj Auto, Heromotoco & TVS Motor)
( 7 )
Sectoral Overview (Technical) – Auto & Auto ancillaries
February 14, 2017 7
Rationale:
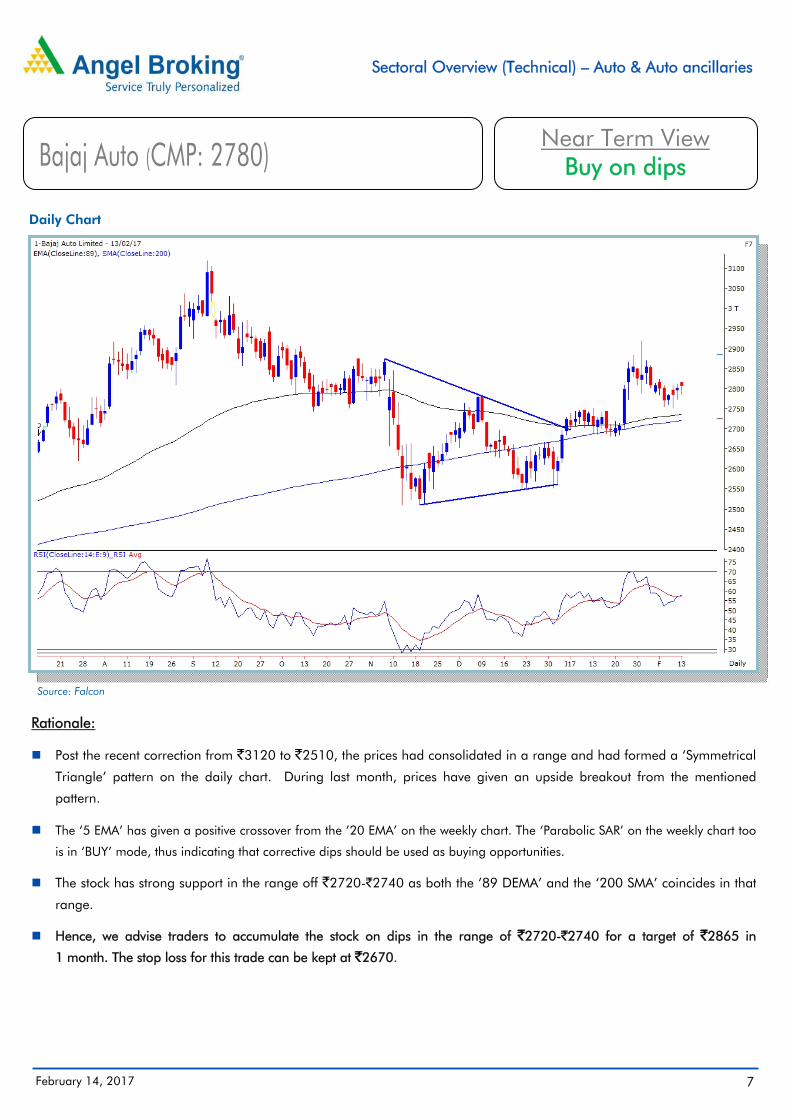
Post the recent correction from `3120 to `2510, the prices had consolidated in a range and had formed a ‘Symmetrical
Triangle’ pattern on the daily chart. During last month, prices have given an upside breakout from the mentioned
pattern.
The ‘5 EMA’ has given a positive crossover from the ’20 EMA’ on the weekly chart. The ‘Parabolic SAR’ on the weekly chart too
is in ‘BUY’ mode, thus indicating that corrective dips should be used as buying opportunities.
The stock has strong support in the range off `2720-`2740 as both the ’89 DEMA’ and the ‘200 SMA’ coincides in that
range.
Hence, we advise traders to accumulate the stock on dips in the range of `2720-`2740 for a target of `2865 in
1 month. The stop loss for this trade can be kept at `2670.
Daily Chart
Source: Falcon
Bajaj Auto (CMP: 2780) Near Term View
Buy on dips
( 8 )
Sectoral Overview (Technical) – Auto & Auto ancillaries
February 14, 2017 8
Rationale:
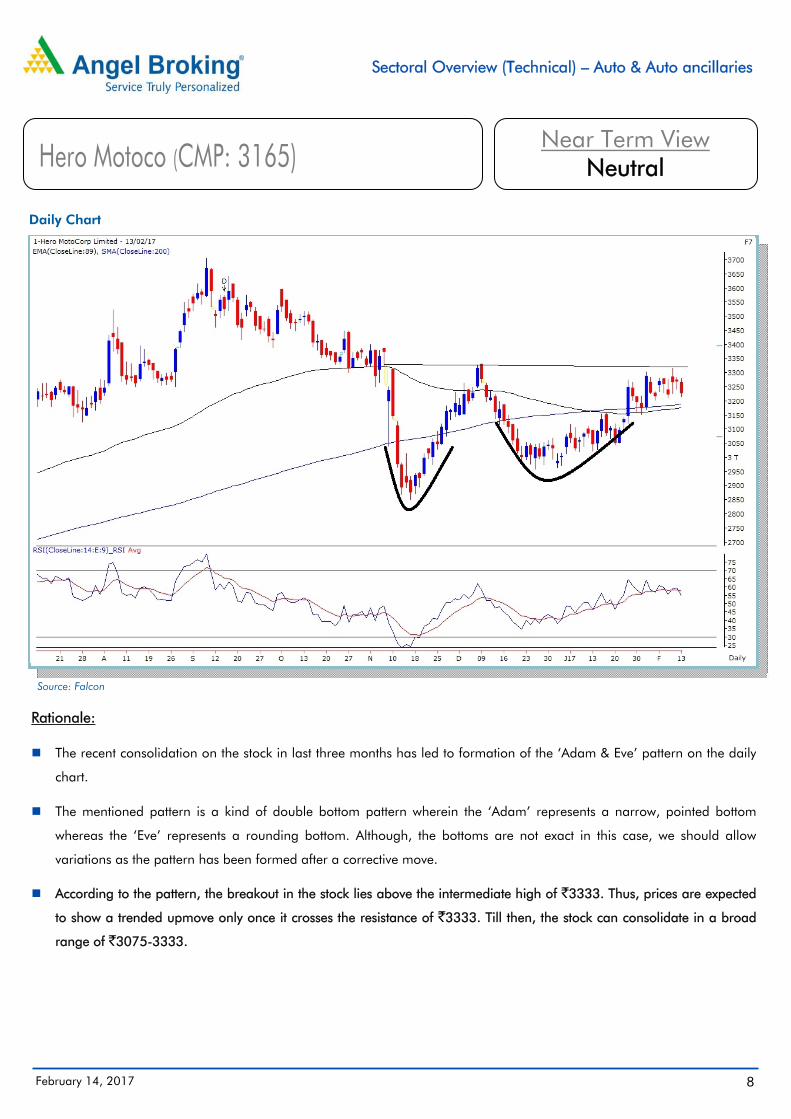
The recent consolidation on the stock in last three months has led to formation of the ‘Adam & Eve’ pattern on the daily
chart.
The mentioned pattern is a kind of double bottom pattern wherein the ‘Adam’ represents a narrow, pointed bottom
whereas the ‘Eve’ represents a rounding bottom. Although, the bottoms are not exact in this case, we should allow
variations as the pattern has been formed after a corrective move.
According to the pattern, the breakout in the stock lies above the intermediate high of `3333. Thus, prices are expected
to show a trended upmove only once it crosses the resistance of `3333. Till then, the stock can consolidate in a broad
range of `3075-3333.
Daily Chart
Source: Falcon
Hero Motoco (CMP: 3165) Near Term View
Neutral
( 9 )
Sectoral Overview (Technical) – Auto & Auto ancillaries
February 14, 2017 9
Rationale:
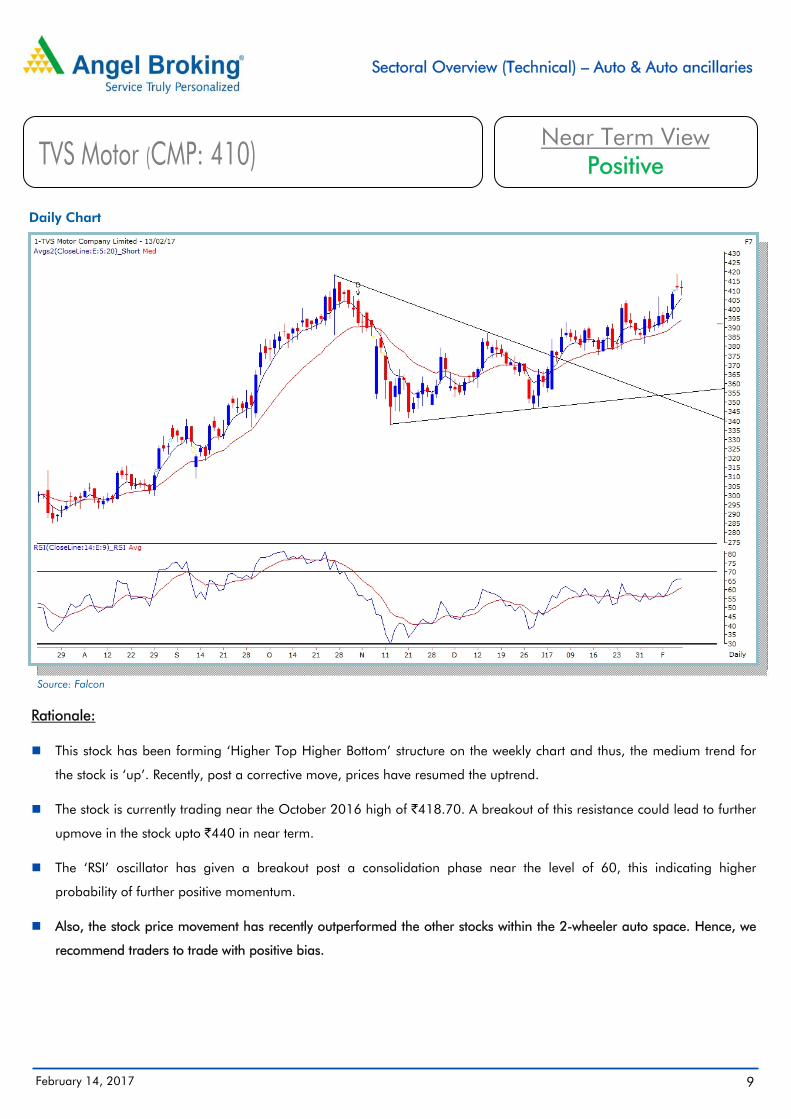
This stock has been forming ‘Higher Top Higher Bottom’ structure on the weekly chart and thus, the medium trend for
the stock is ‘up’. Recently, post a corrective move, prices have resumed the uptrend.
The stock is currently trading near the October 2016 high of `418.70. A breakout of this resistance could lead to further
upmove in the stock upto `440 in near term.
The ‘RSI’ oscillator has given a breakout post a consolidation phase near the level of 60, this indicating higher
probability of further positive momentum.
Also, the stock price movement has recently outperformed the other stocks within the 2-wheeler auto space. Hence, we
recommend traders to trade with positive bias.
Daily Chart
Source: Falcon
TVS Motor (CMP: 410) Near Term View
Positive
( 10 )
Sectoral Overview (Technical) – Auto & Auto ancillaries
February 14, 2017 10
Rationale:
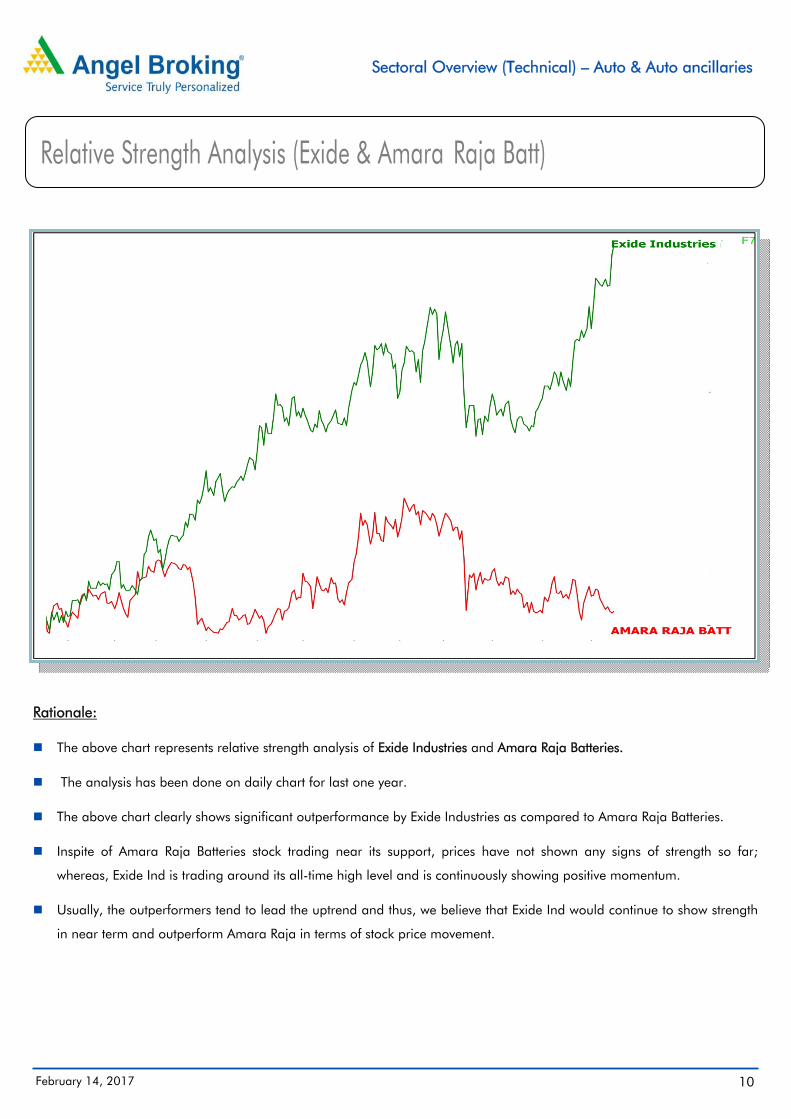
The above chart represents relative strength analysis of Exide Industries and Amara Raja Batteries.
The analysis has been done on daily chart for last one year.
The above chart clearly shows significant outperformance by Exide Industries as compared to Amara Raja Batteries.
Inspite of Amara Raja Batteries stock trading near its support, prices have not shown any signs of strength so far;
whereas, Exide Ind is trading around its all-time high level and is continuously showing positive momentum.
Usually, the outperformers tend to lead the uptrend and thus, we believe that Exide Ind would continue to show strength
in near term and outperform Amara Raja in terms of stock price movement.
Relative Strength Analysis (Exide & Amara Raja Batt)
( 11 )
Sectoral Overview (Technical) – Auto & Auto ancillaries
February 14, 2017 11
Rationale:
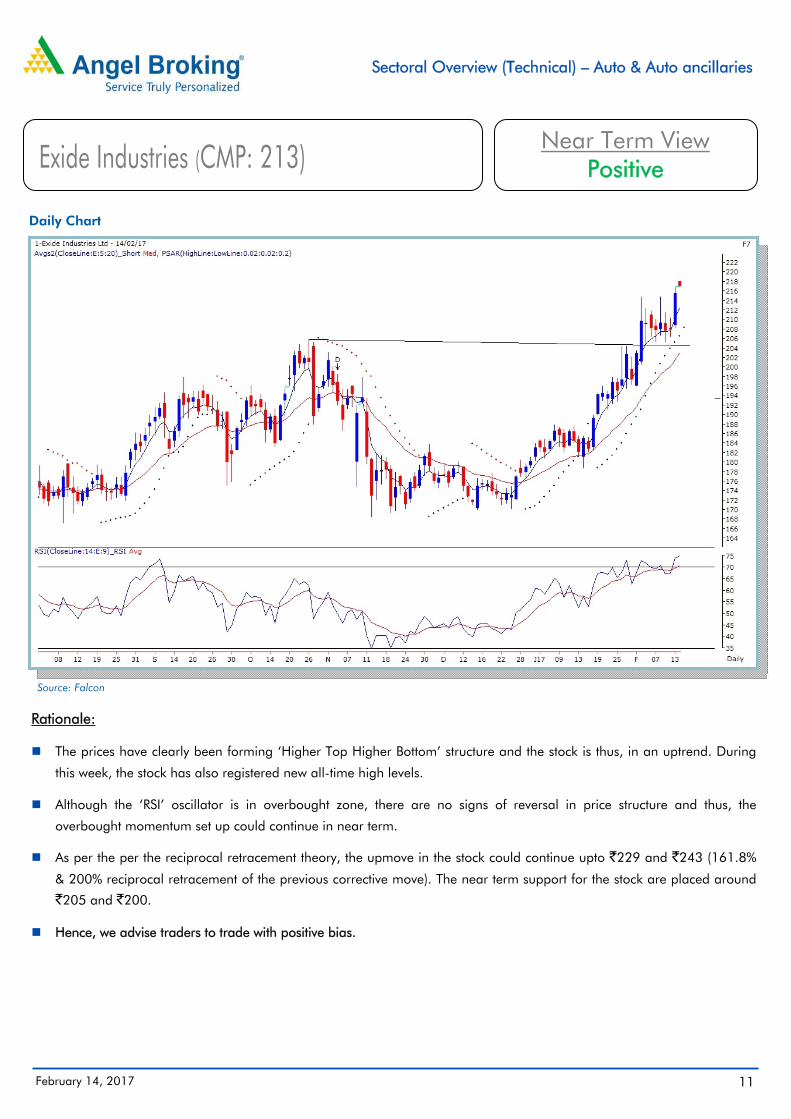
The prices have clearly been forming ‘Higher Top Higher Bottom’ structure and the stock is thus, in an uptrend. During
this week, the stock has also registered new all-time high levels.
Although the ‘RSI’ oscillator is in overbought zone, there are no signs of reversal in price structure and thus, the
overbought momentum set up could continue in near term.
As per the per the reciprocal retracement theory, the upmove in the stock could continue upto `229 and `243 (161.8%
& 200% reciprocal retracement of the previous corrective move). The near term support for the stock are placed around
`205 and `200.
Hence, we advise traders to trade with positive bias.
Daily Chart
Source: Falcon
Exide Industries (CMP: 213) Near Term View
Positive
( 12 )
Sectoral Overview (Technical) – Auto & Auto ancillaries
February 14, 2017 12
Rationale:
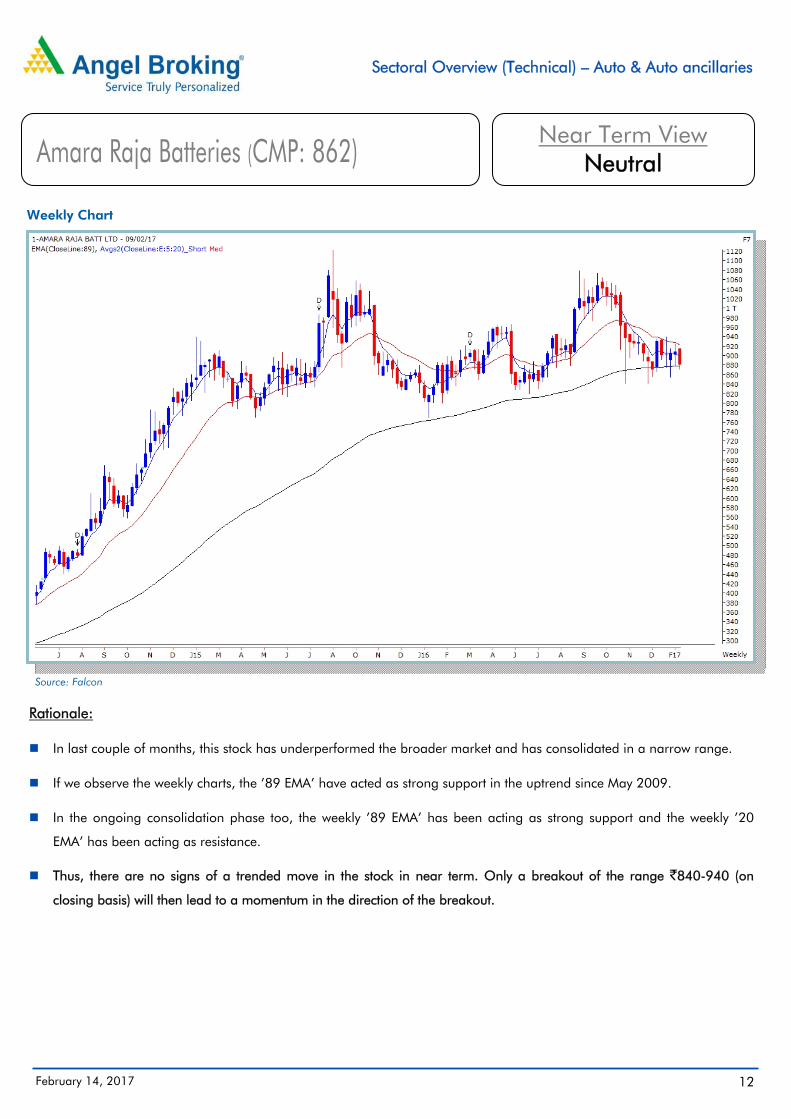
In last couple of months, this stock has underperformed the broader market and has consolidated in a narrow range.
If we observe the weekly charts, the ’89 EMA’ have acted as strong support in the uptrend since May 2009.
In the ongoing consolidation phase too, the weekly ’89 EMA’ has been acting as strong support and the weekly ’20
EMA’ has been acting as resistance.
Thus, there are no signs of a trended move in the stock in near term. Only a breakout of the range `840-940 (on
closing basis) will then lead to a momentum in the direction of the breakout.
Weekly Chart
Source: Falcon
Amara Raja Batteries (CMP: 862) Near Term View
Neutral
( 13 )
Sectoral Overview (Technical) – Auto & Auto ancillaries
February 14, 2017 13
Rationale:
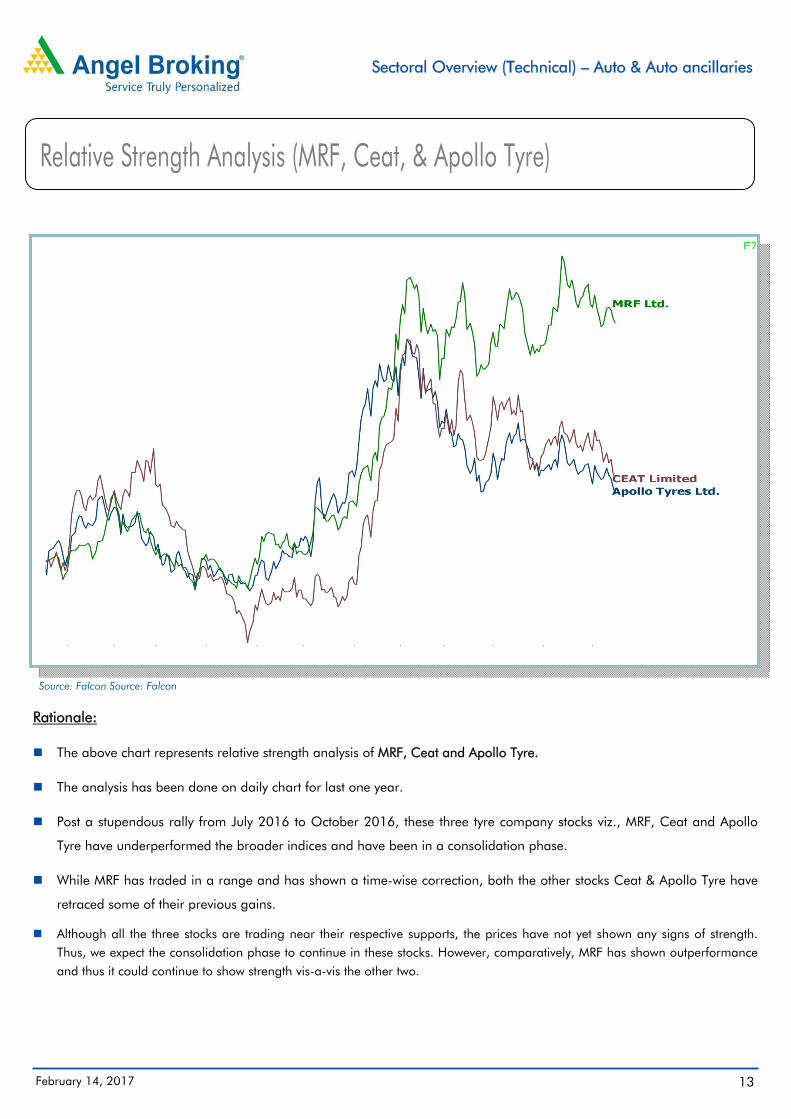
The above chart represents relative strength analysis of MRF, Ceat and Apollo Tyre.
The analysis has been done on daily chart for last one year.
Post a stupendous rally from July 2016 to October 2016, these three tyre company stocks viz., MRF, Ceat and Apollo
Tyre have underperformed the broader indices and have been in a consolidation phase.
While MRF has traded in a range and has shown a time-wise correction, both the other stocks Ceat & Apollo Tyre have
retraced some of their previous gains.
Although all the three stocks are trading near their respective supports, the prices have not yet shown any signs of strength.Thus, we expect the consolidation phase to continue in these stocks. However, comparatively, MRF has shown outperformanceand thus it could continue to show strength vis-a-vis the other two.
Source: Falcon Source: Falcon
Relative Strength Analysis (MRF, Ceat, & Apollo Tyre)
( 14 )
Sectoral Overview (Technical) – Auto & Auto ancillaries
February 14, 2017 14
Rationale:
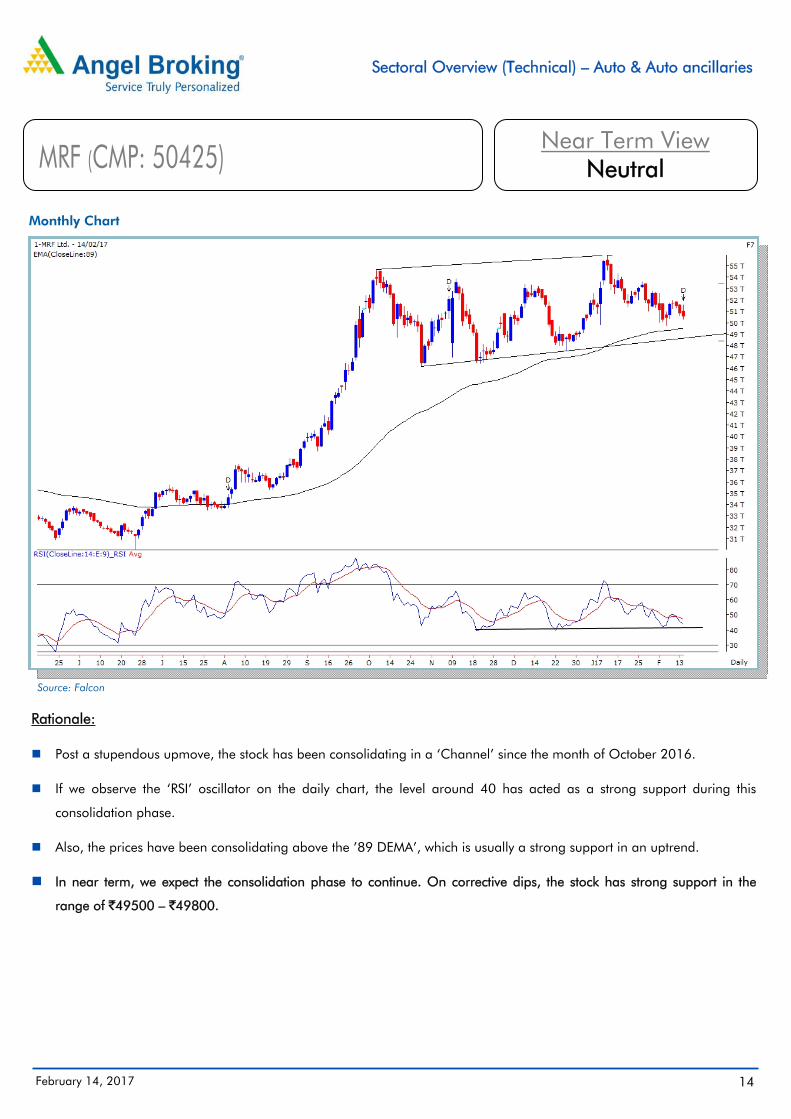
Post a stupendous upmove, the stock has been consolidating in a ‘Channel’ since the month of October 2016.
If we observe the ‘RSI’ oscillator on the daily chart, the level around 40 has acted as a strong support during this
consolidation phase.
Also, the prices have been consolidating above the ’89 DEMA’, which is usually a strong support in an uptrend.
In near term, we expect the consolidation phase to continue. On corrective dips, the stock has strong support in the
range of `49500 – `49800.
Monthly Chart
Source: Falcon
MRF (CMP: 50425) Near Term View
Neutral
( 15 )
Sectoral Overview (Technical) – Auto & Auto ancillaries
February 14, 2017 15
Rationale:
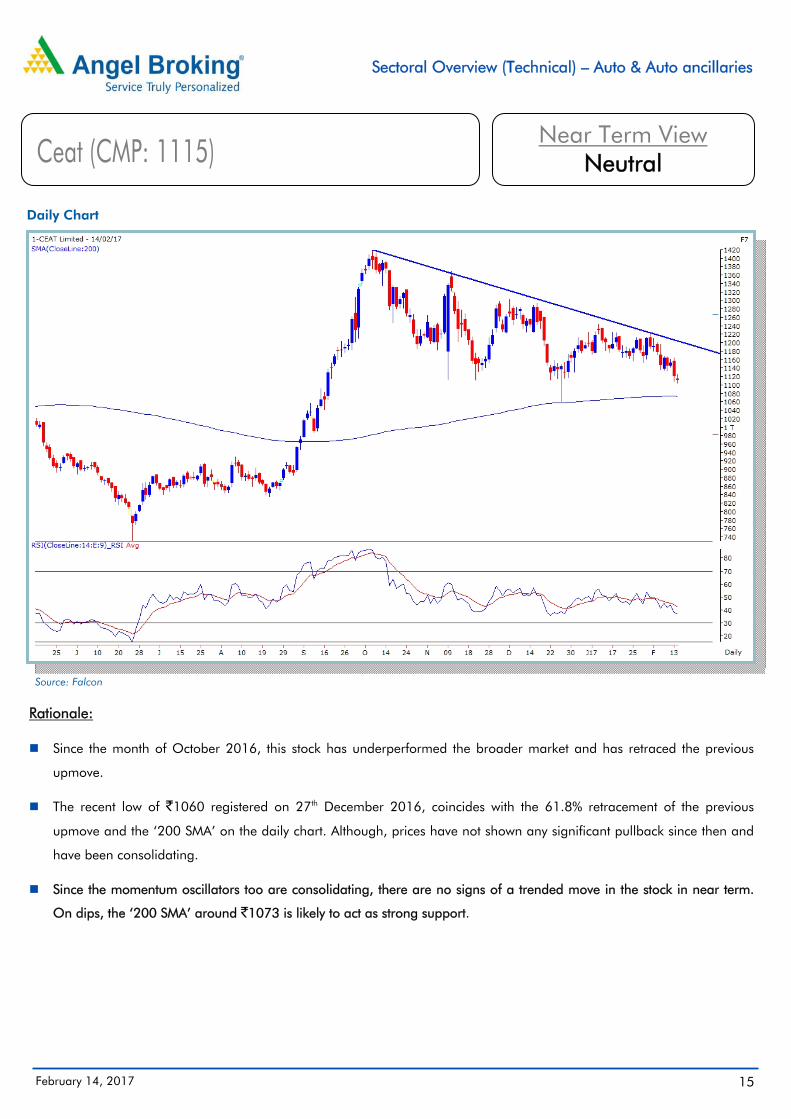
Since the month of October 2016, this stock has underperformed the broader market and has retraced the previous
upmove.
The recent low of `1060 registered on 27th December 2016, coincides with the 61.8% retracement of the previous
upmove and the ‘200 SMA’ on the daily chart. Although, prices have not shown any significant pullback since then and
have been consolidating.
Since the momentum oscillators too are consolidating, there are no signs of a trended move in the stock in near term.
On dips, the ‘200 SMA’ around `1073 is likely to act as strong support.
Daily Chart
Source: Falcon
Ceat (CMP: 1115) Near Term View
Neutral
( 16 )
Sectoral Overview (Technical) – Auto & Auto ancillaries
February 14, 2017 16
Rationale:
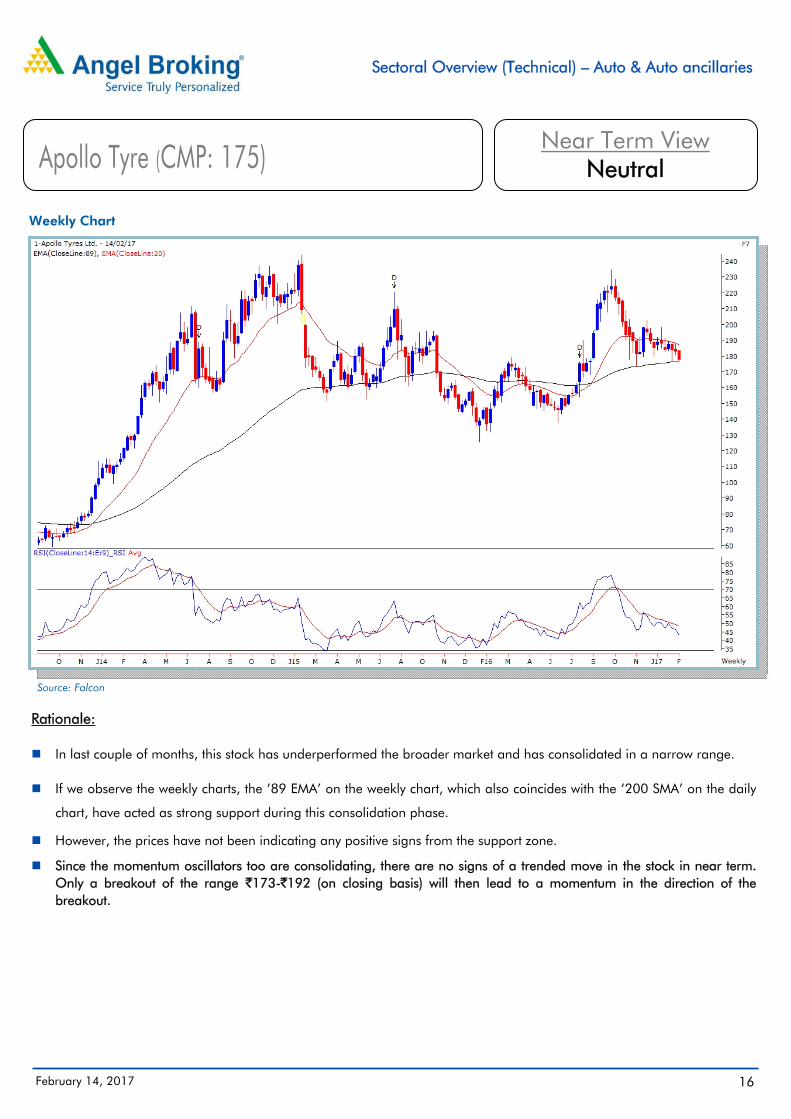
In last couple of months, this stock has underperformed the broader market and has consolidated in a narrow range.
If we observe the weekly charts, the ’89 EMA’ on the weekly chart, which also coincides with the ‘200 SMA’ on the daily
chart, have acted as strong support during this consolidation phase.
However, the prices have not been indicating any positive signs from the support zone.
Since the momentum oscillators too are consolidating, there are no signs of a trended move in the stock in near term.Only a breakout of the range `173-`192 (on closing basis) will then lead to a momentum in the direction of thebreakout.
Weekly Chart
Source: Falcon
Apollo Tyre (CMP: 175) Near Term View
Neutral
( 17 )
Sectoral Overview (Technical) – Auto & Auto ancillaries
February 14, 2017 17
Rationale:
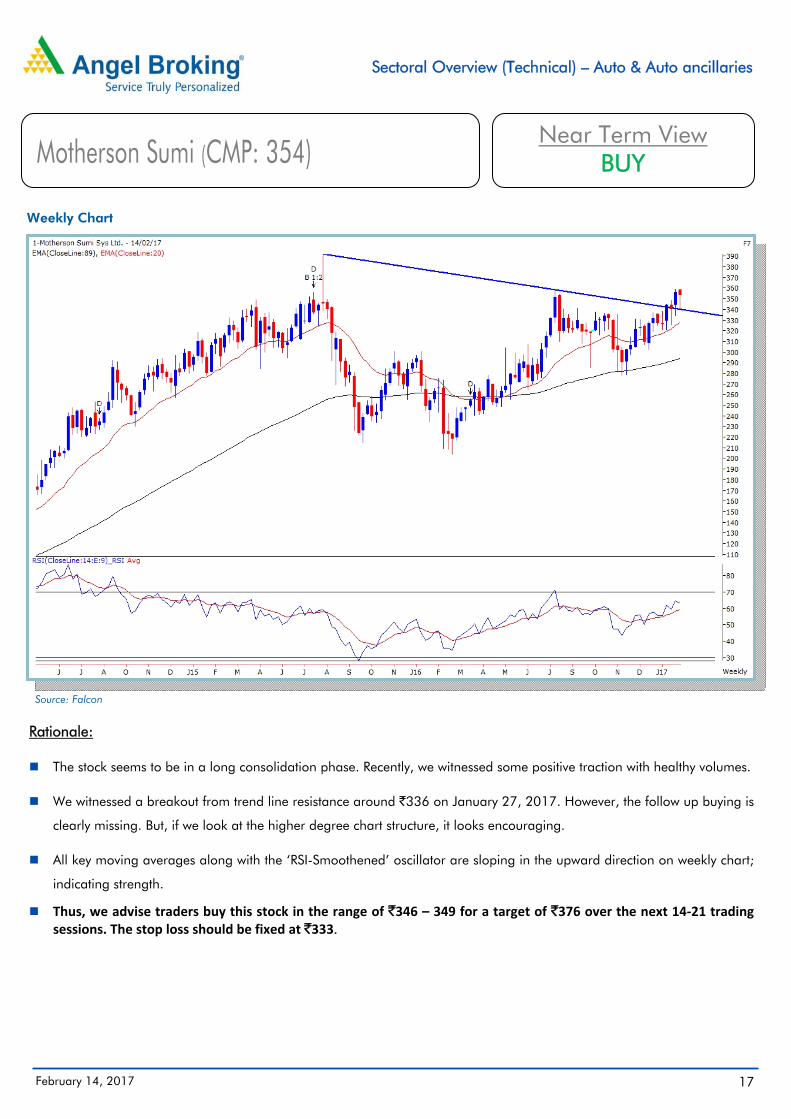
The stock seems to be in a long consolidation phase. Recently, we witnessed some positive traction with healthy volumes.
We witnessed a breakout from trend line resistance around `336 on January 27, 2017. However, the follow up buying is
clearly missing. But, if we look at the higher degree chart structure, it looks encouraging.
All key moving averages along with the ‘RSI-Smoothened’ oscillator are sloping in the upward direction on weekly chart;
indicating strength.
Thus, we advise traders buy this stock in the range of `346 – 349 for a target of `376 over the next 14‐21 trading sessions. The stop loss should be fixed at `333.
Weekly Chart
Source: Falcon
Motherson Sumi (CMP: 354) Near Term View
BUY
( 18 )
Sectoral Overview (Technical) – Auto & Auto ancillaries
February 14, 2017 18
Research Team Tel: 022 - 39357800 E-mail: [email protected] Website: www.angelbroking.com
DISCLAIMER
Angel Broking Private Limited (hereinafter referred to as “Angel”) is a registered Member of National Stock Exchange of India Limited, Bombay Stock Exchange Limited and Metropolitan Stock Exchange Limited. It is also registered as a Depository Participant with CDSL and Portfolio Manager with SEBI. It also has registration with AMFI as a Mutual Fund Distributor. Angel Broking Private Limited is a registered entity with SEBI for Research Analyst in terms of SEBI (Research Analyst) Regulations, 2014 vide registration number INH000000164. Angel or its associates has not been debarred/ suspended by SEBI or any other regulatory authority for accessing /dealing in securities Market. Angel or its associates/analyst has not received any compensation / managed or co-managed public offering of securities of the company covered by Analyst during the past twelve months.
This document is solely for the personal information of the recipient, and must not be singularly used as the basis of any investment decision. Nothing in this document should be construed as investment or financial advice. Each recipient of this document should make such investigations as they deem necessary to arrive at an independent evaluation of an investment in the securities of the companies referred to in this document (including the merits and risks involved), and should consult their own advisors to determine the merits and risks of such an investment.
Reports based on technical and derivative analysis center on studying charts of a stock's price movement, outstanding positions and trading volume, as opposed to focusing on a company's fundamentals and, as such, may not match with a report on a company's fundamentals. Investors are advised to refer the Fundamental and Technical Research Reports available on our website to evaluate the contrary view, if any.
The information in this document has been printed on the basis of publicly available information, internal data and other reliable sources believed to be true, but we do not represent that it is accurate or complete and it should not be relied on as such, as this document is for general guidance only. Angel Broking Pvt. Limited or any of its affiliates/ group companies shall not be in any way responsible for any loss or damage that may arise to any person from any inadvertent error in the information contained in this report. Angel Broking Pvt. Limited has not independently verified all the information contained within this document. Accordingly, we cannot testify, nor make any representation or warranty, express or implied, to the accuracy, contents or data contained within this document. While Angel Broking Pvt. Limited endeavors to update on a reasonable basis the information discussed in this material, there may be regulatory, compliance, or other reasons that prevent us from doing so.
This document is being supplied to you solely for your information, and its contents, information or data may not be reproduced, redistributed or passed on, directly or indirectly.
Neither Angel Broking Pvt. Limited, nor its directors, employees or affiliates shall be liable for any loss or damage that may arise from or in connection with the use of this information.
Angel Broking Private Limited, Registered Office: G-1, Ackruti Trade Centre, Road No. 7, MIDC, Andheri (E), Mumbai – 400 093. Tel: (022) 3083 7700. Fax: (022) 2835 8811, website: www.angelbroking.com, CIN: U67120MH1996PTC101709, BSE Cash/F&O: INB010996539/INF010996539, NSE Cash/F&O/CD: INB231279838/INF231279838/ INE231279838, MSEI: INE261279838, CDSL Regn. No.: IN - DP – CDSL – 234 – 2004, PMS Regn. Code: PM/INP000001546, Compliance Officer: Mr. Anoop Goyal, Tel: (022) 39413940, Email: [email protected]. Angel Commodities Broking Private Ltd.:
6th Floor, Ackruti Star, Central Road, MIDC, Andheri (E), Mumbai – 400 093. Tel: (022) 39357800
Technical and Derivatives Team:
Sameet Chavan Chief Analyst – Technical & Derivatives [email protected]
Ruchit Jain Technical Analyst [email protected]
Jay Kumar Purohit Technical Analyst [email protected]
Sneha Seth Derivatives Analyst [email protected]