will visa inc deliver long-term returns? · 2015-06-05 · peer 3 gpn global payments inc 56.25 75...
TRANSCRIPT
Contents:
Basics Pages (1 to 3).Highlights.StockMarks.Profile.Rating determinants
Benchmarks Pages (3 to 5).Sector.Competitors.Pairs.Peers
Quality Drivers Pages (5 to 7).Business.Management.Price
Valuation Pages (7 to 8).Attractiveness.Nominal Rates.Fair value rates
Risk Page (8).Financial.Market
Sentiment Page(9)
Estimates Page (10)
Recommendations Page (11)
Summary StockMarks Ratings for Visa Inc were calculated in relation to the entire population of 3971 United States-listed companies rated today, using a scale from 0 (worst) to 100 (best). For an explanation of each rating, see page 12. Readers should check for the latest news and events not yet reflected in the company financials.
Highlights
Visa Inc is a high quality company with a neutral outlook. Visa Inc has strong business growth and is run by efficient management. The trend in Visa Inc fair value exchange rate against its closest rated-competitor, Mastercard Inc, has been stable over the past 2 weeks. When compared to its second closest peer, Fidelity National Information Services, Visa Inc shows greater undervaluation and is more likely to outperform the market.
Data as of Market Close: 2014-09-17
Summary Due Diligence Report
Will Visa Inc Deliver Long-Term Returns?
StockMarks Ratings
Outlook
Total Quality Business Management Price Liquidity Volatility OutperformanceSMT SMB SMM SMP SML SMV SMO
© 2007-2014 Marques Mendes & Associados Lda (MM&A). All Rights Reserved. Please read disclaimer in page 12.
1
Company Profile
Ticker Company Sector Industry Exchange
V Visa Inc Financials Consumer Financial Services New York Stock Exchange
Current Stock Price: 215.5300 Market Capitalization (M): 134305.3280 Data as of Market Close:
52-Week Range: 180.110 - 235.500 EPS: 8.7780 2014-09-17
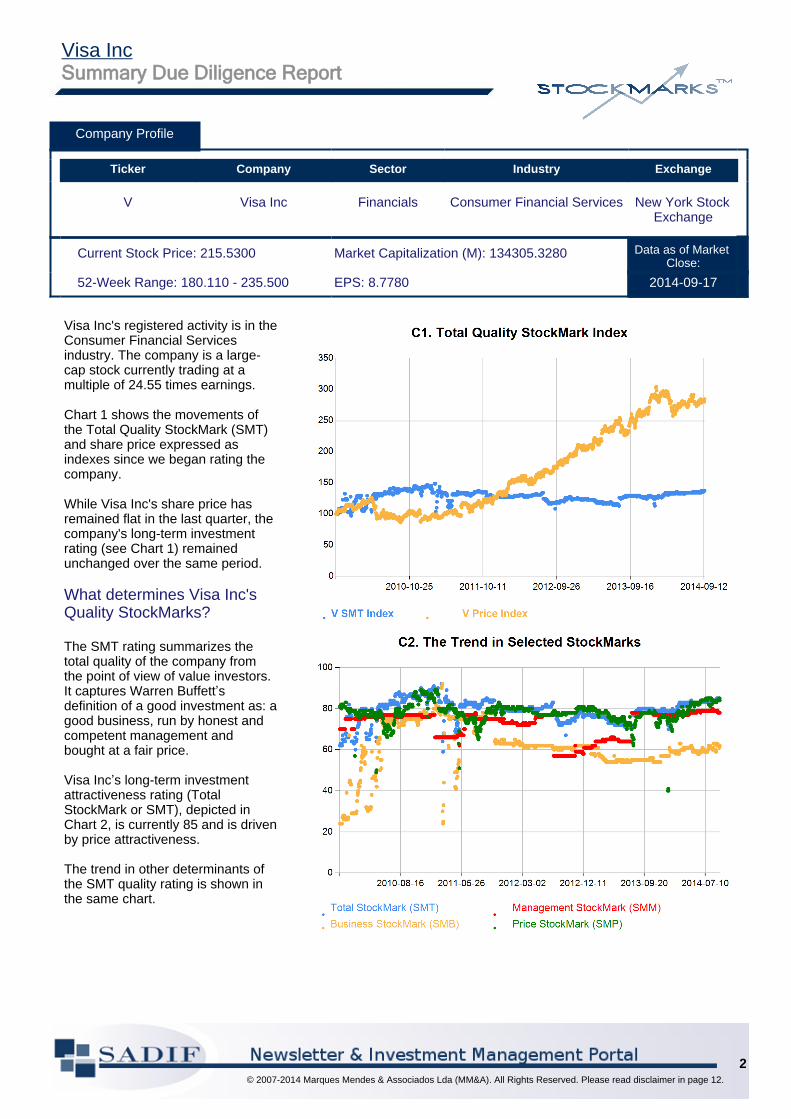
Visa Inc's registered activity is in the Consumer Financial Services industry. The company is a large-cap stock currently trading at a multiple of 24.55 times earnings.
Chart 1 shows the movements of the Total Quality StockMark (SMT) and share price expressed as indexes since we began rating the company.
While Visa Inc's share price has remained flat in the last quarter, the company's long-term investment rating (see Chart 1) remained unchanged over the same period.
What determines Visa Inc's Quality StockMarks?
The SMT rating summarizes the total quality of the company from the point of view of value investors. It captures Warren Buffett’s definition of a good investment as: a good business, run by honest and competent management and bought at a fair price.
Visa Inc’s long-term investment attractiveness rating (Total StockMark or SMT), depicted in Chart 2, is currently 85 and is driven by price attractiveness.
The trend in other determinants of the SMT quality rating is shown in the same chart.
© 2007-2014 Marques Mendes & Associados Lda (MM&A). All Rights Reserved. Please read disclaimer in page 12.
2
Visa IncSummary Due Diligence Report

An important question is whether Visa Inc’s underlying long-term fundamentals justify the stagnation in the company's share price.
We can examine this issue using the StockMarks framework.
Ratings showing a positive trend: Total; Business; Classic
Ratings showing a negative trend:Management; Price; Volatility; Outperformance
Visa Inc currently has an overall quality rating significantly above the average of its sector.
Visa Inc currently has an overall long-term investment attractiveness rating (Total StockMark or SMT) of 85, placing Visa Inc above the SMT average of 50 for United States-listed companies.
This rating ranks Visa Inc third when compared to ten of its closest peers, (selected because of similarity of business, financial and market-positioning factors such as size - see page 5).
How do the Visa Inc's ratings rank among selectedbenchmark groups?
StockMarks™ ratings were calculated in relation to the total of 3971 United States-listed companies rated today.
Although the scale from 0 to 100 is in itself meaningful, for benchmarking purposes we need to define a few relevant reference groups, namely business competitors, correlated stocks and value investing peers.
The top 10 companies used for benchmarking were selected on the basis of similarity.
First, in Chart 3, we compare the company’s trend for each rating, followed by a comparison of the company’s overall long-term investment attractiveness rating (Total StockMark or SMT) in relation to its sector (Chart 4).
© 2007-2014 Marques Mendes & Associados Lda (MM&A). All Rights Reserved. Please read disclaimer in page 12.
3
Visa IncSummary Due Diligence Report

To quickly assess Visa Inc’s relative position the following tables show the ratings of similar companies for these benchmark groups.
Visa Inc’s best rank among competitors is for the rating.
The closest competitor, Mastercard Inc, has a similarity index of 100% and a market share of 10.09% compared to Visa Inc’s market share of 14.64% (See Table 1).
Visa Inc’s competitors were selected based on the registration industry, total revenue and market capitalization among rated companies (these do not include non-listed companies and foreign competitors, which may be more significant).
Similarly, we calculated the industry market share only in relation to rated companies. Therefore, a 100% market share does not mean that the company has no competitors in the industry.
Berkshire Hathaway Inc. is the second closest stock for pair trading with a similarity index of 75%, defined on the basis of market correlation, sector and trading volumes (see Table 2).
To assess the recent convergence/divergence trend, readers should use a chart to compare the prices of the chosen pair. SADIF subscribers may draw such charts in the Due Diligence Section.
In general, pair trading requires degrees of similarity above 70%.
The success of pair trading strategies depends on theinvestor’s ability to forecast theconvergence path.
However, convergence itself may only happen if the two companies are not diverging in a fundamental way. Investors can evaluate this possibility by comparing the StockMarks quality ratings shown in the second table below.
T2. Benchmark group: Pair Trading
Ticker Company Name Similarity % SMT SMB SMM SMP
Company V Visa Inc 85 63 78 84
Pair 1 FIS Fidelity National Informati... 83.33 51 49 56 47
Pair 2 BRK.A Berkshire Hathaway Inc. 75.0 60 54 57 57
Pair 3 ASPS Altisource Portfolio Soluti... 75.0 93 80 77 83
Pair 4 CACC Credit Acceptance Corp. 75.0 83 68 69 80
Pair 5 FFNM First Federal of Nrthrn Mic... 66.67 23 24 49 30
Pair 6 BNCL Beneficial Mutual Bancorp Inc 66.67 32 25 50 60
Pair 7 LSBK Lake Shore Bancorp, Inc. 66.67 36 37 51 45
Pair 8 ESSA ESSA Bancorp, Inc. 66.67 41 42 55 41
Pair 9 UBNK United Financial Bancorp Inc 66.67 41 41 49 51
Pair 10 CFFI C&F Financial Corp 66.67 42 47 51 41
In relation to its highest correlated stocks (for pair trading) Visa Inc’s best rank is first for the Price Attractiveness (SMP) rating.
However, to assess pair trading convergence it is also important to consider Visa Inc’s worst ranking, which is third for the Business Quality (SMB) rating.
T1. Benchmark group: Industry Competitors
Ticker Company Name Similarity %
Industry Share % SMT SMB SMM SMP
Company V Visa Inc 14.64 85 63 78 84
Competitor 1 MA Mastercard Inc 100.0 10.09 86 65 79 85
Competitor 2 GPN Global Payments Inc 75.0 3 75 58 62 79
Competitor 3 DLLR DFC Global Corp 75.0 1.38 39 68 29 31
Competitor 4 NSMNationstar Mortgage Holding... 75.0 2.05 76 85 51 58
Competitor 5 FIS Fidelity National Informati... 75.0 7.45 51 49 56 47
Competitor 6 AXP American Express Company 66.7 43.02 62 47 56 79
Competitor 7 ELLI Ellie Mae Inc 50.0 0.16 83 83 56 83
Competitor 8 TREE Tree.com Inc 50.0 0.16 76 77 47 79
Competitor 9 CPSSConsumer Portfolio Services... 50.0 0.28 36 28 63 33
Competitor 10 WRLD World Acceptance Corp. 50.0 0.75 64 52 70 46
© 2007-2014 Marques Mendes & Associados Lda (MM&A). All Rights Reserved. Please read disclaimer in page 12.
4
Visa IncSummary Due Diligence Report

Likewise, we should note the last-month price divergence, which was 3.9 in relation to its second closest pair.
We selected also a group of investment peers in terms of long-term operational and financial similarities (see Table 3). Because of the stringency of the criteria used, not all companies have a degree of similarity greater than the minimum of 50% recommended for reliable benchmarking.
Among this group shown in Table 3, Visa Inc’s best rank is second for the Price Attractiveness (SMP) rating.
For value driven investors it is important to highlght the position of the company in relation to its closest peers. The radar chart below provides a synopsis of all of Visa Inc’s ratings in comparison to its top two investment peers.
At this stage, some investors may find it useful to read the Due Diligence Reports for these peers or competitors.
The overall conclusion is that Visa Inc is a high quality company with a neutral outlook.
Nevertheless, we need to look further into its determinants by examining each quality rating separately (see Chart 6).
How good is the Visa Inc’s business?
Visa Inc has strong business quality growth.
Visa Inc currently has a Business StockMark (SMB) of 63, indicating that the company's long-term business growth rates are significantly above the sector average of United States-listed companies.
C5. Peer Analysis
T3. Benchmark group: Investment Peers
Ticker Company Name Similarity % SMT SMB SMM SMP
Company V Visa Inc 85 63 78 84
Peer 1 MA Mastercard Inc 73.96 86 65 79 85
Peer 2 FIS Fidelity National Inf... 68.75 51 49 56 47
Peer 3 GPN Global Payments Inc 56.25 75 58 62 79
Peer 4 NSM Nationstar Mortgage H... 56.25 76 85 51 58
Peer 5 CACC Credit Acceptance Corp. 50.0 83 68 69 80
Peer 6 DLLR DFC Global Corp 50.0 39 68 29 31
Peer 7 ASPS Altisource Portfolio ... 47.92 93 80 77 83
Peer 8 NNN National Retail Prope... 46.88 84 66 80 68
Peer 9 AXP American Express Company 43.75 62 47 56 79
Peer 10 XOOM Xoom Corp 43.75 81 86 52 79
© 2007-2014 Marques Mendes & Associados Lda (MM&A). All Rights Reserved. Please read disclaimer in page 12.
5
Visa IncSummary Due Diligence Report
This rating places Visa Inc eighth in terms of growth in relation to its ten closest peers.
The previous chart shows the movements in the SMB and the ratings of the three indicators used in the calculation of the businessrating.
The SMB's recent stagnation was not primarily due to a growth in the rating of the company's sales elasticity.
The sales elasticity indicator compares the long-term revenue growth of the company to other companies in its industry.
The growth in the sales elasticity pushed this indicator below the average, suggesting that Visa Inc is growing at a slower pace than its industry.
Visa Inc’s business quality rating is 0.97 times lower than that of its closest competitor, Mastercard Inc.
Also, sometimes, a small temporary decline or rise may not be attributed to a change in efficiency but is instead the result of large shifts in investment/disinvestment.
Finally, despite the importance of management efficiency, investors should not neglect other more subjective management attributes such as integrity and business savvy, which are beyond the scope of this report.
Is Visa Inc correctly priced?
With the recent stagnation in Visa Inc’s share price, the possibility of the company's shares being overbought increases.
We can assess whether Visa Inc is in fact overvalued by looking at the company's Price Attractiveness StockMark (SMP).
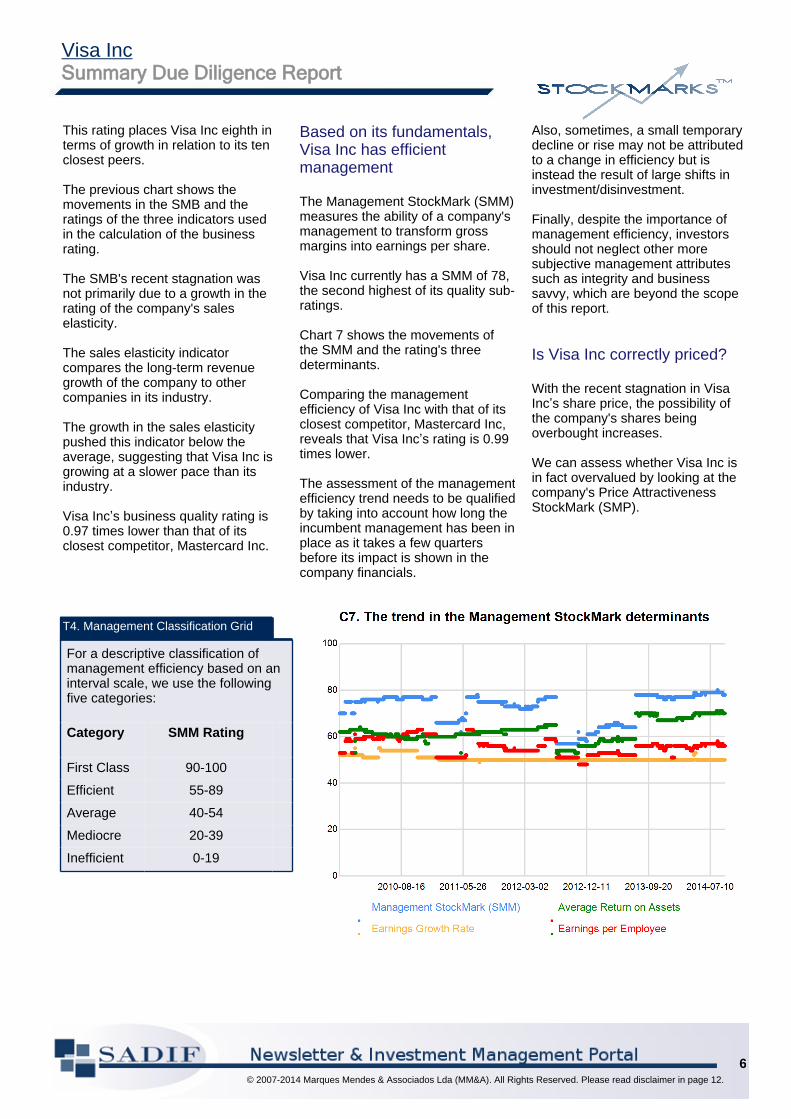
Based on its fundamentals, Visa Inc has efficient management
The Management StockMark (SMM) measures the ability of a company's management to transform gross margins into earnings per share.
Visa Inc currently has a SMM of 78, the second highest of its quality sub-ratings.
Chart 7 shows the movements of the SMM and the rating's three determinants.
Comparing the management efficiency of Visa Inc with that of its closest competitor, Mastercard Inc, reveals that Visa Inc’s rating is 0.99 times lower.
The assessment of the management efficiency trend needs to be qualified by taking into account how long the incumbent management has been in place as it takes a few quarters before its impact is shown in the company financials.
T4. Management Classification Grid
For a descriptive classification of management efficiency based on an interval scale, we use the following five categories:
Category
SMM Rating
First Class 90-100
Efficient 55-89
Average 40-54
Mediocre 20-39
Inefficient 0-19
© 2007-2014 Marques Mendes & Associados Lda (MM&A). All Rights Reserved. Please read disclaimer in page 12.
6
Visa IncSummary Due Diligence Report

The SMP takes into account bothfundamental and technical indicators to arrive at a rating of the attractiveness of a company's stock to long term investors at its current price.
Visa Inc currently has a Price StockMark of 84, indicating that the market is undervaluing Visa Inc’s long-term fundamentals.
Chart 8 shows the SMP and the ratings trend in of some of the company's key price valuation multiples.
Investors should not focus exclusively on market price multiples and earning yields trends. They need to consider the most recent absolute value of the SMP and its determinants together with the SMP trend.
First, to verify if the stock is caught at a stationary level, indicating that it may remain undervalued orovervalued for long periods.
Second, investors should assess if it is diverging or converging in relation to a fair valuation (SMP between 45-55).
On this count, we can observe that Visa Inc is already undervalued and with a trend towards more undervaluation.
To see if this situation is unique to the company, we can check the exchange rate at which the stock is trading in relation to its top competitors and peers.
The fair value exchange rate of Visa Inc’s stock in relation to its closest competitor Mastercard Inc is stable.
The nominal stock exchange rate between two stocks as given by current market prices (shown in Chart 9) may be misleading if markets, as they often do, over-estimate or underestimate the premium/discount relative to intrinsic value.
The valuation of stock-for-stock offers in M&A transactions is quite complex when shareholders of the acquirer and the targetcompany hold significantly different views on the intrinsic value of theircompanies.
© 2007-2014 Marques Mendes & Associados Lda (MM&A). All Rights Reserved. Please read disclaimer in page 12.
7
Visa IncSummary Due Diligence Report

Warren Buffett popularized the idea that many air-for-assets riskyacquisitions take place during bull markets because overvalued acquirer’s can afford to overpay because they are in effect using stock as if it was counterfeit money.
The rates quoted give us the number of benchmark shares that we could buy with one share of Visa Inc.
Therefore, an increase/decrease in the rate of exchange means that Visa Inc is appreciating/depreciating.
Chart 10 shows the evolution of the fair value exchange rates for Visa Inc measured in index form, in relation to some of its benchmark stocks.
The trend in the fair value exchange rates shown above is relevant not only to adjust valuations but also to assess the price outlook for Visa Inc.
For instance, we can observe that in relation to the first competitor, Mastercard Inc, the trend during the last quarter has been towards appreciation.
Unfortunately, the estimation of intrinsic values is a very challenging task.
However, we may minimize the problem and bypass the need to estimate intrinsic values by adjusting the nominal stock exchange rates with our Price Attractiveness StockMark (SMP), which estimates the degree of over/undervaluation at any level of the market premium or discount.
By adjusting the nominal rates by the relative SMPs we obtain the fair value exchange rate.
Current nominal rates vs. fair value stock exchange rates are shown in the previous page (Chart 9).
Risk
The financial risk of Visa Inc’s in terms of liquidity is low, while in terms of market volatility risk it is moderate. The two risk measures are shown in charts 11 and 12.
Financial risk
Leverage is a well-known double-edged sword that amplifies short-term returns and risks. That is the reason why we combine in the StockMarks™ Liquidity Rating (SML) the company capitalization with its current ratio and short-term debt. The SML rating is on a scale of 0 (highest risk) to 100 (lowest risk) and its trend, depicted in Chart 11, is low and was stable in the last quarter.
Currently the SML rating of Visa Inc stands at 79, which compares favorably with the industry median (39.2), and better than that of its first competitor (48.3).
Market risk
The analysis of market risk is done through the Volatility StockMark (SMV) rating.
This rating combines the previous year price variance and price level with long term market correlation in a way that we can interpret it in the usual scale of 0 (worst) to 100 (best).
Comparing the volatility rating of the Visa Inc, which is currently at 36, with its closest competitor, Mastercard Inc, we see that its market risk is 0.91 times higher.
© 2007-2014 Marques Mendes & Associados Lda (MM&A). All Rights Reserved. Please read disclaimer in page 12.
8
Visa IncSummary Due Diligence Report
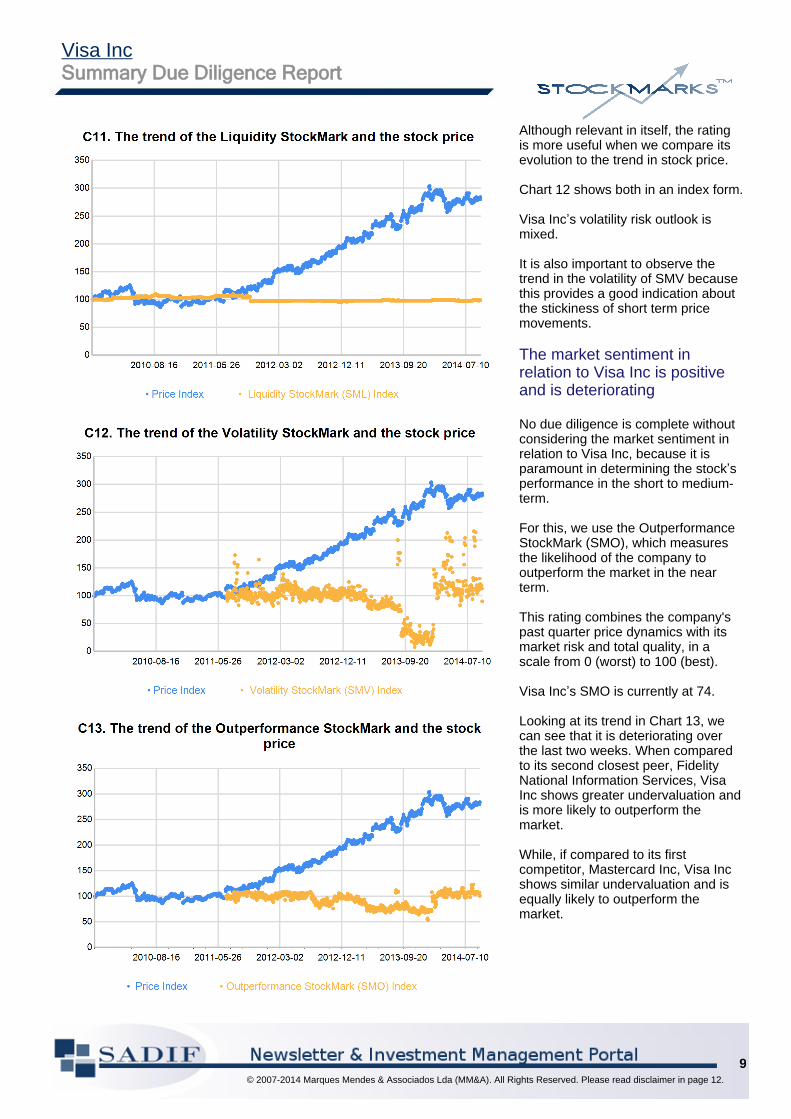
Although relevant in itself, the rating is more useful when we compare its evolution to the trend in stock price.
Chart 12 shows both in an index form.
Visa Inc’s volatility risk outlook is mixed.
It is also important to observe the trend in the volatility of SMV because this provides a good indication about the stickiness of short term price movements.
The market sentiment in relation to Visa Inc is positive and is deteriorating
No due diligence is complete without considering the market sentiment in relation to Visa Inc, because it is paramount in determining the stock’s performance in the short to medium-term.
For this, we use the Outperformance StockMark (SMO), which measures the likelihood of the company to outperform the market in the near term.
This rating combines the company's past quarter price dynamics with its market risk and total quality, in a scale from 0 (worst) to 100 (best).
Visa Inc’s SMO is currently at 74.
Looking at its trend in Chart 13, we can see that it is deteriorating over the last two weeks. When compared to its second closest peer, Fidelity National Information Services, Visa Inc shows greater undervaluation and is more likely to outperform the market.
While, if compared to its first competitor, Mastercard Inc, Visa Inc shows similar undervaluation and is equally likely to outperform the market.
© 2007-2014 Marques Mendes & Associados Lda (MM&A). All Rights Reserved. Please read disclaimer in page 12.
9
Visa IncSummary Due Diligence Report

Estimates
Although it is impossible to reliably predict future share prices, many investors use price targets to gauge investments. Likewise, corporations often manage earnings per share (EPS) to meet analyst consensus estimates for earnings. Forward EPS estimates and market multiples – Price-to-Earnings (PE) and Price-to-Book Value (PBV) - used to calculate our price targets are presented in Tables 6 and 7.
Book Value per Share (BVS)
The trends in Visa Inc’s market and book values (shown in Chart 14), allow investors to gauge how markets value the company's growth. Comparing the two most recent quarters with the previous two, we see that book values have increased by 10.4% while the company's market value has increased by 0.7%. Nevertheless, the gap between the two widened in the last month.
Earnings per Share (EPS)
Over the last two quarters available, Visa Inc's earnings per share improved to 8.78 compared to earlier quarters. As shown in Table 5, this represents an improvement in relation to the average earnings two years ago. Comparing the trend in EPS and the trend in Earnings Multiple shown in Table 7, we observe that they did not move in the same direction.
Our estimation, shown in Chart 15, is that current earnings may increase to 9.333 during the coming year. Our estimate is 3.8% above the current consensus estimate.
Market Multiples
The market currently values Visa Inc at 4.92 times its book value and 24.55 times its earnings. This compares well with the industry medians, which are 2.38 and 11.63 respectively. The six month trend shows that Visa Inc's price-to-book has improved but that price-earnings has deteriorated (Tables 6 and 7). The PBV and PE volatilities over the past three years measured in terms of coefficient of variation were 11.9% and 68.6% respectively.
T6. Quarterly PBV q4
Year Q1 Q2 Q3 Q42014 4.784 4.922 - -
2013 5.499 5.956 4.963 5.178
2012 3.566 4.147 4.718 4.906
Values as calculated on the last day of each quarter
T5. Quarterly EPS q4
Year Q1 Q2 Q3 Q4
2014 8.455 8.778 - -
2013 5.802 5.802 8.778 7.833
2012 4.283 1.013 2.187 2.187
LTM, adjusted for stock splits
T7. Quarterly PE
Year Q1 Q2 Q3 Q42014 24.576 24.553 - -
2013 32.187 35.202 24.755 28.182
2012 29.173 132.024 73.535 77.028
Values as calculated on the last day of each quarter
Price Targets
We use our estimates and outperformance rating (SMO) to derive Visa Inc’s price target. We do not take a view on the market trend. Investors expecting the market to rise (or fall) significantly should increase (decrease) the price target accordingly.
Chart 16 shows that we expect the stock price to appreciate by 73.21 in absolute terms to reach 288.74. And, in relation to its current level (215.5300), we estimate a potential gain of 34% over the coming year. The lower and upper bounds shown suggest good price target reliability.
© 2007-2014 Marques Mendes & Associados Lda (MM&A). All Rights Reserved. Please read disclaimer in page 12.
10
Visa IncSummary Due Diligence Report
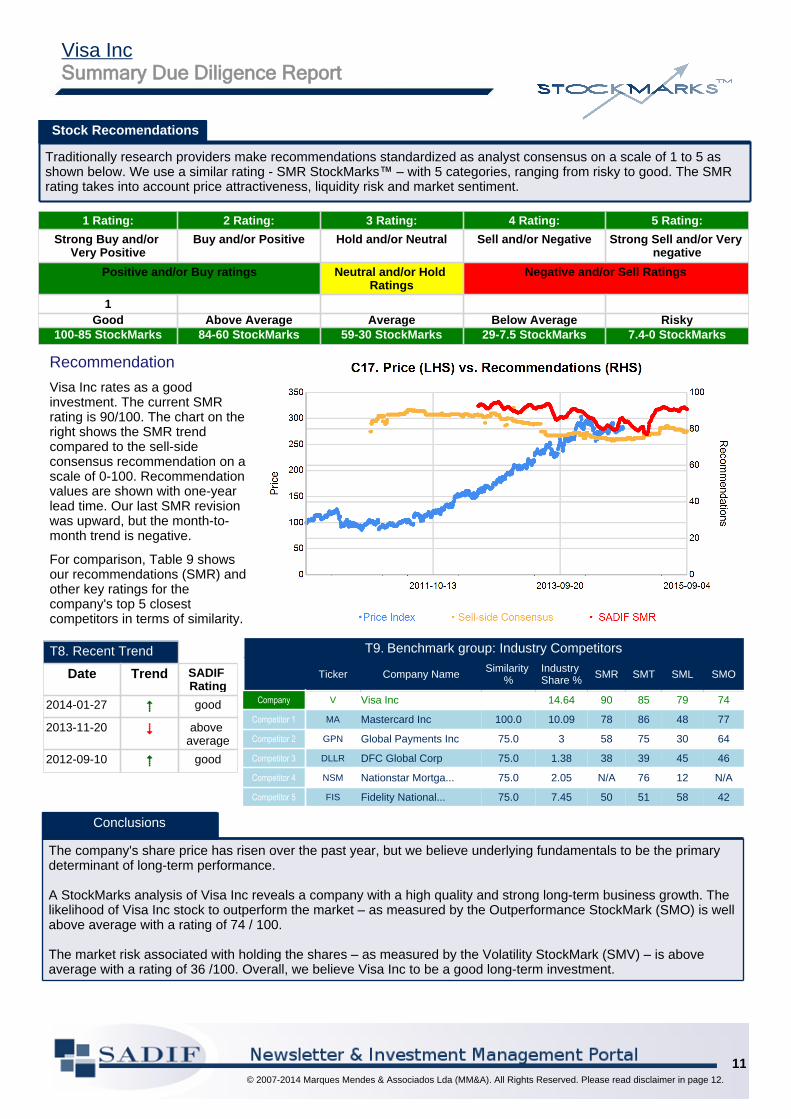
T9. Benchmark group: Industry Competitors
Ticker Company Name Similarity %
Industry Share % SMR SMT SML SMO
Company V Visa Inc 14.64 90 85 79 74
Competitor 1 MA Mastercard Inc 100.0 10.09 78 86 48 77
Competitor 2 GPN Global Payments Inc 75.0 3 58 75 30 64
Competitor 3 DLLR DFC Global Corp 75.0 1.38 38 39 45 46
Competitor 4 NSM Nationstar Mortga... 75.0 2.05 N/A 76 12 N/A
Competitor 5 FIS Fidelity National... 75.0 7.45 50 51 58 42
1 Rating: 2 Rating: 3 Rating: 4 Rating: 5 Rating:
Strong Buy and/or Very Positive
Buy and/or Positive Hold and/or Neutral Sell and/or Negative Strong Sell and/or Very negative
Positive and/or Buy ratings Neutral and/or Hold Ratings
Negative and/or Sell Ratings
1Good Above Average Average Below Average Risky
100-85 StockMarks 84-60 StockMarks 59-30 StockMarks 29-7.5 StockMarks 7.4-0 StockMarks
Recommendation
Visa Inc rates as a good investment. The current SMR rating is 90/100. The chart on the right shows the SMR trend compared to the sell-side consensus recommendation on a scale of 0-100. Recommendation values are shown with one-year lead time. Our last SMR revision was upward, but the month-to-month trend is negative.
For comparison, Table 9 shows our recommendations (SMR) and other key ratings for the company's top 5 closest competitors in terms of similarity.
Stock Recomendations
Traditionally research providers make recommendations standardized as analyst consensus on a scale of 1 to 5 as shown below. We use a similar rating - SMR StockMarks™ – with 5 categories, ranging from risky to good. The SMR rating takes into account price attractiveness, liquidity risk and market sentiment.
T8. Recent Trend
Date Trend SADIF Rating
2014-01-27 5 good
2013-11-20 6 above average
2012-09-10 5 good
Conclusions
The company's share price has risen over the past year, but we believe underlying fundamentals to be the primary determinant of long-term performance.
A StockMarks analysis of Visa Inc reveals a company with a high quality and strong long-term business growth. The likelihood of Visa Inc stock to outperform the market – as measured by the Outperformance StockMark (SMO) is well above average with a rating of 74 / 100.
The market risk associated with holding the shares – as measured by the Volatility StockMark (SMV) – is above average with a rating of 36 /100. Overall, we believe Visa Inc to be a good long-term investment.
© 2007-2014 Marques Mendes & Associados Lda (MM&A). All Rights Reserved. Please read disclaimer in page 12.
11
Visa IncSummary Due Diligence Report

The StockMarks™ Ratings
Classical StockMark (SMC)Short-medium term attractiveness rating combining SMT and SMP.
Total Quality StockMark (SMT)The overall long-term investment-attractiveness of a company based on a combined three dimensional analysis of three sub-ratings: Business, Management and Price.
Business StockMark (SMB)A company's business quality based on variables including: operating margin, sales elasticity and sales growth rate.
Price StockMark (SMP)A company's price quality rating in terms of undervaluation reflected by valuation measures such as price to book, price to sales per share and price to earnings per share.
Management StockMark (SMM)A company's management quality based on the following key indicators: return on assets, earnings per employee and the earnings growth rate.
Outperformance StockMark (SMO)The likelihood of a stock to outperform the market based on the valuation of the company, the SMV and the SMT.
Volatility StockMark (SMV)Risk of the stock based on numerous historical analyses of stock price and market correlation.
© 2007-2014 Marques Mendes & Associados Lda (MM&A). All Rights Reserved. This report is for information purposes only and is not a solicitation or advice to buy or sell any security. The data contained within this report is not warranted to be accurate or complete. This report is only intended as a summary of SADIF's stock ratings and not a recommendation for stock purchase or sale. Redistribution of this report without explicit permission is strictly prohibited. All logos are the copyright property of their respective companies and are used here only to aid the reader in identification of the subject of the article. The author of this article does not hold a position in any of the companies featured within this report.
Liquidity StockMark™ (SML)Except for banks, a company’s liquidity safety is measured based on its capitalization, current ratio and the relative amount of short debt in relation to medium and long term debt.
Recommendation StockMark (SMR)A stock recommendation based on price attractiveness, liquidity risk and market sentiment.
12Marques Mendes & Associados Lda. Rua Domingos F. Pinto Basto, 21 – 3830-176 Ilhavo, Portugal,
Ph: (+ 351)234 296 930 Email: [email protected]
Visa IncSummary Due Diligence Report