william blair sicav annual report and
TRANSCRIPT

William Blair SICAVAnnual Report andAudited Financial Statements
December 31, 2018
Société d’Investissement à Capital Variable
R.C.S. Luxembourg B - 98.806


December 31, 2018 Wi l l iam Bla ir S ICAV 3
Table of Contents
No subscription can be received on the basis of financial reports alone. Subscriptions are only valid if made on the basis of the current full Prospectus and KIID (“Key Investor Information Document”), supplemented by the latest Annual Report or the most recent Annual Report.
Board of Directors . . . . . . . . . . . . . . . . . . . . . . . . . . . . . . . . . . . . . . . . . . . . . . . . . . . . . . . . . . . . . . . . . . . . . . . . . . . . . . . . . . . . . . . . . . . . . . . . . . . . . . . . . . . . . . . . . . . . . . . . . . 4
Organisation of the SICAV . . . . . . . . . . . . . . . . . . . . . . . . . . . . . . . . . . . . . . . . . . . . . . . . . . . . . . . . . . . . . . . . . . . . . . . . . . . . . . . . . . . . . . . . . . . . . . . . . . . . . . . . . . . . . . . . . 4
Fund Managers’ Reports . . . . . . . . . . . . . . . . . . . . . . . . . . . . . . . . . . . . . . . . . . . . . . . . . . . . . . . . . . . . . . . . . . . . . . . . . . . . . . . . . . . . . . . . . . . . . . . . . . . . . . . . . . . . . . . . . . . 5
Statements of Assets and Liabilities . . . . . . . . . . . . . . . . . . . . . . . . . . . . . . . . . . . . . . . . . . . . . . . . . . . . . . . . . . . . . . . . . . . . . . . . . . . . . . . . . . . . . . . . . . . . . . . . . . . . . . 12
Statistical Information . . . . . . . . . . . . . . . . . . . . . . . . . . . . . . . . . . . . . . . . . . . . . . . . . . . . . . . . . . . . . . . . . . . . . . . . . . . . . . . . . . . . . . . . . . . . . . . . . . . . . . . . . . . . . . . . . . . . . . 18
Statements of Operations and Changes in Net Assets . . . . . . . . . . . . . . . . . . . . . . . . . . . . . . . . . . . . . . . . . . . . . . . . . . . . . . . . . . . . . . . . . . . . . . . . . . . . . . . . 22
Statements of Changes in Shares Outstanding . . . . . . . . . . . . . . . . . . . . . . . . . . . . . . . . . . . . . . . . . . . . . . . . . . . . . . . . . . . . . . . . . . . . . . . . . . . . . . . . . . . . . . . . . 25
Portfolios of Investments . . . . . . . . . . . . . . . . . . . . . . . . . . . . . . . . . . . . . . . . . . . . . . . . . . . . . . . . . . . . . . . . . . . . . . . . . . . . . . . . . . . . . . . . . . . . . . . . . . . . . . . . . . . . . . . . . . 27
William Blair SICAV – U.S. All Cap Growth Fund . . . . . . . . . . . . . . . . . . . . . . . . . . . . . . . . . . . . . . . . . . . . . . . . . . . . . . . . . . . . . . . . . . . . . . . . . . . . . . . 27
William Blair SICAV – U.S. Small-Mid Cap Growth Fund . . . . . . . . . . . . . . . . . . . . . . . . . . . . . . . . . . . . . . . . . . . . . . . . . . . . . . . . . . . . . . . . . . . . . . 29
William Blair SICAV – Global Leaders Fund . . . . . . . . . . . . . . . . . . . . . . . . . . . . . . . . . . . . . . . . . . . . . . . . . . . . . . . . . . . . . . . . . . . . . . . . . . . . . . . . . . . . . 32
William Blair SICAV – Emerging Markets Growth Fund . . . . . . . . . . . . . . . . . . . . . . . . . . . . . . . . . . . . . . . . . . . . . . . . . . . . . . . . . . . . . . . . . . . . . . . 35
William Blair SICAV – Emerging Markets Leaders Fund . . . . . . . . . . . . . . . . . . . . . . . . . . . . . . . . . . . . . . . . . . . . . . . . . . . . . . . . . . . . . . . . . . . . . . . 40
William Blair SICAV – Emerging Markets Small Cap Growth Fund . . . . . . . . . . . . . . . . . . . . . . . . . . . . . . . . . . . . . . . . . . . . . . . . . . . . . . . . . . 43
William Blair SICAV – Dynamic Diversified Allocation Fund . . . . . . . . . . . . . . . . . . . . . . . . . . . . . . . . . . . . . . . . . . . . . . . . . . . . . . . . . . . . . . . . . . 48
Notes to the Financial Statements . . . . . . . . . . . . . . . . . . . . . . . . . . . . . . . . . . . . . . . . . . . . . . . . . . . . . . . . . . . . . . . . . . . . . . . . . . . . . . . . . . . . . . . . . . . . . . . . . . . . . . . 62
Independent Auditor’s Report . . . . . . . . . . . . . . . . . . . . . . . . . . . . . . . . . . . . . . . . . . . . . . . . . . . . . . . . . . . . . . . . . . . . . . . . . . . . . . . . . . . . . . . . . . . . . . . . . . . . . . . . . . . . 78
General Information . . . . . . . . . . . . . . . . . . . . . . . . . . . . . . . . . . . . . . . . . . . . . . . . . . . . . . . . . . . . . . . . . . . . . . . . . . . . . . . . . . . . . . . . . . . . . . . . . . . . . . . . . . . . . . . . . . . . . . . . 80

4 Annual Report December 31, 2018
Board of Directors
ChairmanRichard W. SmirlPartner William Blair Investment Management, LLC Limited Partner 150 North Riverside PlazaChicago, IL 60606 United States of America (Until January 8, 2018)
Stephanie G. Braming Partner William Blair Investment Management, LLC Limited Partner 150 North Riverside Plaza Chicago, IL 60606 United States of America(Since January 9, 2018)
DirectorsArthur J. SimonPartnerWilliam Blair & Company, LLCLimited Partner150 North Riverside PlazaChicago, IL 60606United States of America
Thomas RossPartner William Blair International, Ltd. The Broadgate Tower 20 Primrose Street London EC2A 2EW United Kingdom
Management and Administration
Management CompanyFundRock Management Company S.A.H2O building, 33, rue de GasperichL-5826 HesperangeGrand Duchy of Luxembourg
Investment ManagerWilliam Blair Investment Management, LLC150 North Riverside PlazaChicago, IL 60606United States of America
Depositary, Paying Agent, Central Administration Agent (including Domiciliary Agent), Registrar and Transfer AgentCitibank Europe plc, Luxembourg Branch 31, Z.A. BourmichtL-8070 BertrangeGrand Duchy of Luxembourg
Independent AuditorErnst & Young S.A.35E avenue John F. KennedyL-1855 LuxembourgGrand Duchy of Luxembourg
Legal AdvisorClifford Chance10, boulevard G.D. CharlotteL-1330 LuxembourgGrand Duchy of Luxembourg(Until July 25, 2018)
Dechert (Luxembourg) LLP 1, Allée Scheffer, B.P. 709, L-2017 Luxembourg Grand-Duchy of Luxembourg(Since July 26, 2018)
Paying and Information AgentsA list of Paying and Information Agents is to be found on page 81.
Registered OfficeCitibank Europe plc, Luxembourg Branch 31, Z.A. BourmichtL-8070 BertrangeGrand Duchy of Luxembourg
Organisation of the SICAV

December 31, 2018 Wi l l iam Bla ir S ICAV 5
Fund Managers’ Reports
William Blair SICAV – U.S. All Cap Growth Fund
The William Blair SICAV – U.S. All Cap Growth Fund (Class D USD shares) posted a 4.25% increase, net of fees, for the twelve months ended 31 December 2018. By comparison, the Fund’s benchmark index, the Russell 3000® Growth Index (the “Index”), decreased 2.12%.
For the year, the Fund materially outperformed the Index driven by both positive stock selection and a style tailwind. Stock selection was positive across many sectors, but was most pronounced in Information Technology and Health Care. Within Information Technology, a top contributor to the Fund’s performance was Red Hat, Inc., which announced in the fourth quarter that it was being acquired by International Business Machines Corporation (IBM). Mastercard, Inc. and Microsoft Corporation were also top contributors within Information Technology. Within Health Care, Veeva Systems, Inc., a cloud-based software and data solutions provider primarily for the life sciences industry, was the top contributor due to accelerated growth within its content management software solution called “Vault,” an increasingly significant source of revenue for the company. Animal healthcare company Zoetis, Inc. was also a top contributor within the sector. From a style perspective, the Fund’s higher valuation exposure, driven by a bias for companies with higher and more sustainable growth, was a tailwind. In terms of detractors, BWX Technologies, Inc., the sole-source provider of nuclear propulsion systems for the U.S. Navy, was the top detractor for the year after the company disclosed new information that indicated a materially longer build time for naval nuclear power units than was previously appreciated by investors broadly. Weight Watchers International, Inc., a global wellness and weight management company, was also a top detractor primarily due to lower-than-expected revenue growth late in the year. Other top detractors were Hilton Grand Vacations, Inc. (Consumer Discretionary), Monster Beverage Corporation (Consumer Staples) and Raytheon Co. (Industrials).
William Blair Investment Management, LLC
December 31, 2018

Fund Managers’ Reports
(continued)
6 Annual Report December 31, 2018
William Blair SICAV – U.S. Small-Mid Cap Growth Fund
The William Blair SICAV – US Small-Mid Cap Growth Fund (Class I USD shares) posted a 2.84% decrease, net of fees, for the twelve months ended 31 December 2018. By comparison, the Fund’s benchmark index, the Russell 2500™ Growth Index (the “Index”), decreased 7.47%.
For the year, the Fund materially outperformed the Index driven by both strong stock selection and a style tailwind. Positive stock selection was most pronounced in Health Care and Industrials, and top individual contributors to the Fund’s performance for the period were Health Care holdings DexCom, Inc. and ABIOMED, Inc. Shares of DexCom, a medical device company focused on continuous glucose monitoring (CGM), advanced on strong demand for its best-in-class CGM devices. ABIOMED, which develops, manufactures and markets advanced medical technologies designed to assist or replace the pumping function of a failing heart, outperformed as its Impella heart pump is becoming the standard of care for acute heart failure patients. Other notable contributors to relative returns during the period were Health Care holdings Glaukos Corporation and Veeva Systems, Inc. and Consumer Discretionary holding Domino’s Pizza, Inc. From a style perspective, the Fund’s bias in favor of companies with sustainable growth was a tailwind. This dynamic was most evident in the first quarter as investors digested the potential for inflation-related cost pressures on businesses and our portfolio of companies with unique value propositions and above average pricing flexibility was rewarded. In addition, the Fund’s larger cap bias relative to the Index was a tailwind as stocks in the larger end of our universe outperformed, most notably in the third quarter. In terms of 2018 detractors, stock-specific weakness in Information Technology, including Rogers Corporation and Coherent, Inc., and Financials, including Bank OZK and Encore Capital Group, Inc., dampened relative returns. Shares of advanced materials company Rogers Corporation declined during the period as operational challenges, strong product demand against limited manufacturing capacity and rising raw material costs dampened margins. Bank OZK, a regional bank with a specialized commercial real estate team, underperformed in part due to increasing construction costs and charge-offs related to two of its real estate loans. Also among top detractors for the year was Industrials holding BWX Technologies, Inc., the sole-source provider of nuclear propulsion systems for the U.S. Navy, which declined after the company disclosed new information that indicated a materially longer build time for Naval nuclear power units than was previously appreciated by investors broadly.
William Blair Investment Management, LLC
December 31, 2018

Fund Managers’ Reports
(continued)
December 31, 2018 Wi l l iam Bla ir S ICAV 7
William Blair SICAV – Global Leaders Fund
The William Blair SICAV – Global Leaders Fund (Class I USD shares) posted an 8.70% decrease, net of fees, for the twelve months ended 31 December 2018. By comparison, the Fund’s benchmark index, the MSCI All Country World IMI Index (net) (the “Index”), decreased 10.08%.
Calendar year outperformance versus the Index was primarily driven by positive stock selection across most sectors. The Materials, Health Care and Consumer Staples sectors were the largest sources of relative return from a stock selection perspective. Within Materials, Nissan Chemical Corp., the innovative Japanese producer of niche chemicals for the electronics, agriculture, and pharmaceutical industries, contributed to the Fund’s results as the company continued to post solid growth in the context of the challenging smartphone/display market. Nissan Chemical has a leading position in its core products and a track record of innovation supported by its commitment to high levels of research and development. Within Health Care, UnitedHealth Group, Inc., the best-of-breed operator in the U.S.-managed care industry, was an additional source of the Fund’s outperformance as the company’s stable earnings profile was rewarded in a difficult market environment. Within the Consumer Staples sector, The Estee Lauder Cos., Inc. increased the Fund’s relative returns. We expect the company to benefit from the rapid growth of newly acquired brands, the continued expansion in specialty retail and online channels, and strong growth from China and travel retail.
Partially offsetting these effects was an underweight in the Consumer Staples and Utilities sectors, coupled with negative stock selection within the Energy sector. Within Energy, Halliburton Company’s share price declined along with the price of oil, and the Fund exited this position during the fourth quarter in order to reduce oil and gas exposure.
William Blair Investment Management, LLC
December 31, 2018

Fund Managers’ Reports
(continued)
8 Annual Report December 31, 2018
William Blair SICAV – Emerging Markets Growth Fund
The William Blair SICAV – Emerging Markets Growth Fund (Class I USD shares) posted a 22.48% decrease, net of fees, for the twelve months ended 31 December 2018. By comparison, the Fund’s benchmark index, the MSCI Emerging Markets IMI Index (net) (the “Index”), decreased 15.05%.
Calendar year underperformance versus the Index was partly driven by style headwinds as low valuation stocks outperformed growth-oriented stocks, especially in the second half of the year. From a sector perspective, the Energy, Consumer Discretionary and Information Technology sectors were the most notable detractors from the Fund’s performance. Stock selection detracted from the Fund’s performance in Energy mainly due to outperforming companies in the Index that the Fund did not own. Consumer Discretionary and Information Technology detracted from performance due to the Fund’s overweightings to, and stock selection within, those sectors. Within Consumer Discretionary, Maruti Suzuki India, Ltd., the Indian car manufacturer, underperformed as the company experienced weakening demand and lower margins due to higher costs, promotional discounts and currency headwinds. Within the Information Technology sector, Sunny Optical Technology Group Co., Ltd., the Chinese camera lens and modules manufacturer, declined on the back of weak operating trends and broad market rotation away from higher valuation technology stocks.
Partially offsetting these effects was an overweight to the Financials sector and positive stock selection within the Health Care sector. Within Health Care, CSPC Pharmaceutical Group, Ltd. contributed to the Fund’s relative results. The share price rallied in the first half of the year fueled by the company’s strong operating momentum, but lost ground in the second half amid regulatory headwinds in the form of government mandated drug price cuts.
William Blair Investment Management, LLC
December 31, 2018

Fund Managers’ Reports
(continued)
December 31, 2018 Wi l l iam Bla ir S ICAV 9
William Blair SICAV – Emerging Markets Leaders Fund
The William Blair SICAV – Emerging Markets Leaders Fund (Class I USD shares) posted a 17.84% decrease, net of fees, for the twelve months ended 31 December 2018. By comparison, the Fund’s benchmark index, the MSCI Emerging Markets Index (net) decreased 14.58%.
Calendar year underperformance versus the Index was driven by style headwinds, as low valuation stocks outperformed growth-oriented stocks, especially in the second half of the year. From a sector perspective, the Fund’s relative underperformance was driven by negative results in the Energy, Consumer Staples and Industrials sectors. Within Energy, stock selection detracted from performance as Argentine oil company YPF S.A. declined amid weak volume growth, broad Argentine market weakness and currency depreciation. Within Consumer Staples, both sector overweighting and stock selection detracted from relative returns. Raia Drogasil, S.A., the Brazilian drugstore chain, weighed on performance as earnings trailed market expectations. Within Industrials, Turkish industrial conglomerate KOC Holdings A.S. was a drag on performance, amid the weak Turkish equity market and lira currency depreciation. Partially offsetting these effects was positive stock selection within the Financials sector. HDFC Bank, Ltd. was a top contributor to performance within Financials. HDFC is the leading private sector bank in India. It reported solid fiscal second quarter results in October, supporting the share price, which advanced 9.8% in USD terms during the fourth quarter. Pre-tax profit increased 21% year-over-year, which was in line with consensus estimates and driven by strength in key metrics: credit quality, top line growth, and lower expenses. We believe HDFC is well positioned to continue to grow profitability given its strong liquidity, recent capital raise and underwriting and marketing prowess.
William Blair Investment Management, LLC
December 31, 2018

Fund Managers’ Reports
(continued)
10 Annual Report December 31, 2018
William Blair SICAV – Emerging Markets Small Cap Growth Fund
The William Blair SICAV – Emerging Markets Small Cap Growth Fund (Class I USD shares) posted a 24.51% decrease, net of fees, for the twelve months ended 31 December 2018. By comparison, the Fund’s benchmark index, the MSCI Emerging Markets Small Cap Index (net) (the “Index”), decreased 18.59%.
Calendar year underperformance versus the Index was partly driven by style headwinds, as low valuation stocks outperformed growth-oriented stocks, especially in the second half of the year. From a sector perspective, the Consumer Discretionary, Financials and Real Estate sectors were the largest detractors from the Fund’s relative returns. Within the Consumer Discretionary sector, negative stock selection for the overall sector and the Fund’s auto components overweighting early in the year amid weak auto demand and trade war dynamics hindered performance. Within Financials, the Fund’s overweighting to banks and negative overall stock selection also dampened relative performance. In particular, the Argentine bank, Grupo Supervielle S.A., weighed on results due to the sharp Argentine peso depreciation, broad market weakness and a deteriorated fundamental outlook. Within Real Estate, Chinese real estate companies KWG Property Holdings Limited and CIFI Holdings (Group) Co. Ltd detracted from performance due to weak demand, a negative pricing environment and regulatory headwinds.
Partially offsetting these effects was strong relative performance in the Information Technology and Consumer Staples sectors. Within Consumer Staples, shares of TCI Co., Ltd., a Taiwanese original design manufacturer of health food and skincare products, advanced significantly during the year on accelerating operating momentum, fueled by product innovation and growth potential in China. Within Information Technology, Yageo Corporation, the Taiwanese passive components manufacturer, propelled relative results. Yageo’s share price rallied in the first part of the year amid favorable industry dynamics, including tight supply and strong demand in passive components.
William Blair Investment Management, LLC
December 31, 2018

Fund Managers’ Reports
(continued)
December 31, 2018 Wi l l iam Bla ir S ICAV 11
William Blair SICAV – Dynamic Diversified Allocation Fund
The William Blair SICAV – Dynamic Diversified Allocation Fund (Class I USD shares) posted a return of 0.07%, net of fees, during the twelve-month period ended 31 December 2018.
The Fund’s market strategy detracted value while its currency strategy and security selection both added value during this time period. Long exposures to global equities detracted from performance, with long exposure to developed Europe equities the biggest detractor along with sector positioning within U.S. equities. Relative market exposure within emerging market equities added value, specifically long exposure to Brazil equities and short exposure to Mexico and South Africa equities. Within fixed income, long exposure to U.S. rates added value. Within currency, short exposure to the euro and New Zealand dollar and long exposure to the Mexican peso added value, while long exposures to the Turkish lira, British pound, and Russian ruble detracted. Security selection was positive for the year, with positive contribution from International Leaders, U.S. All Cap Growth, U.S. Small-Mid Cap Growth, and U.S. Small Cap Growth strategies. The Fund’s allocation to the U.S. Small Cap Value strategy detracted during the year.
Global risk assets are mildly attractive in aggregate, however the near-term macro environment presents thematic and geopolitical headwinds, dampening their attractiveness. The fund remains cautiously positioned in respect of systematic market exposure (beta) and overall strategy risk. Instead, the fund is taking more risk in relative market opportunities and in currencies.
Market strategy is moderately long of equities with long exposure to emerging markets, U.S., and developed Europe, while maintaining short positions in, Canadian, and Japanese markets. The market strategy is also slightly long of fixed income securities, with long exposures mostly within the U.S.
Within currencies, the Fund’s strategy remains long of emerging market currencies such as the Philippine peso, Turkish lira, and Indian rupee, and the largest short exposures are in the Thai baht, Swiss franc, and U.S. dollar.
William Blair Investment Management, LLC
December 31, 2018
The accompanying notes form an integral part of the financial statements.
12 Annual Report December 31, 2018
Note
William Blair SICAV – U.S. All Cap
Growth Fund US$
William Blair SICAV – U.S. Small-Mid Cap
Growth Fund US$
William Blair SICAV – Global Leaders
Fund US$
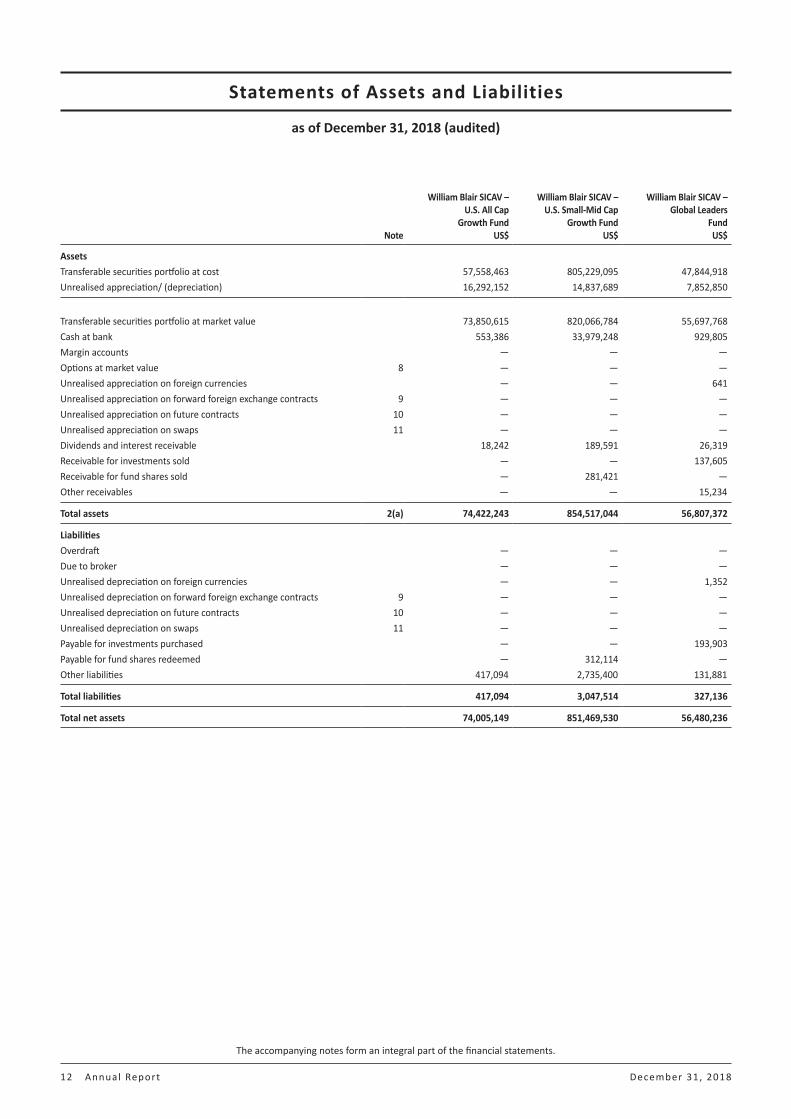
AssetsTransferable securities portfolio at cost 57,558,463 805,229,095 47,844,918 Unrealised appreciation/ (depreciation) 16,292,152 14,837,689 7,852,850
Transferable securities portfolio at market value 73,850,615 820,066,784 55,697,768 Cash at bank 553,386 33,979,248 929,805 Margin accounts — — — Options at market value 8 — — — Unrealised appreciation on foreign currencies — — 641 Unrealised appreciation on forward foreign exchange contracts 9 — — — Unrealised appreciation on future contracts 10 — — — Unrealised appreciation on swaps 11 — — — Dividends and interest receivable 18,242 189,591 26,319 Receivable for investments sold — — 137,605 Receivable for fund shares sold — 281,421 — Other receivables — — 15,234
Total assets 2(a) 74,422,243 854,517,044 56,807,372
LiabilitiesOverdraft — — — Due to broker — — — Unrealised depreciation on foreign currencies — — 1,352 Unrealised depreciation on forward foreign exchange contracts 9 — — — Unrealised depreciation on future contracts 10 — — — Unrealised depreciation on swaps 11 — — — Payable for investments purchased — — 193,903 Payable for fund shares redeemed — 312,114 — Other liabilities 417,094 2,735,400 131,881
Total liabilities 417,094 3,047,514 327,136
Total net assets 74,005,149 851,469,530 56,480,236
Statements of Assets and Liabilities
as of December 31, 2018 (audited)

Statements of Assets and Liabilities
as of December 31, 2018 (audited) (continued)
The accompanying notes form an integral part of the financial statements.
December 31, 2018 Wi l l iam Bla ir S ICAV 13
Note
William Blair SICAV – U.S. All Cap
Growth Fund US$
William Blair SICAV – U.S. Small-Mid Cap
Growth Fund US$
William Blair SICAV – Global Leaders
Fund US$
Net asset value per Class A USD – US$85.32 –Number of shares outstanding – 100 –
Net asset value per Class B H EUR – – –Number of shares outstanding – – –
Net asset value per Class I USD – US$366.21 US$140.35Number of shares outstanding – 285,752 60,769
Net asset value per Class I EUR – – €172.46Number of shares outstanding – – 150
Net asset value per Class I H EUR – – –Number of shares outstanding – – –
Net asset value per Class I H GBP – – –Number of shares outstanding – – –
Net asset value per Class I H SEK – – –Number of shares outstanding – – –
Net asset value per Class I I GBP – £91.01 –Number of shares outstanding – 1,286 –
Net asset value per Class D USD US$251.56 – –Number of shares outstanding 294,105 – –
Net asset value per Class J USD US$99.75 US$157.09 US$129.09Number of shares outstanding 100 1,656,293 71,449
Net asset value per Class J EUR – – €99.39Number of shares outstanding – – 88
Net asset value per Class J I GBP – £162.47 –Number of shares outstanding – 1,303,475 –
Net asset value per Class J H CHF – – –Number of shares outstanding – – –
Net asset value per Class J H EUR – – –Number of shares outstanding – – –
Net asset value per Class J H GBP – – –Number of shares outstanding – – –
Net asset value per Class J H SEK – – –Number of shares outstanding – – –
Net asset value per Class J H JPY – – –Number of shares outstanding – – –
Net asset value per Class R USD US$99.75 US$85.51 US$84.96Number of shares outstanding 100 44,735 500
Net asset value per Class R EUR – – €99.39Number of shares outstanding – – 88
Net asset value per Class R H EUR – – –Number of shares outstanding – – –
Net asset value per Class Z USD – US$294.81 US$119.32Number of shares outstanding – 721,597 300,000
Net asset value per Class Z AUD – – AU$178.85Number of shares outstanding – – 22,543
Net asset value per Class Z H AUD – – –Number of shares outstanding – – –
Statements of Assets and Liabilities
as of December 31, 2018 (audited) (continued)
The accompanying notes form an integral part of the financial statements.
14 Annual Report December 31, 2018
Note
William Blair SICAV – Emerging Markets
Growth Fund US$
William Blair SICAV – Emerging Markets
Leaders Fund US$
William Blair SICAV – Emerging Markets
Small Cap Growth Fund US$
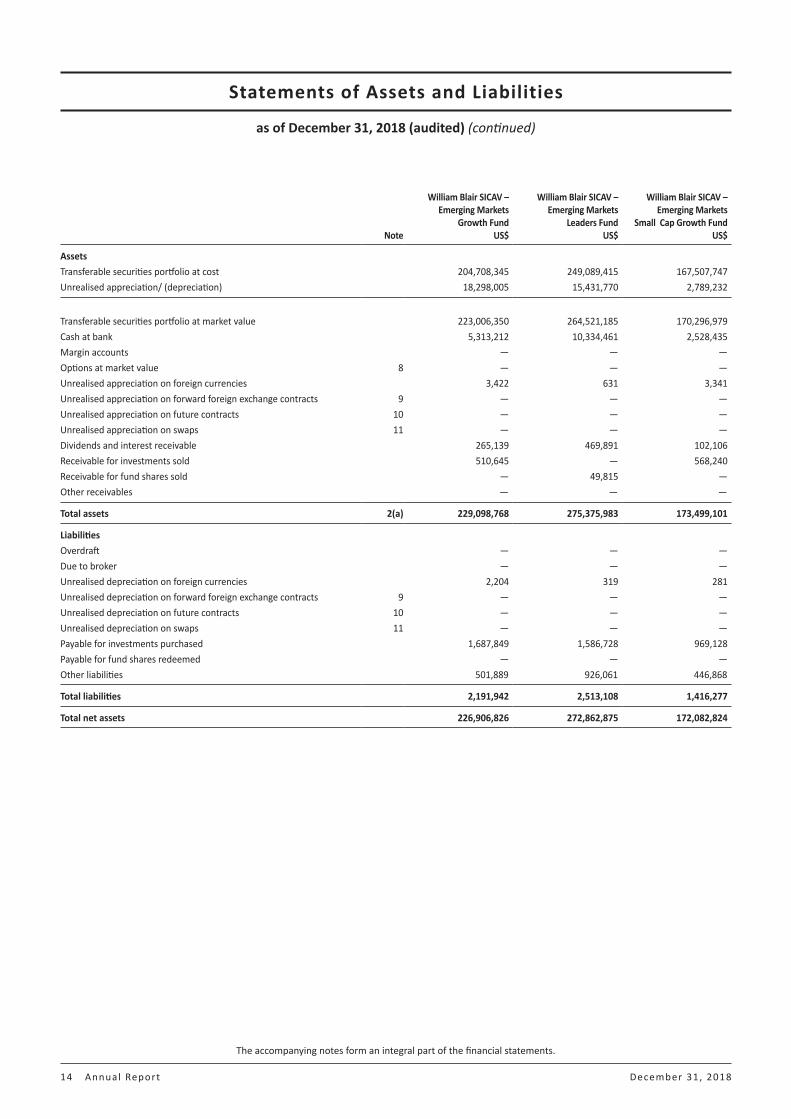
AssetsTransferable securities portfolio at cost 204,708,345 249,089,415 167,507,747 Unrealised appreciation/ (depreciation) 18,298,005 15,431,770 2,789,232
Transferable securities portfolio at market value 223,006,350 264,521,185 170,296,979 Cash at bank 5,313,212 10,334,461 2,528,435 Margin accounts — — — Options at market value 8 — — — Unrealised appreciation on foreign currencies 3,422 631 3,341 Unrealised appreciation on forward foreign exchange contracts 9 — — — Unrealised appreciation on future contracts 10 — — — Unrealised appreciation on swaps 11 — — — Dividends and interest receivable 265,139 469,891 102,106 Receivable for investments sold 510,645 — 568,240 Receivable for fund shares sold — 49,815 — Other receivables — — —
Total assets 2(a) 229,098,768 275,375,983 173,499,101
LiabilitiesOverdraft — — — Due to broker — — — Unrealised depreciation on foreign currencies 2,204 319 281 Unrealised depreciation on forward foreign exchange contracts 9 — — — Unrealised depreciation on future contracts 10 — — — Unrealised depreciation on swaps 11 — — — Payable for investments purchased 1,687,849 1,586,728 969,128 Payable for fund shares redeemed — — — Other liabilities 501,889 926,061 446,868
Total liabilities 2,191,942 2,513,108 1,416,277
Total net assets 226,906,826 272,862,875 172,082,824

Statements of Assets and Liabilities
as of December 31, 2018 (audited) (continued)
The accompanying notes form an integral part of the financial statements.
December 31, 2018 Wi l l iam Bla ir S ICAV 15
Note
William Blair SICAV – Emerging Markets
Growth Fund US$
William Blair SICAV – Emerging Markets
Leaders Fund US$
William Blair SICAV – Emerging Markets
Small Cap Growth Fund US$
Net asset value per Class A USD – – –Number of shares outstanding – – –
Net asset value per Class B H EUR – – –Number of shares outstanding – – –
Net asset value per Class I USD US$185.15 US$101.92 US$116.88Number of shares outstanding 104,051 1,137,159 267,336
Net asset value per Class I EUR – – –Number of shares outstanding – – –
Net asset value per Class I H EUR – – –Number of shares outstanding – – –
Net asset value per Class I H GBP – – –Number of shares outstanding – – –
Net asset value per Class I H SEK – – –Number of shares outstanding – – –
Net asset value per Class I I GBP – – –Number of shares outstanding – – –
Net asset value per Class D USD – US$99.09 –Number of shares outstanding – 53,082 –
Net asset value per Class J USD US$104.91 US$114.25 US$105.64Number of shares outstanding 382,878 889,365 34,137
Net asset value per Class J EUR – – –Number of shares outstanding – – –
Net asset value per Class J I GBP – £148.70 –Number of shares outstanding – 19,567 –
Net asset value per Class J H CHF – – –Number of shares outstanding – – –
Net asset value per Class J H EUR – – –Number of shares outstanding – – –
Net asset value per Class J H GBP – – –Number of shares outstanding – – –
Net asset value per Class J H SEK – – –Number of shares outstanding – – –
Net asset value per Class J H JPY – – –Number of shares outstanding – – –
Net asset value per Class R USD US$95.53 US$101.45 US$101.81Number of shares outstanding 500 100 100
Net asset value per Class R EUR – – –Number of shares outstanding – – –
Net asset value per Class R H EUR – – –Number of shares outstanding – – –
Net asset value per Class Z USD US$123.40 US$114.28 US$127.20Number of shares outstanding 1,356,770 388,137 1,078,745
Net asset value per Class Z AUD – AU$143.16 –Number of shares outstanding – 20,000 –
Net asset value per Class Z H AUD – – –Number of shares outstanding – – –

Statements of Assets and Liabilities
as of December 31, 2018 (audited) (continued)
The accompanying notes form an integral part of the financial statements.
16 Annual Report December 31, 2018
Note
William Blair SICAV – Dynamic Diversified
Allocation Fund US$
Combined US$
Assets
Transferable securities portfolio at cost 65,876,688 1,597,814,671 Unrealised appreciation/ (depreciation) (2,934,919) 72,566,779
Transferable securities portfolio at market value 62,941,769 1,670,381,450 Cash at bank 8,368,722 62,007,269 Margin accounts 40,763 40,763 Options at market value 8 164,155 164,155 Unrealised appreciation on foreign currencies 127 8,162 Unrealised appreciation on forward foreign exchange contracts 9 1,292,902 1,292,902 Unrealised appreciation on future contracts 10 1,724,864 1,724,864 Unrealised appreciation on swaps 11 90,278 90,278 Dividends and interest receivable 61,310 1,132,598 Receivable for investments sold 105,876 1,322,366 Receivable for fund shares sold 19,900 351,136 Other receivables 3,386 18,620
Total assets 2(a) 74,814,052 1,738,534,563
LiabilitiesOverdraft 3,372,890 3,372,890 Due to broker 1,285,885 1,285,885 Unrealised depreciation on foreign currencies 54 4,210 Unrealised depreciation on forward foreign exchange contracts 9 509,387 509,387 Unrealised depreciation on future contracts 10 575,896 575,896 Unrealised depreciation on swaps 11 159,829 159,829 Payable for investments purchased 191,740 4,629,348 Payable for fund shares redeemed — 312,114 Other liabilities 206,398 5,365,591
Total liabilities 6,302,079 16,215,150
Total net assets 68,511,973 1,722,319,413

Statements of Assets and Liabilities
as of December 31, 2018 (audited) (continued)
The accompanying notes form an integral part of the financial statements.
December 31, 2018 Wi l l iam Bla ir S ICAV 17
Note
William Blair SICAV – Dynamic Diversified
Allocation Fund US$
Combined US$
Net asset value per Class A USD –Number of shares outstanding –
Net asset value per Class B H EUR €100.73Number of shares outstanding 879
Net asset value per Class I USD US$126.87Number of shares outstanding 58,527
Net asset value per Class I EUR –Number of shares outstanding –
Net asset value per Class I H EUR €97.38Number of shares outstanding 112,936
Net asset value per Class I H GBP £102.52Number of shares outstanding 35,365
Net asset value per Class I H SEK kr100.96 Number of shares outstanding 8,051
Net asset value per Class I I GBP –Number of shares outstanding –
Net asset value per Class D USD –Number of shares outstanding –
Net asset value per Class J USD US$107.32Number of shares outstanding 10,000
Net asset value per Class J EUR –Number of shares outstanding –
Net asset value per Class J I GBP –Number of shares outstanding –
Net asset value per Class J H CHF fr.100.83Number of shares outstanding 970
Net asset value per Class J H EUR €101.85Number of shares outstanding 891
Net asset value per Class J H GBP £104.51Number of shares outstanding 771
Net asset value per Class J H SEK kr98.50 Number of shares outstanding 8,650
Net asset value per Class J H JPY ¥9,758.62Number of shares outstanding 450,000
Net asset value per Class R USD US$100.92Number of shares outstanding 1,000
Net asset value per Class R EUR –Number of shares outstanding –
Net asset value per Class R H EUR €100.76Number of shares outstanding 879
Net asset value per Class Z USD –Number of shares outstanding –
Net asset value per Class Z AUD –Number of shares outstanding –
Net asset value per Class Z H AUD AU$134.15Number of shares outstanding 20,404

18 Annual Report December 31, 2018
William Blair SICAV – U.S. All Cap
Growth FundUS$
William Blair SICAV – U.S. Small-Mid Cap
Growth FundUS$
William Blair SICAV – Global Leaders
FundUS$
William Blair SICAV – Emerging Markets
Growth FundUS$
Total net assetsDecember 31, 2018 74,005,149 851,469,530 56,480,236 226,906,826December 31, 2017 179,954,106 735,987,670 61,279,612 430,629,651December 31, 2016 367,214,112 810,625,739 56,157,423 318,417,776
Net asset value per Class A USD
December 31, 2018 — US$85.32 1 — —December 31, 2017 — — — —December 31, 2016 — — — —
Net asset value per Class I USD
December 31, 2018 — US$366.21 US$140.35 US$185.15December 31, 2017 — US$376.91 US$153.72 US$238.83December 31, 2016 — US$294.51 US$118.35 US$160.44
Net asset value per Class I EUR
December 31, 2018 — — €172.46 —December 31, 2017 — — €180.33 —December 31, 2016 — — €158.25 —
Net asset value per Class I I GBP
December 31, 2018 — £91.01 2 — —December 31, 2017 — — — —December 31, 2016 — £162.77 — —
Net asset value per Class D USD
December 31, 2018 US$251.56 — — —December 31, 2017 US$241.30 — — —December 31, 2016 US$195.79 — — —
Net asset value per Class J USD
December 31, 2018 US$99.75 3 US$157.09 US$129.09 US$104.91December 31, 2017 — US$160.86 US$140.68 US$134.65December 31, 2016 — US$125.07 US$107.77 US$90.00
Statistical Information
as of December 31, 2018
1 Launched on July 10, 20182 Reactivated on November 5, 20183 Launched on December 19, 2018

Statistical Information
as of December 31, 2018 (continued)
December 31, 2018 Wi l l iam Bla ir S ICAV 19
William Blair SICAV – U.S. All Cap
Growth FundUS$
William Blair SICAV – U.S. Small-Mid Cap
Growth FundUS$
William Blair SICAV – Global Leaders
FundUS$
William Blair SICAV – Emerging Markets
Growth FundUS$
Net asset value per Class J EUR
December 31, 2018 — — €99.39 4 —December 31, 2017 — — — —December 31, 2016 — — — —
Net asset value per Class J I GBP
December 31, 2018 — £162.47 — —December 31, 2017 — £157.07 — —December 31, 2016 — £133.79 — —
Net asset value per Class R USD
December 31, 2018 US$99.75 4 US$85.51 5 US$84.96 6 US$95.53 6
December 31, 2017 — — — —December 31, 2016 — — — —
Net asset value per Class R EUR
December 31, 2018 — — €99.39 4 —December 31, 2017 — — — —December 31, 2016 — — — —
Net asset value per Class Z USD
December 31, 2018 — US$294.81 US$119.32 US$123.40December 31, 2017 — US$298.88 US$128.99 US$156.80December 31, 2016 — US$230.07 US$98.03 US$103.77
Net asset value per Class Z AUD
December 31, 2018 — — AU$178.85 —December 31, 2017 — — AU$174.54 —December 31, 2016 — — AU$143.41 —
4 Launched on December 19, 20185 Launched on July 10, 20186 Launched on October 4, 2018

Statistical Information
as of December 31, 2018 (continued)
20 Annual Report December 31, 2018
7 Launched on December 19, 2018
William Blair SICAV – Emerging Markets
Leaders FundUS$
William Blair SICAV – Emerging Markets Small
Cap Growth FundUS$
William Blair SICAV – Dynamic Diversified
Allocation Fund US$
Total net assetsDecember 31, 2018 272,862,875 172,082,824 68,511,973December 31, 2017 320,953,160 297,517,811 18,912,578December 31, 2016 267,790,047 207,800,300 25,785,233
Net asset value per Class B H EUR
December 31, 2018 — — €100.73 7
December 31, 2017 — — —December 31, 2016 — — —
Net asset value per Class I USD
December 31, 2018 US$101.92 US$116.88 US$126.87December 31, 2017 US$124.05 US$154.82 US$126.78December 31, 2016 US$87.55 US$109.17 US$116.83
Net asset value per Class I H EUR
December 31, 2018 — — €97.38December 31, 2017 — — €100.38December 31, 2016 — — €94.35
Net asset value per Class I H GBP
December 31, 2018 — — £102.52December 31, 2017 — — £104.42December 31, 2016 — — £97.39
Net asset value per Class I H SEK
December 31, 2018 — — kr100.96December 31, 2017 — — kr104.08 December 31, 2016 — — kr98.00
Net asset value per Class D USD
December 31, 2018 US$99.09 — —December 31, 2017 US$121.10 — —December 31, 2016 US$85.82 — —
Net asset value per Class J USD
December 31, 2018 US$114.25 US$105.64 US$107.32December 31, 2017 US$138.35 US$139.21 US$106.87December 31, 2016 US$97.17 US$97.67 US$98.15
Net asset value per Class J I GBP
December 31, 2018 £148.70 — —December 31, 2017 £170.15 — —December 31, 2016 £131.24 — —
Net asset value per Class J H CHF
December 31, 2018 — — fr.100.83December 31, 2017 — — fr.103.81December 31, 2016 — — fr.97.79

Statistical Information
as of December 31, 2018 (continued)
December 31, 2018 Wi l l iam Bla ir S ICAV 21
William Blair SICAV – Emerging Markets
Leaders FundUS$
William Blair SICAV – Emerging Markets Small
Cap Growth FundUS$
William Blair SICAV – Dynamic Diversified
Allocation Fund US$
Net asset value per Class J H EUR
December 31, 2018 — — €101.85December 31, 2017 — — €104.46December 31, 2016 — — €97.83
Net asset value per Class J H GBP
December 31, 2018 — — £104.51December 31, 2017 — — £105.85December 31, 2016 — — £98.45
Net asset value per Class J H SEK
December 31, 2018 — — kr98.50December 31, 2017 — — kr101.25December 31, 2016 — — kr94.86
Net asset value per Class J H JPY
December 31, 2018 — — ¥9,758.62 8
December 31, 2017 — — —December 31, 2016 — — —
Net asset value per Class R USD
December 31, 2018 US$101.45 9 US$101.81 9 US$100.92 9
December 31, 2017 — — —December 31, 2016 — — —
Net asset value per Class R H EUR
December 31, 2018 — — €100.76 9
December 31, 2017 — — —December 31, 2016 — — —
Net asset value per Class Z USD
December 31, 2018 US$114.28 US$127.20 —December 31, 2017 US$137.14 US$165.81 —December 31, 2016 US$95.46 US$115.07 —
Net asset value per Class Z AUD
December 31, 2018 AU$143.16 — —December 31, 2017 AU$155.09 — —December 31, 2016 AU$116.71 — —
Net asset value per Class Z H AUD
December 31, 2018 — — AU$134.15December 31, 2017 — — AU$133.29December 31, 2016 — — AU$121.03
8 Launched on May 24, 20189 Launched on December 19, 2018
The accompanying notes form an integral part of the financial statements.
22 Annual Report December 31, 2018
Note
William Blair SICAV – U.S. All Cap
Growth FundUS$
William Blair SICAV – U.S. Small-Mid Cap
Growth FundUS$
William Blair SICAV – Global Leaders
FundUS$
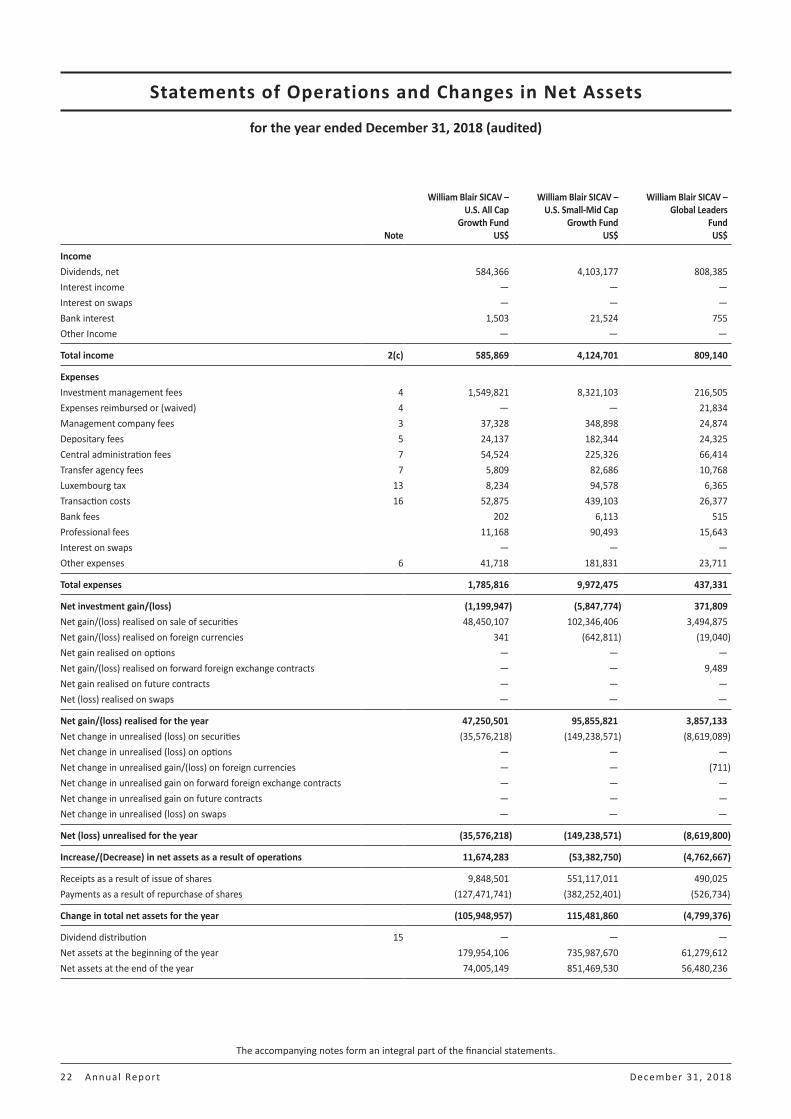
IncomeDividends, net 584,366 4,103,177 808,385Interest income — — —Interest on swaps — — —Bank interest 1,503 21,524 755Other Income — — —
Total income 2(c) 585,869 4,124,701 809,140
ExpensesInvestment management fees 4 1,549,821 8,321,103 216,505Expenses reimbursed or (waived) 4 — — 21,834Management company fees 3 37,328 348,898 24,874Depositary fees 5 24,137 182,344 24,325Central administration fees 7 54,524 225,326 66,414Transfer agency fees 7 5,809 82,686 10,768Luxembourg tax 13 8,234 94,578 6,365Transaction costs 16 52,875 439,103 26,377Bank fees 202 6,113 515Professional fees 11,168 90,493 15,643Interest on swaps — — —Other expenses 6 41,718 181,831 23,711
Total expenses 1,785,816 9,972,475 437,331
Net investment gain/(loss) (1,199,947) (5,847,774) 371,809Net gain/(loss) realised on sale of securities 48,450,107 102,346,406 3,494,875Net gain/(loss) realised on foreign currencies 341 (642,811) (19,040)Net gain realised on options — — —Net gain/(loss) realised on forward foreign exchange contracts — — 9,489Net gain realised on future contracts — — —Net (loss) realised on swaps — — —
Net gain/(loss) realised for the year 47,250,501 95,855,821 3,857,133Net change in unrealised (loss) on securities (35,576,218) (149,238,571) (8,619,089)Net change in unrealised (loss) on options — — —Net change in unrealised gain/(loss) on foreign currencies — — (711)Net change in unrealised gain on forward foreign exchange contracts — — —Net change in unrealised gain on future contracts — — —Net change in unrealised (loss) on swaps — — —
Net (loss) unrealised for the year (35,576,218) (149,238,571) (8,619,800)
Increase/(Decrease) in net assets as a result of operations 11,674,283 (53,382,750) (4,762,667)
Receipts as a result of issue of shares 9,848,501 551,117,011 490,025Payments as a result of repurchase of shares (127,471,741) (382,252,401) (526,734)
Change in total net assets for the year (105,948,957) 115,481,860 (4,799,376)
Dividend distribution 15 — — —Net assets at the beginning of the year 179,954,106 735,987,670 61,279,612Net assets at the end of the year 74,005,149 851,469,530 56,480,236
Statements of Operations and Changes in Net Assets
for the year ended December 31, 2018 (audited)
Statements of Operations and Changes in Net Assets
for the year ended December 31, 2018 (audited) (continued)
The accompanying notes form an integral part of the financial statements.
December 31, 2018 Wi l l iam Bla ir S ICAV 23
Note
William Blair SICAV – Emerging Markets
Growth FundUS$
William Blair SICAV – Emerging Markets
Leaders FundUS$
William Blair SICAV – Emerging Markets Small
Cap Growth FundUS$
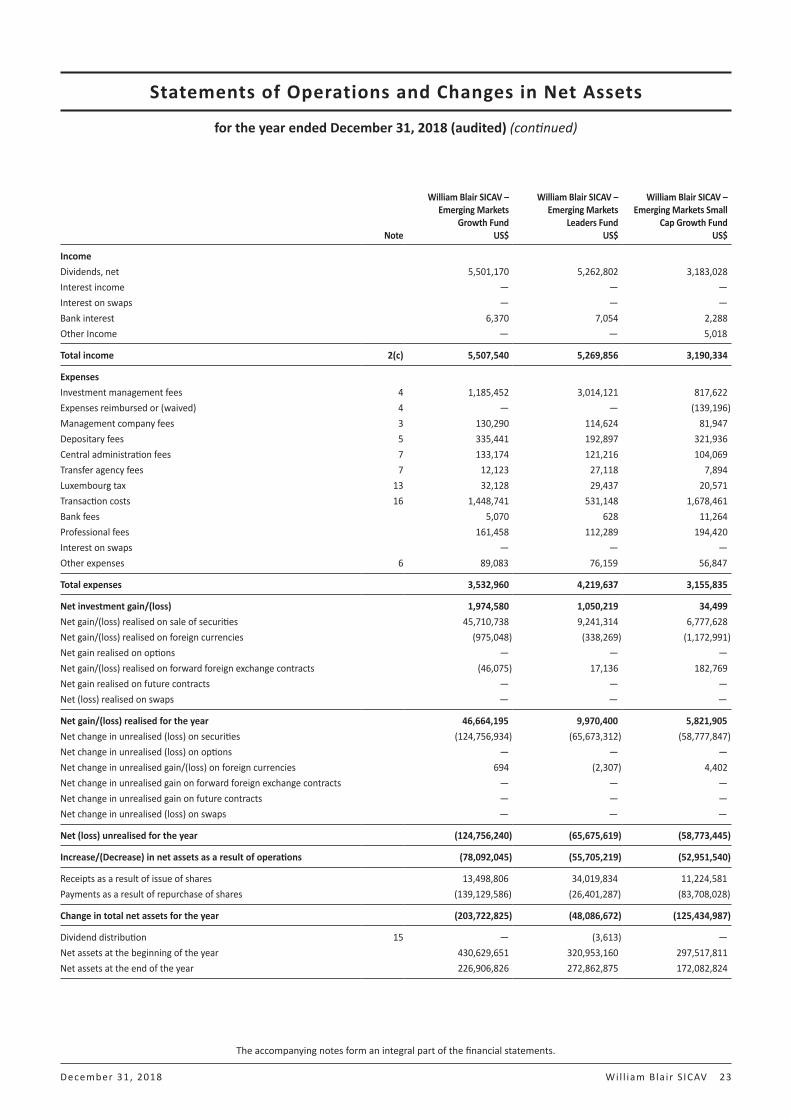
IncomeDividends, net 5,501,170 5,262,802 3,183,028Interest income — — —Interest on swaps — — —Bank interest 6,370 7,054 2,288Other Income — — 5,018
Total income 2(c) 5,507,540 5,269,856 3,190,334
ExpensesInvestment management fees 4 1,185,452 3,014,121 817,622Expenses reimbursed or (waived) 4 — — (139,196)Management company fees 3 130,290 114,624 81,947Depositary fees 5 335,441 192,897 321,936Central administration fees 7 133,174 121,216 104,069Transfer agency fees 7 12,123 27,118 7,894Luxembourg tax 13 32,128 29,437 20,571Transaction costs 16 1,448,741 531,148 1,678,461Bank fees 5,070 628 11,264Professional fees 161,458 112,289 194,420Interest on swaps — — —Other expenses 6 89,083 76,159 56,847
Total expenses 3,532,960 4,219,637 3,155,835
Net investment gain/(loss) 1,974,580 1,050,219 34,499Net gain/(loss) realised on sale of securities 45,710,738 9,241,314 6,777,628Net gain/(loss) realised on foreign currencies (975,048) (338,269) (1,172,991)Net gain realised on options — — —Net gain/(loss) realised on forward foreign exchange contracts (46,075) 17,136 182,769Net gain realised on future contracts — — —Net (loss) realised on swaps — — —
Net gain/(loss) realised for the year 46,664,195 9,970,400 5,821,905Net change in unrealised (loss) on securities (124,756,934) (65,673,312) (58,777,847)Net change in unrealised (loss) on options — — —Net change in unrealised gain/(loss) on foreign currencies 694 (2,307) 4,402Net change in unrealised gain on forward foreign exchange contracts — — —Net change in unrealised gain on future contracts — — —Net change in unrealised (loss) on swaps — — —
Net (loss) unrealised for the year (124,756,240) (65,675,619) (58,773,445)
Increase/(Decrease) in net assets as a result of operations (78,092,045) (55,705,219) (52,951,540)
Receipts as a result of issue of shares 13,498,806 34,019,834 11,224,581Payments as a result of repurchase of shares (139,129,586) (26,401,287) (83,708,028)
Change in total net assets for the year (203,722,825) (48,086,672) (125,434,987)
Dividend distribution 15 — (3,613) —Net assets at the beginning of the year 430,629,651 320,953,160 297,517,811Net assets at the end of the year 226,906,826 272,862,875 172,082,824

Statements of Operations and Changes in Net Assets
for the year ended December 31, 2018 (audited) (continued)
The accompanying notes form an integral part of the financial statements.
24 Annual Report December 31, 2018
Note
William Blair SICAV – Dynamic Diversified
Allocation FundUS$
Combined US$
IncomeDividends, net 552,217 19,995,145Interest income 257,562 257,562Interest on swaps 160,098 160,098Bank interest 5,275 44,769Other Income 2,798 7,816
Total income 2(c) 977,950 20,465,390
ExpensesInvestment management fees 4 619,803 15,724,427Expenses reimbursed or (waived) 4 (261,666) (379,028)Management company fees 3 25,938 763,899Depositary fees 5 84,721 1,165,801Central administration fees 7 161,484 866,207Transfer agency fees 7 7,195 153,593Luxembourg tax 13 6,825 198,138Transaction costs 16 158,349 4,335,054Bank fees 5,262 29,054Professional fees 49,418 634,889Interest on swaps 106,751 106,751Other expenses 6 42,278 511,627
Total expenses 1,006,358 24,110,412
Net investment gain/(loss) (28,408) (3,645,022)Net gain/(loss) realised on sale of securities (920,444) 215,100,624Net gain/(loss) realised on foreign currencies 190,365 (2,957,453)Net gain realised on options 96,534 96,534Net gain/(loss) realised on forward foreign exchange contracts (2,478,943) (2,315,624)Net gain realised on future contracts 1,956,238 1,956,238Net (loss) realised on swaps (418,120) (418,120)
Net gain/(loss) realised for the year (1,602,778) 207,817,177Net change in unrealised (loss) on securities (5,426,246) (448,068,217)Net change in unrealised (loss) on options (44,200) (44,200)Net change in unrealised gain/(loss) on foreign currencies 73 2,151Net change in unrealised gain on forward foreign exchange contracts 735,056 735,056Net change in unrealised gain on future contracts 1,313,061 1,313,061Net change in unrealised (loss) on swaps (173,571) (173,571)
Net (loss) unrealised for the year (3,595,827) (446,235,720)
Increase/(Decrease) in net assets as a result of operations (5,198,605) (238,418,543)
Receipts as a result of issue of shares 78,608,599 698,807,357Payments as a result of repurchase of shares (23,810,599) (783,300,376)
Change in total net assets for the year 49,599,395 (322,911,562)
Dividend distribution 15 — (3,613)Net assets at the beginning of the year 18,912,578 2,045,234,588Net assets at the end of the year 68,511,973 1,722,319,413
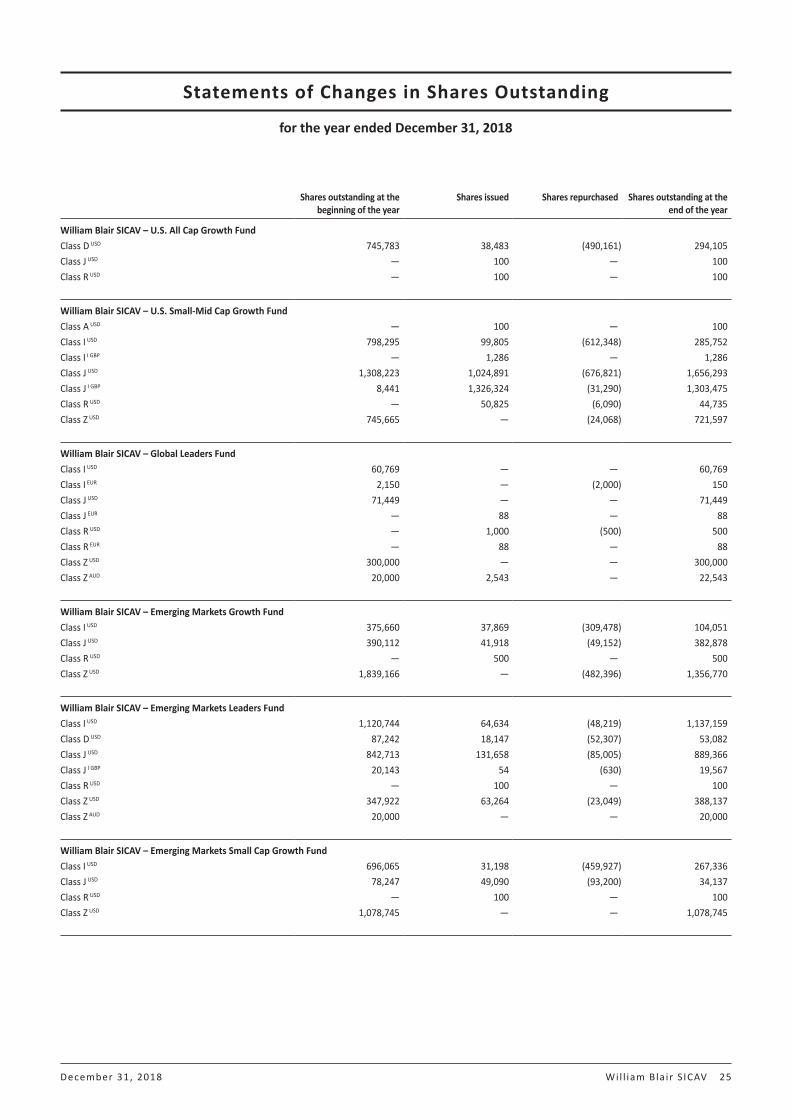
December 31, 2018 Wi l l iam Bla ir S ICAV 25
Shares outstanding at the beginning of the year
Shares issued Shares repurchased Shares outstanding at the end of the year
William Blair SICAV – U.S. All Cap Growth Fund Class D USD 745,783 38,483 (490,161) 294,105Class J USD — 100 — 100Class R USD — 100 — 100
William Blair SICAV – U.S. Small-Mid Cap Growth FundClass A USD — 100 — 100Class I USD 798,295 99,805 (612,348) 285,752Class I I GBP — 1,286 — 1,286Class J USD 1,308,223 1,024,891 (676,821) 1,656,293Class J I GBP 8,441 1,326,324 (31,290) 1,303,475Class R USD — 50,825 (6,090) 44,735Class Z USD 745,665 — (24,068) 721,597
William Blair SICAV – Global Leaders FundClass I USD 60,769 — — 60,769Class I EUR 2,150 — (2,000) 150Class J USD 71,449 — — 71,449Class J EUR — 88 — 88Class R USD — 1,000 (500) 500Class R EUR — 88 — 88Class Z USD 300,000 — — 300,000Class Z AUD 20,000 2,543 — 22,543
William Blair SICAV – Emerging Markets Growth FundClass I USD 375,660 37,869 (309,478) 104,051Class J USD 390,112 41,918 (49,152) 382,878Class R USD — 500 — 500Class Z USD 1,839,166 — (482,396) 1,356,770
William Blair SICAV – Emerging Markets Leaders FundClass I USD 1,120,744 64,634 (48,219) 1,137,159Class D USD 87,242 18,147 (52,307) 53,082Class J USD 842,713 131,658 (85,005) 889,366Class J I GBP 20,143 54 (630) 19,567Class R USD — 100 — 100Class Z USD 347,922 63,264 (23,049) 388,137Class Z AUD 20,000 — — 20,000
William Blair SICAV – Emerging Markets Small Cap Growth FundClass I USD 696,065 31,198 (459,927) 267,336Class J USD 78,247 49,090 (93,200) 34,137Class R USD — 100 — 100Class Z USD 1,078,745 — — 1,078,745
Statements of Changes in Shares Outstanding
for the year ended December 31, 2018
Statements of Changes in Shares Outstanding
for the year ended December 31, 2018 (continued)
The accompanying notes form an integral part of the financial statements.
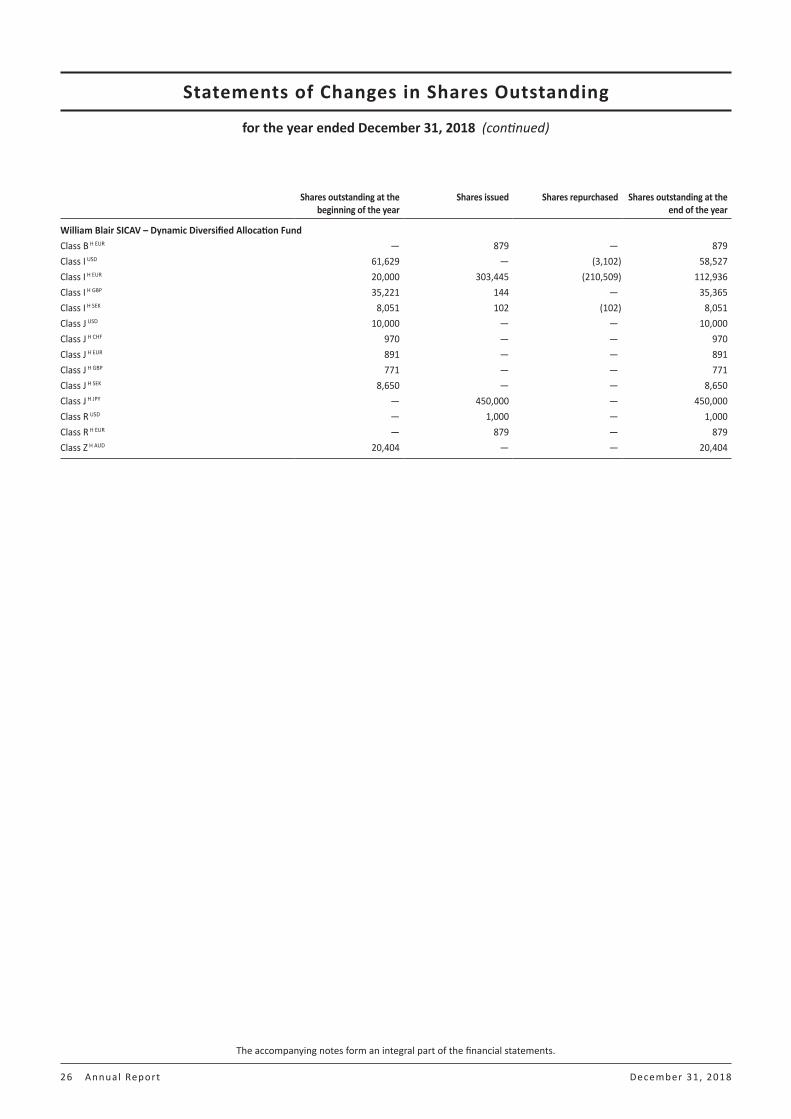
26 Annual Report December 31, 2018
Shares outstanding at the beginning of the year
Shares issued Shares repurchased Shares outstanding at the end of the year
William Blair SICAV – Dynamic Diversified Allocation FundClass B H EUR — 879 — 879Class I USD 61,629 — (3,102) 58,527Class I H EUR 20,000 303,445 (210,509) 112,936Class I H GBP 35,221 144 — 35,365Class I H SEK 8,051 102 (102) 8,051Class J USD 10,000 — — 10,000Class J H CHF 970 — — 970Class J H EUR 891 — — 891Class J H GBP 771 — — 771Class J H SEK 8,650 — — 8,650Class J H JPY — 450,000 — 450,000Class R USD — 1,000 — 1,000Class R H EUR — 879 — 879Class Z H AUD 20,404 — — 20,404

The accompanying notes form an integral part of the financial statements.The geographical distinction is as per country of incorporation.
December 31, 2018 Wi l l iam Bla ir S ICAV 27
Holding DescriptionMarket Value
US$% of Net
Assets
Transferable securities and money market instruments admitted to an official exchange listing
Equities
Bermuda27,890 Genpact Limited 752,751 1.02
752,751 1.02 Canada
59,775 Cameco Corp. 678,446 0.92
678,446 0.92 Ireland
8,680 Linde plc 1,354,427 1.83
1,354,427 1.83 United Kingdom
18,030 Luxfer Holdings plc 317,869 0.43
317,869 0.43 United States
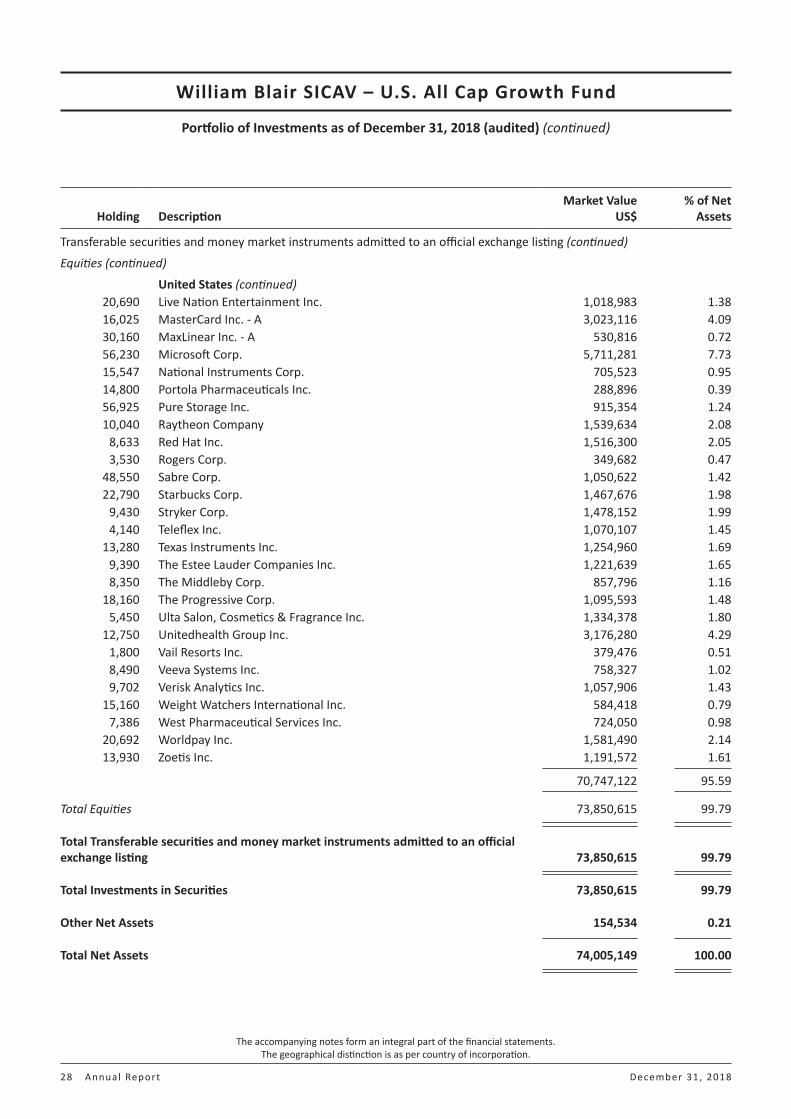
18,120 Activision Blizzard Inc. 843,848 1.14 4,690 Adobe Systems Inc. 1,061,066 1.43
16,600 Agilent Technologies Inc. 1,119,836 1.52 4,852 Alphabet Inc. - A 5,070,146 6.85 3,039 Amazon.com Inc. 4,564,487 6.16 2,580 Arista Networks Inc. 543,606 0.73
36,730 Ball Corp. 1,688,845 2.28 24,504 Booz Allen Hamilton Holding Corp. 1,104,395 1.49
6,760 Burlington Stores Inc. 1,099,649 1.49 33,422 BWX Technologies Inc. 1,277,723 1.73 15,390 Cars.com Inc. 330,885 0.45 48,680 Coca Cola Company 2,304,998 3.11 25,341 Codexis Inc. 423,195 0.57 28,450 Copart Inc. 1,359,341 1.84
3,386 CoStar Group Inc. 1,142,234 1.54 7,475 Costco Wholesale Corp. 1,522,732 2.06
17,570 Dolby Laboratories Inc. - A 1,086,529 1.47 3,400 Domino's Pizza Inc. 843,166 1.14
11,257 East West Bancorp Inc. 490,017 0.66 17,280 Encore Capital Group Inc. 406,080 0.55 10,160 Grand Canyon Education Inc. 976,782 1.32
5,817 Guidewire Software Inc. 466,698 0.63 20,560 Healthcare Services Group Inc. 826,101 1.12 28,000 Hilton Grand Vacations Inc. 738,920 1.00
2,770 Inogen Inc. 343,951 0.46 29,490 Intercontinental Exchange Inc. 2,221,481 3.00 43,330 Laureate Education Inc. - A 660,349 0.89
2,550 Ligand Pharmaceuticals Inc. 346,035 0.47
William Blair SICAV – U.S. All Cap Growth Fund
Portfolio of Investments as of December 31, 2018 (audited)
William Blair SICAV – U.S. All Cap Growth Fund
Portfolio of Investments as of December 31, 2018 (audited) (continued)
The accompanying notes form an integral part of the financial statements.The geographical distinction is as per country of incorporation.
28 Annual Report December 31, 2018
Holding DescriptionMarket Value
US$% of Net
Assets
Transferable securities and money market instruments admitted to an official exchange listing (continued)
Equities (continued)
United States (continued)20,690 Live Nation Entertainment Inc. 1,018,983 1.38 16,025 MasterCard Inc. - A 3,023,116 4.09 30,160 MaxLinear Inc. - A 530,816 0.72 56,230 Microsoft Corp. 5,711,281 7.73 15,547 National Instruments Corp. 705,523 0.95 14,800 Portola Pharmaceuticals Inc. 288,896 0.39 56,925 Pure Storage Inc. 915,354 1.24 10,040 Raytheon Company 1,539,634 2.08
8,633 Red Hat Inc. 1,516,300 2.05 3,530 Rogers Corp. 349,682 0.47
48,550 Sabre Corp. 1,050,622 1.42 22,790 Starbucks Corp. 1,467,676 1.98
9,430 Stryker Corp. 1,478,152 1.99 4,140 Teleflex Inc. 1,070,107 1.45
13,280 Texas Instruments Inc. 1,254,960 1.69 9,390 The Estee Lauder Companies Inc. 1,221,639 1.65 8,350 The Middleby Corp. 857,796 1.16
18,160 The Progressive Corp. 1,095,593 1.48 5,450 Ulta Salon, Cosmetics & Fragrance Inc. 1,334,378 1.80
12,750 Unitedhealth Group Inc. 3,176,280 4.29 1,800 Vail Resorts Inc. 379,476 0.51 8,490 Veeva Systems Inc. 758,327 1.02 9,702 Verisk Analytics Inc. 1,057,906 1.43
15,160 Weight Watchers International Inc. 584,418 0.79 7,386 West Pharmaceutical Services Inc. 724,050 0.98
20,692 Worldpay Inc. 1,581,490 2.14 13,930 Zoetis Inc. 1,191,572 1.61
70,747,122 95.59
Total Equities 73,850,615 99.79
Total Transferable securities and money market instruments admitted to an official exchange listing 73,850,615 99.79
Total Investments in Securities 73,850,615 99.79
Other Net Assets 154,534 0.21
Total Net Assets 74,005,149 100.00

The accompanying notes form an integral part of the financial statements.The geographical distinction is as per country of incorporation.
December 31, 2018 Wi l l iam Bla ir S ICAV 29
William Blair SICAV – U.S. Small-Mid Cap Growth Fund
Portfolio of Investments as of December 31, 2018 (audited)
Holding DescriptionMarket Value
US$% of Net
Assets
Transferable securities and money market instruments admitted to an official exchange listing
Equities
Bermuda292,504 Axalta Coating Systems Limited 6,850,444 0.80
6,850,444 0.80Canada
82,641 Colliers International Group 4,548,561 0.53 124,671 Firstservice Corp. 8,537,470 1.00
89,300 Novanta Inc. 5,625,900 0.66 296,891 Ritchie Bros Auctioneers Inc. 9,714,274 1.14
28,426,205 3.33Ireland
587,545 Horizon Pharma plc 11,480,629 1.35
11,480,629 1.35Israel
94,400 NICE Limited - ADR 10,215,024 1.20
10,215,024 1.20United Kingdom
372,984 BrightSphere Investment Group plc 3,983,469 0.47
3,983,469 0.47United States
137,700 2U Inc. 6,846,444 0.80 395,887 Adtalem Global Education Inc. 18,733,373 2.20 119,200 Aspen Technology Inc. 9,795,856 1.15 468,080 Ball Corp. 21,522,318 2.53 470,091 Booz Allen Hamilton Holding Corp. 21,187,001 2.50 107,500 Burlington Stores Inc. 17,487,025 2.05 512,141 BWX Technologies Inc. 19,579,150 2.30
7,070 Cable One Inc. 5,798,107 0.68 213,216 Cambrex Corp. 8,051,036 0.95 358,972 Catalent Inc. 11,192,747 1.31 217,950 CBOE Holdings Inc. 21,322,048 2.51 139,022 Celanese Corp. 12,507,809 1.47 351,600 Centennial Resource Development Inc - A 3,874,632 0.46 538,264 Copart Inc. 25,718,254 3.02
68,932 CoStar Group Inc. 23,253,521 2.74 114,538 DexCom Inc. 13,721,652 1.62
53,766 Domino's Pizza Inc. 13,333,430 1.57 109,800 East West Bancorp Inc. 4,779,594 0.56 253,956 Encore Capital Group Inc. 5,967,966 0.70 200,800 Euronet Worldwide Inc. 20,557,904 2.41 205,848 EXACT Sciences Corp. 12,989,008 1.52

William Blair SICAV – U.S. Small-Mid Cap Growth Fund
Portfolio of Investments as of December 31, 2018 (audited) (continued)
The accompanying notes form an integral part of the financial statements.The geographical distinction is as per country of incorporation.
30 Annual Report December 31, 2018
Holding DescriptionMarket Value
US$% of Net
Assets
Transferable securities and money market instruments admitted to an official exchange listing (continued)
Equities (continued)
United States (continued)167,450 FirstCash Inc. 12,115,008 1.42 152,100 Fortinet Inc. 10,712,403 1.26 129,000 Genesee & Wyoming Inc. 9,548,580 1.12 218,580 Glaukos Corp. 12,277,639 1.44 204,031 GoDaddy Inc. 13,388,514 1.57 150,527 Grand Canyon Education Inc. 14,471,666 1.70 101,128 Guidewire Software Inc. 8,113,499 0.95 263,633 HealthSouth Corp. 16,266,156 1.91 344,021 Healthcare Services Group Inc. 13,822,764 1.62 229,950 HEICO Corp. 14,486,850 1.70 264,259 Hilton Grand Vacations Inc. 6,973,795 0.82
52,100 Inogen Inc. 6,469,257 0.76 183,000 Insulet Corp. 14,515,560 1.70 114,818 j2 Global Communications Inc. 7,966,073 0.94
67,435 Jones Lang LaSalle Inc. 8,537,271 1.00 100,400 Lamb Weston Holding Inc. 7,385,424 0.87
84,595 Ligand Pharmaceuticals Inc. 11,479,542 1.35 374,400 Live Nation Entertainment Inc. 18,439,200 2.17 100,762 Martin Marietta Materials Inc. 17,317,965 2.03 214,998 MaxLinear Inc. - A 3,783,965 0.44 231,592 National Instruments Corp. 10,509,645 1.23 106,103 Nu Skin Enterprises Inc. 6,507,297 0.76 317,700 Parsley Energy Inc. - A 5,076,846 0.59
68,800 Penumbra Inc. 8,407,360 0.99 209,500 Portola Pharmaceuticals Inc. 4,089,440 0.48 799,747 Pure Storage Inc. 12,859,932 1.51 127,952 Rogers Corp. 12,674,925 1.49 471,500 Sabre Corp. 10,203,260 1.20 119,200 SiteOne Landscape Supply Inc. 6,588,184 0.77 223,446 Six Flags Entertainment Corp. 12,430,301 1.46
77,024 Teledyne Technologies Inc. 15,949,360 1.87 66,500 Teleflex Inc. 17,188,920 2.02
127,285 The Middleby Corp. 13,075,988 1.54 100,774 The Toro Company 5,631,251 0.66 274,700 TransUnion 15,602,960 1.83 148,700 Trex Company Inc. 8,826,832 1.04 118,477 Universal Electronics Inc. 2,995,099 0.35
71,600 Vail Resorts Inc. 15,094,712 1.77 198,157 Veeva Systems Inc. 17,699,384 2.09 343,904 Virtu Financial Inc. 8,858,967 1.04 149,800 Weight Watchers International Inc. 5,774,790 0.68
69,400 West Pharmaceutical Services Inc. 6,803,282 0.80
William Blair SICAV – U.S. Small-Mid Cap Growth Fund
Portfolio of Investments as of December 31, 2018 (audited) (continued)
The accompanying notes form an integral part of the financial statements.The geographical distinction is as per country of incorporation.
December 31, 2018 Wi l l iam Bla ir S ICAV 31
Holding DescriptionMarket Value
US$% of Net
Assets
Transferable securities and money market instruments admitted to an official exchange listing (continued)
Equities (continued)
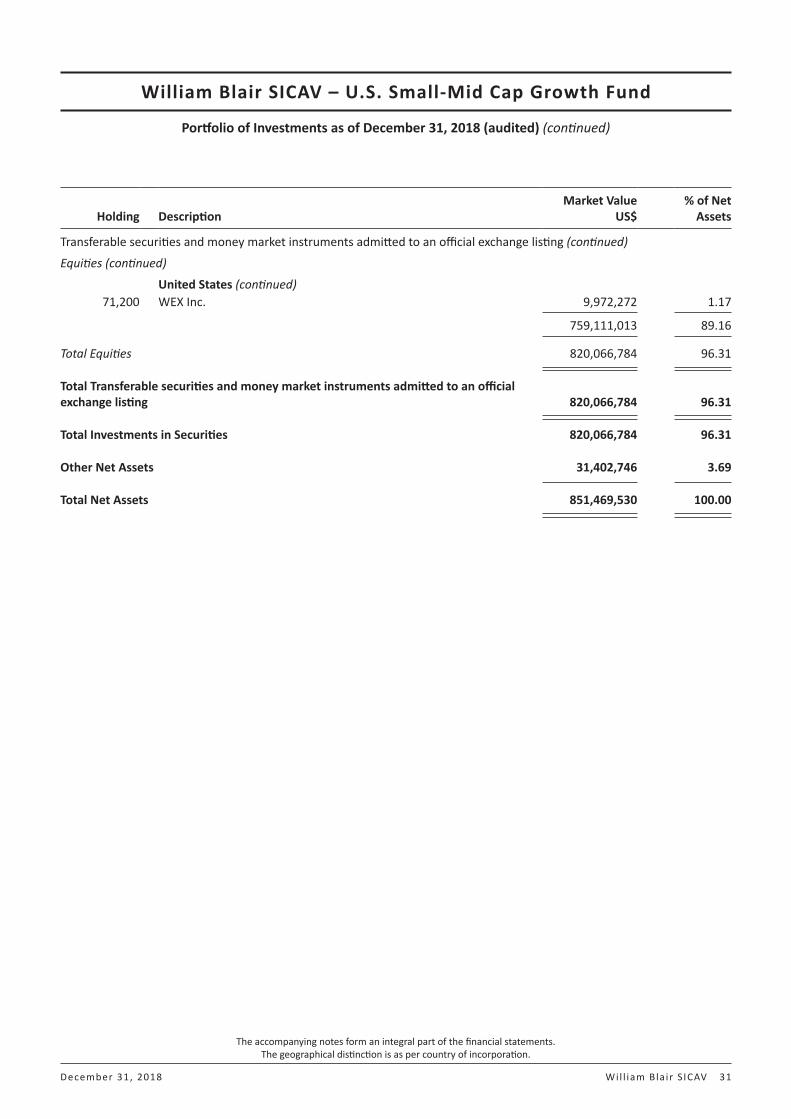
United States (continued)71,200 WEX Inc. 9,972,272 1.17
759,111,013 89.16
Total Equities 820,066,784 96.31
Total Transferable securities and money market instruments admitted to an official exchange listing 820,066,784 96.31
Total Investments in Securities 820,066,784 96.31
Other Net Assets 31,402,746 3.69
Total Net Assets 851,469,530 100.00
The accompanying notes form an integral part of the financial statements.The geographical distinction is as per country of incorporation.
32 Annual Report December 31, 2018
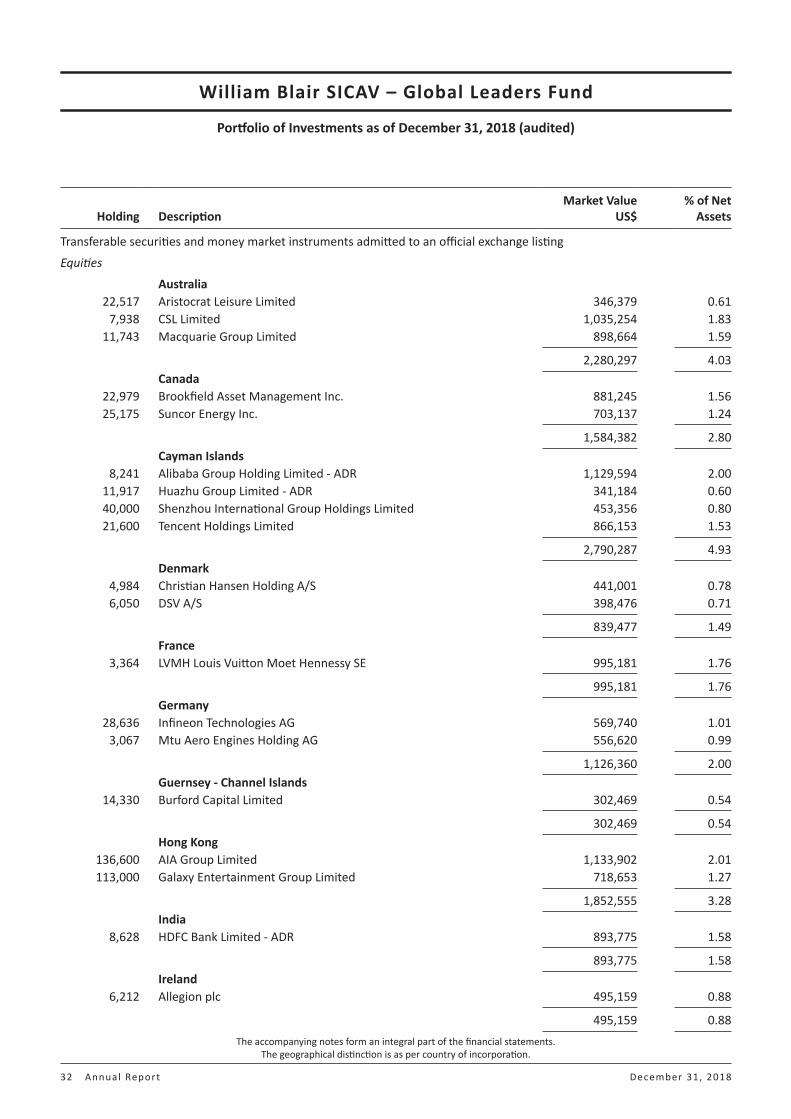
Holding DescriptionMarket Value
US$% of Net
Assets
Transferable securities and money market instruments admitted to an official exchange listing
Equities
Australia22,517 Aristocrat Leisure Limited 346,379 0.61
7,938 CSL Limited 1,035,254 1.8311,743 Macquarie Group Limited 898,664 1.59
2,280,297 4.03Canada
22,979 Brookfield Asset Management Inc. 881,245 1.5625,175 Suncor Energy Inc. 703,137 1.24
1,584,382 2.80Cayman Islands
8,241 Alibaba Group Holding Limited - ADR 1,129,594 2.0011,917 Huazhu Group Limited - ADR 341,184 0.6040,000 Shenzhou International Group Holdings Limited 453,356 0.8021,600 Tencent Holdings Limited 866,153 1.53
2,790,287 4.93Denmark
4,984 Christian Hansen Holding A/S 441,001 0.786,050 DSV A/S 398,476 0.71
839,477 1.49France
3,364 LVMH Louis Vuitton Moet Hennessy SE 995,181 1.76
995,181 1.76Germany
28,636 Infineon Technologies AG 569,740 1.013,067 Mtu Aero Engines Holding AG 556,620 0.99
1,126,360 2.00Guernsey - Channel Islands
14,330 Burford Capital Limited 302,469 0.54
302,469 0.54Hong Kong
136,600 AIA Group Limited 1,133,902 2.01113,000 Galaxy Entertainment Group Limited 718,653 1.27
1,852,555 3.28India
8,628 HDFC Bank Limited - ADR 893,775 1.58
893,775 1.58Ireland
6,212 Allegion plc 495,159 0.88
495,159 0.88
William Blair SICAV – Global Leaders Fund
Portfolio of Investments as of December 31, 2018 (audited)

William Blair SICAV – Global Leaders Fund
Portfolio of Investments as of December 31, 2018 (audited) (continued)
The accompanying notes form an integral part of the financial statements.The geographical distinction is as per country of incorporation.
December 31, 2018 Wi l l iam Bla ir S ICAV 33
Holding DescriptionMarket Value
US$% of Net
Assets
Transferable securities and money market instruments admitted to an official exchange listing (continued)
Equities (continued)
Japan6,100 Daikin Industries Limited 650,878 1.151,900 Keyence Corp. 965,211 1.71
15,600 M3 Inc. 209,793 0.3711,300 MISUMI Group Inc. 239,083 0.4214,300 Nihon M&A Center Inc. 289,118 0.51
8,600 Nissan Chemical Corp. 451,950 0.8045,700 ORIX Corp. 669,416 1.19
7,700 Shin-Etsu Chemical Company Limited 599,673 1.0614,800 ZOZO Inc. 271,411 0.48
4,346,533 7.69Jersey - Channel Islands
8,908 Aptiv PLC 548,466 0.97
548,466 0.97Sweden
21,702 Atlas Copco AB - A 515,433 0.9114,834 Hexagon AB - B 682,872 1.21
1,198,305 2.12Switzerland
3,101 Lonza Group Ltd AG - Reg 803,565 1.421,187 Partners Group Holding AG - Reg 719,760 1.27
1,523,325 2.69Taiwan
30,654 Taiwan Semiconductor Manufacturing Company Limited - ADR 1,131,440 2.00
1,131,440 2.00United Kingdom
36,614 BHP Billiton PLC 770,772 1.3648,737 Compass Group PLC 1,024,983 1.8210,966 Fevertree Drinks PLC 307,360 0.5428,465 Royal Dutch Shell PLC - A 836,706 1.4912,182 Victrex PLC 355,262 0.63
3,295,083 5.84United States
902 Abiomed Inc. 293,186 0.524,336 Adobe Systems Inc. 980,976 1.741,868 Align Technology Inc. 391,215 0.691,635 Alphabet Inc. - A 1,708,510 3.021,075 Amazon.com Inc. 1,614,617 2.862,587 BlackRock Inc. 1,016,225 1.80
16,311 Carnival Corp. 804,132 1.42

William Blair SICAV – Global Leaders Fund
Portfolio of Investments as of December 31, 2018 (audited) (continued)
The accompanying notes form an integral part of the financial statements.The geographical distinction is as per country of incorporation.
34 Annual Report December 31, 2018
Holding DescriptionMarket Value
US$% of Net
Assets
Transferable securities and money market instruments admitted to an official exchange listing (continued)
Equities (continued)
United States (continued)1,260 CoStar Group Inc. 425,049 0.753,076 Domino's Pizza Inc. 762,817 1.357,541 EOG Resources Inc. 657,651 1.166,746 Facebook Inc. - A 884,333 1.57
30,850 Fifth Third Bancorp 725,901 1.293,650 Guidewire Software Inc. 292,840 0.52
994 Illumina Inc. 298,130 0.5313,722 Intercontinental Exchange Inc. 1,033,677 1.82
1,085 Intuitive Surgical Inc. 519,629 0.9210,875 JPMorgan Chase & Company 1,061,617 1.88
6,349 MasterCard Inc. - A 1,197,739 2.134,882 NextEra Energy Inc. 848,589 1.502,650 Pioneer Natural Resources Company 348,528 0.628,997 Prologis Inc. 528,304 0.946,432 Raytheon Company 986,347 1.753,171 Roper Technologies Inc. 845,135 1.507,136 Salesforce.com Inc. 977,418 1.736,769 Southwest Airlines Company 314,623 0.563,537 The Boeing Company 1,140,683 2.018,271 The Estee Lauder Companies Inc. 1,076,057 1.913,447 The Goldman Sachs Group Inc. 575,821 1.026,468 The Home Depot Inc. 1,111,332 1.974,114 Thermo Fisher Scientific Inc. 920,672 1.632,755 Ulta Salon, Cosmetics & Fragrance Inc. 674,534 1.198,264 Union Pacific Corp. 1,142,332 2.026,073 Unitedhealth Group Inc. 1,512,906 2.683,056 Vail Resorts Inc. 644,266 1.158,499 Weight Watchers International Inc. 327,636 0.58
12,987 Worldpay Inc. 992,596 1.7610,038 Zoetis Inc. 858,651 1.52
30,494,674 54.01
Total Equities 55,697,768 98.61
Total Transferable securities and money market instruments admitted to an official exchange listing 55,697,768 98.61
Total Investments in Securities 55,697,768 98.61
Other Net Assets 782,468 1.39
Total Net Assets 56,480,236 100.00

The accompanying notes form an integral part of the financial statements.The geographical distinction is as per country of incorporation.
December 31, 2018 Wi l l iam Bla ir S ICAV 35
Holding DescriptionMarket Value
US$% of Net
Assets
Transferable securities and money market instruments admitted to an official exchange listing
Equities
Bermuda13,945 Credicorp Limited 3,091,188 1.36
3,091,188 1.36 Brazil
578,000 B3 SA-Brasil Bolsa Balcao 3,998,247 1.76 76,900 BK Brasil Operacao e Assessoria a Restaurantes SA 410,319 0.18 52,600 CVC Brasil Operadora e Agencia de Viagens SA 830,310 0.37 82,500 Energisa SA 789,720 0.35 91,425 Engie Brasil Energia SA 778,909 0.34 66,900 Iguatemi Empresa de Shopping Centers SA 718,066 0.32 88,800 IRB Brasil Resseguros SA 1,912,213 0.84
511,940 Itau Unibanco Holding SA 4,689,131 2.07 395,475 Localiza Rent a Car SA 3,035,645 1.33 329,500 Lojas Renner SA 3,604,676 1.59
35,300 Magazine Luiza SA 1,649,173 0.73 117,200 Multiplan Empreendimentos Imobiliarios SA 735,119 0.32 190,200 Rumo SA 834,266 0.37
52,800 Sul America SA 389,623 0.17 261,660 WEG SA 1,184,164 0.52
25,559,581 11.26 Cayman Islands
16,362 58.com Inc. - ADR 886,984 0.39 72,915 Alibaba Group Holding Limited - ADR 9,994,459 4.40
318,000 ANTA Sports Products Limited 1,524,925 0.67 223,400 Chailease Holding Company Limited 704,278 0.31 539,000 China Mengniu Dairy Company Limited 1,679,538 0.74 756,000 Dali Foods Group Company Limited 559,000 0.25 142,000 ENN Energy Holdings Limited 1,259,424 0.56
56,101 Huazhu Group Limited - ADR 1,606,172 0.71 818,000 Kingdee International Software Group Company Limited 722,887 0.31 641,500 Li Ning Company Limited 688,157 0.30 286,000 Shenzhou International Group Holdings Limited 3,241,498 1.43 428,000 SSY Group Limited 317,017 0.14 273,300 Tencent Holdings Limited 10,959,244 4.83
83,275 Tencent Music Entertainment Group 1,100,896 0.49 33,000 Wuxi Biologics (Cayman) Inc. 211,347 0.09
246,500 Xiabuxiabu Catering Management Company Limited 389,087 0.17
35,844,913 15.79 Chile
94,272 Banco Santander-Chile - ADR 2,818,733 1.24
2,818,733 1.24
William Blair SICAV – Emerging Markets Growth Fund
Portfolio of Investments as of December 31, 2018 (audited)

William Blair SICAV – Emerging Markets Growth Fund
Portfolio of Investments as of December 31, 2018 (audited) (continued)
The accompanying notes form an integral part of the financial statements.The geographical distinction is as per country of incorporation.
36 Annual Report December 31, 2018
Holding DescriptionMarket Value
US$% of Net
Assets
Transferable securities and money market instruments admitted to an official exchange listing (continued)
Equities (continued)
China1,398,000 China Communications Services Corp. Limited - H 1,156,894 0.51
193,618 China International Travel Service Corp. Limited 1,697,038 0.751,375,000 China Merchants Bank Company Limited - H 5,039,599 2.22
145,750 Foshan Haitian Flavouring and Food Company Limited 1,459,978 0.64 13,300 Kweichow Moutai Company Limited - A 1,142,511 0.50
812,000 Ping An Insurance (Group) Company of China Limited 7,170,666 3.16 109,840 Shanghai International Airport Company Limited - A 811,767 0.36
15,087 Weibo Corp. - ADR 881,533 0.39 284,000 Yihai International Holdinging Limited 694,179 0.31 157,240 Zhejiang Supor Cookware Company Limited 1,201,910 0.53
21,256,075 9.37Czech Republic
231,200 Moneta Money Bank AS 746,261 0.33
746,261 0.33 Greece
43,747 Jumbo SA 637,566 0.28
637,566 0.28 Hong Kong
526,000 Guangdong Investment Limited 1,017,005 0.45
1,017,005 0.45 Hungary
93,597 OTP Bank Nyrt plc 3,771,261 1.66
3,771,261 1.66 India
78,487 Asian Paints Limited 1,539,095 0.67 98,130 Bajaj Finance Limited 3,712,227 1.64 77,193 Biocon Limited 695,493 0.31 41,841 Britannia Industries Limited 1,869,912 0.82
157,884 Dabur India Limited 972,458 0.43 83,364 Godrej Consumer Products Limited 968,420 0.43
115,662 Havell's India Limited 1,145,720 0.50 23,699 HDFC Asset Management Company Limited 507,533 0.22
231,485 HDFC Bank Limited 7,035,612 3.10 206,849 HDFC Standard Life Insurance Company Limited 1,146,052 0.51 133,233 Hindustan Unilever Limited 3,469,333 1.53 208,333 Housing Development Finance Corp. Limited 5,863,878 2.59
56,760 IndusInd Bank Limited 1,300,726 0.57 261,229 Infosys Technologies Limited 2,468,120 1.09 110,735 Marico Limited 594,179 0.26

William Blair SICAV – Emerging Markets Growth Fund
Portfolio of Investments as of December 31, 2018 (audited) (continued)
The accompanying notes form an integral part of the financial statements.The geographical distinction is as per country of incorporation.
December 31, 2018 Wi l l iam Bla ir S ICAV 37
Holding DescriptionMarket Value
US$% of Net
Assets
Transferable securities and money market instruments admitted to an official exchange listing (continued)
Equities (continued)
India (continued)8,346 Nestle India Limited 1,326,625 0.58 1,480 Page Industries Limited 530,518 0.23
48,382 Pidilite Industries Limited 768,355 0.34 133,830 Tata Consultancy Services Limited 3,632,200 1.60
24,502 Torrent Pharmaceuticals Limited 621,667 0.27 97,362 UPL Limited 1,057,535 0.47
41,225,658 18.16 Indonesia
3,161,300 PT Astra International Tbk 1,808,158 0.80 140,800 PT Gudang Garam Tbk 818,792 0.36
1,626,100 PT Bank Central Asia Tbk 2,940,054 1.30 9,201,600 PT Bank Rakyat Indonesia (Persero) Tbk 2,341,958 1.03
276,900 PT United Tractors Tbk 526,641 0.23
8,435,603 3.72 Kenya
2,522,475 Safaricom Limited 550,811 0.24
550,811 0.24 Luxembourg
12,217 Globant SA 688,061 0.30
688,061 0.30 Malaysia
391,900 Hartalega Holdings Bhd 582,278 0.26 444,000 Public Bank Bhd 2,660,237 1.17
3,242,515 1.43 Mexico
102,300 Grupo Aeroportuario del Centro Norte SAB de CV 488,237 0.22 3,337 Grupo Aeroportuario del Sureste SAB de CV - ADR 502,552 0.22
778,600 Grupo Financiero Banorte SAB de CV 3,800,731 1.68 112,700 Megacable Holdings SAB de CV 504,610 0.22
1,691,100 Wal-Mart de Mexico SAB de CV 4,300,944 1.90
9,597,074 4.24Philippines
1,475,100 Ayala Land Inc. 1,138,910 0.50 120,320 Jollibee Foods Corp. 667,675 0.29
1,806,585 0.79 Poland
11,670 Cd Projekt SA 454,034 0.20 21,711 "Dino Polska" Spolka Akcyjna 556,068 0.25
1,010,102 0.45

William Blair SICAV – Emerging Markets Growth Fund
Portfolio of Investments as of December 31, 2018 (audited) (continued)
The accompanying notes form an integral part of the financial statements.The geographical distinction is as per country of incorporation.
38 Annual Report December 31, 2018
Holding DescriptionMarket Value
US$% of Net
Assets
Transferable securities and money market instruments admitted to an official exchange listing (continued)
Equities (continued)
Republic of Korea (South)13,121 Douzone Bizon Company Limited 610,308 0.27 16,889 Fila Korea Limited 809,790 0.36 12,273 Korea Investment Holdings Company Limited 654,459 0.29
1,562 LG Household & Health Care Limited 1,541,285 0.68 96,848 Macquarie Korea Infrastructure Fund 806,345 0.36
161,045 Samsung Electronics Company Limited 5,585,639 2.46 7,918 Samsung SDI Company Limited 1,554,083 0.68
24,594 SK hynix Inc. 1,333,519 0.59
12,895,428 5.69 Romania
1,369,217 Banca Transilvania SA 675,844 0.30
675,844 0.30 South Africa
54,751 Bidvest Group Limited 787,161 0.35 24,833 Capitec Bank Holdings Limited 1,929,688 0.85 84,384 Clicks Group Limited 1,122,875 0.49
531,006 Firstrand Limited 2,419,660 1.07 48,402 JSE Limited 556,974 0.25 66,895 Mr Price Group Limited 1,144,484 0.50 22,404 Naspers Limited 4,503,814 1.99
163,032 Sanlam Limited 904,257 0.40
13,368,913 5.90 Taiwan
3,480,215 E.Sun Financial Holding Company Limited 2,275,829 1.00 51,000 Eclat Textile Company Limited 577,413 0.25 99,000 Feng Tay Enterprise Company Limited 565,262 0.25
105,000 Makalot Industrial Company Limited 580,732 0.26 358,000 President Chain Store Corp. 3,622,270 1.60 604,000 Taiwan Semiconductor Manufacturing Company Limited 4,431,196 1.95 190,344 Taiwan Semiconductor Manufacturing Company Limited - ADR 7,025,597 3.10
38,409 Tci Company Limited 648,542 0.29
19,726,841 8.70 Thailand
1,349,500 Airports of Thailand pcl 2,662,983 1.17 2,817,000 Bangkok Dusit Medical Services pcl 2,145,660 0.95 2,116,500 Bangkok Expressway & Metro pcl 630,539 0.28
527,900 Central Pattana pcl 1,211,951 0.53 616,000 CP ALL pcl 1,300,696 0.57
2,481,900 Home Product Center pcl 1,158,644 0.51 304,700 Muangthai Capital pcl 458,554 0.20
9,569,027 4.21
William Blair SICAV – Emerging Markets Growth Fund
Portfolio of Investments as of December 31, 2018 (audited) (continued)
The accompanying notes form an integral part of the financial statements.The geographical distinction is as per country of incorporation.
December 31, 2018 Wi l l iam Bla ir S ICAV 39
Holding DescriptionMarket Value
US$% of Net
Assets
Transferable securities and money market instruments admitted to an official exchange listing (continued)
Equities (continued)
Turkey49,363 Bim Birlesik Magazalar AS 811,448 0.35
811,448 0.35 United Arab Emirates
31,403 DP World Limited 536,991 0.24 476,540 National Bank of Abu Dhabi PJSC 1,829,279 0.81
2,366,270 1.05 United Kingdom
21,779 NMC Health plc 759,500 0.33
759,500 0.33 Vietnam
6 Hoa Phat Group JSC 8 0.00 100,848 Vietjet Aviation JSC 520,376 0.23
4 Vietnam Dairy Products JSC 21 0.00 380,135 Vincom Retail JSC 456,048 0.20 136,078 Vingroup Joint JSC 557,634 0.25
1,534,087 0.68
Total Equities 223,006,350 98.28
Total Transferable securities and money market instruments admitted to an official exchange listing 223,006,350 98.28
Total Investments in Securities 223,006,350 98.28
Other Net Assets 3,900,476 1.72
Total Net Assets 226,906,826 100.00

The accompanying notes form an integral part of the financial statements.The geographical distinction is as per country of incorporation.
40 Annual Report December 31, 2018
Holding DescriptionMarket Value
US$% of Net
Assets
Transferable securities and money market instruments admitted to an official exchange listing
Equities
Argentina131,214 YPF Sociedad Anonima - ADR 1,756,955 0.64
1,756,955 0.64Bermuda
25,653 Credicorp Limited 5,686,501 2.081,639,000 Haier Electronics Group Company Limited 4,031,313 1.48
9,717,814 3.56Brazil
778,264 Ambev SA - ADR 3,050,795 1.12552,400 B3 SA - Brasil Bolsa Balcao 3,821,162 1.40466,200 BB Seguridade Participacoes SA 3,318,707 1.22762,070 Itau Unibanco Holding SA 6,980,204 2.55261,400 Raia Drogasil SA 3,854,489 1.41289,900 WEG SA 1,311,967 0.48
22,337,324 8.18Cayman Islands
115,270 Alibaba Group Holding Limited - ADR 15,800,059 5.79581,000 ANTA Sports Products Limited 2,786,104 1.02
43,588 Autohome Inc. - ADR 3,409,889 1.25421,000 ENN Energy Holdings Limited 3,733,926 1.37125,275 Huazhu Group Limited - ADR 3,586,623 1.31
8,324 NetEase Inc - ADR 1,959,220 0.72396,000 Shenzhou International Group Holdings Limited 4,488,227 1.64110,000 Sunny Optical Technology (Group) Company Limited 977,717 0.36
61,516 TAL Education Group - ADR 1,641,247 0.60428,200 Tencent Holdings Limited 17,170,685 6.29
55,553,697 20.35Chile
74,624 Sociedad Quimica y Minera de Chile SA - ADR 2,858,099 1.05
2,858,099 1.05China
535,776 China International Travel Service Corp. Limited 4,696,012 1.72260,636 Jiangsu Hengrui Medicine Company Limited 2,001,734 0.73
58,427 Kweichow Moutai Company Limited - A 5,019,060 1.84802,000 Ping An Insurance (Group) Company of China Limited 7,082,357 2.59
18,799,163 6.88Hong Kong
2,997,000 CNOOC Limited 4,631,093 1.70
4,631,093 1.70
William Blair SICAV – Emerging Markets Leaders Fund
Portfolio of Investments as of December 31, 2018 (audited)

William Blair SICAV – Emerging Markets Leaders Fund
Portfolio of Investments as of December 31, 2018 (audited) (continued)
The accompanying notes form an integral part of the financial statements.The geographical distinction is as per country of incorporation.
December 31, 2018 Wi l l iam Bla ir S ICAV 41
Holding DescriptionMarket Value
US$% of Net
Assets
Transferable securities and money market instruments admitted to an official exchange listing (continued)
Equities (continued)
Hungary119,318 OTP Bank Nyrt 4,807,626 1.76
4,807,626 1.76India
143,773 Asian Paints Limited 2,819,325 1.03109,843 Bajaj Finance Limited 4,155,326 1.52
63,222 Britannia Industries Limited 2,825,447 1.04192,575 HDFC Bank Limited 5,853,005 2.15480,926 HDFC Standard Life Insurance Company Limited 2,664,582 0.98100,624 Hindustan Unilever Limited 2,620,209 0.96193,366 Housing Development Finance Corp. Limited 5,442,606 1.99173,803 IndusInd Bank Limited 3,982,913 1.46577,799 Infosys Limited 5,459,109 2.00
25,618 Maruti Suzuki India Limited 2,734,528 1.002,840 MRF Limited 2,718,655 1.00
632,011 Petronet LNG Limited 2,024,234 0.74308,414 UPL Limited 3,349,959 1.23
46,649,898 17.10Indonesia
23,344,400 PT Bank Rakyat Indonesia (Persero) Tbk 5,941,532 2.1820,512,800 PT Telekomunikasi Indonesia (Persero) Tbk 5,349,225 1.96
1,044,000 PT Unilever Indonesia Tbk 3,296,029 1.21
14,586,786 5.35Mexico
445,200 Grupo Aeroportuario del Pacifico SAB de CV - B 3,627,883 1.33944,300 Grupo Financiero Banorte SAB de CV 4,609,595 1.69
1,032,900 Wal-Mart de Mexico SAB de CV 2,626,956 0.96
10,864,434 3.98Netherlands
131,600 Yandex NV - A 3,599,260 1.32
3,599,260 1.32Papua New Guinea
442,458 Oil Search Limited 2,231,380 0.82
2,231,380 0.82Republic of Korea (South)
3,360 LG Household & Health Care Limited 3,315,440 1.22188,556 Samsung Electronics Company Limited 6,539,822 2.40
9,855,262 3.62
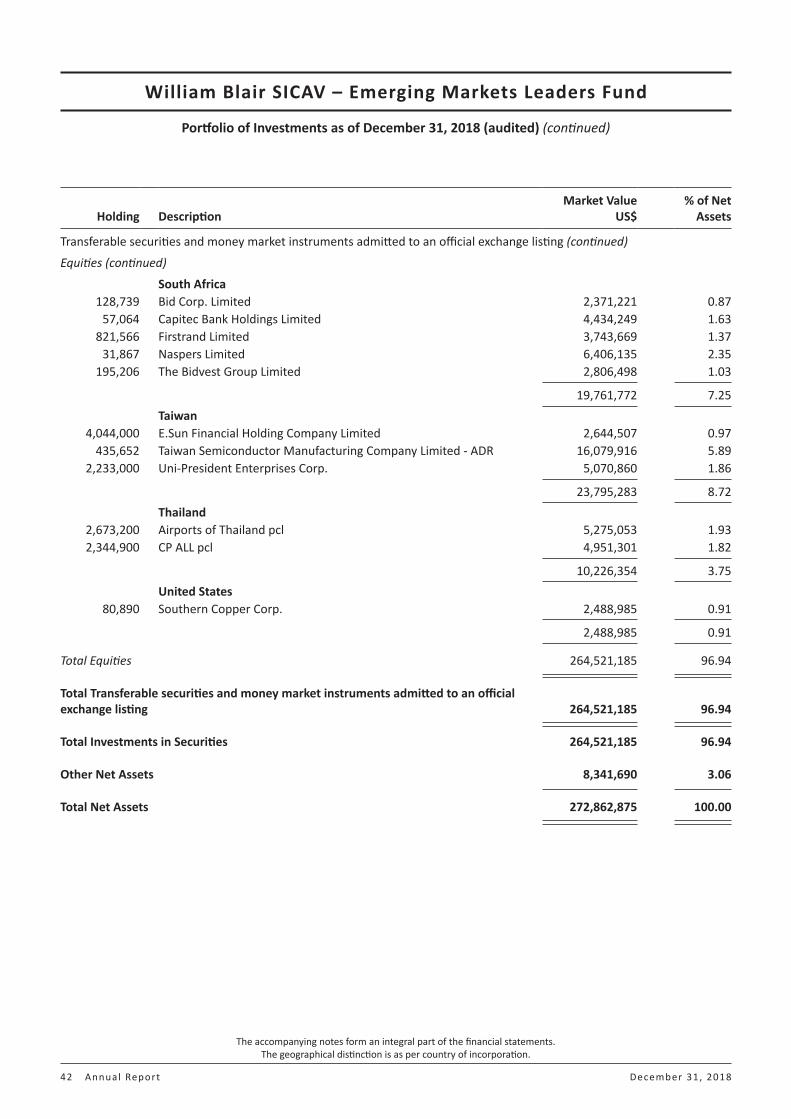
William Blair SICAV – Emerging Markets Leaders Fund
Portfolio of Investments as of December 31, 2018 (audited) (continued)
The accompanying notes form an integral part of the financial statements.The geographical distinction is as per country of incorporation.
42 Annual Report December 31, 2018
Holding DescriptionMarket Value
US$% of Net
Assets
Transferable securities and money market instruments admitted to an official exchange listing (continued)
Equities (continued)
South Africa128,739 Bid Corp. Limited 2,371,221 0.87
57,064 Capitec Bank Holdings Limited 4,434,249 1.63821,566 Firstrand Limited 3,743,669 1.37
31,867 Naspers Limited 6,406,135 2.35195,206 The Bidvest Group Limited 2,806,498 1.03
19,761,772 7.25Taiwan
4,044,000 E.Sun Financial Holding Company Limited 2,644,507 0.97435,652 Taiwan Semiconductor Manufacturing Company Limited - ADR 16,079,916 5.89
2,233,000 Uni-President Enterprises Corp. 5,070,860 1.86
23,795,283 8.72Thailand
2,673,200 Airports of Thailand pcl 5,275,053 1.932,344,900 CP ALL pcl 4,951,301 1.82
10,226,354 3.75United States
80,890 Southern Copper Corp. 2,488,985 0.91
2,488,985 0.91
Total Equities 264,521,185 96.94
Total Transferable securities and money market instruments admitted to an official exchange listing 264,521,185 96.94
Total Investments in Securities 264,521,185 96.94
Other Net Assets 8,341,690 3.06
Total Net Assets 272,862,875 100.00

The accompanying notes form an integral part of the financial statements.The geographical distinction is as per country of incorporation.
December 31, 2018 Wi l l iam Bla ir S ICAV 43
Holding DescriptionMarket Value
US$% of Net
Assets
Transferable securities and money market instruments admitted to an official exchange listing
Equities
Bermuda730,000 China Water Affairs Group Limited 781,229 0.45
781,229 0.45 Brazil
51,600 Arezzo Industria e Comercio 733,045 0.43 66,628 Azul SA - ADR 1,844,929 1.07
122,200 BK Brasil Operacao e Assessoria a Restaurantes SA 652,029 0.38 253,226 Construtora Tenda SA 2,096,636 1.22 147,600 CVC Brasil Operadora e Agencia de Viagens SA 2,329,919 1.35 223,300 IRB Brasil Resseguros SA 4,808,526 2.79 397,870 Localiza Rent a Car SA 3,054,029 1.77
94,700 Magazine Luiza SA 4,424,268 2.56 144,300 Metalurgica Gerdau SA 258,387 0.15 258,000 Notre Dame Intermedica Participacoes SA 1,935,794 1.12 665,200 Randon Implementos e Participacoes SA 1,589,309 0.92 417,800 Rumo SA 1,832,577 1.06 124,900 Sul America SA 921,666 0.54 249,100 Tegma Gestao Logistica SA 1,767,468 1.03
28,248,582 16.39 Cayman Islands
434,660 Chailease Holding Company Limited 1,370,285 0.80 1,711,000 China Education Group Holdings Limited 2,097,648 1.22
476,792 China Everbright Greentech Limited 339,153 0.20 2,564,000 Dali Foods Group Company Limited 1,895,867 1.10 1,034,000 Fu Shou Yuan International Group Limited 779,083 0.45
281,500 Health and Happiness (H&H) International Holdings Limited 1,606,931 0.93 31,682 Huazhu Group Limited - ADR 907,056 0.53
705,000 JNBY Design Limited 988,559 0.57 400,000 Kingdee International Software Group Company Limited 353,490 0.21 980,000 Li Ning Company Limited 1,051,276 0.61
1,394,000 NagaCorp Limited 1,498,947 0.87 46,122 Noah Holdings Limited - ADR 1,998,004 1.16 64,000 Parade Technologies Limited 895,336 0.52 77,000 Ping An Healthcare and Technology Company Limited 271,401 0.16
652,000 SSY Group Limited 482,933 0.28 119,500 Wuxi Biologics (Cayman) Inc. 765,332 0.44
17,301,301 10.05 China
952,250 A-Living Services Company Limited - H 1,291,477 0.75 351,600 BY-health Company Limited 869,745 0.51
5,620,000 China Suntien Green Energy Corp. Limited - H 1,442,592 0.84
William Blair SICAV – Emerging Markets Small Cap Growth Fund
Portfolio of Investments as of December 31, 2018 (audited)

William Blair SICAV – Emerging Markets Small Cap Growth Fund
Portfolio of Investments as of December 31, 2018 (audited) (continued)
The accompanying notes form an integral part of the financial statements.The geographical distinction is as per country of incorporation.
44 Annual Report December 31, 2018
Holding DescriptionMarket Value
US$% of Net
Assets
Transferable securities and money market instruments admitted to an official exchange listing (continued)
Equities (continued)
China (continued)73,400 Chongqing Zhifei Biological Products Company Limited - A 414,218 0.24 72,400 Toly Bread Company Limited 476,038 0.28
996,000 Yihai International Holdinging Limited 2,434,516 1.41 320,359 Zhejiang Supor Cookware Company Limited 2,448,757 1.42 712,764 Zhejiang Weixing New Building Materials Company Limited 1,609,559 0.94
10,986,902 6.39 Cyprus
36,788 TCS Group Holding plc - ADR 572,421 0.33
572,421 0.33 Czech Republic
256,614 Moneta Money Bank AS 828,292 0.48
828,292 0.48 Hong Kong
671,600 Hua Hong Semiconductor Limited 1,243,626 0.72 614,000 Towngas China Company Limited 455,571 0.26
1,699,197 0.98 India
64,623 Aarti Industries Limited 1,337,578 0.78 147,578 Astral Poly Technik Limited 2,378,146 1.38
85,706 Bandhan Bank Limited 676,437 0.39 93,142 Bata India Limited 1,506,273 0.88
465,143 Berger Paints India Limited 2,199,028 1.27 266,020 Biocon Limited 2,396,786 1.39 388,493 City Union Bank Limited 1,076,784 0.63
54,444 Colgate-Palmolive (India) Company 1,054,365 0.61 39,786 Cyient Limited 353,905 0.21 54,039 Endurance Technologies Limited 983,088 0.57 60,862 Escorts Limited 615,220 0.36
108,018 Graphite India Limited 1,166,626 0.68 493,303 GRUH Finance Limited 2,236,411 1.30 227,545 Havell's India Limited 2,254,007 1.31
18,453 HDFC Asset Management Company Limited 395,186 0.23 29,760 Info Edge India Limited 611,289 0.36 82,480 Interglobe Aviation Limited 1,375,909 0.80
123,641 Ipca Laboratories Limited 1,416,916 0.82 143,271 KEI Industries Limited 736,950 0.43
23,746 Larsen & Toubro Infotech 585,598 0.34 110,431 Mahanagar Gas Limited 1,422,841 0.83 376,228 Marico Limited 2,018,753 1.18 117,296 Minda Industries Limited 542,352 0.32

William Blair SICAV – Emerging Markets Small Cap Growth Fund
Portfolio of Investments as of December 31, 2018 (audited) (continued)
The accompanying notes form an integral part of the financial statements.The geographical distinction is as per country of incorporation.
December 31, 2018 Wi l l iam Bla ir S ICAV 45
Holding DescriptionMarket Value
US$% of Net
Assets
Transferable securities and money market instruments admitted to an official exchange listing (continued)
Equities (continued)
India (continued)75,767 NIIT Technologies Limited 1,246,452 0.72
2,226 Page Industries Limited 797,928 0.46 112,205 Pidilite Industries Limited 1,781,930 1.03
13,736 PVR Limited 314,610 0.18 327,230 Radico Khaitan Limited 1,879,584 1.09 150,295 RBL Bank Limited 1,237,875 0.72 185,815 Sterlite Technologies Limited 781,583 0.45
96,663 Sundram Fasteners Limited 738,061 0.43 135,777 The Phoenix Mills Limited 1,094,961 0.64
37,142 Torrent Pharmaceuticals Limited 942,371 0.55 202,047 VIP Industries Limited 1,498,576 0.87
14,289 V-Mart Retail Limited 531,133 0.31
42,185,512 24.52 Indonesia
23,528,400 PT ACE Hardware Indonesia Tbk 2,437,886 1.42 4,050,200 PT Bank Negara Indonesia (Persero) Tbk 2,478,528 1.44 3,846,000 PT Charoen Pokphand Indonesia Tbk 1,932,333 1.13
176,700 PT Gudang Garam Tbk 1,027,560 0.60 2,112,200 PT Indofood Cbp Sukses Makmur Tbk 1,534,921 0.89
18,957,500 PT Pakuwon Jati Tbk 817,349 0.47
10,228,577 5.95 Kenya
6,777,400 Safaricom Limited 1,479,923 0.86
1,479,923 0.86 Luxembourg
17,672 Globant SA 995,287 0.58
995,287 0.58 Malaysia
1,498,600 Hartalega Holdings Bhd 2,226,593 1.29 514,400 Hong Leong Bank Bhd 2,539,321 1.48 912,200 Top Glove Corp. Bhd 1,236,132 0.72
6,002,046 3.49 Mexico
700,000 Banco del Bajio SA 1,362,116 0.79 3,604 Grupo Aeroportuario del Sureste SAB de CV - ADR 542,762 0.32
83,000 Grupo Cementos de Chihuahua SAB de CV - A 426,451 0.25
2,331,329 1.36 Philippines
2,507,300 Bloomberry Resorts Corp. 448,681 0.26

William Blair SICAV – Emerging Markets Small Cap Growth Fund
Portfolio of Investments as of December 31, 2018 (audited) (continued)
The accompanying notes form an integral part of the financial statements.The geographical distinction is as per country of incorporation.
46 Annual Report December 31, 2018
Holding DescriptionMarket Value
US$% of Net
Assets
Transferable securities and money market instruments admitted to an official exchange listing (continued)
Equities (continued)
Philippines (continued)164,730 Jollibee Foods Corp. 914,113 0.53
1,362,794 0.79 Poland
79,180 "Dino Polska" Spolka Akcyjna 2,027,980 1.18
2,027,980 1.18 Republic of Korea (South)
8,572 Cafe24 Corp. 843,527 0.49 15,754 Cosmax Inc. 1,835,477 1.07 13,972 Dentium Company Limited 720,014 0.42 27,836 Douzone Bizon Company Limited 1,294,758 0.74 77,807 Fila Korea Limited 3,730,672 2.17 67,963 JYP Entertainment Corp. 1,842,522 1.08
5,625 Koh Young Technology Inc. 415,902 0.24 6,605 Korea Investment Holdings Company Limited 352,212 0.20
79,716 Macquarie Korea Infrastructure Fund 663,706 0.39 24,894 Posco Chemtech Company Limited 1,421,179 0.83
13,119,969 7.63 Romania
3,451,540 Banca Transilvania SA 1,703,676 0.99
1,703,676 0.99 South Africa
130,994 AVI Limited 925,679 0.54 22,673 Capitec Bank Holdings Limited 1,761,842 1.02
117,135 Clicks Group Limited 1,558,684 0.91 67,095 Mr Price Group Limited 1,147,905 0.67 24,106 Santam Limited 496,682 0.29
5,890,792 3.43 Taiwan
63,000 Asmedia Technology Inc. 1,024,821 0.60 56,000 Aspeed Technology Inc. 1,071,280 0.62
142,000 Chroma ATE Inc. 545,140 0.32 88,000 Eclat Textile Company Limited 996,321 0.58
448,000 Feng Tay Enterprise Company Limited 2,557,953 1.49 86,000 Globalwafers Company Limited 784,818 0.46
188,000 Makalot Industrial Company Limited 1,039,787 0.60 491,000 Sinbon Electronics Company Limited 1,322,663 0.77 198,512 TCI Company Limited 3,351,904 1.95
27,000 Voltronic Power Technology Corp. 471,710 0.27
13,166,397 7.66
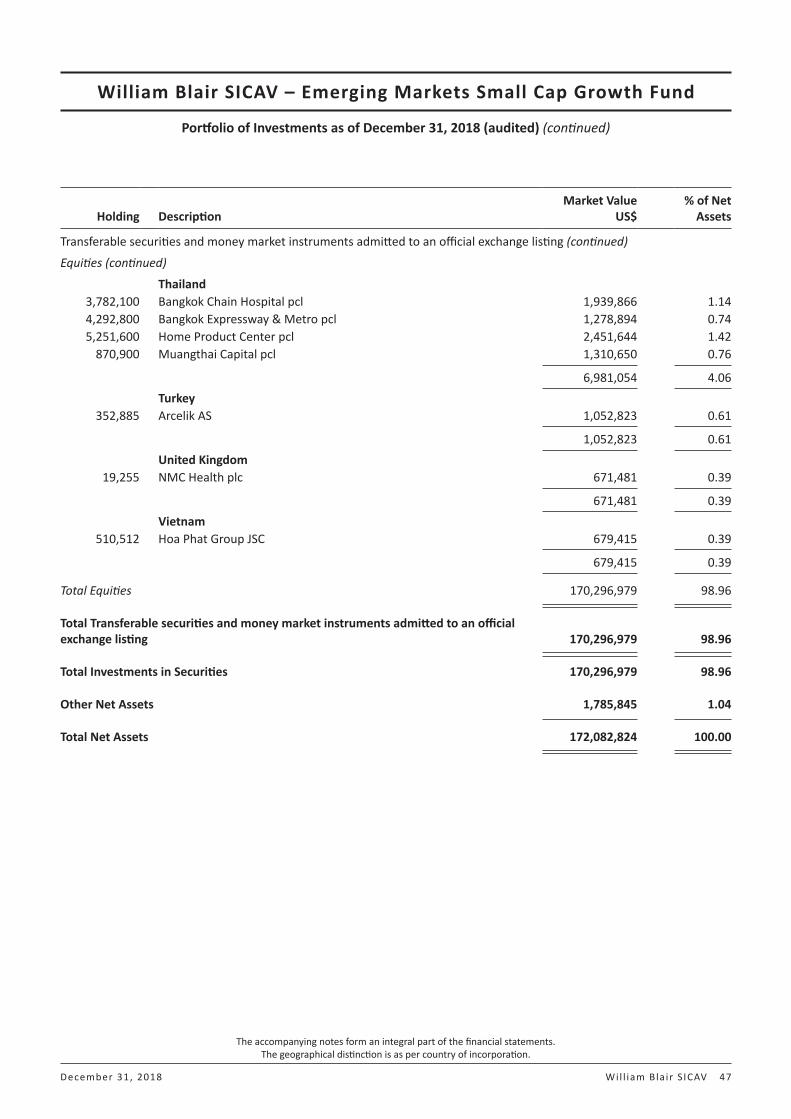
William Blair SICAV – Emerging Markets Small Cap Growth Fund
Portfolio of Investments as of December 31, 2018 (audited) (continued)
The accompanying notes form an integral part of the financial statements.The geographical distinction is as per country of incorporation.
December 31, 2018 Wi l l iam Bla ir S ICAV 47
Holding DescriptionMarket Value
US$% of Net
Assets
Transferable securities and money market instruments admitted to an official exchange listing (continued)
Equities (continued)
Thailand3,782,100 Bangkok Chain Hospital pcl 1,939,866 1.14 4,292,800 Bangkok Expressway & Metro pcl 1,278,894 0.74 5,251,600 Home Product Center pcl 2,451,644 1.42
870,900 Muangthai Capital pcl 1,310,650 0.76
6,981,054 4.06 Turkey
352,885 Arcelik AS 1,052,823 0.61
1,052,823 0.61 United Kingdom
19,255 NMC Health plc 671,481 0.39
671,481 0.39 Vietnam
510,512 Hoa Phat Group JSC 679,415 0.39
679,415 0.39
Total Equities 170,296,979 98.96
Total Transferable securities and money market instruments admitted to an official exchange listing 170,296,979 98.96
Total Investments in Securities 170,296,979 98.96
Other Net Assets 1,785,845 1.04
Total Net Assets 172,082,824 100.00

The accompanying notes form an integral part of the financial statements.The geographical distinction is as per country of incorporation.
48 Annual Report December 31, 2018
Holding DescriptionMarket Value
US$% of Net
Assets
Transferable securities and money market instruments admitted to an official exchange listing
Equities
Argentina1,775 Cablevision Holding SA - ADR 11,239 0.02 1,966 Grupo Clarin SA - GDR 5,168 0.01
16,407 0.03 Australia
6,336 Aristocrat Leisure Limited 97,467 0.14 1,682 CSL Limited 219,362 0.32 2,854 Macquarie Group Limited 218,410 0.32
535,239 0.78 Belgium
2,607 KBC Group NV 169,301 0.25
169,301 0.25 Bermuda
1,770 Axalta Coating Systems Limited 41,453 0.06 401 Credicorp Limited 88,890 0.13
1,676 Genpact Limited 45,235 0.07
175,578 0.26 Brazil
16,700 B3 SA-Brasil Bolsa Balcao 115,520 0.17 2,300 BK Brasil Operacao e Assessoria a Restaurantes SA 12,272 0.02 1,500 CVC Brasil Operadora e Agencia de Viagens SA 23,678 0.03 2,300 Energisa SA 22,016 0.03 2,600 Engie Brasil Energia SA 22,151 0.03 1,900 Iguatemi Empresa de Shopping Centers SA 20,394 0.03 2,600 IRB Brasil Resseguros SA 55,988 0.08
14,800 Itau UnibancoHolding SA 135,561 0.20 11,400 Localiza Rent a Car SA 87,506 0.13
9,500 Lojas Renner SA 103,927 0.15 1,000 Magazine Luiza SA 46,719 0.07 3,400 Multiplan Empreendimentos Imobiliarios SA 21,326 0.03 5,500 Rumo SA 24,124 0.04 1,400 Sul America SA 10,331 0.02 7,500 WEG SA 33,942 0.05
735,455 1.08 Canada
5,557 Brookfield Asset Management Inc. 213,112 0.32 6,137 Cameco Corp. 69,655 0.10 3,219 Canadian National Railway Company 238,407 0.35
938 Colliers International Group 51,628 0.08 4,227 Dollarama Inc. 100,535 0.15
William Blair SICAV – Dynamic Diversified Allocation Fund
Portfolio of Investments as of December 31, 2018 (audited)

William Blair SICAV – Dynamic Diversified Allocation Fund
Portfolio of Investments as of December 31, 2018 (audited) (continued)
The accompanying notes form an integral part of the financial statements.The geographical distinction is as per country of incorporation.
December 31, 2018 Wi l l iam Bla ir S ICAV 49
Holding DescriptionMarket Value
US$% of Net
Assets
Transferable securities and money market instruments admitted to an official exchange listing (continued)
Equities (continued)
Canada (continued)541 Novanta Inc. 34,083 0.05
1,156 Firstservice Corp. 79,162 0.12 2,861 Ritchie Bros Auctioneers Inc. 93,612 0.14 3,671 Rogers Communications Inc. 188,121 0.28 4,398 Suncor Energy Inc. 122,836 0.18 4,710 Toronto-Dominion Bank 234,120 0.33
1,425,271 2.10 Cayman Islands
471 58.com Inc. - ADR 25,533 0.04 3,465 Alibaba Group Holding Limited - ADR 474,947 0.69
16,000 ANTA Sports Products Limited 76,726 0.11 6,000 Chailease Holding Company Limited 18,915 0.03
20,000 China Mengniu Dairy Company Limited 62,321 0.09 22,000 Dali Foods Group Company Limited 16,267 0.02
8,000 ENN Energy Holdings Limited 70,953 0.10 2,633 Huazhu Group Limited - ADR 75,383 0.11
24,000 Kingdee International Software Group Company Limited 21,209 0.03 18,500 Li Ning Company Limited 19,846 0.03
634 NetEase.com - ADR 149,225 0.22 11,000 Shenzhou International Group Holdings Limited 124,673 0.19
8,000 SSY Group Limited 5,926 0.01 12,600 Tencent Holdings Limited 505,255 0.74
2,396 Tencent Music Entertainment Group 31,675 0.05 1,000 Wuxi Biologics (Cayman) Inc. 6,404 0.01 7,500 Xiabuxiabu Catering Management Company Limited 11,838 0.02
1,697,096 2.49 Chile
2,712 Banco Santander-Chile - ADR 81,089 0.12
81,089 0.12 China
48,000 China Communications Services Corp. Limited - H 39,722 0.06 91,500 China Merchants Bank Company Limited - H 335,361 0.48 26,000 Ping An Insurance (Group) Company of China Limited 229,603 0.33
434 Weibo Corp. - ADR 25,359 0.04 8,000 Yihai International Holdinging Limited 19,554 0.03
649,599 0.94
Czech Republic6,651 Moneta Money Bank AS 21,468 0.03
21,468 0.03
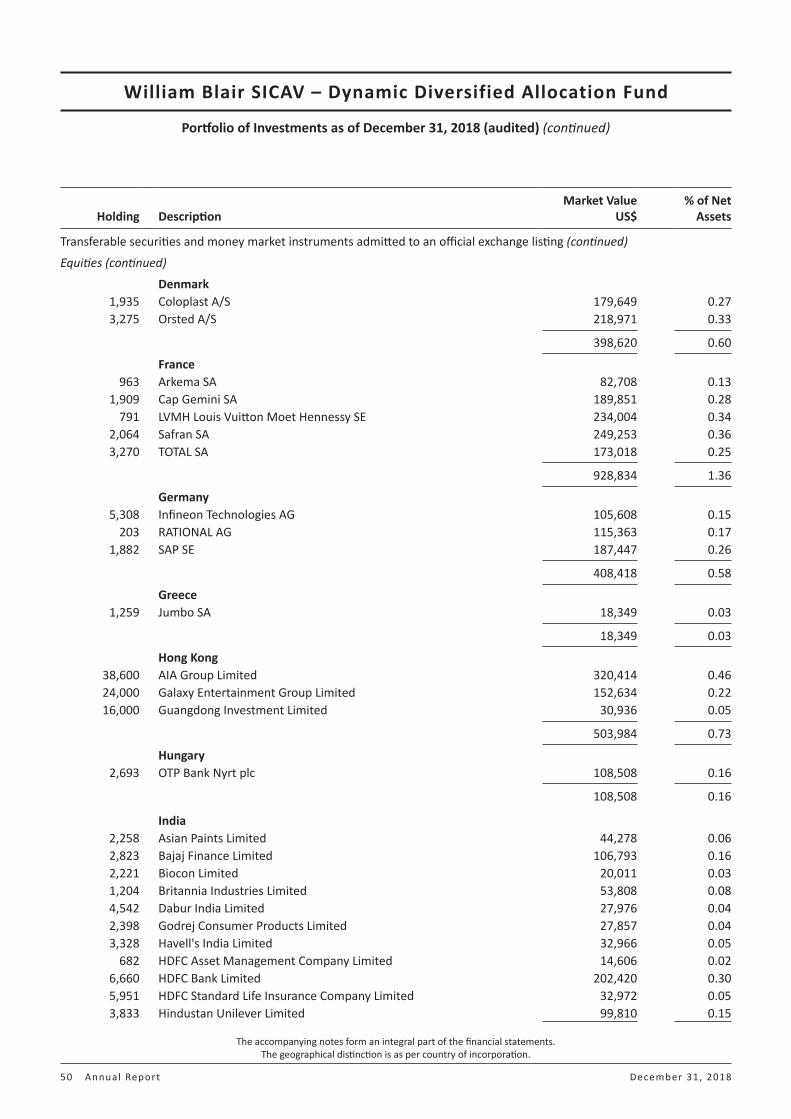
William Blair SICAV – Dynamic Diversified Allocation Fund
Portfolio of Investments as of December 31, 2018 (audited) (continued)
The accompanying notes form an integral part of the financial statements.The geographical distinction is as per country of incorporation.
50 Annual Report December 31, 2018
Holding DescriptionMarket Value
US$% of Net
Assets
Transferable securities and money market instruments admitted to an official exchange listing (continued)
Equities (continued)
Denmark1,935 Coloplast A/S 179,649 0.27 3,275 Orsted A/S 218,971 0.33
398,620 0.60
France963 Arkema SA 82,708 0.13
1,909 Cap Gemini SA 189,851 0.28 791 LVMH Louis Vuitton Moet Hennessy SE 234,004 0.34
2,064 Safran SA 249,253 0.36 3,270 TOTAL SA 173,018 0.25
928,834 1.36
Germany5,308 Infineon Technologies AG 105,608 0.15
203 RATIONAL AG 115,363 0.17 1,882 SAP SE 187,447 0.26
408,418 0.58
Greece1,259 Jumbo SA 18,349 0.03
18,349 0.03
Hong Kong38,600 AIA Group Limited 320,414 0.46 24,000 Galaxy Entertainment Group Limited 152,634 0.22 16,000 Guangdong Investment Limited 30,936 0.05
503,984 0.73
Hungary2,693 OTP Bank Nyrt plc 108,508 0.16
108,508 0.16
India2,258 Asian Paints Limited 44,278 0.06 2,823 Bajaj Finance Limited 106,793 0.16 2,221 Biocon Limited 20,011 0.03 1,204 Britannia Industries Limited 53,808 0.08 4,542 Dabur India Limited 27,976 0.04 2,398 Godrej Consumer Products Limited 27,857 0.04 3,328 Havell's India Limited 32,966 0.05
682 HDFC Asset Management Company Limited 14,606 0.02 6,660 HDFC Bank Limited 202,420 0.30 5,951 HDFC Standard Life Insurance Company Limited 32,972 0.05 3,833 Hindustan Unilever Limited 99,810 0.15

William Blair SICAV – Dynamic Diversified Allocation Fund
Portfolio of Investments as of December 31, 2018 (audited) (continued)
The accompanying notes form an integral part of the financial statements.The geographical distinction is as per country of incorporation.
December 31, 2018 Wi l l iam Bla ir S ICAV 51
Holding DescriptionMarket Value
US$% of Net
Assets
Transferable securities and money market instruments admitted to an official exchange listing (continued)
Equities (continued)
India (continued)12,349 Housing Development Finance Corp. 347,582 0.50
1,633 IndusInd Bank Limited 37,422 0.05 7,515 Infosys Technologies Limited 71,003 0.10 3,186 Marico Limited 17,095 0.02
240 Nestle India Limited 38,149 0.06 42 Page Industries Limited 15,055 0.02
1,392 Pidilite Industries Limited 22,106 0.03 3,850 Tata Consultancy Services Limited 104,491 0.15
705 Torrent Pharmaceuticals Limited 17,887 0.03 2,801 UPL Limited 30,424 0.04
1,364,711 1.98 Indonesia
90,900 PT Astra International Tbk 51,992 0.08 46,800 PT Bank Central Asia Tbk 84,616 0.12
264,700 PT Bank Rakyat Indonesia (Persero) Tbk 67,370 0.10 4,000 PT Gudang Garam Tbk 23,261 0.03 8,000 PT United Tractors Tbk 15,215 0.02
242,454 0.35 Ireland
5,217 Horizon Pharma plc 101,941 0.14 4,135 Kingspan Group plc 177,094 0.27
518 Linde plc 80,829 0.12
359,864 0.53 Israel
809 NICE Limited - ADR 87,542 0.13
87,542 0.13 Japan
1,400 Daikin Industries Limited 149,382 0.22 500 Keyence Corp. 254,003 0.37
1,200 Nitori Holdings Company Limited 150,321 0.21 12,500 ORIX Corp. 183,101 0.26
3,000 Shiseido Company Limited 188,641 0.28 2,700 Suzuki Motor Corp. 137,137 0.20
1,062,585 1.54 Jersey - Channel Islands
2,306 Ferguson plc 147,461 0.21 8,863 Experian plc 215,204 0.30
653 WNS Holdings Limited - ADR 26,943 0.04
389,608 0.55
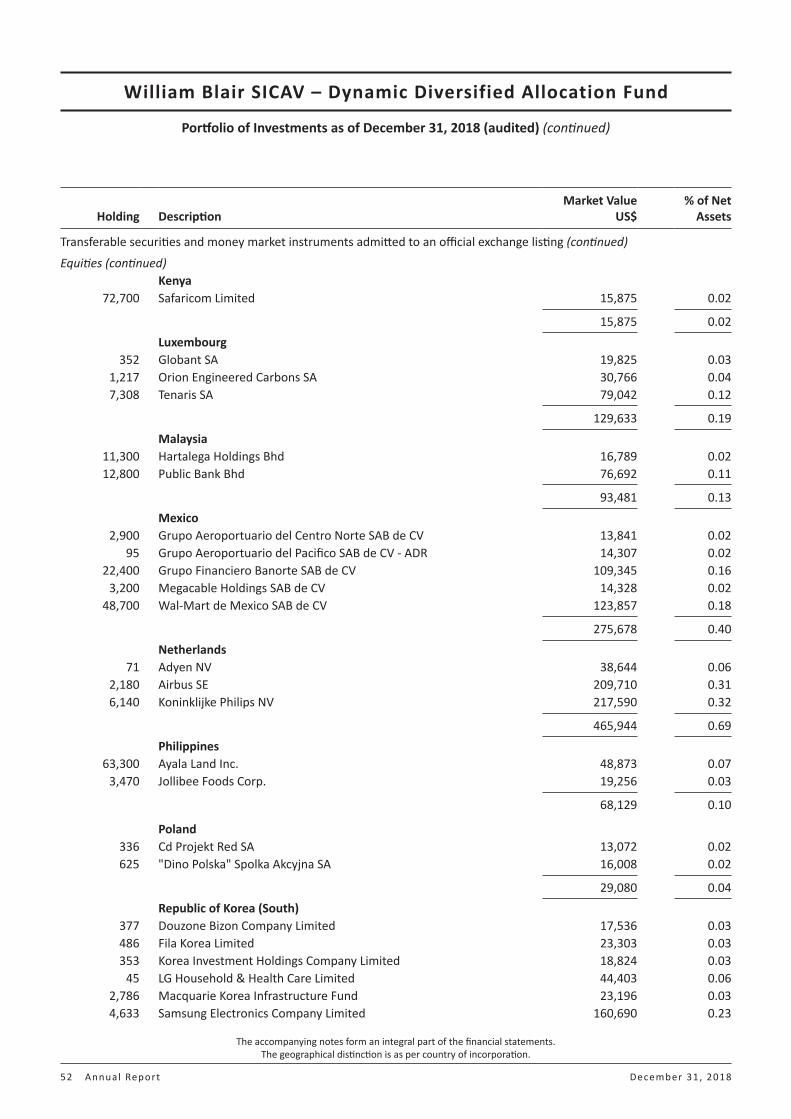
William Blair SICAV – Dynamic Diversified Allocation Fund
Portfolio of Investments as of December 31, 2018 (audited) (continued)
The accompanying notes form an integral part of the financial statements.The geographical distinction is as per country of incorporation.
52 Annual Report December 31, 2018
Holding DescriptionMarket Value
US$% of Net
Assets
Transferable securities and money market instruments admitted to an official exchange listing (continued)
Equities (continued)Kenya
72,700 Safaricom Limited 15,875 0.02
15,875 0.02 Luxembourg
352 Globant SA 19,825 0.03 1,217 Orion Engineered Carbons SA 30,766 0.04 7,308 Tenaris SA 79,042 0.12
129,633 0.19 Malaysia
11,300 Hartalega Holdings Bhd 16,789 0.02 12,800 Public Bank Bhd 76,692 0.11
93,481 0.13 Mexico
2,900 Grupo Aeroportuario del Centro Norte SAB de CV 13,841 0.02 95 Grupo Aeroportuario del Pacifico SAB de CV - ADR 14,307 0.02
22,400 Grupo Financiero Banorte SAB de CV 109,345 0.16 3,200 Megacable Holdings SAB de CV 14,328 0.02
48,700 Wal-Mart de Mexico SAB de CV 123,857 0.18
275,678 0.40 Netherlands
71 Adyen NV 38,644 0.06 2,180 Airbus SE 209,710 0.31 6,140 Koninklijke Philips NV 217,590 0.32
465,944 0.69 Philippines
63,300 Ayala Land Inc. 48,873 0.07 3,470 Jollibee Foods Corp. 19,256 0.03
68,129 0.10
Poland336 Cd Projekt Red SA 13,072 0.02 625 "Dino Polska" Spolka Akcyjna SA 16,008 0.02
29,080 0.04 Republic of Korea (South)
377 Douzone Bizon Company Limited 17,536 0.03 486 Fila Korea Limited 23,303 0.03 353 Korea Investment Holdings Company Limited 18,824 0.03
45 LG Household & Health Care Limited 44,403 0.06 2,786 Macquarie Korea Infrastructure Fund 23,196 0.03 4,633 Samsung Electronics Company Limited 160,690 0.23

William Blair SICAV – Dynamic Diversified Allocation Fund
Portfolio of Investments as of December 31, 2018 (audited) (continued)
The accompanying notes form an integral part of the financial statements.The geographical distinction is as per country of incorporation.
December 31, 2018 Wi l l iam Bla ir S ICAV 53
Holding DescriptionMarket Value
US$% of Net
Assets
Transferable securities and money market instruments admitted to an official exchange listing (continued)
Equities (continued)
Republic of Korea (South) (continued)228 Samsung SDI Company Limited 44,750 0.07 708 SK hynix Inc. 38,389 0.06
371,091 0.54 Romania
39,391 Banca Transilvania SA 19,443 0.03
19,443 0.03 South Africa
4,404 Bid Corp. Limited 81,117 0.12 714 Capitec Bank Holdings Limited 55,483 0.08
2,428 Clicks Group Limited 32,309 0.05 15,277 Firstrand Limited 69,613 0.10
1,392 JSE Limited 16,018 0.02 1,925 Mr Price Group Limited 32,934 0.05
647 Naspers Limited 130,065 0.19 4,690 Santam Limited 26,013 0.04 1,575 The Bidvest Group Limited 22,644 0.03
466,196 0.68 Spain
5,007 ACS Actividades de Construccion y Servicios SA 194,074 0.29 3,099 Amadeus IT Holding SA - A 216,023 0.31
410,097 0.60 Sweden
4,825 Atlas Copco AB - A 114,597 0.17 3,430 Hexagon AB - B 157,896 0.23
272,493 0.40 Switzerland
343 Geberit AG - Reg 133,410 0.19 854 Lonza Group AG - Reg 221,298 0.32 272 Partners Group Holding AG - Reg 164,932 0.24 411 Sika AG 52,102 0.08
1,362 Temenos Group AG - Reg 163,373 0.24
735,115 1.07 Taiwan
100,000 E.Sun Financial Holding Company Limited 65,393 0.10 1,000 Eclat Textile Company Limited 11,322 0.02 3,000 Feng Tay Enterprise Company Limited 17,129 0.03 3,000 Makalot Industrial Company Limited 16,592 0.02
10,000 President Chain Store Corp. 101,181 0.15 52,000 Taiwan Semiconductor Manufacturing Company Limited 381,493 0.56

William Blair SICAV – Dynamic Diversified Allocation Fund
Portfolio of Investments as of December 31, 2018 (audited) (continued)
The accompanying notes form an integral part of the financial statements.The geographical distinction is as per country of incorporation.
54 Annual Report December 31, 2018
Holding DescriptionMarket Value
US$% of Net
Assets
Transferable securities and money market instruments admitted to an official exchange listing (continued)
Equities (continued)
Taiwan (continued)5,476 Taiwan Semiconductor Manufacturing Company Limited - ADR 202,119 0.30 1,000 TCI Company Limited 16,885 0.02
812,114 1.20 Thailand
38,800 Airports of Thailand pcl 76,564 0.11 81,000 Bangkok Dusit Medical Services pcl 61,696 0.09 60,200 Bangkok Expressway & Metro pcl 17,935 0.03 21,800 Central Pattana pcl 50,048 0.07 17,700 CP ALL pcl 37,374 0.05
102,500 Home Product Center pcl 47,851 0.07 8,900 Muangthai Capital pcl 13,394 0.02
304,862 0.44 Turkey
1,422 Bim Birlesik Magazalar AS 23,375 0.03
23,375 0.03 United Arab Emirates
903 DP World Limited 15,441 0.02 13,710 First Abu Dhabi Bank PJSC 52,628 0.08
68,069 0.10 United Kingdom
9,005 BHP Billiton plc 189,567 0.27 2,257 BrightSphere Investment Group plc 24,105 0.04
10,243 Compass Group 215,419 0.31 2,656 London Stock Exchange Group plc 137,512 0.20 2,540 Luxfer Holdings plc 44,780 0.07
627 NMC Health plc 21,865 0.03 8,828 RELX plc 181,891 0.27 6,837 Royal Dutch Shell plc - A 200,967 0.30
18,064 Segro plc 135,521 0.20 7,572 St James's Place plc 91,108 0.13
1,242,735 1.82 United States
1,368 2U Inc. 68,017 0.10 4,015 Abercrombie & Fitch Company 80,501 0.12 4,670 Acadia Realty Trust 110,959 0.16 1,089 Activision Blizzard Inc. 50,715 0.07
630 Acuity Brands Inc. 72,419 0.11 279 Adobe Systems Inc. 63,121 0.09
5,683 Adtalem Global Education Inc. 268,920 0.39

William Blair SICAV – Dynamic Diversified Allocation Fund
Portfolio of Investments as of December 31, 2018 (audited) (continued)
The accompanying notes form an integral part of the financial statements.The geographical distinction is as per country of incorporation.
December 31, 2018 Wi l l iam Bla ir S ICAV 55
Holding DescriptionMarket Value
US$% of Net
Assets
Transferable securities and money market instruments admitted to an official exchange listing (continued)
Equities (continued)
United States (continued)994 Agilent Technologies Inc. 67,055 0.10
2,728 Agilysys Inc. 39,120 0.06 1,825 Agree Realty Corp. 107,894 0.16
495 Albany International Corp. 30,903 0.05 1,470 Allete Inc. 112,043 0.16
291 Alphabet Inc. - A 304,083 0.44 182 Amazon.com Inc. 273,359 0.40 180 Amedisys Inc. 21,080 0.03
3,890 American Assets Trust Inc. 156,262 0.22 9,365 Archrock Inc. 70,144 0.10
155 Arista Networks Inc. 32,659 0.05 527 Armstrong World Industries Inc. 30,677 0.04
3,070 Aspen Group Inc. 16,824 0.02 722 Aspen Technology Inc. 59,334 0.09
1,054 AT Home Group Inc. 19,668 0.03 2,765 Avnet Inc. 99,817 0.15 5,029 Ball Corp. 231,233 0.33 4,710 Banc of California Inc. 62,690 0.09 2,245 Banner Corp. 120,063 0.18 2,482 Belden Inc. 103,673 0.14 2,177 Blue Bird Corp. 39,600 0.06 2,142 Boot Barn Holdings Inc. 36,478 0.05 6,399 Booz Allen Hamilton Holding Corp. 288,402 0.41 7,600 Boston Private Financial Holdings Inc. 80,332 0.12 4,006 Brady Corp. 174,100 0.24
704 Brink's Company 45,514 0.07 1,056 Burlington Stores Inc. 171,779 0.24 6,239 BWX Technologies Inc. 238,517 0.35
91 Cable One Inc. 74,629 0.11 160 Calavo Growers Inc. 11,674 0.02
14,792 Callon Petroleum Company 96,000 0.14 2,166 Cambrex Corp. 81,788 0.12 1,988 Carbon Black Inc. 26,679 0.04 2,320 Carpenter Technology Corp. 82,616 0.12
758 Carrizo Oil & Gas Inc. 8,558 0.01 1,932 Cars.com Inc. 41,538 0.06 1,175 Casella Waste Systems Inc. 33,476 0.05 3,117 Catalent Inc. 97,188 0.14
570 Cavco Industries Inc. 74,317 0.11 1,319 CBOE Holdings Inc. 129,038 0.19
841 Celanese Corp. 75,665 0.11

William Blair SICAV – Dynamic Diversified Allocation Fund
Portfolio of Investments as of December 31, 2018 (audited) (continued)
The accompanying notes form an integral part of the financial statements.The geographical distinction is as per country of incorporation.
56 Annual Report December 31, 2018
Holding DescriptionMarket Value
US$% of Net
Assets
Transferable securities and money market instruments admitted to an official exchange listing (continued)
Equities (continued)
United States (continued)3,578 Centennial Resource Development Inc - A 39,430 0.06
820 Chesapeake Utilities Corp. 66,666 0.10 391 Churchill Downs Inc. 95,381 0.14
3,360 Ciena Corp. 113,937 0.16 4,590 CNO Financial Group Inc. 68,299 0.10 2,924 Coca Cola Company 138,452 0.20 3,554 Codexis Inc. 59,352 0.09 5,870 Columbia Property Trust Inc. 113,585 0.17 3,015 CommonWealth REIT 90,480 0.13 2,390 CONMED Corp. 153,438 0.22 2,994 Continental Building Products Inc. 76,197 0.11 4,963 Copart Inc. 237,132 0.35
270 Coresite Realty Corp. 23,552 0.03 620 CoStar Group Inc. 209,151 0.31 448 Costco Wholesale Corp. 91,262 0.13 947 Cryolife Inc. 26,876 0.04
3,960 CVB Finance Corp. 80,111 0.12 5,695 Dana Holding Corp. 77,623 0.11 7,506 Darling International Inc. 144,416 0.22 2,730 Dave & Buster's Entertainment Inc. 121,649 0.17
694 DexCom Inc. 83,142 0.13 302 Dine Brands Global Inc. 20,337 0.03
1,054 Dolby Laboratories Inc. - A 65,179 0.10 529 Domino's Pizza Inc. 131,186 0.19
1,008 Douglas Dynamics Inc. 36,177 0.05 319 Eagle Materials Inc. 19,469 0.03
1,340 East West Bancorp Inc. 58,330 0.09 3,837 Encore Capital Group Inc. 90,170 0.13
283 EPAM Systems Inc. 32,831 0.05 1,728 Esco Technologies Inc. 113,962 0.17
560 Etsy Inc. 26,639 0.04 1,616 Euronet Worldwide Inc. 165,446 0.24 1,248 EXACT Sciences Corp. 78,749 0.11 8,720 Extraction Oil & Gas Inc. 37,409 0.05 1,494 FirstCash Inc. 108,091 0.16
10,942 FNB Corp. 107,669 0.16 921 Fortinet Inc. 64,866 0.09
7,000 Forum Energy Technologies Inc. 28,910 0.04 3,950 Gardner Denver Holdings Inc. 80,778 0.12 1,153 Genesee & Wyoming Inc. 85,345 0.12
638 Gentherm Inc. 25,507 0.04 3,188 Glacier Bancorp Inc. 126,309 0.18

William Blair SICAV – Dynamic Diversified Allocation Fund
Portfolio of Investments as of December 31, 2018 (audited) (continued)
The accompanying notes form an integral part of the financial statements.The geographical distinction is as per country of incorporation.
December 31, 2018 Wi l l iam Bla ir S ICAV 57
Holding DescriptionMarket Value
US$% of Net
Assets
Transferable securities and money market instruments admitted to an official exchange listing (continued)
Equities (continued)
United States (continued)1,983 Glaukos Corp. 111,385 0.17 1,235 GoDaddy Inc. 81,041 0.12 6,614 GrafTech International Limited 75,664 0.11 1,865 Grand Canyon Education Inc. 179,301 0.26 1,346 Guidewire Software Inc. 107,990 0.16
16,157 Halcon Resources Corp. 27,467 0.04 3,445 Hancock Holding Company 119,369 0.17 1,757 Hanger Orthopedic Group Inc. 33,295 0.05 1,308 Hanover Insurance Group 152,735 0.22 4,822 HealthSouth Corp. 297,518 0.44 4,985 Healthcare Realty Trust Inc. 141,773 0.21 4,480 Healthcare Services Group Inc. 180,006 0.26 1,392 HEICO Corp. 87,696 0.13 2,855 Highwoods Properties Inc. 110,460 0.16 4,728 Hilton Grand Vacations Inc. 124,772 0.18 9,424 Home Bancshares Inc. 153,988 0.22 2,050 IBERIABANK Corp. 131,774 0.19 1,240 IDACORP Inc. 115,394 0.17
742 Inogen Inc. 92,134 0.13 3,076 Inphi Corp. 98,893 0.14
534 Inspire Medical Systems Inc. 22,562 0.03 1,108 Insulet Corp. 87,887 0.13 2,390 Integer Holdings Corp. 182,262 0.27 1,772 Intercontinental Exchange Inc. 133,485 0.19 4,739 Interface Inc. 67,531 0.10
980 Intersect ENT Inc. 27,616 0.04 987 J&J Snack Foods Corp. 142,710 0.21
3,141 j2 Global Communications Inc. 217,923 0.32 160 John Bean Technologies Corp. 11,490 0.02 408 Jones Lang LaSalle Inc. 51,653 0.08 940 Kadant Inc. 76,572 0.11 608 Lamb Weston Holding Inc. 44,724 0.07
5,866 Laureate Education Inc. - A 89,398 0.13 328 LHC Group Inc. 30,793 0.04 942 Ligand Pharmaceuticals Inc. 127,829 0.19 347 Lithia Motors Inc. 26,487 0.04 140 Littelfuse Inc. 24,007 0.04
3,504 Live Nation Entertainment Inc. 172,572 0.25 1,669 Liveperson Inc. 31,477 0.05 2,921 LiveRamp Holdings Inc. 112,838 0.16 1,310 Magellan Health Services Inc. 74,526 0.11
610 Martin Marietta Materials Inc. 104,841 0.15
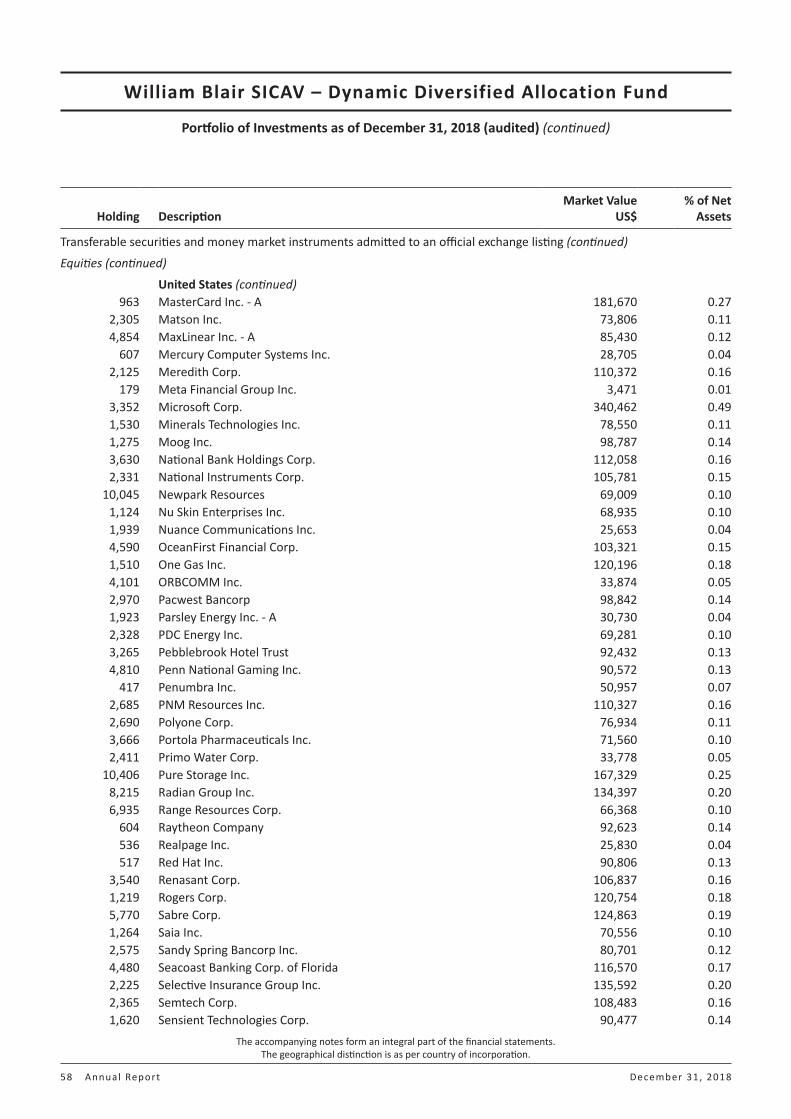
William Blair SICAV – Dynamic Diversified Allocation Fund
Portfolio of Investments as of December 31, 2018 (audited) (continued)
The accompanying notes form an integral part of the financial statements.The geographical distinction is as per country of incorporation.
58 Annual Report December 31, 2018
Holding DescriptionMarket Value
US$% of Net
Assets
Transferable securities and money market instruments admitted to an official exchange listing (continued)
Equities (continued)
United States (continued)963 MasterCard Inc. - A 181,670 0.27
2,305 Matson Inc. 73,806 0.11 4,854 MaxLinear Inc. - A 85,430 0.12
607 Mercury Computer Systems Inc. 28,705 0.04 2,125 Meredith Corp. 110,372 0.16
179 Meta Financial Group Inc. 3,471 0.01 3,352 Microsoft Corp. 340,462 0.49 1,530 Minerals Technologies Inc. 78,550 0.11 1,275 Moog Inc. 98,787 0.14 3,630 National Bank Holdings Corp. 112,058 0.16 2,331 National Instruments Corp. 105,781 0.15
10,045 Newpark Resources 69,009 0.10 1,124 Nu Skin Enterprises Inc. 68,935 0.10 1,939 Nuance Communications Inc. 25,653 0.04 4,590 OceanFirst Financial Corp. 103,321 0.15 1,510 One Gas Inc. 120,196 0.18 4,101 ORBCOMM Inc. 33,874 0.05 2,970 Pacwest Bancorp 98,842 0.14 1,923 Parsley Energy Inc. - A 30,730 0.04 2,328 PDC Energy Inc. 69,281 0.10 3,265 Pebblebrook Hotel Trust 92,432 0.13 4,810 Penn National Gaming Inc. 90,572 0.13
417 Penumbra Inc. 50,957 0.07 2,685 PNM Resources Inc. 110,327 0.16 2,690 Polyone Corp. 76,934 0.11 3,666 Portola Pharmaceuticals Inc. 71,560 0.10 2,411 Primo Water Corp. 33,778 0.05
10,406 Pure Storage Inc. 167,329 0.25 8,215 Radian Group Inc. 134,397 0.20 6,935 Range Resources Corp. 66,368 0.10
604 Raytheon Company 92,623 0.14 536 Realpage Inc. 25,830 0.04 517 Red Hat Inc. 90,806 0.13
3,540 Renasant Corp. 106,837 0.16 1,219 Rogers Corp. 120,754 0.18 5,770 Sabre Corp. 124,863 0.19 1,264 Saia Inc. 70,556 0.10 2,575 Sandy Spring Bancorp Inc. 80,701 0.12 4,480 Seacoast Banking Corp. of Florida 116,570 0.17 2,225 Selective Insurance Group Inc. 135,592 0.20 2,365 Semtech Corp. 108,483 0.16 1,620 Sensient Technologies Corp. 90,477 0.14

William Blair SICAV – Dynamic Diversified Allocation Fund
Portfolio of Investments as of December 31, 2018 (audited) (continued)
The accompanying notes form an integral part of the financial statements.The geographical distinction is as per country of incorporation.
December 31, 2018 Wi l l iam Bla ir S ICAV 59
Holding DescriptionMarket Value
US$% of Net
Assets
Transferable securities and money market instruments admitted to an official exchange listing (continued)
Equities (continued)
United States (continued)3,101 Silgan Holdings Inc. 73,246 0.11 1,683 Simpson Manufacturing Company Inc. 91,101 0.13 1,122 Simulations Plus Inc. 22,328 0.03 1,072 SiteOne Landscape Supply Inc. 59,249 0.09 1,742 Six Flags Entertainment Corp. 96,907 0.14 5,774 Solaris Oilfield Infrastructure Inc. - A 69,808 0.10 8,670 SolarWinds Corp. 119,906 0.18 3,825 South Jersey Industries Inc. 106,335 0.16 3,377 Spartan Stores Inc. 58,017 0.08 1,361 Starbucks Corp. 87,648 0.13 8,025 Sterling Bancorp 132,493 0.19
564 Stryker Corp. 88,407 0.13 7,160 Sunstone Hotel Investors Inc. 93,152 0.14
466 Teledyne Technologies Inc. 96,495 0.14 651 Teleflex Inc. 168,270 0.25
3,990 Terreno Realty Corp. 140,328 0.20 794 Texas Instruments Inc. 75,033 0.11 564 The Estee Lauder Companies Inc. 73,376 0.11
1,272 The Middleby Corp. 130,673 0.19 1,090 The Progressive Corp. 65,760 0.10
610 The Toro Company 34,087 0.05 1,840 Timken Company 68,669 0.10 1,650 Topbuild Corp. 74,250 0.11 1,663 TransUnion 94,458 0.14 1,401 Trex Company Inc. 83,163 0.12
698 Triumph Bancorp Inc. 20,731 0.03 325 Ulta Salon, Cosmetics & Fragrance Inc. 79,573 0.12
4,940 Umpqua Holdings Corp. 78,546 0.11 762 Unitedhealth Group Inc. 189,829 0.28
1,414 Universal Electronics Inc. 35,746 0.05 537 Vail Resorts Inc. 113,211 0.17 697 Varonis Systems Inc. 36,871 0.05
1,708 Veeva Systems Inc. 152,559 0.22 583 Verisk Analytics Inc. 63,570 0.09
13,001 Viavi Solutions Inc. 130,660 0.19 3,767 Virtu Financial Inc. 97,038 0.14 3,954 Weight Watchers International Inc. 152,427 0.22
864 West Pharmaceutical Services Inc. 84,698 0.12 2,620 Western Alliance Bancorp 103,464 0.15
431 WEX Inc. 60,366 0.09 589 Willdan Group Inc. 20,603 0.03
3,370 Wolverine World Wide Inc. 107,469 0.16
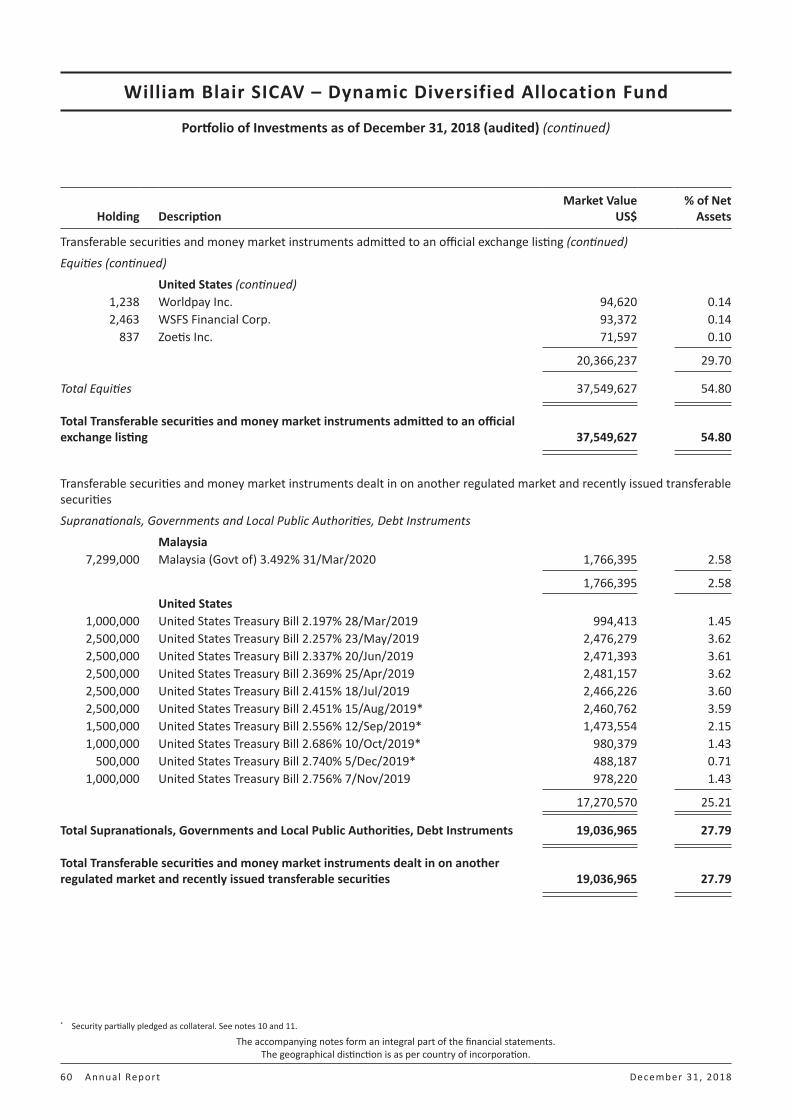
William Blair SICAV – Dynamic Diversified Allocation Fund
Portfolio of Investments as of December 31, 2018 (audited) (continued)
The accompanying notes form an integral part of the financial statements.The geographical distinction is as per country of incorporation.
60 Annual Report December 31, 2018
Holding DescriptionMarket Value
US$% of Net
Assets
Transferable securities and money market instruments admitted to an official exchange listing (continued)
Equities (continued)
United States (continued)1,238 Worldpay Inc. 94,620 0.14 2,463 WSFS Financial Corp. 93,372 0.14
837 Zoetis Inc. 71,597 0.10
20,366,237 29.70
Total Equities 37,549,627 54.80
Total Transferable securities and money market instruments admitted to an official exchange listing 37,549,627 54.80
Transferable securities and money market instruments dealt in on another regulated market and recently issued transferable securities
Supranationals, Governments and Local Public Authorities, Debt Instruments
Malaysia7,299,000 Malaysia (Govt of) 3.492% 31/Mar/2020 1,766,395 2.58
1,766,395 2.58 United States
1,000,000 United States Treasury Bill 2.197% 28/Mar/2019 994,413 1.45 2,500,000 United States Treasury Bill 2.257% 23/May/2019 2,476,279 3.62 2,500,000 United States Treasury Bill 2.337% 20/Jun/2019 2,471,393 3.61 2,500,000 United States Treasury Bill 2.369% 25/Apr/2019 2,481,157 3.622,500,000 United States Treasury Bill 2.415% 18/Jul/2019 2,466,226 3.60 2,500,000 United States Treasury Bill 2.451% 15/Aug/2019* 2,460,762 3.59 1,500,000 United States Treasury Bill 2.556% 12/Sep/2019* 1,473,554 2.15 1,000,000 United States Treasury Bill 2.686% 10/Oct/2019* 980,379 1.43
500,000 United States Treasury Bill 2.740% 5/Dec/2019* 488,187 0.71 1,000,000 United States Treasury Bill 2.756% 7/Nov/2019 978,220 1.43
17,270,570 25.21
Total Supranationals, Governments and Local Public Authorities, Debt Instruments 19,036,965 27.79
Total Transferable securities and money market instruments dealt in on another regulated market and recently issued transferable securities 19,036,965 27.79
* Security partially pledged as collateral. See notes 10 and 11.

William Blair SICAV – Dynamic Diversified Allocation Fund
Portfolio of Investments as of December 31, 2018 (audited) (continued)
The accompanying notes form an integral part of the financial statements.The geographical distinction is as per country of incorporation.
December 31, 2018 Wi l l iam Bla ir S ICAV 61
Holding DescriptionMarket Value
US$% of Net
Assets
Undertakings for collective investments in open-ended funds
Funds
Cayman Islands195,000 Vietnam Enterprise Investments Limited - C 1,135,860 1.66
1,135,860 1.66 Ireland
4,270 iShares Barclays Emerging Market Local Government Bond ETF 250,330 0.37 89,100 iShares Core MSCI Emerging Markets IMI UCITS ETF 2,313,036 3.37
3,970 iShares II plc - JPMorgan USD Emerging Markets Bond Fund 410,061 0.60 72,400 iShares MSCI Brazil UCITS ETF 2,245,890 3.28
5,219,317 7.62
Total Funds 6,355,177 9.28
Total Undertakings for collective investments in open-ended funds 6,355,177 9.28
Total Investments in Securities 62,941,769 91.87
Other Net Assets 5,570,204 8.13
Total Net Assets 68,511,973 100.00

62 Annual Report December 31, 2018
Notes to the Financial Statements
1. Basis of Presentation
William Blair SICAV (the “Company”) is an open-ended investment fund with multiple compartments organised as a Société d’Investissement à Capital Variable (SICAV), registered in the Grand Duchy of Luxembourg on the official list of collective investment undertakings pursuant to Part I of the Luxembourg law of December 17, 2010, relating to undertakings for collective investment, as amended from time to time (the “2010 Law”) and Directive 2009/65/EC, as amended from time to time (the “UCITS Directive”).
The Company currently has seven Funds:
• William Blair SICAV – U.S. All Cap Growth Fund – launched August 16, 2010, which offers Class A shares, Class B shares and Class R shares to retail shareholders only; Class D shares, Class I shares, Class J shares and Class Z shares to institutional shareholders only.
• William Blair SICAV – U.S. Small-Mid Cap Growth Fund – launched March 17, 2004, which offers Class A shares, Class B shares and Class R shares to retail shareholders only; Class D shares, Class I shares, Class J shares, Class JW shares and Class Z shares to institutional shareholders only.
• William Blair SICAV – Global Leaders Fund – launched October 16, 2007, which offers Class A shares, Class B shares and Class R shares to retail shareholders only; Class D shares, Class I shares, Class J shares and Class Z shares to institutional shareholders only.
• William Blair SICAV – Emerging Markets Growth Fund – launched October 3, 2005, which offers Class A shares, Class B shares and Class R shares to retail shareholders only; Class D shares, Class I shares, Class J shares and Class Z shares to institutional shareholders only.
• William Blair SICAV – Emerging Markets Leaders Fund – launched April 1, 2011, which offers Class A shares, Class B shares and Class R shares to retail shareholders only; Class D shares, Class I shares, Class J shares and Class Z shares to institutional shareholders only.
• William Blair SICAV – Emerging Markets Small Cap Growth Fund – launched on March 1, 2013, which offers Class A shares, Class B shares and Class R shares to retail shareholders only; Class D shares, Class I shares, Class J shares and Class Z shares to institutional shareholders only.
The Board of Directors of the William Blair SICAV resolved on January 1, 2014 to soft close the Emerging Markets Small Cap Growth Fund to new subscriptions. The Board of Directors reserves the right to re-open the Emerging Markets Small Cap Growth Fund to new subscriptions in the future.
• William Blair SICAV – Dynamic Diversified Allocation Fund – launched on March 26, 2013, which offers Class A shares, Class B shares and Class R shares to retail shareholders only; Class D shares, Class I shares, Class J shares and Class Z shares to institutional shareholders only.
Each Fund is separate from the others and will only be liable for its own obligations.
2. Summary of Significant Accounting Policies
These financial statements have been prepared in accordance with the Luxembourg legal and regulatory requirements applicable to investment funds.
a) Valuation of Investments and Other Assets
• Securities listed on a recognised stock exchange or dealt on any other regulated market are valued at their latest available prices, or, in the event that there should be several such markets, on the basis of their latest available prices on the main market for the relevant security.
In the event that the latest available price does not, in the opinion of the Board of Directors, truly reflect the fair market value of the relevant securities, the value of such securities are valued at fair value as determined in good faith pursuant to procedures established by the Board of Directors.
Notes to the Financial Statements
(continued)
December 31, 2018 Wi l l iam Bla ir S ICAV 63
2. Summary of Significant Accounting Policies (continued)
a) Valuation of Investments and Other Assets (continued)
• Securities not listed or traded on a recognised stock exchange or not dealt on another regulated market are valued on the basis of the probable sales proceeds determined prudently and in good faith by the Board of Directors.
• Securities with a short term maturity date (i.e., maturity of less than three months) may be valued by using an amortised cost method. This involves valuing an investment at its cost and thereafter assuming a constant amortisation to maturity of any discount or premium, regardless of the impact of fluctuating interest rates on the market value of the investments. While this method provides certainty in valuation, it may result in periods during which value, as determined by amortisation cost, is higher or lower than the price the Fund would receive if it sold the investment. The Board of Directors will continually assess this method of valuation and recommend changes to ensure that the Fund’s investments will be valued at their fair value as determined in good faith by the Board of Directors.
If the Board of Directors believes that a deviation from the amortised cost per share may result in material dilution or other unfair results to shareholders, the Board of Directors shall take such corrective action, if any, as it deems appropriate to eliminate or reduce, to the extent reasonably practicable, the dilution or unfair results.
Each Fund shall, in principle, keep in its portfolio the investments determined by the amortisation cost method until their respective maturity date.
• Cash, bills payable on demand and other debts are valued at their nominal amount.
• All other securities and other assets will be valued at fair market value as determined in good faith pursuant to procedures established by the Board of Directors.
b) Cost of Sales of Investments
Securities transactions are accounted for on a trade date basis.
Realised gains or losses on sales of investments have been determined on the basis of the average cost method.
c) Income from Investments
The Company takes credit for its income from investments on the following basis:
• On fixed deposits and bonds on an accrual basis;
• On equity securities when they are quoted ex-dividend net of withholding tax.
d) Expenses
Expenses are recorded on an accrual basis.
e) Foreign Exchange Contracts
The Company can enter into forward foreign exchange contracts. Open forward foreign exchange contracts are valued at the cost to close the contracts on the accounting date. Surpluses/deficits arising from these and closed unsettled contracts will be taken to unrealised gain/loss and are included in “Unrealised appreciation/depreciation on forward foreign exchange contracts” (as appropriate) in the Statements of Assets and Liabilities. As of December 31, 2018, the Company had open forward foreign exchange contracts as detailed in note 9.
f) Options
Outstanding options, if any, are valued at the last available settlement price or the last available market price of the instruments.
The market value of options, if any, is included in the Statement of Assets and Liabilities under the heading “Options at market value”.
The realised gain or loss on options is disclosed in the Statement of Operations and Changes in Net Assets under the heading “Net gain/(loss) realised on options”.
As of December 31, 2018, the Company had outstanding options as detailed in note 8.

Notes to the Financial Statements
(continued)
64 Annual Report December 31, 2018
2. Summary of Significant Accounting Policies (continued)
g) Future Contracts
Outstanding future contracts, if any, are valued at the last available settlement price or the last available market price of the instruments.
The unrealised appreciation and/or depreciation on future contracts is included in the Statement of Assets and Liabilities under the heading “Unrealised appreciation on future contracts’’ and/or “Unrealised depreciation on future contracts’’. All margin accounts are included in “Margin accounts’’.
The realised gain or loss on future contracts is disclosed in the Statement of Operations and Changes in Net Assets under the heading “Net gain/(loss) realised on future contracts’’.
As of December 31, 2018, the Company had open future contracts as detailed in note 10.
h) Swap Agreements
Over-the-Counter (“OTC”) swap contracts are valued by an independent pricing service. Depending on the product and the terms of the transaction, the independent pricing service may use a series of techniques, including simulation pricing models. The pricing models use inputs that are observed from actively quoted markets such as issuer details, indices, spreads, interest rates, yield curves, dividends and exchange rates.
Centrally cleared swaps listed or settled on a multilateral or trade facility platform, such as a registered exchange, are valued at the daily settlement price determined by the respective exchange. For centrally cleared credit default swaps the clearing facility requires its members to provide actionable price levels across complete term structures. These levels along with external third party prices are used to produce daily settlement prices.
The unrealised appreciation or depreciation on swap agreements is included in the Statement of Assets and Liabilities under the heading “Unrealised appreciation on swaps” and/or “Unrealised depreciation on swaps”. All accrued interest is included in “Other receivables/Other liabilities”.
The realised gain or loss on swap agreements is disclosed in the Statement of Operations and Changes in Net Assets under the heading “Net gain/(loss) realised on swaps”.
As of December 31, 2018, the Company had open swap contracts as detailed in note 11.
i) Foreign Exchange
Any assets or liabilities held in a Fund not expressed in the Reference Currency (US$) will be translated into the Reference Currency (US$) at the exchange rate prevailing in a recognised market at 4:00 p.m. in New York on the relevant Valuation Day. Realised profits and losses on foreign exchange are included in “Net gain/(loss) realised on foreign currencies”, except for realised foreign exchange gains and losses on investments which are included in “Net gain/(loss) realised on sale of securities”.
Transactions occurring during the year in currencies other than a Fund’s Reference Currency are translated at rates of exchange on the transaction dates.

Notes to the Financial Statements
(continued)
December 31, 2018 Wi l l iam Bla ir S ICAV 65
2. Summary of Significant Accounting Policies (continued)
i) Foreign Exchange (continued)
The following exchange rates were used to convert the assets and liabilities denominated in currencies other than the Reference Currency of a given Fund as of December 31, 2018:
Fund Currency Foreign Currency Exchange Rate Fund Currency Foreign Currency Exchange RateUSD AED 3.6731 USD KRW 1,115.7975 USD AUD 1.4197 USD MXN 19.6518 USD BRL 3.8757 USD MYR 4.1325 USD CAD 1.3652 USD NZD 1.4899 USD CHF 0.9829 USD PHP 52.5845 USD CNY 6.8683 USD PLN 3.7423 USD COP 3,246.7532 USD RON 4.0620 USD CZK 22.4613 USD RUB 69.6767 USD DKK 6.5165 USD SEK 8.8630 USD EUR 0.8728 USD SGD 1.3629 USD GBP 0.7846 USD THB 32.5595 USD HKD 7.8305 USD TRY 5.2925 USD HUF 280.2007 USD TWD 30.7371 USD IDR 14,380.2128 USD VND 23,255.8140 USD ILS 3.7392 USD ZAR 14.3875 USD INR 69.8129 USDUSD JPY 109.6050 USDUSD KES 101.8953 USD
3. Management Company
From April 28, 2006, FundRock Management Company S.A. has been appointed by the Company to act as its management company (the “Management Company”). The Management Company is approved as a management company in accordance with chapter 15 of the law of December 17, 2010 on undertakings for collective investment as amended. FundRock Management Company S.A. acts as a management company for other funds as well as the Company.
The Company has signed a management company agreement (the “Fund Management Agreement”) with the Management Company. The Management Company is in particular responsible for the following duties:
• portfolio management of the Funds (delegated to William Blair Investment Management, LLC);
• central administration, including, inter alia, the calculation of the Net Asset Value, the procedure of registration, conversion and redemption of Shares and the general administration of the Company (delegated to Citibank Europe plc, Luxembourg Branch); and
• distribution and marketing of the Shares; in this respect the Management Company may, with the consent of the Company, appoint other distributor's of the Company/nominees (delegated to William Blair & Company LLC).
With the prior approval of the Company, the Management Company appointed Citibank Europe plc, Luxembourg Branch as the Company’s central administration, corporate and paying agent (in such capacity, the “Central Administration”) and registrar and transfer agent (in such capacity, the “Registrar and Transfer Agent”).
The Directors of the Management Company are: Kevin Brown (until April 11, 2018), Romain Denis, Christophe Douche (until June 15, 2018), Eric May (non-executive), Tracey McDermott (independent non-executive), Grégory Nicolas (from November 15, 2018), Serge Ragozin (from November 15, 2018), Ross Thomson, Michael Vareika (from April 11, 2018) (independent non-executive) and Revel Wood (until December 4, 2018).
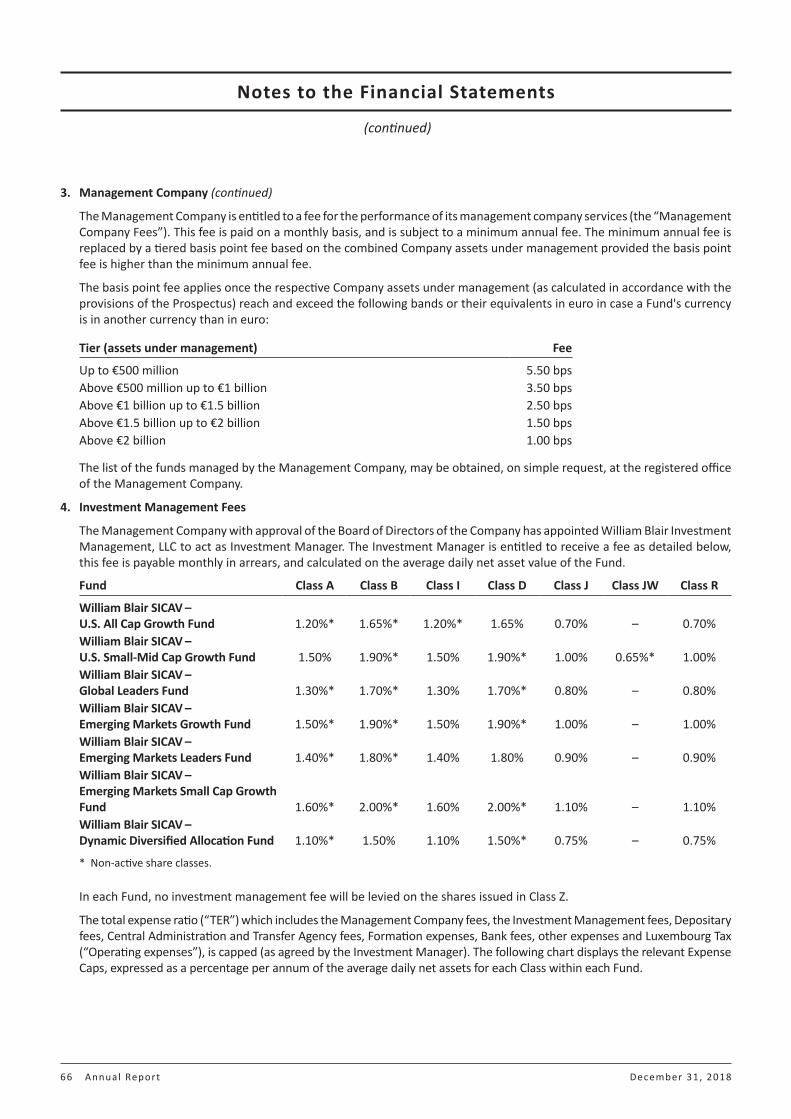
Notes to the Financial Statements
(continued)
66 Annual Report December 31, 2018
3. Management Company (continued)
The Management Company is entitled to a fee for the performance of its management company services (the “Management Company Fees”). This fee is paid on a monthly basis, and is subject to a minimum annual fee. The minimum annual fee is replaced by a tiered basis point fee based on the combined Company assets under management provided the basis point fee is higher than the minimum annual fee.
The basis point fee applies once the respective Company assets under management (as calculated in accordance with the provisions of the Prospectus) reach and exceed the following bands or their equivalents in euro in case a Fund's currency is in another currency than in euro:
Tier (assets under management) Fee
Up to €500 million 5.50 bpsAbove €500 million up to €1 billion 3.50 bpsAbove €1 billion up to €1.5 billion 2.50 bpsAbove €1.5 billion up to €2 billion 1.50 bpsAbove €2 billion 1.00 bps
The list of the funds managed by the Management Company, may be obtained, on simple request, at the registered office of the Management Company.
4. Investment Management Fees
The Management Company with approval of the Board of Directors of the Company has appointed William Blair Investment Management, LLC to act as Investment Manager. The Investment Manager is entitled to receive a fee as detailed below, this fee is payable monthly in arrears, and calculated on the average daily net asset value of the Fund.
Fund Class A Class B Class I Class D Class J Class JW Class R
William Blair SICAV – U.S. All Cap Growth Fund 1.20%* 1.65%* 1.20%* 1.65% 0.70% – 0.70%William Blair SICAV – U.S. Small-Mid Cap Growth Fund 1.50% 1.90%* 1.50% 1.90%* 1.00% 0.65%* 1.00%William Blair SICAV – Global Leaders Fund 1.30%* 1.70%* 1.30% 1.70%* 0.80% – 0.80%William Blair SICAV – Emerging Markets Growth Fund 1.50%* 1.90%* 1.50% 1.90%* 1.00% – 1.00%William Blair SICAV – Emerging Markets Leaders Fund 1.40%* 1.80%* 1.40% 1.80% 0.90% – 0.90%William Blair SICAV – Emerging Markets Small Cap Growth Fund 1.60%* 2.00%* 1.60% 2.00%* 1.10% – 1.10%William Blair SICAV – Dynamic Diversified Allocation Fund 1.10%* 1.50% 1.10% 1.50%* 0.75% – 0.75%
* Non-active share classes.
In each Fund, no investment management fee will be levied on the shares issued in Class Z.
The total expense ratio (“TER”) which includes the Management Company fees, the Investment Management fees, Depositary fees, Central Administration and Transfer Agency fees, Formation expenses, Bank fees, other expenses and Luxembourg Tax (“Operating expenses”), is capped (as agreed by the Investment Manager). The following chart displays the relevant Expense Caps, expressed as a percentage per annum of the average daily net assets for each Class within each Fund.

Notes to the Financial Statements
(continued)
December 31, 2018 Wi l l iam Bla ir S ICAV 67
4. Investment Management Fees (continued)
Fund
Expense Cap for Class A
Expense Cap for Class B
Expense Cap for Class I
Expense Cap for Class D
Expense Cap for Class J
Expense Cap for
Class JW
Expense Cap for Class R
Expense Cap for Class Z
William Blair SICAV – U.S. All Cap Growth Fund 1.50% 1.95% 1.50% 1.95% 1.00% – 1.00% 0.30%William Blair SICAV – U.S. Small-Mid Cap Growth Fund 1.80% 2.20% 1.80% 2.20% 1.30% 0.95% 1.30% 0.30%William Blair SICAV – Global Leaders Fund 1.60% 2.00% 1.60% 2.00% 1.10% – 1.10% 0.30%William Blair SICAV – Emerging Markets Growth Fund 1.80% 2.20% 1.80% 2.20% 1.30% – 1.30% 0.30%William Blair SICAV – Emerging Markets Leaders Fund 1.70% 2.10% 1.70% 2.10% 1.20% – 1.20% 0.30%William Blair SICAV – Emerging Markets Small Cap Growth Fund 1.90% 2.30% 1.90% 2.30% 1.40% – 1.40% 0.30%William Blair SICAV – Dynamic Diversified Allocation Fund 1.25% 1.65% 1.25% 1.65% 0.90% – 0.90% 0.15%
To the extent that the Operating expenses incurred by each Fund in any financial year exceed the TER expense cap, such excess amount shall be borne by the Investment Manager in the form of an Investment Management Fee waiver.
The relevant Fund will reimburse the Investment Manager for any Investment Management Fees waived or reduced and any other Fund expenses paid by the Investment Manager, if and when the TER of the relevant Fund is less than the applicable Expense Cap.
As of December 31, 2018, the Investment Manager has borne the following amounts on behalf of the Funds: William Blair SICAV – Global Leaders Fund US$67,889William Blair SICAV – Emerging Markets Small Cap Growth Fund US$156,955William Blair SICAV – Dynamic Diversified Allocation Fund US$1,241,850
5. Depositary Fees and Security Granted to Depositary
Citibank Europe plc, Luxembourg Branch has been appointed as Depositary. The Depositary is remunerated by a combination of fees based upon the Net Asset Value and the number and location of transactions. The actual level of fees can vary from time to time according to the asset allocation and the level of transactions.
In order to secure repayment of the Company’s obligations to the Depositary, the Company pledges and grants to the Depositary a continuing lien and security interest in, and right of set-off against, all of the Company’s right, title and interest in and to the accounts of the Company with the Depositary on which the assets of the Company held by the Depositary on behalf of the Company are recorded, and the securities, money and other property held in these accounts, and any other property at any time held by the Depositary for the account of the Company.

Notes to the Financial Statements
(continued)
68 Annual Report December 31, 2018
6. Other Expenses
Other expenses, which include expenses as stated in the Prospectus, are borne by the Company.
7. Central Administration and Transfer Agency Fees
Citibank Europe plc, Luxembourg Branch has been delegated the role of the Central Administrator and Registrar and Transfer Agent.
The Company pays Administration fees based on a tiered Net Asset Value tariff, specific Central Administration functions and subject to minimum fee values, and pays Transfer Agency fees based on the volume of transactions, number of holdings and subject to minimum fee values.
8. Options
As of December 31, 2018, William Blair SICAV – Dynamic Diversified Allocation Fund has the following options:
DescriptionMaturity Date
Option’s Currency
Number of Contracts
P/(S)
Market Value (USD) Counterparty
Unrealised appreciation/(depreciation)
(USD)
FX Call Option Strike Price USD 7.07 - CNY 03-Jan-19 USD 2,794,912 3 Citibank (18,700)FX Call Option Strike Price USD 75.56 - INR 03-Jan-19 USD 2,731,233 – Citibank (23,980)FX Call Option Strike Price USD 55.55 - PHP 04-Jan-19 USD 2,790,496 – Citibank (15,615)Ishares & High Yield Put Option Strike price USD 96 15-Mar-19 USD 58,800 92,882 Citibank 29,966SX5E Euro Stoxx 50 Index Put Option Strike price EUR 2,750 15-Mar-19 EUR 820 47,677 Credit Suisse 10,110FX Call Option Strike Price USD 75.76 - INR 15-Apr-19 USD 2,738,780 6,724 Citibank (17,324)FX Call Option Strike Price USD 7.12 - CNY 16-Apr-19 USD 2,784,771 9,594 Citibank (8,643)FX Call Option Strike Price USD 54.87 - PHP 16-Apr-19 USD 2,767,213 7,275 Citibank (10,194)
Total Market Value and net unrealised depreciation on Options 164,155 (54,380)
9. Forward Foreign Exchange Contracts
As of December 31, 2018, William Blair SICAV – Dynamic Diversified Allocation Fund has the following outstanding forward foreign exchange contracts:
Purchased Amount Currency Sold Amount Currency
Maturity Date Counterparty
Unrealised appreciation/ (depreciation)
(USD)
367,000 AUD 261,557 USD 20-Mar-19 Citibank (2,709)338,000 CAD 251,164 USD 20-Mar-19 Citibank (3,124)410,000 CHF 419,074 USD 20-Mar-19 Citibank 1,209
2,402,000 CNY 348,414 USD 20-Mar-19 Citibank 1,2353,617,922,000 COP 1,138,642 USD 20-Mar-19 Citibank (27,940)
1,027,000 EUR 1,185,923 USD 20-Mar-19 Citibank (1,322)121,000 GBP 153,932 USD 20-Mar-19 Citibank 892

Notes to the Financial Statements
(continued)
December 31, 2018 Wi l l iam Bla ir S ICAV 69
9. Forward Foreign Exchange Contracts (continued)
Purchased Amount Currency Sold Amount Currency
Maturity Date Counterparty
Unrealised appreciation/ (depreciation)
(USD)403,000 GBP 512,684 USD 20-Mar-19 Citibank 2,970
3,817,253,000 IDR 260,428 USD 20-Mar-19 Citibank 1,855237,880,000 INR 3,267,942 USD 20-Mar-19 Citibank 122,800
82,422,000 JPY 746,387 USD 20-Mar-19 Citibank 10,47887,447,000 JPY 777,569 USD 20-Mar-19 Citibank 25,440
111,428,000 MXN 5,480,695 USD 20-Mar-19 Citibank 119,454346,781,000 PHP 6,555,654 USD 20-Mar-19 Citibank 22,435
6,183,000 PLN 1,637,100 USD 20-Mar-19 Citibank 18,182103,467,000 RUB 1,544,399 USD 20-Mar-19 Citibank (74,961)
24,104,000 SEK 2,667,700 USD 20-Mar-19 Citibank 69,4064,883,000 SGD 3,566,056 USD 20-Mar-19 Citibank 23,159
30,132,000 TRY 5,559,923 USD 16-Jan-19 Citibank 80,0043,015,230 USD 4,172,000 AUD 20-Mar-19 Citibank 72,5941,437,792 USD 5,569,000 BRL 20-Mar-19 Citibank 9,399
987,844 USD 1,314,000 CAD 20-Mar-19 Citibank 23,5276,144,905 USD 6,048,000 CHF 20-Mar-19 Citibank (54,368)4,137,731 USD 28,552,000 CNY 20-Mar-19 Citibank (18,473)2,737,123 USD 62,067,000 CZK 20-Mar-19 Citibank (32,419)
85,258 USD 555,000 DKK 20-Mar-19 Citibank (514)8,000,924 USD 6,981,000 EUR 20-Mar-19 Citibank (51,016)
153,682 USD 121,000 GBP 20-Mar-19 Citibank (1,137)1,626,667 USD 12,713,000 HKD 20-Mar-19 Citibank (697)2,200,580 USD 17,173,000 HKD 20-Mar-19 Citibank 2,2941,244,235 USD 350,525,999 HUF 20-Mar-19 Citibank (13,608)3,469,518 USD 51,230,903,999 IDR 20-Mar-19 Citibank (51,168)1,810,322 USD 6,742,000 ILS 20-Mar-19 Citibank (3,953)
636,792 USD 45,097,000 INR 20-Mar-19 Citibank (6,050)10,050 USD 1,112,114 JPY 04-Jan-19 Citibank (100)32,061 USD 3,550,060 JPY 07-Jan-19 Citibank (349)10,669 USD 1,177,902 JPY 08-Jan-19 Citibank (85)
3,103,400 USD 3,484,186,999 KRW 20-Mar-19 Citibank (33,811)802,247 USD 898,034,999 KRW 20-Mar-19 Citibank (6,368)
4,100,253 USD 5,976,000 NZD 20-Mar-19 Citibank 83,4157,196,357 USD 235,435,999 THB 20-Mar-19 Citibank (50,254)3,912,352 USD 119,627,999 TWD 20-Mar-19 Citibank (27,260)
589,994 USD 17,996,000 TWD 20-Mar-19 Citibank (2,671)290,232 USD 4,230,000 ZAR 20-Mar-19 Citibank (992)
26,804,000 ZAR 1,878,939 USD 20-Mar-19 Citibank (33,617)
Total net unrealised appreciation on Forward Foreign Exchange Contracts (not used for share classes hedging) 191,782

Notes to the Financial Statements
(continued)
70 Annual Report December 31, 2018
9. Forward Foreign Exchange Contracts (continued)
The Dynamic Diversified Allocation Fund may employ share class hedging as a means of managing the risks associated with changes in exchange rates between the US dollar and the denomination of the share class. Any gains or losses associated with a given forward foreign currency contract will only impact the NAV of the class being hedged. As of December 31, 2018, William Blair SICAV – Dynamic Diversified Allocation Fund Class Z H AUD, Class I H EUR, Class I H GBP, Class I H SEK, Class J H CHF, Class J H EUR, Class J H GBP, Class J H SEK, Class J H JPY, Class B H EUR and Class R H EUR have the following forward foreign currency contracts outstanding for share classes hedging:
Purchased Amount Currency Sold Amount Currency
Maturity Date Counterparty
Unrealised appreciation/ (depreciation)
(USD)2,666,594 AUD 1,889,890 USD 31-Jan-19 Citibank London (10,421)
96,687 CHF 98,029 USD 31-Jan-19 Citibank London 63417,368 EUR 19,926 USD 31-Jan-19 Citibank London 2888,001 EUR 100,828 USD 31-Jan-19 Citibank London 27788,001 EUR 100,828 USD 31-Jan-19 Citibank London 27788,868 EUR 101,821 USD 31-Jan-19 Citibank London 280
10,795,736 EUR 12,369,247 USD 31-Jan-19 Citibank London 33,97478,849 GBP 100,088 USD 31-Jan-19 Citibank London 577
3,606,125 GBP 4,577,456 USD 31-Jan-19 Citibank London 26,4004,376,266,468 JPY 39,492,071 USD 31-Jan-19 Citibank London 536,937
812,596 SEK 90,565 USD 31-Jan-19 Citibank London 1,364837,500 SEK 93,341 USD 31-Jan-19 Citibank London 1,406
Total net unrealised appreciation on Forward Foreign Exchange Contracts (used for share classes hedging) 591,733
Total net unrealised appreciation on Forward Foreign Exchange Contracts 783,515 *
10. Future Contracts
As of December 31, 2018, William Blair SICAV – Dynamic Diversified Allocation Fund has the following outstanding future contracts:
Description ContractsNumber of Contracts Currency
Maturity Date Counterparty
Commitment (in future’s currency)
Unrealised appreciation/ (depreciation)
(USD)SPI 200 Futures (4) AUD 21-Mar-19 Credit Suisse (556,100) 1,338S&P 60 Future (TSE) (20) CAD 14-Mar-19 Credit Suisse (3,429,200) 12,990Canada 10 Year Bond Future (1) CAD 20-Mar-19 Credit Suisse (136,770) (3,223)EUR Swiss FED Bond 10 Year 1 CHF 07-Mar-19 Credit Suisse 157,660 1,669IBEX 35 Future (BME) 34 EUR 18-Jan-19 Credit Suisse 2,810,643 (58,335)Amsterdam Index Future (AEX) 2 EUR 18-Jan-19 Credit Suisse 195,088 734FTSE MIB Index Future 4 EUR 15-Mar-19 Credit Suisse 364,120 (8,570)DJ Euro Stoxx 50 Future (EUX) (433) EUR 15-Mar-19 Credit Suisse (12,877,420) 301,602CAC40 Index Future (FSE) 105 EUR 18-Jan-19 Credit Suisse 4,964,925 (59,572)Stoxx 600 Banks Index Future 222 EUR 15-Mar-19 Credit Suisse 1,448,550 (68,676)Euro-OAT Future 6 EUR 07-Mar-19 Citibank 904,800 (412)DAX Index Future 14 EUR 15-Mar-19 Credit Suisse 3,696,525 (44,123)Euro-Bund Future (11) EUR 07-Mar-19 Citibank (1,798,940) (14,494)Euro-BTP Futures 4 EUR 07-Mar-19 Credit Suisse 511,280 23,877Long Gilt Future (LIF) 2 GBP 27-Mar-19 Credit Suisse 246,340 2,320Hang Seng China Enterprises Index (HSCEI) (48) HKD 30-Jan-19 Credit Suisse (24,244,800) (31,262)Hang Seng Index Future (HKG) (5) HKD 30-Jan-19 Credit Suisse (6,463,500) (10,221)
* This amount corresponds to the net of unrealised appreciation and unrealised depreciation on forward foreign exchange contracts from the Statement of Assets and Liabilities.
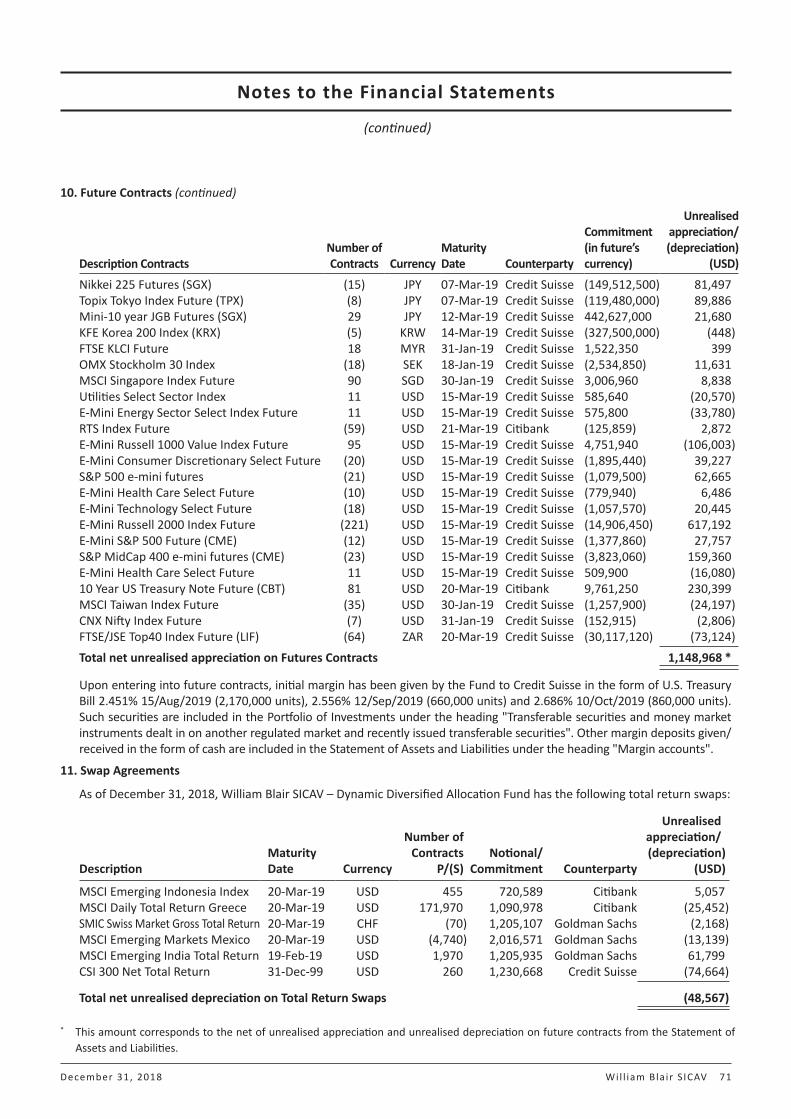
Notes to the Financial Statements
(continued)
December 31, 2018 Wi l l iam Bla ir S ICAV 71
10. Future Contracts (continued)
Description ContractsNumber of Contracts Currency
Maturity Date Counterparty
Commitment (in future’s currency)
Unrealised appreciation/ (depreciation)
(USD)Nikkei 225 Futures (SGX) (15) JPY 07-Mar-19 Credit Suisse (149,512,500) 81,497Topix Tokyo Index Future (TPX) (8) JPY 07-Mar-19 Credit Suisse (119,480,000) 89,886Mini-10 year JGB Futures (SGX) 29 JPY 12-Mar-19 Credit Suisse 442,627,000 21,680KFE Korea 200 Index (KRX) (5) KRW 14-Mar-19 Credit Suisse (327,500,000) (448)FTSE KLCI Future 18 MYR 31-Jan-19 Credit Suisse 1,522,350 399OMX Stockholm 30 Index (18) SEK 18-Jan-19 Credit Suisse (2,534,850) 11,631MSCI Singapore Index Future 90 SGD 30-Jan-19 Credit Suisse 3,006,960 8,838Utilities Select Sector Index 11 USD 15-Mar-19 Credit Suisse 585,640 (20,570)E-Mini Energy Sector Select Index Future 11 USD 15-Mar-19 Credit Suisse 575,800 (33,780)RTS Index Future (59) USD 21-Mar-19 Citibank (125,859) 2,872E-Mini Russell 1000 Value Index Future 95 USD 15-Mar-19 Credit Suisse 4,751,940 (106,003)E-Mini Consumer Discretionary Select Future (20) USD 15-Mar-19 Credit Suisse (1,895,440) 39,227S&P 500 e-mini futures (21) USD 15-Mar-19 Credit Suisse (1,079,500) 62,665E-Mini Health Care Select Future (10) USD 15-Mar-19 Credit Suisse (779,940) 6,486E-Mini Technology Select Future (18) USD 15-Mar-19 Credit Suisse (1,057,570) 20,445E-Mini Russell 2000 Index Future (221) USD 15-Mar-19 Credit Suisse (14,906,450) 617,192E-Mini S&P 500 Future (CME) (12) USD 15-Mar-19 Credit Suisse (1,377,860) 27,757S&P MidCap 400 e-mini futures (CME) (23) USD 15-Mar-19 Credit Suisse (3,823,060) 159,360E-Mini Health Care Select Future 11 USD 15-Mar-19 Credit Suisse 509,900 (16,080)10 Year US Treasury Note Future (CBT) 81 USD 20-Mar-19 Citibank 9,761,250 230,399MSCI Taiwan Index Future (35) USD 30-Jan-19 Credit Suisse (1,257,900) (24,197)CNX Nifty Index Future (7) USD 31-Jan-19 Credit Suisse (152,915) (2,806)FTSE/JSE Top40 Index Future (LIF) (64) ZAR 20-Mar-19 Credit Suisse (30,117,120) (73,124)Total net unrealised appreciation on Futures Contracts 1,148,968 *
Upon entering into future contracts, initial margin has been given by the Fund to Credit Suisse in the form of U.S. Treasury Bill 2.451% 15/Aug/2019 (2,170,000 units), 2.556% 12/Sep/2019 (660,000 units) and 2.686% 10/Oct/2019 (860,000 units). Such securities are included in the Portfolio of Investments under the heading "Transferable securities and money market instruments dealt in on another regulated market and recently issued transferable securities". Other margin deposits given/received in the form of cash are included in the Statement of Assets and Liabilities under the heading "Margin accounts".
11. Swap Agreements
As of December 31, 2018, William Blair SICAV – Dynamic Diversified Allocation Fund has the following total return swaps:
DescriptionMaturity Date Currency
Number of Contracts
P/(S)Notional/
Commitment Counterparty
Unrealised appreciation/ (depreciation)
(USD)
MSCI Emerging Indonesia Index 20-Mar-19 USD 455 720,589 Citibank 5,057MSCI Daily Total Return Greece 20-Mar-19 USD 171,970 1,090,978 Citibank (25,452)SMIC Swiss Market Gross Total Return 20-Mar-19 CHF (70) 1,205,107 Goldman Sachs (2,168)MSCI Emerging Markets Mexico 20-Mar-19 USD (4,740) 2,016,571 Goldman Sachs (13,139)MSCI Emerging India Total Return 19-Feb-19 USD 1,970 1,205,935 Goldman Sachs 61,799CSI 300 Net Total Return 31-Dec-99 USD 260 1,230,668 Credit Suisse (74,664)
Total net unrealised depreciation on Total Return Swaps (48,567)
* This amount corresponds to the net of unrealised appreciation and unrealised depreciation on future contracts from the Statement of Assets and Liabilities.

Notes to the Financial Statements
(continued)
72 Annual Report December 31, 2018
11. Swap Agreements (continued)
As of December 31, 2018, William Blair SICAV – Dynamic Diversified Allocation Fund has the following credit default swaps:
Buy/Sell protection Underlying/Issuer Currency
Notional amount
Maturity Date Counterparty
Upfront premiums received/
(paid)
Unrealised appreciation/ (depreciation)
(USD)
SellMarkit CDX.NA.HY.31 USD 456,000 20-Dec-23 Credit Suisse 2,995 9,089
SellITRAXX Europe Series 30 EUR 2,171,000 20-Dec-23 Credit Suisse 3,127 14,333
SellMarkit CDX.NA.IG.31 USD 3,707,000 20-Dec-25 Credit Suisse 4,864 (29,630)
Total net unrealised depreciation on Credit Default Swaps (6,208)
As of December 31, 2018, William Blair SICAV – Dynamic Diversified Allocation Fund has the following interest rate swaps:
DescriptionMaturity Date Currency Pay Receive
Notional/Commitment Counterparty
Upfront premiums received/
(paid)
Unrealised depreciation
(USD)
SEK Interest Rate Swap 15-Mar-29 SEK 0.01% SEK-STIBOR 8,620,000 Credit Suisse 19 (14,776)
Total net unrealised depreciation on Interest Rate Swaps (14,776)
Total net unrealised depreciation on Swaps (69,551) *
Upon entering into swap contracts, initial margin has been given by the Fund to Credit Suisse in the form of U.S. Treasury Bills 2.451% 15/Aug/2019 (307,000 units) and 2.740% 05/Dec/2019 (47,000 units). Such securities are included in the Portfolio of Investments under the heading "Transferable securities and money market instruments dealt in on another regulated market and recently issued transferable securities". Other margin deposits given/received in the form of cash are included in the Statement of Assets and Liabilities under the heading "Margin accounts".
Swap Contracts
Swap agreements may include total return, interest rate, securities index, commodity, security, currency exchange rate, credit default index, volatility and variance swaps. Swap agreements are two-party contracts entered into primarily by institutional investors for periods ranging from a few weeks to several years. In a standard “swap” transaction, two parties agree to exchange the returns (or differentials in rates of return) earned or realised on particular predetermined investments or instruments. The gross returns to be exchanged or “swapped” between the parties are calculated with respect to a “notional amount” (i.e., the change in the value of a particular dollar amount invested at a particular interest rate, in a particular foreign currency, or in a “basket” of securities representing a particular index). Swap agreements are subject to the risk that the counterparty to the swap will default on its obligation to pay the Fund and the risk that the Fund will not be able to meet its obligations to pay the counterparty to the swap. Swap agreements may also involve fees, commissions or other costs that may reduce the Fund’s gains from a swap agreement or may cause the Fund to lose money.
* This amount corresponds to the net of unrealised appreciation and unrealised depreciation on swaps from the Statement of Assets and Liabilities.

Notes to the Financial Statements
(continued)
December 31, 2018 Wi l l iam Bla ir S ICAV 73
11. Swap Agreements (continued)
Swap Contracts (continued)
Interest Rate Swaps — William Blair SICAV – Dynamic Diversified Allocation Fund may invest in interest rate swaps to gain or mitigate exposure to changes in interest rates. Interest rate swap agreements involve a commitment between parties to pay either a fixed interest rate or a floating interest rate based on a notional amount of principal. The parties make payments at predetermined intervals throughout the life of the swap. As a payer, the Fund would make the fixed payment and receive the floating payment. As a receiver, the Fund would make the floating payment and receive the fixed payment.
Credit Default Swaps — William Blair SICAV – Dynamic Diversified Allocation Fund may invest in credit default swaps as a means of “buying” credit protection (i.e., attempting to mitigate the risk of default or credit quality deterioration in some portion of the Fund’s holdings) or “selling” credit protection (i.e., attempting to gain exposure to an underlying issuer’s credit quality characteristics without directly investing in that issuer). A credit default swap is a contract between a buyer and a seller of protection against a pre-defined credit event (e.g., a ratings downgrade or default) on an underlying reference obligation, which may be a single debt instrument or baskets or indices of securities. The Fund may be a buyer or seller of a credit default swap. As a seller of protection on credit default swap agreements, the Fund will generally receive from the buyer of protection a fixed rate of income throughout the term of the swap provided that there is no credit event. The Fund adds leverage to its portfolio because the Fund is subject to investment exposure on the notional amount of the swap. The maximum potential amount of future payments that the Fund as a seller of protection could be required to make under a credit default swap agreement equals the notional amount of the agreement. Notional amounts of each individual credit default swap agreement outstanding as of period end for which the Fund is the seller of protection are disclosed in note 11. These potential amounts would be partially offset by any recovery values of the respective referenced obligations, upfront payments received upon entering into the agreement, or net amounts received from the settlement of buy protection credit default swap agreements entered into by the Fund for the same referenced entity or entities. For credit default swap contracts on credit indices, the quoted market prices and resulting values serve as an indicator of the payment performance risk. Increasing market values, in absolute terms when compared to the notional amount of the swap, represent deterioration of the referenced entities’ credit soundness and a greater likelihood or risk of default or other credit event occurring as defined under the terms of the swap.
Total Return Swaps — William Blair SICAV – Dynamic Diversified Allocation Fund may invest in total return swaps to gain or mitigate exposure to an underlying security, or securities. Total return swap agreements may involve commitments to pay interest in exchange for the return on the underlying security, or securities. At maturity, a net cash flow is exchanged between the parties based on the total return of the underlying security, or securities, less a financing rate. As a receiver, the Fund would receive a payment for a positive return and would make a payment for a negative return. As a payer, the Fund would make a payment for a positive return and would receive a payment for a negative return.
Variance Swaps — William Blair SICAV – Dynamic Diversified Allocation Fund may invest in variance swaps in order to gain or mitigate its exposure to an underlying reference entity such as a broad based index. A variance swap is an agreement between two parties to exchange cash flows based on the measured variance of a reference entity. The payer agrees to exchange the fixed rate, or the variance strike price of the reference entity, to the receiver for the floating rate, or realised variance price of the reference entity. At the time the trade is originated, the agreed upon variance strike price is generally set so that the market value of the swap is near zero. At maturity, a net cash flow is exchanged between the parties based on the difference between the final realised variance price of the swap and the variance strike price multiplied by the notional, or vega amount. As a receiver of the floating rate, the Fund would receive a payment if the final realised variance price is greater than the variance strike price and would make a payment if the final realised variance price is less than the variance strike price. As a payer of the floating rate, the Fund would receive a payment if the final realised variance price is less than the variance strike price and would make a payment if the final realised variance price is greater than the variance strike price.

Notes to the Financial Statements
(continued)
74 Annual Report December 31, 2018
12. Collateral
Collateral and margin accounts received and paid by the William Blair SICAV – Dynamic Diversified Allocation Fund in respect of derivative instruments are as follows:
Collateral type Currency Amount received Amount paid Counterparty
Cash USD – 450,000 Credit SuisseBonds USD 346,049 – Credit SuisseCash USD 50,000 – Goldman SachsCash USD – 312,000 Citibank
396,049 762,000
13. Tax Status
Under present Luxembourg law and practice, the Company is not liable to any Luxembourg income tax, or any Luxembourg capital gains tax on realised capital appreciation of the assets of the Company nor are any dividends paid by the Company liable for Luxembourg withholding tax. With regard to Class D, I, J and Z shares the Company is liable to pay a tax of 0.01% per annum (“taxe d’abonnement”) of its Net Asset Value. With regard to Class A, B and R shares the Company is liable to pay a tax of 0.05% per annum (“taxe d’abonnement”) of its Net Asset Value, such tax being paid quarterly on the basis of the net assets of the Company at the end of each calendar quarter. No stamp or other tax will be payable in Luxembourg in connection with the issue of shares. Income and capital gains on the Company’s investments, however, may be subject to withholding or capital gains taxes in certain countries.
14. Related Parties
Parties are considered to be related if one party has the ability to control the other party or exercise significant influence over the other party in making financial or operational decisions. There were no transactions with related parties other than those in the normal course of business. The Investment Manager, Management Company and Directors are deemed to be related to the Company. Fees incurred with the Investment Manager and Management Company during the period are disclosed in the Statements of Operations and Changes in Net Assets. No Directors fees are charged to the Company.
15. Dividend Policy
Each year the annual general meeting of shareholders will decide, based on a proposal from the Directors, on the use of the Company’s net income in respect of the previous financial year ending December 31 for each distribution Category of every Fund (if any).
At the general meeting of shareholders held on June 19, 2018, the shareholders of the Company determined to approve the Board’s proposal to distribute dividends to the shareholders of the William Blair SICAV – Emerging Markets Leaders Fund, Class J I GBP (ISIN: LU1023416511), within the limits prescribed by the Luxembourg law dated December 17, 2010 as amended from time to time on undertakings for collective investment.
The Board resolved to distribute a dividend as follows:
Fund Class Currency Dividend per Share
Total Dividend
Distributed
Distribution Date
William Blair SICAV – Emerging Markets Leaders Fund
J I GBP USD 0.185157 3,613 29-Jun-18
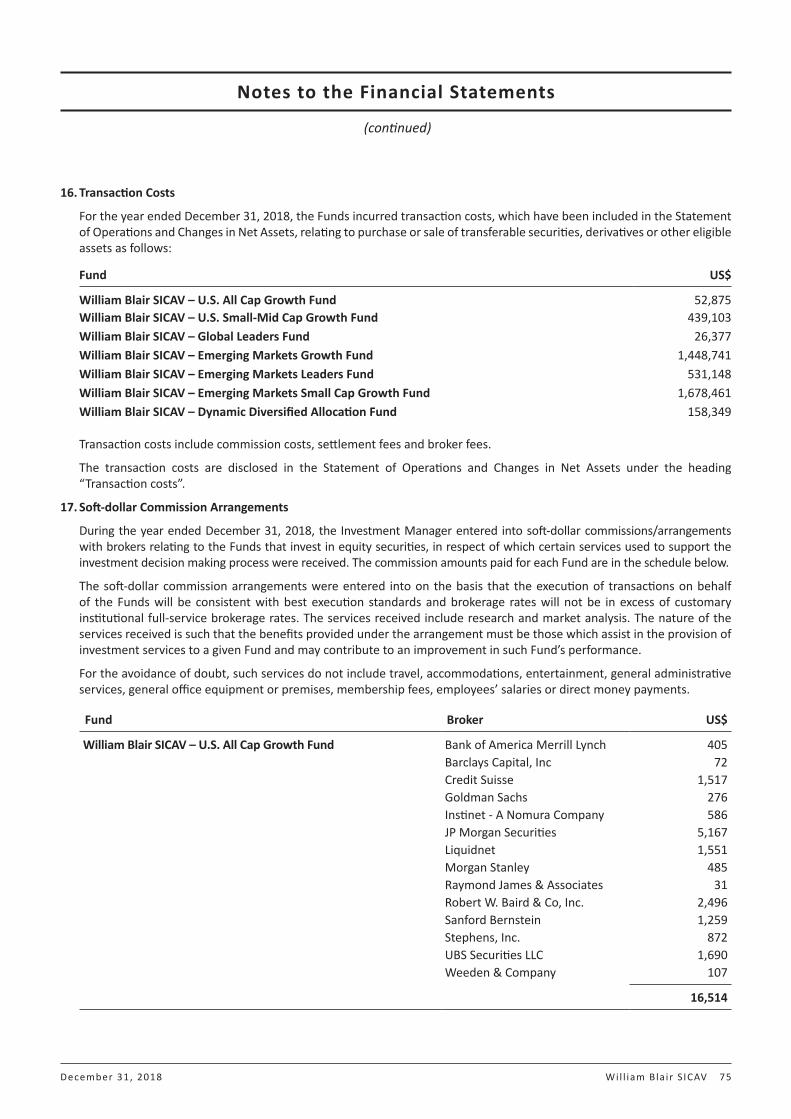
Notes to the Financial Statements
(continued)
December 31, 2018 Wi l l iam Bla ir S ICAV 75
16. Transaction Costs
For the year ended December 31, 2018, the Funds incurred transaction costs, which have been included in the Statement of Operations and Changes in Net Assets, relating to purchase or sale of transferable securities, derivatives or other eligible assets as follows:
Fund US$
William Blair SICAV – U.S. All Cap Growth Fund 52,875 William Blair SICAV – U.S. Small-Mid Cap Growth Fund 439,103 William Blair SICAV – Global Leaders Fund 26,377 William Blair SICAV – Emerging Markets Growth Fund 1,448,741 William Blair SICAV – Emerging Markets Leaders Fund 531,148 William Blair SICAV – Emerging Markets Small Cap Growth Fund 1,678,461 William Blair SICAV – Dynamic Diversified Allocation Fund 158,349
Transaction costs include commission costs, settlement fees and broker fees.
The transaction costs are disclosed in the Statement of Operations and Changes in Net Assets under the heading “Transaction costs”.
17. Soft-dollar Commission Arrangements
During the year ended December 31, 2018, the Investment Manager entered into soft-dollar commissions/arrangements with brokers relating to the Funds that invest in equity securities, in respect of which certain services used to support the investment decision making process were received. The commission amounts paid for each Fund are in the schedule below.
The soft-dollar commission arrangements were entered into on the basis that the execution of transactions on behalf of the Funds will be consistent with best execution standards and brokerage rates will not be in excess of customary institutional full-service brokerage rates. The services received include research and market analysis. The nature of the services received is such that the benefits provided under the arrangement must be those which assist in the provision of investment services to a given Fund and may contribute to an improvement in such Fund’s performance.
For the avoidance of doubt, such services do not include travel, accommodations, entertainment, general administrative services, general office equipment or premises, membership fees, employees’ salaries or direct money payments.
Fund Broker US$
William Blair SICAV – U.S. All Cap Growth Fund Bank of America Merrill Lynch 405 Barclays Capital, Inc 72 Credit Suisse 1,517 Goldman Sachs 276 Instinet - A Nomura Company 586 JP Morgan Securities 5,167 Liquidnet 1,551 Morgan Stanley 485 Raymond James & Associates 31 Robert W. Baird & Co, Inc. 2,496 Sanford Bernstein 1,259 Stephens, Inc. 872 UBS Securities LLC 1,690 Weeden & Company 107
16,514

Notes to the Financial Statements
(continued)
76 Annual Report December 31, 2018
17. Soft-dollar Commission Arrangements (continued)
Fund Broker US$
William Blair SICAV – U.S. Small-Mid Cap Growth Fund Bank of America Merrill Lynch 1,164 Barclays Capital, Inc 141 Credit Suisse 14,509 Goldman Sachs 136 Instinet - A Nomura Company 12,556 Jones & Associates 341 JP Morgan Securities 25,359 Liquidnet 17,910 Morgan Stanley 1,427 Piper Jaffray & Co. 2,815 Raymond James & Associates 113 Robert W. Baird & Co, Inc. 16,862 Sanford Bernstein 22,424 Stephens, Inc. 6,797 UBS Securities LLC 28,994 Weeden & Company 695
152,243
William Blair SICAV – Global Leaders Fund Bank of America Merrill Lynch 1,519 Citigroup Global Markets Inc. 832 Credit Suisse 2,445 JP Morgan Securities 1,132 Morgan Stanley 511 UBS Securities LLC 825
7,264
William Blair SICAV – Emerging Markets Growth Fund Bank of America Merrill Lynch 10,394 Citigroup Global Markets Inc. 12,095 CLSA Americas, LLC 11,216 Credit Suisse 10,637 JP Morgan Securities 7,481 Morgan Stanley 4,312 UBS Securities LLC 9,177
65,312
William Blair SICAV – Emerging Markets Leaders Fund Bank of America Merrill Lynch 4,194 Citigroup Global Markets Inc. 6,406 CLSA Americas, LLC 6,474 Credit Suisse 6,346 JP Morgan Securities 504 Morgan Stanley 3,106 UBS Securities LLC 4,911
31,941
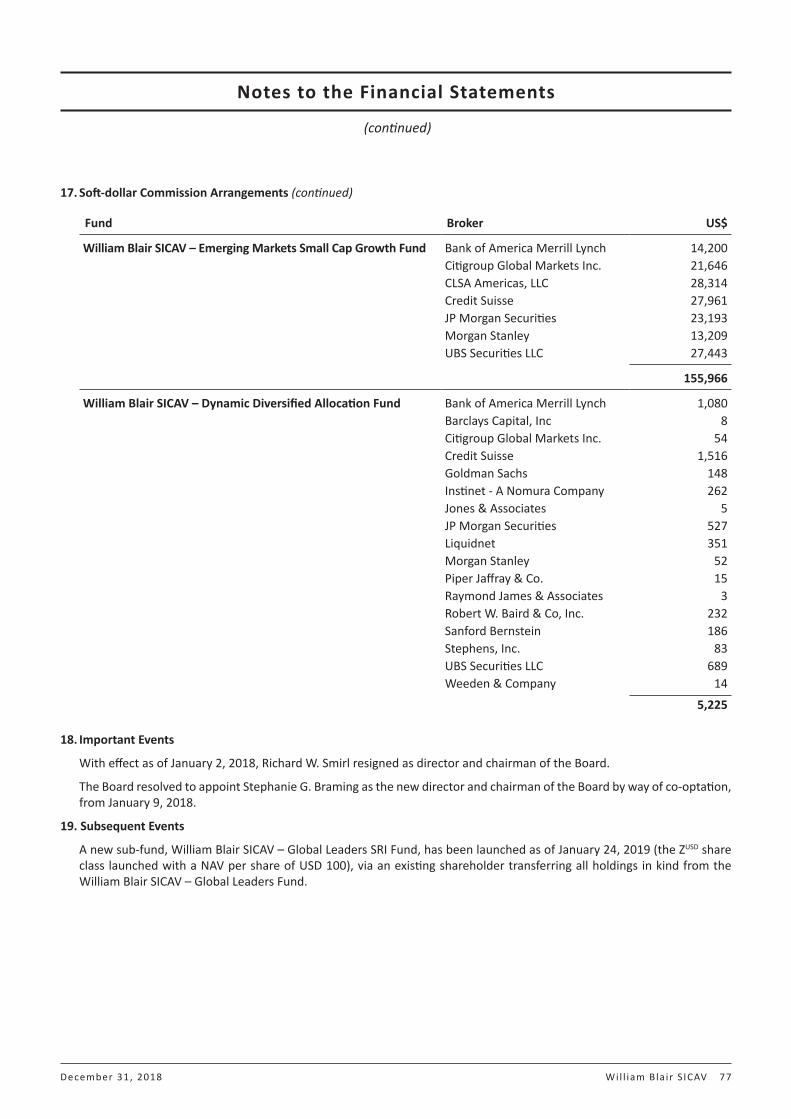
Notes to the Financial Statements
(continued)
December 31, 2018 Wi l l iam Bla ir S ICAV 77
17. Soft-dollar Commission Arrangements (continued)
Fund Broker US$
William Blair SICAV – Emerging Markets Small Cap Growth Fund Bank of America Merrill Lynch 14,200 Citigroup Global Markets Inc. 21,646 CLSA Americas, LLC 28,314 Credit Suisse 27,961 JP Morgan Securities 23,193 Morgan Stanley 13,209 UBS Securities LLC 27,443
155,966
William Blair SICAV – Dynamic Diversified Allocation Fund Bank of America Merrill Lynch 1,080 Barclays Capital, Inc 8 Citigroup Global Markets Inc. 54 Credit Suisse 1,516 Goldman Sachs 148 Instinet - A Nomura Company 262 Jones & Associates 5 JP Morgan Securities 527 Liquidnet 351 Morgan Stanley 52 Piper Jaffray & Co. 15 Raymond James & Associates 3 Robert W. Baird & Co, Inc. 232 Sanford Bernstein 186 Stephens, Inc. 83 UBS Securities LLC 689 Weeden & Company 14
5,225
18. Important Events
With effect as of January 2, 2018, Richard W. Smirl resigned as director and chairman of the Board.
The Board resolved to appoint Stephanie G. Braming as the new director and chairman of the Board by way of co-optation, from January 9, 2018.
19. Subsequent Events
A new sub-fund, William Blair SICAV – Global Leaders SRI Fund, has been launched as of January 24, 2019 (the ZUSD share class launched with a NAV per share of USD 100), via an existing shareholder transferring all holdings in kind from the William Blair SICAV – Global Leaders Fund.
EYErn~;t & YoungSociete anonyme
Building a betterworking world
35E, Avenue John F. KennedyL-1855 LuxembourCJ
Tel: + 35242 124 1
B.P. 780L-20 17 Luxembourg
R.C.S. Luxembourg B 47 771TVA LU 16063074
www.ey.com/luxembourCJ
Independent auditor's report
To the Shareholders ofWilliam Blair SICAV31, Z.A. BourmichtL-8070 BertrangeGrand Duchy of Luxembourg
Opinion
We have audited the financial statements of William Blair SICAV (the "Company") and of each of its sub-funds, whichcomprise the statement of assets and liabilities and the portfolio of investments as at December 31, 2018, and thestatement of operations and changes in net assets for the year then ended, and the notes to the financial statements,including a summary of significant accounting policies.
In our opinion, the accompanying financial statements give a true and fair view of the financial position of the Companyand of each of its sub-funds as at December 31, 2018, and of the results of their operations and changes in their netassets for the year then ended in accordance with Luxembourg legal and regulatory requirements relating to thepreparation and presentation of the financial statements.
Basis for Opinion
We conducted our audit in accordance with the Law of July 23,2016 on the audit profession (the "Law of July 23,2016")and with International Standards on Auditing ("ISAs") as adopted for Luxembourg by the "Commission de Surveillance duSecteur Financier" ("CSSF"). Our responsibilities under the Law of July 23, 2016 and ISAs are further described in the"responsibilities of the "reviseur d'entreprises agree" for the audit of the financial statements" section of our report. Weare also independent of the Company in accordance with the International Ethics Standards Board for Accountants'Code of Ethics for Professional Accountants ("IESBA Code") as adopted for Luxembourg by the CSSF together with theethical requirements that are relevant to our audit of the financial statements, and have fulfilled our other ethicalresponsibilities under those ethical requirements. We believe that the audit evidence we have obtained is sufficient andappropriate to provide a basis for our opinion.
Other information
The Board of Directors of the Company is responsible for the other information. The other information comprises theinformation included in the annual report but does not include the financial statements and our report of the "reviseurd'entreprises agree" thereon.
Our opinion on the financial statements does not cover the other information and we do not express any form ofassurance conclusion thereon.
In connection with our audit of the financial statements, our responsibility is to read the other information and, in doingso, consider whether the other information is materially inconsistent with the financial statements or our knowledgeobtained in the audit or otherwise appears to be materially misstated. If, based on the work we have performed, weconclude that there is a material misstatement of this other information, we are required to report this fact. We havenothing to report in this regard.
Responsibilities of the Board of Directors of the Company for the financial statements
The Board of Directors of the Company is responsible for the preparation and fair presentation of these financialstatements in accordance with Luxembourg legal and regulatory requirements relating to the preparation andpresentation of the financial statements, and for such internal control as the Board of Directors of the Companydetermines is necessary to enable the preparation of financial statements that are free from material misstatement,whether due to fraud or error.
In preparing the financial statements, the Board of Directors of the Company is responsible for assessing the Company'sand each of its sub-funds' ability to continue as a going concern, disclosing, as applicable, matters related to goingconcern and using the going concern basis of accounting unless the Board of Directors of the Company either intends toliquidate the Company or any of its sub-funds or to cease operations, or has no realistic alternative but to do so.
78 Annual Report December 31,2018
/, member form of Emsl & YOl..:n(} Global Llnll!ed
EYBuilding a betterworking world
Responsibilities of the "reviseur d'entreprises agree" for the audit of the financial statements
Our objectives are to obtain reasonable assurance about whether the financial statements as a whole are free frommaterial misstatement, whether due to fraud or error, and to issue a report of the "reviseur d'entreprises agree" thatincludes our opinion. Reasonable assurance is a high level of assurance, but is not a guarantee that an audit conductedin accordance with the Law of July 23,2016 and with ISAs as adopted for Luxembourg by the CSSF will always detect amaterial misstatement when it exists. Misstatements can arise from fraud or error and are considered material if,individually or in the aggregate, they could reasonably be expected to influence the economic decisions of users takenon the basis of these financial statements.
As part of an audit in accordance with the Law of July 23,2016 and with ISAs as adopted for Luxembourg by the CSSF,we exercise professional judgment and maintain professional skeptiCism throughout the audit. We also:
Identify and assess the risks of material misstatement of the financial statements, whether due to fraud or error,design and perform audit procedures responsive to those risks, and obtain audit evidence that is sufficient andappropriate to provide a basis for our opinion. The risk of not detecting a material misstatement resulting from fraud ishigher than for one resulting from error, as fraud may involve collusion, forgery, intentional omissions,misrepresentations, or the override of internal control.
Obtain an understanding of internal control relevant to the audit in order to design audit procedures that areappropriate in the circumstances, but not for the purpose of expressing an opinion on the effectiveness of theCompany's internal control.
Evaluate the appropriateness of accounting policies used and the reasonableness of accounting estimates andrelated disclosures made by the Board of Directors of the Company.
Conclude on the appropriateness of the Board of Directors of the Company's use of the going concern basis ofaccounting and, based on the audit evidence obtained, whether a material uncertainty exists related to events orconditions that may cast significant doubt on the Company's or any of its sub-funds' ability to continue as a goingconcern. If we conclude that a material uncertainty exists, we are required to draw attention in our report of the"reviseur d'entreprises agree" to the related disclosures in the financial statements or, if such disclosures areinadequate, to modify our opinion. Our conclusions are based on the audit evidence obtained up to the date of ourreport of the "reviseur d'entreprises agree". However, future events or conditions may cause the Company or any ofits sub-funds to cease to continue as a going concern.
Evaluate the overall presentation, structure and content of the financial statements, including the disclosures, andwhether the financial statements represent the underlying transactions and events in a manner that achieves fairpresentation.
We communicate with those charged with governance regarding, among other matters, the planned scope and timing ofthe audit and significant audit findings, including any significant deficiencies in internal control that we identify during ouraudit.
Ernst & YoungSociete anonyme
Cabinet de revision agree
~,c~
Kerry Nichol
Luxembourg, March 22, 2019
The auditor's report is based upon the auditor's review of the Company's English language financial statements.
December 31, 2018 William Blair SICAV 79
.'-"rnelTli)Cr flr:ll of Ernst & Young Global Lunlled

80 Annual Report December 31, 2018
General Information
(unaudited)
Current Prospectus
The Company’s Prospectus dated January 2019, along with an application form may be obtained from the Administrator, the Facilities Agent and the Paying and Information Agents. Copies of the Company’s Articles of Association may also be obtained, free of charge, from the Administrator, the Facilities Agent and the Paying and Information Agents.
Authorised Status
The Company is an Undertaking for Collective Investment in Transferable Securities (“UCITS”) under Part I of the Luxembourg law of December 17, 2010, as amended. Regulatory consents have been approved or appropriate notifications have been made for the distribution of shares in Austria, Denmark, Finland, France, Germany, Ireland, Norway, Singapore (restricted scheme), Spain (Classes A, D, J, I and R USD for William Blair SICAV – U.S. Small-Mid Cap Growth Fund and Classes A, J, I and R USD for all other sub-funds), Sweden, Switzerland and the United Kingdom.
Facilities Agent
IrelandBridge Consulting33 Sir John Rogerson’s Quay Dublin 2, Ireland
Paying and Information Agents
Austria Germany Switzerland SwedenUniCredit Bank Austria A.G. GerFIS – German Fund NPB Neue Private Bank AG SEB ABSchottengasse 6-8 Information Service UG Limmatquai 1/am Bellevue Sergels Torg 2A-1010 Vienna Zum Eichhagen 4 P.O. Box CH-8024 Zurich SE-106 40 StockholmAustria D-21382 Brietlingen Switzerland Sweden
Germany
Swiss Representative Austria Representative
First Independent Fund Services, A.G. OEKBKlausstrasse 33 Strauchgasse 1-3CH-8008 Zurich A-1010 ViennaSwitzerland Austria
Publication of Prices and Notices to Shareholders
Financial notices are given by publication in the Luxemburger Wort in Luxembourg. The share prices are available daily on http://sicav.williamblair.com. Prices are also available at the registered office of the Company and the Paying and Information Agents on each dealing day.
Report and Accounts
The annual report and audited financial statement are available from the registered office of the Company, the Facilities Agent and the Paying and Information Agents and the Swiss Representative within four months after the end of the financial year, and shall be available at least eight days before the annual general meeting of the Company.
The unaudited Semi-Annual Report is available from the registered office of the Company, the Facilities Agent and the Paying and Information Agents and the representative offices within two months after June 30.
Copies of all reports, the Prospectus and KIID and articles of association are available on https://sicav.williamblair.com/investor_services/prospectus_forms_reports/reports_application.fs, and they are free of charge at the representative offices.
Purchases and Sales
A detailed list of investments purchased and sold during the year is available upon request, free of charge, from the registered office of the Company, the Facilities Agent and the Paying and Information Agents and for Swiss investors, the Swiss Representative.

General Information
(unaudited) (continued)
December 31, 2018 Wi l l iam Bla ir S ICAV 81
Total Expense Ratio
Total Expense Ratio (TER) is calculated as the total of all expenses (excluding transaction costs, commissions and interest), divided by the average net assets of the Company, expressed as a percentage. This has been calculated in accordance with the guidelines of the Swiss Funds & Asset Management Association (SFAMA).
For the year January 1, 2018 - December 31, 2018, the TER’s are as follows:
William Blair SICAV – U.S. All Cap Growth Fund
Gross TER (excluding
reimbursement) Reimbursement /
Waiver
Net TER (including
reimbursement)Capped Expense
Ratio
Class D USD 1.84% 0.00% 1.84% 1.95%Class J USD 5 0.87% 0.00% 0.87% 1.00%Class R USD 5 0.91% 0.00% 0.91% 1.00%
William Blair SICAV – U.S. Small-Mid Cap Growth Fund
Gross TER (excluding
reimbursement) Reimbursement /
Waiver
Net TER (including
reimbursement)Capped Expense
Ratio
Class A USD 2 1.65% 0.00% 1.65% 1.80%Class I USD 1.63% 0.00% 1.63% 1.80%Class I I GBP 4 1.69% 0.00% 1.69% 1.80%Class J USD 1.13% 0.00% 1.13% 1.30%Class J I GBP 1.14% 0.00% 1.14% 1.30%Class R USD 2 1.18% 0.00% 1.18% 1.30%Class Z USD 0.13% 0.00% 0.13% 0.30%
William Blair SICAV – Global Leaders Fund
Gross TER (excluding
reimbursement) Reimbursement /
Waiver
Net TER (including
reimbursement)Capped Expense
Ratio
Class I USD 1.57% 0.03% 1.60% 1.60%Class I EUR 1.57% 0.03% 1.60% 1.60%Class J USD 1.07% 0.03% 1.10% 1.10%Class J EUR 5 1.15% -0.05% 1.10% 1.10%Class R USD 3 1.13% -0.03% 1.10% 1.10%Class R EUR 5 1.25% -0.15% 1.10% 1.10%Class Z USD 0.27% 0.03% 0.30% 0.30%Class Z AUD 0.27% 0.03% 0.30% 0.30%
William Blair SICAV – Emerging Markets Growth Fund
Gross TER (excluding
reimbursement) Reimbursement /
Waiver
Net TER (including
reimbursement)Capped Expense
Ratio
Class I USD 1.74% 0.00% 1.74% 1.80%Class J USD 1.27% 0.00% 1.27% 1.30%Class R USD 3 1.29% 0.00% 1.29% 1.30%Class Z USD 0.26% 0.00% 0.26% 0.30%

General Information
(unaudited) (continued)
82 Annual Report December 31, 2018
Total Expense Ratio (continued)
William Blair SICAV – Emerging Markets Leaders Fund
Gross TER (excluding
reimbursement) Reimbursement /
Waiver
Net TER (including
reimbursement)Capped Expense
Ratio
Class I USD 1.62% 0.00% 1.62% 1.70%Class D USD 2.02% 0.00% 2.02% 2.10%Class J USD 1.12% 0.00% 1.12% 1.20%Class J I GBP 1.12% 0.00% 1.12% 1.20%Class R USD 5 1.13% 0.00% 1.13% 1.20%Class Z USD 0.22% 0.00% 0.22% 0.30%Class Z AUD 0.22% 0.00% 0.22% 0.30%
William Blair SICAV – Emerging Markets Small Cap Growth Fund
Gross TER (excluding
reimbursement) Reimbursement /
Waiver
Net TER (including
reimbursement)Capped Expense
Ratio
Class I USD 1.96% -0.06% 1.90% 1.90%Class J USD 1.46% -0.06% 1.40% 1.40%Class R USD 5 1.77% -0.37% 1.40% 1.40%Class Z USD 0.37% -0.07% 0.30% 0.30%
William Blair SICAV – Dynamic Diversified Allocation Fund
Gross TER (excluding
reimbursement) Reimbursement /
Waiver
Net TER (including
reimbursement)Capped Expense
Ratio
Class B H EUR 5 4.83% -3.18% 1.65% 1.65%Class I USD 1.60% -0.35% 1.25% 1.25%Class I H EUR 1.59% -0.34% 1.25% 1.25%Class I H GBP 1.78% -0.53% 1.25% 1.25%Class I H SEK 7.69% -6.44% 1.25% 1.25%Class J USD 1.25% -0.35% 0.90% 0.90%Class J H CHF 6.76% -5.86% 0.90% 0.90%Class J H EUR 6.40% -5.50% 0.90% 0.90%Class J H GBP 6.42% -5.52% 0.90% 0.90%Class J H SEK 10.41% -9.51% 0.90% 0.90%Class J H JPY 1 1.17% -0.27% 0.90% 0.90%Class R USD 5 1.59% -0.69% 0.90% 0.90%Class R H EUR 5 4.08% -3.18% 0.90% 0.90%Class Z H AUD 0.99% -0.84% 0.15% 0.15%
1 Launched on May 24, 20182 Launched on July 10, 20183 Launched on October 4, 20184 Reactivated on November 5, 20185 Launched on December 19, 2018
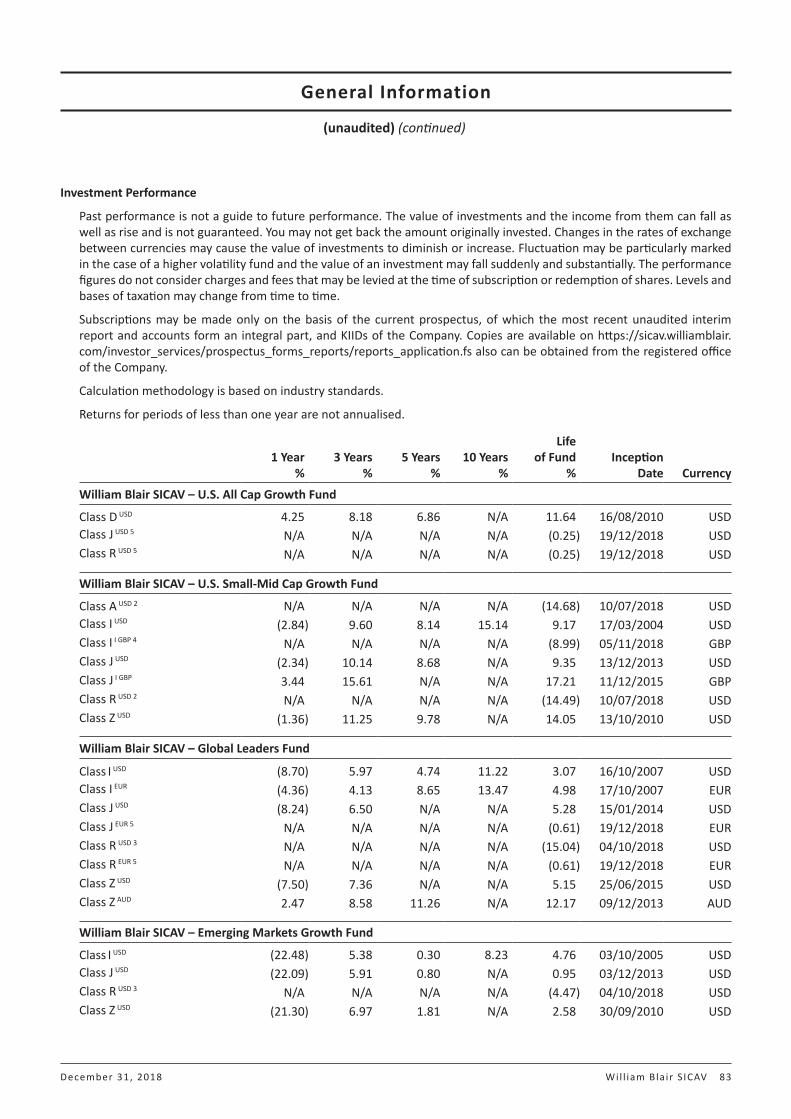
General Information
(unaudited) (continued)
December 31, 2018 Wi l l iam Bla ir S ICAV 83
Investment Performance
Past performance is not a guide to future performance. The value of investments and the income from them can fall as well as rise and is not guaranteed. You may not get back the amount originally invested. Changes in the rates of exchange between currencies may cause the value of investments to diminish or increase. Fluctuation may be particularly marked in the case of a higher volatility fund and the value of an investment may fall suddenly and substantially. The performance figures do not consider charges and fees that may be levied at the time of subscription or redemption of shares. Levels and bases of taxation may change from time to time.
Subscriptions may be made only on the basis of the current prospectus, of which the most recent unaudited interim report and accounts form an integral part, and KIIDs of the Company. Copies are available on https://sicav.williamblair.com/investor_services/prospectus_forms_reports/reports_application.fs also can be obtained from the registered office of the Company.
Calculation methodology is based on industry standards.
Returns for periods of less than one year are not annualised.
1 Year %
3 Years %
5 Years%
10 Years%
Life of Fund
%Inception
Date Currency
William Blair SICAV – U.S. All Cap Growth Fund
Class D USD 4.25 8.18 6.86 N/A 11.64 16/08/2010 USDClass J USD 5 N/A N/A N/A N/A (0.25) 19/12/2018 USDClass R USD 5 N/A N/A N/A N/A (0.25) 19/12/2018 USD
William Blair SICAV – U.S. Small-Mid Cap Growth Fund
Class A USD 2 N/A N/A N/A N/A (14.68) 10/07/2018 USDClass I USD (2.84) 9.60 8.14 15.14 9.17 17/03/2004 USDClass I I GBP 4 N/A N/A N/A N/A (8.99) 05/11/2018 GBPClass J USD (2.34) 10.14 8.68 N/A 9.35 13/12/2013 USDClass J I GBP 3.44 15.61 N/A N/A 17.21 11/12/2015 GBPClass R USD 2 N/A N/A N/A N/A (14.49) 10/07/2018 USDClass Z USD (1.36) 11.25 9.78 N/A 14.05 13/10/2010 USD
William Blair SICAV – Global Leaders Fund
Class I USD (8.70) 5.97 4.74 11.22 3.07 16/10/2007 USDClass I EUR (4.36) 4.13 8.65 13.47 4.98 17/10/2007 EURClass J USD (8.24) 6.50 N/A N/A 5.28 15/01/2014 USDClass J EUR 5 N/A N/A N/A N/A (0.61) 19/12/2018 EURClass R USD 3 N/A N/A N/A N/A (15.04) 04/10/2018 USDClass R EUR 5 N/A N/A N/A N/A (0.61) 19/12/2018 EURClass Z USD (7.50) 7.36 N/A N/A 5.15 25/06/2015 USDClass Z AUD 2.47 8.58 11.26 N/A 12.17 09/12/2013 AUD
William Blair SICAV – Emerging Markets Growth Fund
Class I USD (22.48) 5.38 0.30 8.23 4.76 03/10/2005 USDClass J USD (22.09) 5.91 0.80 N/A 0.95 03/12/2013 USDClass R USD 3 N/A N/A N/A N/A (4.47) 04/10/2018 USDClass Z USD (21.30) 6.97 1.81 N/A 2.58 30/09/2010 USD

General Information
(unaudited) (continued)
84 Annual Report December 31, 2018
Investment Performance (continued)
1 Year %
3 Years %
5 Years%
10 Years%
Life of Fund
%Inception
Date Currency
William Blair SICAV – Emerging Markets Leaders Fund
Class I USD (17.84) 5.83 0.73 N/A 0.25 01/04/2011 USDClass D USD (18.18) 5.40 0.32 N/A (0.12) 14/04/2011 USDClass J USD (17.42) 6.36 N/A N/A 2.76 07/02/2014 USDClass J I GBP (12.53) 11.63 N/A N/A 8.61 05/02/2014 GBPClass R USD 5 N/A N/A N/A N/A 1.45 19/12/2018 USDClass Z USD (16.67) 7.32 2.15 N/A 2.63 11/11/2013 USDClass Z AUD (7.69) 8.54 7.11 N/A 7.34 09/12/2013 AUD
William Blair SICAV – Emerging Markets Small Cap Growth Fund
Class I USD (24.51) 0.19 1.44 N/A 2.71 01/03/2013 USDClass J USD (24.11) N/A N/A N/A 2.20 24/06/2016 USDClass R USD 5 N/A N/A N/A N/A 1.81 19/12/2018 USDClass Z USD (23.29) 1.80 3.07 N/A 4.67 24/09/2013 USD
William Blair SICAV – Dynamic Diversified Allocation Fund
Class B H EUR 5 N/A N/A N/A N/A 0.73 19/12/2018 EURClass I USD 0.07 2.96 3.29 N/A 4.21 26/03/2013 USDClass I H EUR (2.99) 0.74 N/A N/A (0.74) 28/05/2015 EURClass I H GBP (1.82) 1.77 N/A N/A 0.71 30/06/2015 GBPClass I H SEK (3.00) N/A N/A N/A 0.41 25/08/2016 SEKClass J USD 0.42 3.32 N/A N/A 2.03 30/06/2015 USDClass J H CHF (2.87) N/A N/A N/A 0.36 23/09/2016 CHFClass J H EUR (2.50) N/A N/A N/A 0.81 23/09/2016 EURClass J H GBP (1.27) N/A N/A N/A 1.96 23/09/2016 GBPClass J H SEK (2.72) 1.02 N/A N/A (0.41) 29/04/2015 SEKClass J H JPY 1 N/A N/A N/A N/A (2.41) 24/05/2018 JPYClass R USD 5 N/A N/A N/A N/A 0.92 19/12/2018 USDClass R H EUR 5 N/A N/A N/A N/A 0.76 19/12/2018 EURClass Z H AUD 0.65 4.39 5.58 N/A 5.96 05/12/2013 AUD
1 Launched on May 24, 20182 Launched on July 10, 20183 Launched on October 4, 20184 Reactivated on November 5, 20185 Launched on December 19, 2018
General Information
(unaudited) (continued)
December 31, 2018 Wi l l iam Bla ir S ICAV 85
Risk Management
The Company and the Management Company use a risk-management process that enables them to monitor and measure at any time the risk of the Funds’ portfolio positions and their contribution to the overall risk profile of the Company. They use the commitment approach for all the Funds – except the William Blair SICAV – Dynamic Diversified Allocation Fund; for which a Value-at-Risk approach is used – for the risk measurement and the calculation of global exposure of the Funds, in accordance with the most applicable guidelines of the European Securities and Markets Authority (ESMA).
General investment risk
The value of your investments may fluctuate. Past performance is no guarantee of future results. The net asset value of the Funds is affected by developments in the financial markets and may both rise and fall. Shareholders run the risk that their investments may end up being worth less than the amount invested or even worth nothing. Because each Fund invests substantially all of its assets in equity securities, the main risk is that the value of the equity securities it holds may decrease in response to the activities of an individual company or in response to general market, business and economic conditions. This may, in turn, affect the NAV per share. General investment risk can be broken down into market risk, concentration risk and currency risk.
Market risk
The value of the securities owned by a Fund may go up or down, sometimes rapidly or unpredictably. Securities may decline in value due to factors affecting securities markets generally or particular industries represented in the securities markets. The value of a security may decline due to general market conditions that are not specifically related to a particular company, such as real or perceived adverse economic conditions, changes in the general outlook for corporate earnings, changes in interest or currency rates or adverse investor sentiment generally. The value of a security may also decline due to factors that affect a particular industry or industries, such as labor shortages or increased production costs and competitive conditions within an industry. During a general downturn in the securities markets, multiple asset classes may decline in value simultaneously.
Concentration risk
Based on its investment policy, a Fund may invest in financial instruments from issuing institutions that (mainly) operate within the same sector or region, or in the same market. If this is the case, the concentration of the investment portfolio of a Fund may cause events that have an effect on these issuing institutions to have a greater effect on such Fund’s assets than would occur with a less concentrated investment portfolio.
Currency risk
The Reference Currency of each Fund is the US$. Investments are made that best benefit the objective and performance of each Fund in the view of the Investment Manager. Changes in foreign currency exchange rates may affect the value of the Shares held in the Funds which invest in non-U.S. investments and those Shares held in a Class denominated in a currency other than the US$. Shareholders investing in the Funds other than in their reference currency should be aware that exchange rate fluctuations could cause the value of their investment to diminish or increase.
Counterparty risk
A counterparty of a Fund may fail to fulfil its obligations towards that Fund. In case of hedging transactions in classes of shares, the relevant Fund carries the counterparty risk. This risk is limited as much as possible by taking every possible care in the selection of counterparties. Wherever it is customary in the market, the Company will demand and obtain collateral.
Liquidity risk
Investments that trade less frequently can be more difficult or more costly to buy, or to sell, than more liquid or active investments. It may not be possible to sell or otherwise dispose of illiquid securities both at the price and within a time period deemed desirable by a Fund. Securities subject to liquidity risk in which a Fund may invest include private placements, Rule 144A securities, below investment grade securities and other securities without an established market.

General Information
(unaudited) (continued)
86 Annual Report December 31, 2018
Foreign Investment Risk
The risks of investing in securities of foreign issuers may include less publicly available information, less governmental regulation and supervision of foreign stock exchanges, brokers and issuers, a lack of uniform accounting, auditing and financial reporting standards, practices and requirements, the possibility of expropriation, seizure or nationalization, confiscatory taxation, adverse changes in investment or exchange control regulations, political instability, restrictions on the flow of international capital, difficulty in obtaining and enforcing judgments against foreign entities or other adverse political, social or diplomatic developments that could affect a Fund’s investments. Securities of some foreign issuers are less liquid and their prices more volatile than the securities of U.S. companies. In addition, the time period for settlement of transactions in certain foreign markets generally is longer than for domestic markets.
Foreign securities held by a Fund usually will be denominated in currencies other than the U.S. dollar. Therefore, changes in foreign exchange rates will affect the value of the securities held by a Fund either beneficially or adversely. Fluctuations in foreign currency exchange rates will also affect the dollar value of dividends and interest earned, gains and losses realised on the sale of securities and net investment income and gains, if any, available for distribution to shareholders.
Emerging Markets Risk
Foreign investment risk is typically intensified in emerging markets, which are the less developed and developing nations. Certain of these countries have in the past failed to recognize private property rights and have at times nationalized and expropriated the assets of private companies. Political, social and economic structures in many emerging market countries may be less established and may change rapidly. Such countries may also lack the social, political and economic characteristics of more developed countries. Unanticipated political, social or economic developments may affect the values of a Fund’s investments in emerging market countries and the availability to a Fund of additional investments in these countries.
The currencies of certain emerging market countries have from time to time experienced a steady devaluation relative to the U.S. dollar, and continued devaluations may adversely affect the value of a Fund’s assets denominated in such currencies. Many emerging market countries have experienced substantial rates of inflation for many years, and continued inflation may adversely affect the economies and securities markets of such countries.
The small size, limited trading volume and relative inexperience of the securities markets in these countries may make a Fund’s investments in such countries illiquid and more volatile than investments in more developed countries. There may be little financial or accounting information available with respect to issuers located in these countries, and it may be difficult as a result to assess the value or prospects of an investment in such issuers.
The system of share registration and custody in some emerging market countries may create certain risks of loss (including in some cases the risk of total loss) and a Fund may be required to establish special custodial or other arrangements before making investments in these countries. There is an increased risk of uninsured loss due to lost, stolen or counterfeit stock certificates or unauthorized trading, or other fraudulent activity.
Prior governmental approval of non-domestic investments may be required and foreign investment in domestic companies may be subject to limitation in some emerging market countries. Foreign ownership limitations also may be imposed by the charters of individual companies in emerging market countries to prevent, among other concerns, violation of foreign investment limitations. Repatriation of investment income, capital and proceeds of sales by foreign investors may require governmental registration and/or approval in some developing countries. A Fund could be adversely affected by delays in or a refusal to grant any required governmental registration or approval for such repatriation.
The economies of certain developing countries may be dependent upon international trade and, accordingly, have been and may continue to be adversely affected by trade barriers, exchange controls, managed adjustments in relative currency values and other protectionist measures imposed or negotiated by the countries with which they trade. These economies also have been and may continue to be adversely affected by economic conditions in the countries with which they trade.
Geographic Risk
Although the Funds investing primarily in foreign securities currently intend to maintain geographic diversification, such Funds have the flexibility to invest up to 50% (65% for Global Leaders Fund) of their equity holdings in securities of issuers in any one country. To the extent that a Fund invests a significant portion of its assets in any one country, the Fund will be subject to greater risk of loss or volatility than if the Fund always maintained wide geographic diversity among the countries in which it invests. Investing in any one country makes a Fund more vulnerable to the risks of adverse securities markets, exchange rates and social, political, regulatory and economic events in that one country.
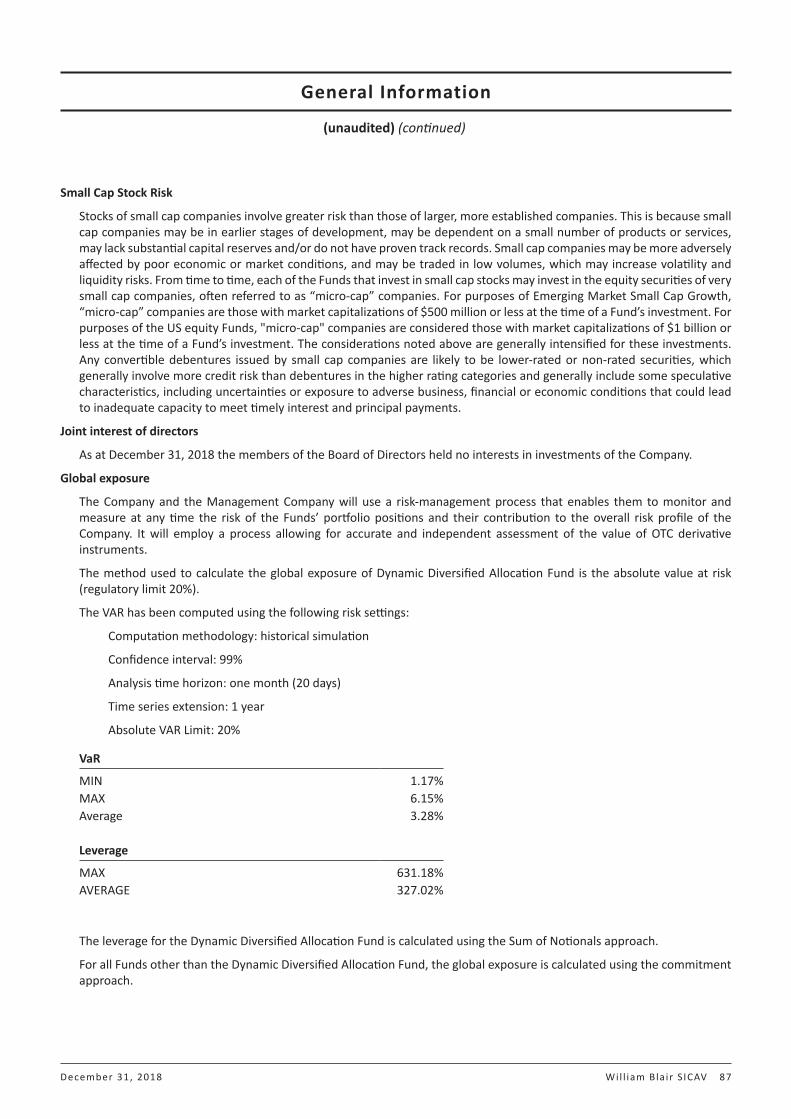
General Information
(unaudited) (continued)
December 31, 2018 Wi l l iam Bla ir S ICAV 87
Small Cap Stock Risk
Stocks of small cap companies involve greater risk than those of larger, more established companies. This is because small cap companies may be in earlier stages of development, may be dependent on a small number of products or services, may lack substantial capital reserves and/or do not have proven track records. Small cap companies may be more adversely affected by poor economic or market conditions, and may be traded in low volumes, which may increase volatility and liquidity risks. From time to time, each of the Funds that invest in small cap stocks may invest in the equity securities of very small cap companies, often referred to as “micro-cap” companies. For purposes of Emerging Market Small Cap Growth, “micro-cap” companies are those with market capitalizations of $500 million or less at the time of a Fund’s investment. For purposes of the US equity Funds, "micro-cap" companies are considered those with market capitalizations of $1 billion or less at the time of a Fund’s investment. The considerations noted above are generally intensified for these investments. Any convertible debentures issued by small cap companies are likely to be lower-rated or non-rated securities, which generally involve more credit risk than debentures in the higher rating categories and generally include some speculative characteristics, including uncertainties or exposure to adverse business, financial or economic conditions that could lead to inadequate capacity to meet timely interest and principal payments.
Joint interest of directors
As at December 31, 2018 the members of the Board of Directors held no interests in investments of the Company.
Global exposure
The Company and the Management Company will use a risk-management process that enables them to monitor and measure at any time the risk of the Funds’ portfolio positions and their contribution to the overall risk profile of the Company. It will employ a process allowing for accurate and independent assessment of the value of OTC derivative instruments.
The method used to calculate the global exposure of Dynamic Diversified Allocation Fund is the absolute value at risk (regulatory limit 20%).
The VAR has been computed using the following risk settings:
Computation methodology: historical simulation
Confidence interval: 99%
Analysis time horizon: one month (20 days)
Time series extension: 1 year
Absolute VAR Limit: 20%
VaR
MIN 1.17%MAX 6.15%Average 3.28%
Leverage
MAX 631.18%AVERAGE 327.02%
The leverage for the Dynamic Diversified Allocation Fund is calculated using the Sum of Notionals approach.
For all Funds other than the Dynamic Diversified Allocation Fund, the global exposure is calculated using the commitment approach.
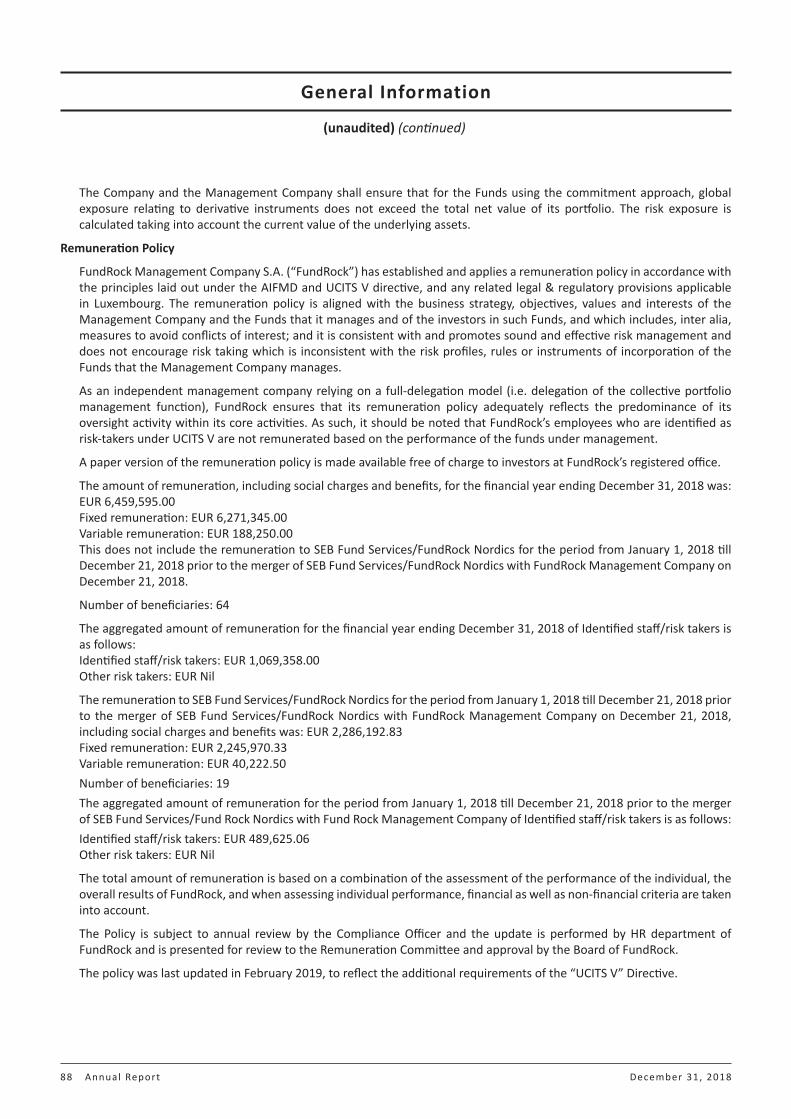
General Information
(unaudited) (continued)
88 Annual Report December 31, 2018
The Company and the Management Company shall ensure that for the Funds using the commitment approach, global exposure relating to derivative instruments does not exceed the total net value of its portfolio. The risk exposure is calculated taking into account the current value of the underlying assets.
Remuneration Policy
FundRock Management Company S.A. (“FundRock”) has established and applies a remuneration policy in accordance with the principles laid out under the AIFMD and UCITS V directive, and any related legal & regulatory provisions applicable in Luxembourg. The remuneration policy is aligned with the business strategy, objectives, values and interests of the Management Company and the Funds that it manages and of the investors in such Funds, and which includes, inter alia, measures to avoid conflicts of interest; and it is consistent with and promotes sound and effective risk management and does not encourage risk taking which is inconsistent with the risk profiles, rules or instruments of incorporation of the Funds that the Management Company manages.
As an independent management company relying on a full-delegation model (i.e. delegation of the collective portfolio management function), FundRock ensures that its remuneration policy adequately reflects the predominance of its oversight activity within its core activities. As such, it should be noted that FundRock’s employees who are identified as risk-takers under UCITS V are not remunerated based on the performance of the funds under management.
A paper version of the remuneration policy is made available free of charge to investors at FundRock’s registered office.
The amount of remuneration, including social charges and benefits, for the financial year ending December 31, 2018 was: EUR 6,459,595.00 Fixed remuneration: EUR 6,271,345.00 Variable remuneration: EUR 188,250.00 This does not include the remuneration to SEB Fund Services/FundRock Nordics for the period from January 1, 2018 till December 21, 2018 prior to the merger of SEB Fund Services/FundRock Nordics with FundRock Management Company on December 21, 2018.
Number of beneficiaries: 64
The aggregated amount of remuneration for the financial year ending December 31, 2018 of Identified staff/risk takers is as follows: Identified staff/risk takers: EUR 1,069,358.00 Other risk takers: EUR Nil
The remuneration to SEB Fund Services/FundRock Nordics for the period from January 1, 2018 till December 21, 2018 prior to the merger of SEB Fund Services/FundRock Nordics with FundRock Management Company on December 21, 2018, including social charges and benefits was: EUR 2,286,192.83 Fixed remuneration: EUR 2,245,970.33 Variable remuneration: EUR 40,222.50 Number of beneficiaries: 19 The aggregated amount of remuneration for the period from January 1, 2018 till December 21, 2018 prior to the merger of SEB Fund Services/Fund Rock Nordics with Fund Rock Management Company of Identified staff/risk takers is as follows: Identified staff/risk takers: EUR 489,625.06 Other risk takers: EUR Nil
The total amount of remuneration is based on a combination of the assessment of the performance of the individual, the overall results of FundRock, and when assessing individual performance, financial as well as non-financial criteria are taken into account.
The Policy is subject to annual review by the Compliance Officer and the update is performed by HR department of FundRock and is presented for review to the Remuneration Committee and approval by the Board of FundRock.
The policy was last updated in February 2019, to reflect the additional requirements of the “UCITS V” Directive.

General Information
(unaudited) (continued)
December 31, 2018 Wi l l iam Bla ir S ICAV 89
Securities Financing Transaction Regulation
The Securities Financing Transaction Regulation (“SFTR”) introduces reporting requirements for securities financing transactions (“SFTs”) and total return swaps. A SFT is defined as per Article 3(11) of the SFTR as:
• a repurchase/reverse repurchase agreement;
• securities or commodities lending and securities or commodities borrowing;
• a buy-sell back transaction or sell-buy back transaction; or
• a margin lending transaction.
As at December 31, 2018, the William Blair SICAV – Dynamic Diversified Allocation Fund held total return swaps (“TRS”) as type of instrument in scope of the SFTR.
Global Data
The amount of assets/liabilities across total return swaps as at December 31, 2018 is as follows:
Type of Asset/Liability Amount % of NAVTotal Return swaps (48,567) -0.07%
Data on reuse of collateral
There was no collateral reuse during the year ended December 31, 2018.
There was no cash collateral reinvestment during the year ended December 31, 2018.
Concentration data
There was no security collateral received for total return swaps as at December 31, 2018.
Safekeeping of collateral received
There was no security collateral received for total return swaps as at December 31, 2018.
Safekeeping of collateral granted
The amount of security collateral granted for total return swaps as at December 31, 2018 is as follows:
Asset Market Value % of NAVUS Treasury Bill 347,787 0.51%
Return/Costs
Return and cost for total return swaps for the year ended December 31, 2018 is as follows:
Returns * Amount % of overall returns**To Fund 945,838 100%
Costs *** Amount % of overall returnsTo Fund 1,178,543 100%
* Returns are identified as the realized gains, change in unrealized gains and interest received on TRS contracts during the reporting period.
** All returns from OTC derivative transactions will accrue to the portfolio and are not subject to any returns sharing agreement with the portfolio’s manager or any other third parties.
*** Costs are identified as realized losses and interest paid on TRS contracts during the reporting period.

General Information
(unaudited) (continued)
90 Annual Report December 31, 2018
Aggregate transaction data
The maturity of total return swaps as at December 31, 2018 is as follows:
Total return swaps
Maturity AmountLess than one day 0One day to one week 0One week to one month 0One month to three months 26,097Three months to one year 0Above one year 0Open Maturity (74,664)
The settlement and clearing mechanisms for total return swaps as at December 31, 2018 are as follows:
Total return swaps
Settlement and clearing mechanism AmountBilateral (48,567)
Aggregate transaction data (continued)
The aggregate transaction data for collateral positions (including cash) granted/received across total return swaps as at December 31, 2018 is as follows:
Counterparty Type of collateral Par Amount Quality Maturity of collateral
Currency of collateral
Country
Credit Suisse U.S. Treasury Bill 307,000 AAA 15-Aug-19 USD U.S.Credit Suisse U.S. Treasury Bill 47,000 AAA 05-Dec-19 USD U.S.Credit Suisse Cash (450,000) N/A N/A USD U.S.Goldman Sachs Cash 50,000 N/A N/A USD U.S.Citibank Cash (312,000) N/A N/A USD U.S.

31, Z.A. BourmichtL-8070 BertrangeGrand Duchy of LuxembourgLuxembourg R.C.S: B-98 806 sicav.williamblairfunds.com
William Blair SICAV