willingness-to-pay for attributes of health care
TRANSCRIPT
University of Kentucky University of Kentucky
UKnowledge UKnowledge
Theses and Dissertations--Agricultural Economics Agricultural Economics
2018
WILLINGNESS-TO-PAY FOR ATTRIBUTES OF HEALTH CARE WILLINGNESS-TO-PAY FOR ATTRIBUTES OF HEALTH CARE
FACILITIES IN RURAL KENTUCKY FACILITIES IN RURAL KENTUCKY
Emmanuel Owusu-Amankwah University of Kentucky, [email protected] Digital Object Identifier: https://doi.org/10.13023/ETD.2018.033
Right click to open a feedback form in a new tab to let us know how this document benefits you. Right click to open a feedback form in a new tab to let us know how this document benefits you.
Recommended Citation Recommended Citation Owusu-Amankwah, Emmanuel, "WILLINGNESS-TO-PAY FOR ATTRIBUTES OF HEALTH CARE FACILITIES IN RURAL KENTUCKY" (2018). Theses and Dissertations--Agricultural Economics. 64. https://uknowledge.uky.edu/agecon_etds/64
This Master's Thesis is brought to you for free and open access by the Agricultural Economics at UKnowledge. It has been accepted for inclusion in Theses and Dissertations--Agricultural Economics by an authorized administrator of UKnowledge. For more information, please contact [email protected].

STUDENT AGREEMENT: STUDENT AGREEMENT:
I represent that my thesis or dissertation and abstract are my original work. Proper attribution
has been given to all outside sources. I understand that I am solely responsible for obtaining
any needed copyright permissions. I have obtained needed written permission statement(s)
from the owner(s) of each third-party copyrighted matter to be included in my work, allowing
electronic distribution (if such use is not permitted by the fair use doctrine) which will be
submitted to UKnowledge as Additional File.
I hereby grant to The University of Kentucky and its agents the irrevocable, non-exclusive, and
royalty-free license to archive and make accessible my work in whole or in part in all forms of
media, now or hereafter known. I agree that the document mentioned above may be made
available immediately for worldwide access unless an embargo applies.
I retain all other ownership rights to the copyright of my work. I also retain the right to use in
future works (such as articles or books) all or part of my work. I understand that I am free to
register the copyright to my work.
REVIEW, APPROVAL AND ACCEPTANCE REVIEW, APPROVAL AND ACCEPTANCE
The document mentioned above has been reviewed and accepted by the student’s advisor, on
behalf of the advisory committee, and by the Director of Graduate Studies (DGS), on behalf of
the program; we verify that this is the final, approved version of the student’s thesis including all
changes required by the advisory committee. The undersigned agree to abide by the statements
above.
Emmanuel Owusu-Amankwah, Student
Dr. Alison F. Davis, Major Professor
Dr. Carl Dillon, Director of Graduate Studies
WILLINGNESS-TO-PAY FOR ATTRIBUTES OF HEALTH CARE FACILITIES IN RURAL KENTUCKY
A thesis submitted in partial fulfillment of the requirements for the degree of Master of Science in the College of Agriculture, Food and
Environment at the University of Kentucky
By
Emmanuel Owusu-Amankwah
Lexington, Kentucky
Director: Dr. Alison Davis, Professor of Agricultural Economics
Lexington, Kentucky
2018
____________________________________
THESIS ____________________________________
Copyright© Emmanuel Owusu-Amankwah 2018

ABSTRACT OF THESIS
Background: As rural hospitals in Kentucky face insolvency, stakeholders must assess the value of rural hospitals as well as alternatives such as rural clinics and private physician offices.
Objective: To identify the value of attributes of healthcare facilities based on Kentucky’s rural residents’ willingness-to-pay (WTP).
Methods: A survey instrument was created and distributed to ten counties in rural Kentucky. A conditional logit model was used to obtain baseline values and then a mixed logit model was used to address heterogeneity among consumers in estimating WTP. WTP values incorporated respondents’ demographic characteristics and their health status from self-reported frequency of use of medical services and distance from these services.
Results: The results indicate that on average respondents were willing to pay $69.90 each year for the attribute of a facility that treats patients whether they have health insurance or not, compared to a facility that only accepts patients with private health insurance. Uninsured residents were willing to pay $81.15 for this attribute level.
Conclusion: The study suggests that uninsured residents value this attribute level of a facility that grants them access to care. Stakeholders may justify such welfare benefit amounts in support of the establishment or maintenance of such a facility.
KEYWORDS: Willingness to Pay, Mixed Logit, Choice Experiment, Rural Health, Rural Kentucky
Emmanuel Owusu-Amankwah
January 19th, 2018
WILLINGNESS-TO-PAY FOR ATTRIBUTES OF HEALTH CARE
FACILITIES IN RURAL KENTUCKY
WILLINGNESS-TO-PAY FOR ATTRIBUTES OF HEALTH CARE FACILITIES IN RURAL KENTUCKY
By
Emmanuel Owusu-Amankwah
Dr. Alison F. Davis
Director of Thesis
Carl Dillon
Director of Graduate Studies
January 19th, 2018

iii
ACKNOWLEDGEMENTS
I am indebted to Dr. Alison Davis who gave me the opportunity to carry out my
thesis in an area I was interested in and for her continual support, patience and
encouragement throughout this study. I thank Dr. Wuyang Hu for his specific and
thoughtful feedback on the econometrics of this study. I am grateful to Dr. Yoko Kusunose
for her pointed feedback and the integral part she played in the rewriting and editing of this
paper. I deeply appreciate Didier Alia who mentored me, encouraged me and helped me
verify my work.
I dedicate this thesis to my entire family especially to my wife and my father who
kept encouraging me to see this project through to the end. My wife and my sister both
helped me get this process eventually completed and I thank them both very much.

iv
Table of Contents Acknowledgments.............................................................................................................. iii List of Tables ..................................................................................................................... vi List of Figures ................................................................................................................... vii Chapter 1: Introduction ........................................................................................................1 1.1 Description of Study Area .............................................................................................3 1.2 Purpose of the Study ......................................................................................................7 1.3 Importance of the study .................................................................................................8 1.4 Research questions and objectives .................................................................................8 1.5 Hypotheses .....................................................................................................................9 1.6 Thesis structure ............................................................................................................10 Chapter 2: Literature Review .............................................................................................11 2.1 Rural healthcare provision ...........................................................................................11 2.1.2 Rural resident willingness-to-pay for healthcare services ........................................15 2.2 Theory for Consumer Willingness-To-Pay ..................................................................17 Chapter 3: Theoretical Framework and Empirical Model .................................................26 3.1 Random Utility Model .................................................................................................26 3.2 Empirical model ...........................................................................................................32 3.2.1 Model and Specification ...........................................................................................32 Chapter 4: Survey Design and Choice Experiment ...........................................................35 4.1 Survey Design ..............................................................................................................35 4.1.1 Survey instrument .....................................................................................................35 4.1.2 Data collection ..........................................................................................................36 4.2. Sample description ......................................................................................................37 4.3 Choice experiment .......................................................................................................38 Chapter 5: Variable and Response Descriptions ................................................................43 5.1 Description of Survey Data ..........................................................................................43 5.2 Health Status Index ......................................................................................................51 Chapter 6: Results ..............................................................................................................53 6.1. Comparing Alternative Specific Conditional Logit with Mixed Logit .......................53 6.2 WTP for Conditional Logit and Mixed Logit ..............................................................55 6.2.1 Willingness to Pay for Attribute Levels Using Mixed Logit ....................................56 6.3 Including Interaction Variables to Deal with Heterogeneity .......................................61 6.3.1 Mixed Logit model with interactions ........................................................................64 6.3.2 Estimation of the Willingness-to-pay with interactions ............................................66 Chapter 7: Discussions and Conclusions ...........................................................................71 7.1 Main findings ...............................................................................................................71 7.2 Policy implications.......................................................................................................75 7.2.1 Implications for providers of healthcare facilities ....................................................75 7.2.2 Implications for rural residents .................................................................................77 7.3 Limitations and further research ..................................................................................78

v
Appendices .........................................................................................................................81 Appendix A – Survey.........................................................................................................81 Appendix B. Table of responses from choice experiment .................................................90 Appendix D. Rankings of importance of specialty care ....................................................91 Appendix E – Additional tables .........................................................................................93 Bibliography ......................................................................................................................99 Curriculum Vitae .............................................................................................................107

vi
List of Tables
Table 4-1 Table of attributes and attribute levels used in Choice experiment .................. 39 Table 5-1: Use of health care services .............................................................................. 45 Table 5-2: Sources of Information for Choosing Hospital for Care ................................. 46 Table 5-3: Communities with Qualified Health Center or Rural Health Clinic ................47 Table 5-4: Descriptive Statistics of Demographic Characteristics ................................... 48 Table 6-1: Comparing Alternatives Specific Conditional Logit to Mixed Logit .............. 54 Table 6-2: Willingness to pay with Alternative Specific Conditional Logit .................... 60 Table 6-3: Willingness-To-Pay Values from Mixed Logit ............................................... 60 Table 6-4: Conditional Logit with interactions ................................................................. 62 Table 6-5: Sign of WTP with Conditional Logit and Interaction Variables ..................... 63 Table 6-7: Mixed Logit with Health Index and Demographic Data ................................. 65 Table 6-8: WTP from Mixed Logit with Health History and Demographic Data ............ 67 Table E-1: Description of Variables ................................................................................. 93 Table E-2: Importance of Services ................................................................................... 94 Table E-3: Distance to Services ........................................................................................ 94 Table E-4: Health Services Utilization ............................................................................. 95 Table E-5: Health Services Utilization ............................................................................. 96 Table E-6: Legend of mixed logit interactions with health status and demographics ...... 97

vii
List of Figures
Figure 1-1 HPSA, MUA/MUP and CAH designations in Kentucky ...................................7 Figure 4-1: A Choice scenario ...........................................................................................41 Figure 5-1 : Bar graph of distribution of types of insurance coverage ..............................49

1
Chapter 1: Introduction
1.1 Background
Over the last twenty years, the number of hospitals in rural America has decreased due
to various kinds of financial pressure (Ricketts, 2000). In response to these financial
constraints, some hospitals have shut down, and others have reduced the number of
employees, hours, or closed certain departments (Ricketts, 2000). In rural Kentucky, there
is a similar financial pressure facing hospitals due to reduced public and private funding
(Davis, 2012). However, to meet healthcare needs of the population, there are alternatives
to rural hospitals; such as, rural health centers and private physician offices. Communities
must, therefore, decide how to allocate their scare resources and funding to meet their
healthcare needs. Hence, community and healthcare leaders would be able to better choose
the optimal mix of healthcare provision if they knew how residents value the different
attributes of various types of health care facilities.
Demand for healthcare differs from demand for other market goods because most
consumers require some form of healthcare at some point in their lives without which they
could lose their lives or suffer significant reduction in quality of life (Phelps, 2017). The
need to use healthcare is more compelling service than other services which have different
standards between rural and urban areas, such as education or transportation, because the
outcome for using or not using healthcare services involves more than just economic
wellbeing (Anderson et. al., 2015; Lenardson et. al., 2009; Skillman et. al, 2010).
Healthcare provides significant benefits to consumers and the economy as a whole; for
example, a healthier workforce leads to higher productivity of individuals and substantial
marginal productivity to the economy. Healthcare services can however be expensive and

2
consumers have little choice but to use these services when they are essential and often
costlier than if healthcare had been accessed earlier by the patient. Therefore, a large
portion of tax revenue is spent on the health of a nation’s residents (Phelps, 2017). These
higher costs burden both the hospital and taxpayers who fund government programs like
Medicaid and Medicare. As a result, hospitals are often undercompensated for care
resulting in financial insolvency.
Healthcare spending in the United States grew by 5.8% in 2015 reaching $3.2 trillion
in 2015; approximately $9,990 per person (Centers for Medicare and Medicaid Services,
2016). As a share of gross domestic product (GDP), spending on healthcare accounted for
17.8% in 2015 (Lorenzoni et al., 2014). It is estimated that it will be unsustainable for the
United States economy to be spending beyond 20% of GDP (Centers for Medicare and
Medicaid Services, 2016). In 1991, aggregate spending on medical care in the United States
was about $750 billion (Phelps, 1992). In 2011, only twenty years later, national health
care spending reached $2.7 trillion with a growth rate of 3.9% (Centers for Medicare and
Medicaid Services, 2016). Per capita national healthcare spending was $8045 in 2014
(CMS, 2016); in Kentucky, per capita spending on healthcare in 2014 from all payers was
$8004 (Kaiser Family Foundation, 2014). These expenditures are triple the organization
for economic cooperation and development (OECD) average in 2015 of $3,207, and double
the expenditures in comparable income countries as Germany, Switzerland and Britain yet
produce similar health outcomes (Lorenzoni et al., 2014). For these reasons, it is important
to obtain realistic estimates when conducting valuation studies in the healthcare industry
to be able to validate the need for such expenditures. This study seeks to examine the value
of attributes of healthcare facilities and services to rural residents of Kentucky using a

3
willingness-to-pay as a method. The estimates of value can assist decision-makers, in both
the private and public sector, to make optimal decisions in providing healthcare services to
rural residents while balancing healthcare costs with benefits.
1.1.1 Description of Study Area
This section presents the typical facilities that rural residents utilize which are
hospitals, rural clinics and private physician offices as well as their attributes. There are
125 hospitals in Kentucky of which 100 are community hospitals (Rural Health
Information Hub, 2016). 69 of these community hospitals are located in rural areas and 29
of them are designated as Critical Access Hospitals (CAH) (Davis, 2012). The CAH
designation program was created by the Medicare Rural Hospital Flexibility Program to
enhance financial viability of rural hospitals by providing cost-based payments for care
mostly through Medicaid and Medicare. To be eligible, a hospital must have applied for a
critical access designation and must:
i. be located in a rural area,
ii. be at least 35 miles from another hospital or classified as a necessary
provider,
iii. have a maximum of 25 beds,
iv. provide 24-hour emergency services and agree to have at least one
physician on site or on-call with at least one registered nurse on-site 24
hours a day, and
v. maintain at most an average of 96-hour length of stay for acute-care
patients and have an agreement with an acute care hospital for patient
referrals and transfers (Ona & Davis, 2011).

4
Clinics that receive federal funding to provide care to underserved areas across the
United States can be designated as rural health clinics (RHC) or federally qualified health
centers (FQHC). RHC is a clinic that is sited in a rural health care shortage area for which
reason can receive further Medicare and Medicaid reimbursement to increase patient access
to primary care services for underserved rural populations. To get further reimbursement,
a RHC must offer primary care on an outpatient basis, basic laboratory services and be
staffed at least half of the time by a mid-level practitioner such as a physician assistant,
nurse practitioner or a certified nurse midwife (Rural Health Information Hub, 2016). The
other type of facility that can provide clinical services and receive further Medicare and
Medicaid reimbursement is a federally qualified health center (FQHC). A FQHC provides
medical, dental, mental health and pharmacy services that are covered by Medicare,
enhanced Medicaid reimbursements and are mandated to offer sliding fees based on patient
income. RHCs are only designated for and sited in rural areas but FQHCs are a safety net
in both rural and urban areas and may include a community health center and other
programs for public housing, Native Americans, migrants, or home transient people (Rural
Health Information Hub, 2016).
The third type of facility whose attributes are considered in this study are private
practices. In Kentucky, private physicians make up more than half of practicing physicians
and are often found in rural areas (Davis, 2013). Nurse practitioners or physician assistants
may also staff private practices which are open during typical working hours, utilize little
diagnostic technology and offer no emergency services but can provide primary health
care. This is especially in anticipation of increased need for primary care providers due to
the implementation of the Affordable Care Act. Hence, the private practice facility in this

5
study may have either a physician, physician assistant or nurse practitioner as the sole
provider available to see patients.
Another term that needs a definition due to its prevalence across rural Kentucky is
health profession shortage areas (HPSA). A HPSA is a shortage of health professionals
designated for three years by the Secretary of the Department of Health and Human
Services within the Health Resources Services Administration’s Office of Shortage
Designation criteria in the following areas – an urban or rural area, a population or a public
or nonprofit private medical facility (Department of Health and Human Services, 2014).
There are also several Medically Underserved Areas (MUA) or Medically Underserved
Population (MUP) designations in Kentucky. A MUA refers to groups of census tracts with
a high population-to-provider ratio that reflects a shortage. A MUP refers to groups of
people who have economic, linguistic or cultural barriers to receiving health care by
residing in a given locality or geographic area (Rural Health Information Center, 2016).
A federal MUA/MUP designation can help an area qualify for state, local and
federal funding programs which are meant to increase health services to such marginalized
populations through Critical Access Hospitals, (CAH), Federally Qualified Health Centers
(FQHC), Rural Health Clinics (RHC), and J-1 visa waivers for foreign skilled labor (US
Dept. Health and Human Services, 2014).
Each state has a slightly different definition for “necessary provider”. In Kentucky,
the definition of a necessary provider is a hospital that must meet at least one of the
following criteria:

6
i. Located in a county where the percentage of the population with income less than
200 percent of poverty is greater than the state average;
ii. Located in a county that has an unemployment rate higher than the state average
unemployment rate;
iii. Located in a county with a greater number of people age sixty-four (64) or older
than the state average;
iv. Treat on average a higher than average percentage of Medicare patients; and
v. Treat on average a higher than average percentage of Medicaid patients (Rural
Health Information Center, 2016).
In 2008, there were 30 CAHs in Kentucky and they were the necessary providers
in their vicinity for the surrounding populations. In all these areas, the CAH was the only
hospital in the county, except for Floyd County, which had three hospitals, of which two
were designated licensed CAHs (Ona and Davis, 2011). Currently, there are only 29 CAHs
in Kentucky over a state population of 4.4 million and across the country there are 1,326
certified Critical Access Hospitals as of June 30, 2014 for a population of 311 million
(Rural Health Information Hub, 2016).
Figure 1 below shows the MUA/P and HPSA designations across Kentucky, and
all CAHs. The yellow stars indicate the 10 counties that the surveys were sent to which
were largely in Eastern, Southern and Western Kentucky. These rural areas have relative
poverty, high levels of prescription drug abuse and other illicit drug use, a depressed
economy, poor educational attainment and poor health outcomes with a high medical
burden of lung cancer, diabetes and cardiovascular disease diagnoses (Schoenberg, et al.
2008).

7
The study was focused on the region shown in the figure below in 10 counties in
various regions of Kentucky depicted in figure 1, giving a distribution of areas with and
without CAH, MUA/P and HPSA designations to obtain a sample of respondents’
willingness-to-pay values that would be a representative sample and reflective of the rural
population of Kentucky. The 10 counties, in alphabetical order are Allen, Carlisle, Clay,
Elliott, Estill, Leslie, Marshall, McCreary, Morgan, and Trigg.
Source: Map generated by Tom Sikora of CEDIK in ArcGIS software using 2013 data from Health Resources and Services Administration, 2013
Figure 1-1 HPSA, MUA/MUP and CAH designations in Kentucky
1.2 Purpose of the Study
Due to reduced public funding for hospitals from Medicare and Medicaid
reimbursement rates, and insufficient payments from uninsured or underinsured patients
largely using public insurance in rural areas, many rural hospitals cannot afford to operate
and are in danger of being shut down (Ricketts, 2000). In response to this situation, the

8
Kentucky Hospitals Association in contracted with the Community and Economic
Development Initiative of Kentucky (CEDIK) at the University of Kentucky, to complete
a study to determine how much residents in rural Kentucky value attributes of services and
facilities based on their socioeconomic and health status and needs. The findings of this
study can help with planning healthcare facility provision at the hospital, local, state and
federal levels. Knowing residents’ value for various attributes of healthcare facilities,
decision-makers can justify expenditures and additional funding needed to bridge deficits
in revenue to these facilities to support rural health care provision.
1.3 Importance of the study
This study is important because it highlights the value of the services hospitals
provide which, in their absence, other facilities likely could not offer such as an emergency
departments and 24-hour, 7 day a week care. Therefore, the study was conducted to
identify the value of specific attributes associated with healthcare facilities to Kentucky’s
rural residents based on their willingness-to-pay for specific attributes of a healthcare
facility.
1.4 Research questions and objectives
This study addresses three main questions. First, which types of healthcare facilities
are most valuable in rural parts of Kentucky? Second, what aspect or attribute of these
healthcare facilities are most valuable? Third, compared to the average consumer, what is
the difference in value for these attributes for individuals or households when considering
different individual or household characteristics and needs? In consideration of these
questions, the dual objectives of this thesis are:
9
Objective 1: To quantify consumers’ willingness-to-pay for certain amenities
of health care facilities.
Objective 2: To observe heterogeneity between individuals and determine the impact
of the demographic and other non-facility specific factors on consumers’ willingness-to-
pay for given attributes of health care facilities.
1.5 Hypotheses
Rosenstock (1966) and Andersen (1995) discuss determinants of health behavior and
utilization of healthcare services, such as health status and demographic characteristics.
Considering household health needs, insurance coverage and financial constraints of rural
residents. This study assesses these hypotheses for residents’ willingness to pay for
attributes healthcare facilities;
1. Uninsured residents will be willing to pay for a facility which treats patients with
no health insurance compared to a facility that only accepts residents with private
health insurance.
2. Households with children will be willing to pay for a facility that is open 24 hours
a day, 7 days a week compared to a facility open from 9am to 7pm, 5 days a week;
and also willing to pay for a facility to have an emergency department compared to
a facility without an emergency department.
3. Higher income households ($100,000 and above) will be willing to pay for a facility
with full diagnostic services versus a facility with only X-ray services.

10
4. Individuals in poorer health, characterized as one who has used emergency care in
the past 2 years, will be willing to pay for a facility with an emergency department
compared to a facility without an ED
5. Households that live farther away from emergency care will be willing to pay for a
facility with an ED compared to a facility without an ED.
6. Households who prefer their provider to accept individuals without health
insurance will be willing to pay for a facility that accepts all patients (whether they
have health insurance coverage or not), compared to a facility that only accepts
patients with private insurance.
1.6 Thesis structure
Chapter 1 of this thesis provides an overview of the financial pressures faced by
hospitals in rural Kentucky and the need to quantify the value and benefit of attributes of
healthcare facilities to rural residents in the face of increasing costs. Chapter 2 reviews the
literature on willingness-to-pay theory and demographic factors that affect access to
healthcare. Chapter 3 presents the theoretical framework and empirical model used in this
paper. Chapter 4 describes region of study and the research methodology used; Chapter 5
describes the survey instrument, data collection and a description of the data. The results
and discussion of the healthcare facility choice experiment are presented in Chapter 6, and
Chapter 7 presents the conclusions, implications, limitations and recommendations of this
paper.

11
Chapter 2: Literature Review
2.1 Rural healthcare provision
There are several reasons why the provision of healthcare is difficult and costly in rural
areas. Three such reasons for the relative higher cost are: 1) reduced public expenditure, 2)
fewer consumers and practitioners, and 3) reduced health insurance coverage. For these
reasons, valuation studies are warranted to establish value and justify the higher cost of
providing care in rural as compared to urban areas.
1) Reduced public expenditure
In rural areas, healthcare access is even more of an acute issue than in urban areas
because of severely limited public and private funding (Douthit et. al, 2015). Public
funding is allocated on a per capita basis, so with fewer residents, rural areas have smaller
expenditure allocations. As a result, there are reduced expenditures on facilities and their
services in rural areas compared to urban areas, which leads to increased out-of-pocket
expenditures for patients for similar services obtained locally or in traveling to well-
equipped facilities or to specialty services (Lee et. al, 2014; Archana et. al; 2014). To make
up for the comparative shortfall in public spending, rural residents have to compensate with
increased out-of-pocket payments compared to urban residents. In 2003, median total
health care expenditures for the rural population were $434, which is slightly higher than
that for the urban population at $418. Rural residents pay a larger proportion of their health
care costs out of pocket, about 29%, compared to urban residents who pay about 23% of
their healthcare expenditures out of pocket (Health Policy Institute, 2014). Almost a decade
later in 2011, reported spending on health care is $3,426 for rural households compared to

12
$3,303 for urban households. Rural households tend to spend more on medications and
urban households tend to spend more on emergency care but total expenditures were not
significantly different. Rural households spent a slightly larger portion of their household
total expenditures, though not statistically significant, on health care compared to other
expenses and reported spending up to 32% more on prescription and nonprescription drugs,
including vitamins, than urban households (Lee et al., 2014)
2) Fewer consumers and practitioners
There are fewer consumers of healthcare amenities, fewer support sites, fewer
specialists and related professionals, and a less professionally competitive atmosphere in
rural areas compared to urban areas. These factors make providers less eager to situate their
businesses in rural areas, as there may not be a suitable density of patients for that
establishment to be profitable. Approximately 20 to 25 percent of the United States
population, or up to 65 million, resides in rural areas (Health Policy Institute, 2014). Of
approximately 65 million rural residents in 2010, about 5 million lived in healthcare
professional shortage areas (HPSA) (O’Toole, 2011). An HPSA is defined as a county with
less than 33 primary care physicians for every 100,000 residents. In rural areas, the patient-
to-primary care physician ratio is an average of 39.8 physicians per 100,000 people,
compared to 53.3 physicians per 100,000 in urban areas (Hing and Hsiao, 2012). In fact,
less than 11 percent of physicians in the U.S. practice in rural areas (Health Policy Institute,
2014). From the practitioners’ perspective, compared to urban areas, there are fewer
opportunities to specialize in a challenging field, earn a lucrative salary, enjoy a variety of
recreational events or access prestigious schools for their children in rural areas. There are
also fewer opportunities to pursue ambitions, or become highly esteemed and recognized

13
by one’s peers in rural areas; yet recognition, prestige and ambition rank highly among
many providers’ goals (Robinson and Guidry, 2001; Wellever, 2004).
3) Reduced health insurance coverage
In rural areas, consumers of healthcare rely heavily on public insurance such as
Medicaid and Medicare (Douthit, 2015). In some instances, patients will have no insurance
coverage and will have to pay out of pocket for services. In other instances, after provision
of the needed care, lower income individuals may not be able to afford to pay or be willing
to pay the entire costs for their care. Thus, hospitals do not receive appropriate
compensation for their services. Financing for rural health care facilities is even more
limited (Zimmerman, 2004) than funding for urban counterparts due to reasons such as
insufficient critical mass of consumers, prevalence of particular health needs (Wallace,
2004; Robinson, 2004), and unfavorable population-to-service ratio or population-to-
practitioner ratio (Robinson, 2004). Furthermore, with large disparities in health insurance
coverage between rural and urban localities, ability to pay for health care is further
constrained in rural areas, as residents seldom purchase the limited and expensive private
health insurance policies when limited healthcare services are available in their region
(Hummer 2004).
Health insurance in the United States is largely tied to employment or groups where
the insured persons can be pooled to reduce costs. Individuals in rural areas are less likely
than their urban counterparts to have access to coverage through a job; 51% of the rural
population had employer-sponsored insurance in 2013, compared to 57% of the urban
population (Newkirk and Damico, 2014). The Patient Protection and Affordable Care Act
(ACA) passed in 2010 was intended to reduce the number uninsured individuals and

14
possibly reduce the cost of health insurance to individuals as costs are higher when
insurance risk pools are smaller (Douthit et al, 2015). Before the ACA was implemented,
the rural population was covered more by Medicaid (21%) or other public insurance (4%)
than the urban population (16% Medicaid, 3% other public insurance) (State Health Access
Data Assistance Center, 2013). There were similar rates of insurance coverage between
rural and urban areas before the ACA because Medicaid covered those left out of employer-
sponsored insurance in rural areas (Newkirk and Damico, 2014).
The ACA employed Medicaid expansion for individuals with incomes up to 138%
of the federal poverty level; and tax credits for moderate income families (100% to 400%
of federal poverty level) to obtain insurance in the health insurance marketplaces. Among
the rural uninsured population, 75% fall into the income range for these provisions for
coverage (State Health Access Data Assistance Center, 2013). Twenty-four states in 2013
chose not to expand Medicaid as this was optional for states; in these states, many low
income and uninsured individuals face a coverage gap in which their incomes put them
above Medicaid eligibility levels but below eligibility levels for tax credits so they will not
receive assistance and may not be able to afford health insurance. (Newkirk and Damico,
2014). Two-thirds of the rural uninsured individuals in America live in states that are
currently not participating in Medicaid expansion, hence about 15% of these rural
uninsured (more than 1 million individuals) will fall into the coverage gap compared to 9%
of the uninsured in urban areas (State Health Access Data Assistance Center, 2013). In
Kentucky, half of the 640,000 uninsured individuals will have access to health insurance
due to Medicaid expansion yet about 206,000 individuals still fall in the coverage gap
(Cabinet for Health and Family Services, 2013). Medicaid expansion in Kentucky favors

15
hospitals as $287.5 million over fiscal years 2014 to 2021 for indigent care was cut by
ACA (Cabinet for Health and Family Services, 2013).
Douthit et al. (2015) review the literature published before and after ACA was
implemented and report that significant differences in health care access between rural and
urban areas still exist. Patients are still reluctant to seek care in rural areas due to cultural
and financial constraints. They state that this reluctance and poorer access is explained by
a shortage of trained physicians and services, nonexistent public transportation, and poor
internet services. Even with the implementation of ACA, rural residents had poorer health
and rural areas still have difficulty in attracting and retaining physicians, and maintaining
health services up to the level of urban areas.
2.1.1 Rural resident willingness-to-pay for healthcare services
Healthcare facilities and services are limited in rural areas across the world; in rural
Kentucky, the reality is no different. Rural Eastern and Western Kentucky have limited
access to health care facilities (Davis, 2012; also see figure 1) and high rates of uninsured
individuals can be found in Eastern and South-Central Kentucky (Davis, 2009). Presently,
no studies have examined residents’ willingness to pay for healthcare services, facilities or
practitioners in Kentucky’s rural counties other than the initial findings this study published
in 2015 (Allen, et al., 2015). Furthermore, because hospitals in rural areas are in danger of
shutting down due to financial constraints, this study may provide information on the value
of residents of rural Kentucky to keep them open. Findings from this study may not only
help public authorities know more about the healthcare preferences of their rural
constituents and residents, but can further provide justification to aid in securing additional

16
necessary funding for the communities’ health care needs in a landscape where healthcare
spending is already at maximal levels.
The literature indicates that participants are willing to pay for health insurance
schemes to increase their access to improved healthcare facilities based on their socio-
demographics. The studies show willingness to pay in general for these facilities but do not
break down what aspects of the facilities that respondents most value or are most willing
to pay for. This study contributes to the literature on rural health care facilities in the United
States by focusing on the consumer’s perspective. It breaks down healthcare facilities into
its attributes and estimates the attributes participants are willing to pay for and how much
they are willing to pay for each of these. Other studies on this subject tend focus on the
effects on a rural economy of a hospital closing down (Holmes et al., 2006), or on the
impact of a hospital based health sector on the rural economy (Davis, 2013).
Allen et al. (2015), a previous paper published from this study, elicits rural
consumers’ willingness to pay for attributes of healthcare facilities in Kentucky. The
authors use a conditional logit model to determine the willingness to pay value of health
care facilities. However, the conditional logit model does not account for differences
between different customers but assumes customers are homogenous or the same in their
preferences or choices so does not account for heterogeneity between consumers. As a
further contribution, using the same data set used in Allen et al. (2015), this paper will use
the mixed logit model to account for heterogeneity between customers as an extension of
the previously published work.

17
2.2 Theory for Consumer Willingness-To-Pay
Markets do not to exist for non-market goods and services such as clean air and
water, health and environmental amenities and, hence, their economic value, which is
deciphered from how much people would be willing to pay for them, is not revealed in
market prices (Alpizar et al. 2003, Johnston et al. 2015, Champ et al. 2003). According to
Champ et al. (2003), observable market interactions are often used to decipher the marginal
value of non-market goods. A requirement for the above means of valuation is that there
be an identifiable link between the non-market good and some subset or attribute of the
market good. Cases where individuals’ values for certain nonmarket goods have no
identifiable or estimable link to market goods are referred to as existence use. Consumers
may value and hence be willing to pay for goods for its potential use or merely for its
existence and believe in its inherent value hence a person’s health has existence use and
innate value (Haab & McConnell, 2002). A controversy with existence use values is that it
cannot be monetized or inferred from market demand and supply data because its
consumption for the most part does not generate observable behavior (Vincent et al., 1995).
This is because a market does not exist for “health” so one cannot observe the value of
health to individuals. The value of a state of health can be inferred from market-based
transactions conducted to maintain, improve or recover a state of health. The use of
healthcare services and facilities to maintain, improve or recover one’s health provides a
market-based means to assess individuals’ willingness to pay for attributes of healthcare
and hence access to healthcare.

18
2.2.1 Methods of WTP estimation
Two main methods have been developed to measure the economic value of non-
market goods; namely, revealed preferences and stated preferences methods (Alpizar et al.
2003; Champ et al. 2003). Revealed preferences uses data from actions consumers have
actually carried out in the past to determine their value, but stated preferences devise and
use hypothetical scenarios which are administered through surveys to derive value to
consumers (Alpizar et al. 2003). According to Champ et al. (2003) inferences from
revealed actions are the preferred means of establishing value but since revealed preference
methods cannot be used with existence use goods, stated preference methods such as
contingent valuation using direct surveys and other attribute-based methods using indirect
surveys are the viable alternatives for measuring existence use values.
Contingent valuation method in healthcare is an increasingly popular method used
to elicit consumer’s monetary valuations of health program benefits or health states
(Diener, 1998). It is a hypothetical, survey-based method using direct questions. However,
this method is subject various biases and errors on the validity and reliability of the results.
Bayoumi (2004) discusses contingent valuation as a method in the field of health
economics of eliciting individuals’ valuations of health programs. He advises that bias can
be limited by careful participants selection, the ways questions are posed, the ways
individuals interpret probabilities and value gained compared to losses and the way in
which missing or extreme responses are interpreted. He claims that contingent valuation
studies should measure the potential influence of biases, the validity of the tests used to
measure quality of life and the reliability and responsiveness of responses in order to help
improve the future measurement of contingent valuation for applications.

19
Klose (1999), on the other hand, suggests that further research is needed before
contingent valuation is used in health care decision making due to inherent biases in the
elicitation methods typically used. Different elicitation methods make comparisons
difficult across studies. He describes starting point bias where the first bid affects valuation
significantly. Range bias sets in when the range of bids of payment cards affect valuation.
Direct questions are found to be problematic. These are similar to the aforementioned
biases in the way participants are selected, the ways questions are posed and the way
participants are allowed to evaluate gains and losses.
When using a stated preference method, direct and indirect methods can be used
(Adamowicz et al., 1994; Breidert et al., 2006). Direct consumer surveys, also referred to
as contingent valuation, directly ask consumers their willingness-to-pay (Portney, 1994).
Indirect methods used to infer willingness-to-pay include choice experiments (Morey et
al., 2002), contingent rating (Álvarez-Farizo, 2001), contingent ranking (Merino-Castello,
2003) and pair-wise testing (Cameron et al. 2002).
Choice experiments, which this study uses, present scenarios and offers alternatives
of bundles of attributes that have prices attached to correspond to those bundles in
attributes. The respondent can then pick ‘A’, ‘B’ or neither option. Contingent ranking
offers different scenarios and asks respondents to rank each of the options in a scenario on
a given scale. Different options of attributes with varying availability are offered and
respondents can rank the options in order of preference usually in descending order from
most preferred to least preferred (Merino-Castello, 2003). Pair-wise comparisons are like
choice experiments in how the scenarios are presented and the way respondents can choose

20
between the various options but a further step is that respondents must show how strongly
they prefer their choice to the other options (Alpizar et al. 2003).
Choice experiments involve putting together a set of attributes, making
hypothetical profiles offering different attribute level of these attributes with monetary
value assigned to the profiles and then asking individuals to pick between two hypothetical
scenarios so that an individual’s utility can be derived for the attribute levels relative to a
baseline attribute level (Breidert et al. 2006). The difference between modelling from
choice experiments and contingent valuation with direct surveys is that choice experiments
derives willingness-to-pay from sets of rankings of options presented to respondents, which
the respondents select between without needing to assign monetary values (Pearce et al.,
2002). This is easier for respondents as they do not need to assign direct monetary values
whereas in contingent valuation or direct surveys, respondents directly assign their
willingness-to-pay in monetary values to their stated choices (Pearce et al., 2002).
The stated preference method with a choice experiment using product attributes can
lead to the willingness-to-pay values desired with some benefits over other methods
described here (Carson, 2000). For example, stated preference options are less costly to
implement than revealed preferences, as one consumer responds to several scenarios in one
survey and grants multiple data observations in one encounter (Adamowicz et al. 1994).
Secondly, stated preference methods are the best option for this study and allow the
researcher to have more control of the parameters the respondent is exposed to. A limitation
of stated preference methods is that they deviate from real life situations and may become
too simplistic or unrealistic for the respondent; this is because the researcher restricts the
attributes and attribute levels included in order to reduce the cognitive burden on the
21
respondent. The other major limitation is the effect of hypothetical bias where it is difficult
to ascertain that the consumer would make those same decisions in real life situations that
they make in the hypothetical scenarios compared to revealed preference methods where
the consumers have already made their decisions in the past and one can therefore study
their actual preferences (Bridges, 2002)
With a stated preference method such as discrete choice analysis, one can break
down health care facilities into bundles of attributes for healthcare facilities (Forbis, 1981).
When a healthcare facility, for example, is decomposed into its attributes, an individual is
in a sense paying for the individual attributes they care for that make up that facility. The
more of these desirable attributes one stands to benefit from, the higher the price premium
that one is willing to pay for the sum total of the attributes making up the facility.
2.2.2 Factors affecting consumer WTP
It is observed in the literature that consumers’ willingness-to-pay for goods in
healthcare can be distilled into:
i) The attributes of the healthcare facility (Champ et al., 2003),
ii) The demographic characteristics of the consumers (Martin-Fernandez et al.,
2010)
iii) The health status of consumers (Asselin, 2005) and
iv) The current access consumers have to care (Baji et al., 2012).
i) Healthcare facility attributes:
Consumer products can often be broken down into a mixture of their desirable attributes
that consumers are willing to pay for (Champ et al, 2003). Many studies report WTP for

22
health facility attributes; one such attribute is the availability and level of diagnostic
capabilities. Lin et al. (2013), uses a meta-analysis to discuss WTP studies for diagnostics
technologies. The authors find 66 articles from the years 1985 to 2011 half of which looked
at WTP for diagnostics in oncology and the remainder in infectious disease, gynecological
care, laboratory tests including genetic testing and other imaging studies. The study
indicates that patients are willing to pay up to $100 for basic diagnostic screenings and up
to $500 for specialized diagnostics in endocrinology, neurology and oncology variety of
diagnostic information as an attribute of a medical facility and such technology has been
growing rapidly in recent years.
Another attribute of a facility that patients are willing to pay for, is access to a
physician. Martin-Fernandez (2010) documents with payment cards and an ordered probit
model that patients are willing to pay for access to a physician through physician visits in
4 urban and 2 rural health centers with upper and lower ends of the range in socioeconomic
characteristics in Madrid, Spain.
Some services which involve seeing a specialist can be costly to utilize and prohibitive
if one does not have health insurance. Such an attribute we consider in this study is
oncology treatment as a form of specialty treatment in rural Kentucky. Lang, (2010)
discusses how much a patient with lung cancer would be willing to pay out of pocket for
cancer treatment through their WTP for a hypothetical new drug using a double-ended
dichotomous choice model.

23
ii) Demographic characteristics:
The demographic characteristics of consumers such as age, income, gender,
educational attainment and place of residence, just to mention a few, highly affect what
those consumers purchase and how much they are willing to pay for them (Ahmad et al.
2010). Martin-Fernandez et al. (2010) documents that demographic characteristics such as
age, income, education and area of resident affect WTP for access to a physician. Lin
(2013) and Lang (2010) both emphasize how much demographic characteristics affect
patient willingness to pay for types of diagnostic services and oncology services,
respectively. Asselin (2005), describes the demographics of respondents that affect their
WTP decisions for healthier nutritional intake. Aizuddin et al. (2012) reviewed published
and unpublished works from 1990 to 2011 on willingness-to-pay and factors that influence
WTP for healthcare services. Findings from many of the studies reviewed showed that
factors such as age, education, income, dependency ratio, household size, perception,
healthcare services quality, and locality – whether rural or urban and ability to pay could
significantly influence willingness to pay values.
iii) Health status:
Consumers who are healthier on average will typically be less willing to pay for
healthcare whereas those who are less healthy will be more willing to pay for better dietary
and treatment options for their disease states. Bellhouse et al. (2010), for example depicts
how consumers who are more concerned about high cholesterol were willing to pay a
premium for reduced cholesterol pork as well as buy more of such a product indicating that
health status affects a person’s willingness-to-pay for a product. The authors controlled the
results for income by including a measure for socioeconomic standing and recognized that

24
only a small proportion of the increase in purchases came from high end respondents living
in a high-income region and from those who were prepared to pay a premium in price for
low cholesterol pork. Ahmad et al. (2010) and Gil. et al. (2001) describe how responds are
willing to pay for organic food because of their perception that it has a positive effect on
their health. Asselin (2005) also expounds on consumer characteristics that affect their
willingness to pay such as their health status and their health behavior. Martin-Fernandez
et al. (2010) documents that patients with poorer health states and hence greater need for
care are willing to pay for access to primary healthcare services. This study will consider
residents who have used emergency services in the prior 2 years to be have a poorer health
status compared to those who are not because of the event that caused them to need
emergency services and the aftermath of using emergency services.
iv) Current access to healthcare:
Access to healthcare can be vague and difficult to define especially for different
segments of the population. However, the more access a consumer has to current care, the
less they are generally willing to pay for better access to care, whereas the less current
access an individual has, the more they will be willing to pay when all other factors are
held constant and available income is considered (Banerjee et al. 2004). Distance from care
is one way of measuring access to care and the longer the distance from care especially in
rural areas, the more likely a resident is willing to pay for access to a healthcare service
(Aizuddin, 2012). Consumers will often pay to increase their access to healthcare,
sometimes through health insurance programs (Donfouet et al. 2011). Baji et al. (2012),
show through regression analysis that in Hungary, access to health care, based on attributes
such as waiting and travel time or distance from facility, although important, was less

25
important than the skills and reputation of the physician and the attitude of the personnel
and the level of technology which were other factors considered in access to care. Such
patients were willing to travel longer distances to access a more experienced or reputable
practitioner.
With a contingent valuation method, Donfouet et al. (2011) show that 58.1% of
rural households in rural Cameroun would pay higher than the average $2.15 for the second
bid, indicating that the rural poor aim to increase their access to healthcare and are willing
to pay for it. This point matters greatly for rural populations where access to care is
typically limited and incomes are typically lower compared to the national average
(Banerjee et al. 2004). The uninsured often have less access to healthcare and this reduced
access is correlated with cultural barriers (predominantly for immigrant and ethnic minority
groups), income levels, and educational attainment and health outcomes (Becker, 2001).
Although causation is often difficult to establish, education, income and health outcomes
are related and thus a lower socioeconomic status reduces WTP as well as health outcomes
and longer distances from medical facilities increase patients’ WTP for access to primary
medical care (Martin-Fernandez et al., 2010).
This study will examine the impact of some of these demographic factors – children
in the household, distance from care, age, income, lack of health insurance coverage, and
health status on willingness to pay for attributes of healthcare facilities and services in rural
Kentucky.
26
Chapter 3: Theoretical Framework and Empirical Model
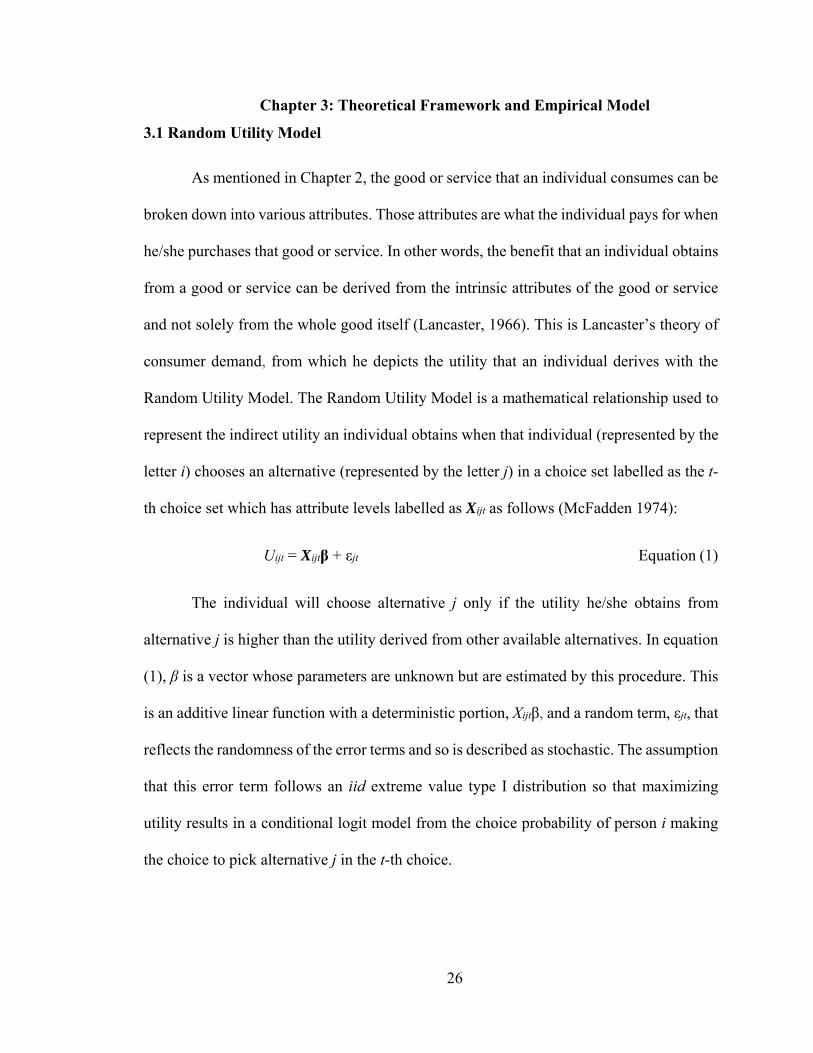
3.1 Random Utility Model
As mentioned in Chapter 2, the good or service that an individual consumes can be
broken down into various attributes. Those attributes are what the individual pays for when
he/she purchases that good or service. In other words, the benefit that an individual obtains
from a good or service can be derived from the intrinsic attributes of the good or service
and not solely from the whole good itself (Lancaster, 1966). This is Lancaster’s theory of
consumer demand, from which he depicts the utility that an individual derives with the
Random Utility Model. The Random Utility Model is a mathematical relationship used to
represent the indirect utility an individual obtains when that individual (represented by the
letter i) chooses an alternative (represented by the letter j) in a choice set labelled as the t-
th choice set which has attribute levels labelled as Xijt as follows (McFadden 1974):
Uijt = Xijtβ + εjt Equation (1)
The individual will choose alternative j only if the utility he/she obtains from
alternative j is higher than the utility derived from other available alternatives. In equation
(1), β is a vector whose parameters are unknown but are estimated by this procedure. This
is an additive linear function with a deterministic portion, Xijtβ, and a random term, εjt, that
reflects the randomness of the error terms and so is described as stochastic. The assumption
that this error term follows an iid extreme value type I distribution so that maximizing
utility results in a conditional logit model from the choice probability of person i making
the choice to pick alternative j in the t-th choice.

27
The choice probability in the form of the conditional logit model is;
Pijt =
∑ Equation (2)
The Maximum likelihood estimation of the conditional logit model results in
estimators that are asymptotically efficient and normally-distributed when conducted under
very general conditions (McFadden, 1974).
In addition to the attributes of the clinical facilities, respondents’ demographic
characteristics are also useful in determining the utility associated with given attributes and
facilities. The contribution to the value or willingness-to-pay from respondents’ unique
characteristics can be differentiated from the contribution to due to attributes of the given
facilities. Therefore, for further analysis, one can also create interaction terms between the
demographic variables and attribute variables, and these interaction terms can be included
within vector Xh (Colombo et al., 2007). With the inclusion of interaction variables, the
conditional logit model cannot avoid the restrictive substitution pattern imposed by the IIA
property inherent in the conditional logit model.
This is one of the two ways in which the conditional logit model is limited; 1) It
cannot represent variation in tastes that are random, and 2) It is subject to restrictive
substitution patterns of the Independence of Irrelevant Alternatives (IIA) assumption
(Train, 2003). The IIA assumption is that the probability of the individual choosing
between any pair of alternatives is independent of the probability of choosing between
other alternatives or attributes in a choice set. In other words, choosing between the
alternatives is a mutually-exclusive exercise and making a choice in one set of alternatives
does not affect the choice made in another set of alternatives.

28
Some models that may be used to relax the IIA assumption are the mixed logit,
latent class model, nested logit, multinomial probit, and heteroskedastic extreme value
models. This study uses the mixed logit model, also known as the random parameters logit
(RPL), random coefficients logit, or error components logit to deal with heterogeneity. The
study opted to use the mixed logit over the latent class model (LCM), which could also
have been useful but the mixed logit is more flexible than the LCM and can induce almost
any behavioral assumption when speaking of preference distribution. However, the LCM
benefits from its semi-parametric structure which does not require any assumption about
the distribution of parameters which the RPL does (Sagebiel, 2011).
The mixed logit model is preferred (Carlsson et al., 2007; Hu et al., 2005) and can
manage the unobserved heterogeneity that is often an issue with choice experiments. The
basic mixed logit model and the mixed logit model with interactions can manage
heterogeneity though a fixed price coefficient is necessary because a random price
coefficient leads to unrealistic welfare measures (Train, 2003). This then also resolves the
taste variations across individuals, as well as the restrictive IIA substitution or forecasting
patterns that the conditional logit does not avoid.
A further word on heterogeneity may be warranted here. Economic agents are not
identical in their reasoning or actions but for the sake of simplicity in modeling behavior
or choices, individuals are assumed to be identical. Heterogeneity becomes problematic
when there are relevant variables that are not observed in the data but are correlated with
the observed variables. Heterogeneity can occur from demographic factors that cause
respondents to make different choices from each other based on unique individual or

29
household characteristics, which necessitates their need for different levels of health care
and access to available facilities.
The mixed logit model acknowledges and accounts for the fact that individuals are
heterogeneous. The mixed logit generalizes the standard logit by letting the coefficient
associated with each variable vary across consumers (Revelt and Train, 1998). In other
words, it lets unobserved factors follow any distribution. When individual unobserved
heterogeneity is controlled for, the reported characteristics collected in the survey data will
not have an excessive effect on the choices that respondents make. We hypothesize that
respondents’ individual and household choices are not just due to unobserved
heterogeneity. When unobservable variables are controlled for by using mixed logit, then
the observed variables remaining are believed to be sufficient in the choice process for
respondents. The variation in unobserved respondent-related parameters induces
correlation over the alternatives in the random portion of utility so that general patterns of
correlation over alternatives can be generated through appropriate specification of
variables and parameters with appropriate choice of explanatory variables and distributions
for the random parameters (i.e. normal or lognormal distributions). It therefore allows for
efficient estimation when the same customers make repeated choices, as in this study
(Revelt and Train, 1998; Louviere et al., 2000). Ben-Akiva et al. (1993), Ben-Akiva and
Bolduc (1996), Bhat (1996), and Brownstone and Train (1996) use similar mixed logit
specifications but do not have repeated choices by each individual respondent. In all its
uses except Ben-Akiva et al. (1993) and Train et al (1987), the integration of the logit
formula is done by simulation as is done in this paper.

30
In the mixed logit, the parameters to be estimated are assumed to be random
variables and can take on different values for the different sampled respondents. This
specification weighs the relative importance of the alternatives within a choice set unevenly
and hence can avoid the restrictive substitution pattern suggested by the IIA property that
the conditional logit model is subject to. For the IIA assumption to be relaxed, the mixed
logit assumes that the coefficients that are estimated are random and can vary from
individual to individual. Assume that the distribution of the random parameters , can be
specificed as ~ H( θ, v), where H(*) is a probability distribution function. The general
function H(*) can represent individual distribution functions for each random parameter
represented by , or can be a joint function for some of or all of the random parameters
signified by . The parameters θ and v, represent the mean and variance of the distribution
or other necessary parameters consequent upon specific types of distribution represented
by H(*). Instead of the parameter being estimated, θ and v, (mean and variance of the
distribution) are the parameters that are estimated. Based on how H(*) is specified, these
parameters may or may not be independent. Using the mixed logit basis, the choice
probability of the individual i selecting the alternative j from a t-th choice set is represented
by the expression below in terms of the logistic distribution and its specification is the
mixed logit model with the choice probability below (Train 2003);
Pijt =
∑ Equation (3)
The h( ), as seen in equation 3 above, is the joint density function for the random
parameters . The nonrandom coefficients are estimated together with their means and
standard deviations.

31
Furthermore, the utility function can be broken down into two components, an
observation component and an error term for both conditional and mixed logit models to
get:
Uijt = Cijt (Pijt,Xijt) + eijt Equation (4)
Where, Cijt = αi Pijt + βXijt Equation (5)
The component that can be observed in equation 5 above has two parts – one is the
Price (Pijt) and the other is the coefficient of Price, α, which has a fixed component. The
reason that the coefficient of price is fixed is to prevent a situation where there are
unrealistic positive welfare effects associated with the price because it has been found that
a random price coefficient leads to such unrealistic welfare measures (Train, 2003). The
Xijt component is a vector of the healthcare facility attributes offered in the choice
experiment to respondents that are shown in Table 4.1 and as some of the categorical
variables in the tables in chapter 6. The choice probability then becomes;
For the Conditional Logit, Pijt =
∑ Equation (6)
For the Mixed Logit;
Pijt =ʃ
∑ , ~ ,
Equation (7)
As a rule, the models should be run with repetitions or halton draws of at least the
square root of the number of observation. Therefore with 8604 observations used for the

32
simulations, the square root of which is 93, 120 halton draws were sufficient as used in this
study (Revelt and Train, 1998). The statistical package Stata was used to run these models.
The marginal value for an attribute j is calculated as the negative of the coefficient
of the attribute divided by the coefficient of the price coefficient.
∗
∗ Equation (8)
The marginal value is the estimated willingness to pay for the attribute j.
Where is the coefficient of the attribute and is the coefficient of price. ∗
is the coefficient of the attribute with its interaction as D is a vector of the demographic
variables used in interaction terms. is the vector of corresponding coefficients in the
models.
3.2 Empirical model
3.2.1 Model and Specification
In the choice experiment used in this study, respondents are presented with four
scenarios. The respondents have two options of healthcare facilities in each of the four
scenarios and they can pick either an option “A” or “B” with the corresponding prices or
decline both facilities and select the “neither” option. The “neither” option corresponds to
the status quo and is known as the baseline option for which there is no associated cost.
Their choice of “A” or “B” when presented with each hypothetical facility is the dependent
variable and the explanatory variables are the levels of the attributes as well as the
demographic characteristics of the respondents. The base option of each facility attribute

33
was omitted from the explanatory variables specified and the alternatives of each attribute
were specified so their coefficients could be obtained relative to the base level.
Since the data records the limited choices that respondents may make based on
various attributes in alternative health facilities, the analysis involves a Limited Dependent
Variable (LDV) which is a dependent variable whose values are constrained to a few values
such as zeros and ones. Respondents in this study either choose or do not choose a given
facility that makes “the respondent’s choice”, take on two possible values, zero or one. Our
LDV is a binary dependent variable as it can take on only two possible values (Wooldridge,
1999). The logit model is one model that is used when working with limited dependent
variables. The form of the conditional logit model used in this study is the Alternatives
Specific Conditional Logit, which allows one to specify the alternative options for the
attributes in the specification of the model. Based on respondents’ choices, the utility of
goods comprised of the included attributes can be obtained.
From equation’s 6 and 7, to determine the probability of the respondent i, making
a utility maximizing choice of an alternative j, in a choice set t, one can plug in the attribute
variables Xijt to obtain the coefficients of the attributes’ alternatives specified.
The alternatives of the attributes are specified as Xijt= [Open 24 hours; open 9-5, 7
days a week] [Physician immediately available; Physician, Nurse Practitioner; or Physician
Assistant available by appointment only] [X-rays and diagnostic labs only; full diagnostics
services available] [Emergency Care] [Dialysis; Physical Therapy; Cancer care] [all
insurance types and sliding scale payment based on income accepted; Medicaid/Medicare
and Private Insurance accepted,] i j t,

34
The marginal value is the estimated willingness to pay for the attribute j.
Equation (9)
Where j = [Open 24 hours; open 9-5, 7 days a week] [Physician immediately
available; Physician, Nurse Practitioner; or Physician Assistant available by appointment
only] [X-rays and diagnostic labs only; full diagnostics services available] [Emergency
Care] [Dialysis; Physical Therapy; Cancer care] [all insurance types and sliding scale
payment based on income accepted; Medicaid/Medicare and Private Insurance accepted]
ijt. The numerator is the coefficient estimate of j, ( and the denominator is the coefficient
of price, .
Furthermore, WTP from interactions with demographic variables are performed in
both the conditional logit and mixed logit using the mean values of the attributes and in
that case the willingness to pay becomes;
Equation (10)
Where the numerator is the sum of the coefficient of the attribute level with the
coefficient of its interaction, and the denominator is the estimated mean values of the
coefficient of price ( ). g stands for the interactions performed between the attributes
and the variables. For example, = [open 24 hours*children, emergencycare*children,
Allinsurance_Uninsured, etc].

35
Chapter 4: Survey Design and Choice Experiment
4.1 Survey Design
4.1.1 Survey instrument
This survey instrument used in this study comprised a 10-page paper questionnaire
with five parts described below:
Part I: Respondents are asked about their health behavior and use of preventive
health care, emergency health care and several specialty services such as radiology,
oncology, pulmonology, urology orthopedics and pediatrics over the past two years.
Respondents are asked to report their individual responses as well as enter responses for
their household members.
Part II: Respondents are asked about their access to a primary care doctor and, if
they have one, how far they drive to see this practitioner. Respondents are then asked if
they are aware of or use a rural health center or federally qualified health center. The survey
then asks about their recent experiences at nearby hospitals within the last 12 months.
Part III: The choice experiment is included to determine respondents’ willingness
to pay values.
Part IV: Respondents are asked to rank and describe their use of certain services,
the distances from those services and whether they would have to leave their county to use
some of those services. Finally, the respondent is asked how important it is to the
respondent that their doctor accept their insurance.
Part V: Respondents provide demographic information that could affect their
willingness to pay such as age, income, marital status, type of health insurance, ages and
number of children and whether respondents care for elderly parents who may or may not

36
live with them. A space is provided to allows respondents to leave any comments on the
survey they wish to provide.
4.1.2 Data collection
The survey was distributed through the mail to minimize costs versus phone survey,
to allow the respondent to see the choice experiment and allow enough time for participants
to fully consider their responses. Internet usage is much lower in rural areas, hence the
investigators expected to receive a higher response rate through the mail. There was the
option to complete the survey online, however only 11 surveys were completed online. The
choice experiment was displayed in a tabular form for ease in differentiating between the
options. The questionnaire used closed-ended instead of open-ended questions to avoid
confusion and to make data entry more straightforward and consistent. Most questions
could be answered with a “yes” or “no” or a check mark to select one out of several options
allowing for easier coding and analysis. The questionnaire was available in the same format
both in hard copy and online with an online survey company known as Survey Monkey.
An appropriate coding system was utilized to translate the survey responses into numerical
values for data analysis.
Two focus groups were held to refine and edit the survey to ensure participants
were interpreting the survey as predicted and to make sure all questions were reasonable
and understandable. Based on the feedback from the focus groups, the survey was finalized
and prepared for mailing. Based on the criteria provided to match the population of interest
– single family residences in the 10 counties in rural Kentucky, a sample of households
reflective of rural population of Kentucky was obtained from a firm which provided
recipient addresses. Since non-probability sampling is applicable when studies do not need

37
to form generalizations from the sample to the general population, the study opted for
probability sampling where every unit in the sample frame has a known non-zero
probability of being chosen for the sample as this then allows for extrapolations to the
broader population from the survey sample. Finally, to get a highly powered study and also
to reduce type II error, the study aimed for a large sample of 4000 survey recipients.
4.2. Sample description
The surveys were sent out in the summer of 2012 to the addresses of 3900
households in ten rural counties in Eastern and Western Kentucky. From the 3900 surveys
sent out, 188 were undelivered due to failed addresses and were not replaced due to funding
limitations. Each mailing included a letter inviting recipients to complete and return the
survey by mail or complete the survey instrument online. To improve the response rate,
mailings included an unmarked prepaid return envelope and households who returned a
completed were entered into a raffle to win prizes. Also, a postcard was sent as a remainder
to all addresses a few weeks after the initial mailing. A second round of 2,000 surveys was
sent to the four counties with the lowest response rates. The study did not track which of
the residents responded to the surveys in part to help maintain confidentiality and assure
participants of their anonymity but it did track the county from which the survey was
returned.
Zip codes were the only identifying information requested. Three individuals
entered the survey data into Microsoft excel sheets following a coding system to give a
consistent transcription of survey responses. The collected data were analyzed using
STATA, an econometric and statistical software program to run both the conditional logit
and mixed logit models.

38
Descriptive statistics are reported in Chapter 5. The choice of facility that
respondents made from the given scenarios and respondent rankings of specialty care needs
and preference for provider insurance requirements are also presented in the appendix.
Further statistical analyses such as cross-tabulations on interesting pairs of variables from
the responses presented in the appendix.
4.3 Choice experiment
The attributes and attribute levels for the choice experiment were selected based on
key differences between hospitals, clinics and private practices. Typically, rural hospitals
are open 24 hours a day, 7 days a week but clinics and private practices are typically open
during business hours. Clinics may have a wide range of diagnostic equipment and may
more easily accept Medicare and Medicaid insurance unlike private practices. In
accordance with Lancaster’s new theory of consumer demand described in chapter 3, the
goods and services being offered to respondents are not the Critical Access Hospitals, Rural
Health clinics or private practitioner offices directly but rather the attributes that make up
these facilities that we are hypothetically offering. As recommended by Louviere et al.
(2000), input from guided focus groups was appropriated to select realistic attributes to
consumers such as the annual fee. Table 4.1 summarizes the attributes and attribute levels
included in the model.

39
Table 4-1 Table of attributes and attribute levels used in Choice experiment
Attribute Attribute levels
offered
Hours Open 24 hours 9-7/ 5 days a week 9-5/ 7 days a week
Providers on Staff Physician
immediately available
Only Nurse Practitioner or
Physician Assistant
Physician, NP or PA by appointment
only
Services X-rays only
Full diagnostic services (x-rays, labs, CAT scans,
MRI)
X-ray and Diagnostic lab Services only
Emergency Care Yes No
Specialized Care Physical Therapy Cancer Care Dialysis None
Accepted Insurance
Medicaid/Medicare, Sliding Scale Fee based on income,
and private insurance
Medicaid/Medicare and private insurance
Private Insurance only
Mandatory annual household
$40 $60 $80 $100 $120
The price attribute was the mandatory fee that each household would have to pay each
year for that facility, if that facility were in operation. This is stated within the column
showing the facilities attributes in Table 4-1. The attribute “hours open” is offered to
respondents in three different forms – either with the facility open from 9am to 5pm, 7 days
a week; 9am to 7pm, 5 days a week, or with the facility open 24 hours a day seven days a
week.
The attribute “Providers on staff” is offered in three different modes with the option
“Physician immediately available”, Only Nurse Practitioner or Physician Assistant
available” or “Physician, Nurse Practitioner or Physician Assistant seen by appointment
only” available in the scenarios. This is important because some patients only want to see
a physician and are willing to pay for it whereas others are more accepting of seeing a nurse

40
practitioner and having more time to talk about concerns and having to pay less for medical
attention from a health care provider.
The services attribute offers respondents either “Full Diagnostic services involving
X-rays, laboratory work, CAT scans and an MRI” or “only X-rays and diagnostic
laboratory services” or “X-rays only”. The Emergency Care attribute provides respondents
with the option of either having emergency care or not. The Specialized Care attribute
offers Dialysis, Cancer Care, Physical Therapy or No specialized care at all, in the four
scenarios.
Health insurance that is accepted at these facilities are in three forms which are
offered to respondents as the options, “Private Insurance only”, “Medicaid/Medicare and
private insurance” and “Medicaid/Medicare, private insurance and Sliding Scale payments
based on patient’s income”. Finally, a mandatory annual household fee ranging from $40
to $120 is asked of respondents for each facility they pick in the four scenarios with
payments of $40, $60, $80, $100 and $120 for the selection of attributes they made. The
prices used are selected to be as realistic as possible and to allow the conjoint analysis to
be performed within bounds that can be computed (Louviere, Hensher and Swait, 2000).
In this study, respondents were presented with two hypothetical healthcare
facilities, facilities A and B in each choice set along with a third option of “neither facility
A nor B”. Each choice set had a mix of seven attributes including “price” and there were
four different choice sets. Respondents could pick any of these three options in each choice
set. The respondents were told that apart from the differences in the attributes, the two

41
facilities in each choice set were identical. One such choice set or scenario is shown on
figure 4-1 below as an example.
Facility A (following
features offered)
Facility B (following
features offered)
Hours Open
24 hours a day/7days
9-7/5 days
Providers on Staff
Physician, Nurse Practitioner, or
Physician Assistant seen by appointment only
Only Nurse Practitioner or
Physician Assistant available
Services
x-rays and diagnostic
laboratory services only
x-rays only
I do not prefer either facility (please check
below)
Emergency Care
Yes No
Specialized Care
None None
Accepted Insurance
Private insurance only
Private insurance only
Mandatory fee every household will pay per year
$100 $80
I would prefer to have facility: (choose one only)
Figure 4-1: A Choice scenario
Each respondent had 4 choice sets to consider in their survey. There were three
different versions of the surveys sent out which offered the option levels of attributes in
different ways in the choice experiments (CEs) and this was accounted for in the analysis
involving the choice experiment. The 3 versions of the survey were created because 3

42
different groups of 4 choice sets giving a total of 12 facility profiles were available for the
choice experiment. The way these final profiles were obtained was that several different
facility profiles were created from the two or three levels of each of the eight attributes
including price which from full factorial design gives a maximum possible number of
combinations. Using a D-optimal fractional factorial design, the 12 final unique profiles
used in the medical facilities in the choice experiment were then obtained. Limiting the
number of choice sets, attributes and attribute levels is necessary so as not to overwhelm
respondents with the mental demands of the experiment.
In summary, respondents were provided information on a series of four choice
experiments with three choices in each experiment. The choices are between two facilities
with a mix of attributes as well as a third option to pick neither facility. The choice
experiments were designed with plausible attributes so respondents could imagine
themselves actually choosing between such facilities in real life. The experiments were
also designed such that no experiment had a dominant alternative or dominant option that
most respondents would gravitate to as an obvious choice. In other words, no facility had
an undue advantage because none had substantially more desirable options than others
between the attributes offered.

43
Chapter 5: Variable and Response Descriptions
5.1 Description of Survey Data
This section describes and summarizes the key healthcare variables and
demographic characteristics used in the study. A total of 789 surveys from the 3712 surveys
sent out were returned which represented a 21.26 percent response rate. However, 786
surveys were completely filled out and usable for descriptive analysis. Table 5-1 below,
shows percentages of respondents’ use of preventive healthcare use, emergency room
services, specialty services and health care providers. About 66% of respondents (519
respondents), indicated that they had used preventive care within the last two years while
46% reported that a member of their household had used preventive care. Altogether, 60%
of respondents accessed primary care services for the care of another illness or health
concern and 47% reported that their household members also did. Of those that reported
using x-ray or diagnostic services, 57% were respondents and 40% household members of
respondents. Additionally, 29% reported using the emergency room for the care of
emergency issues (26% was indicated for household members) and 20% of respondents
used the emergency room for care of non-emergency issues (19% for household members
of respondents).
Of specialty services, 22% had used cardiology (15% for their household
members), 23% of respondents and 10% of their household members had used
obstetrics/gynecology, 32% had used radiology (21% of household members of
respondents) and 10% of respondents (and 8% of their household members) had used
neurology services. Also 6% of respondents, 4% of their household members had used

44
psychiatric services, 7% respondents, 4% of their households had used oncology services,
11% of respondents and 8% of the household members of respondents had used urology
services, 13% of respondents and 10% of household members of respondents had utilized
orthopedics. To round off specialty services, 10% respondents, 8% household members
had used pulmonology and 13% of respondents’ household members had seen a
pediatrician.
Of the responders (89.5%) who responded in the affirmative to having a regular
care physician, 59% indicated that their primary care physician was located in their county.
Of those whose primary care physicians are not located in their county, 288 (41%)
respondents reported having to drive an average of 29.6 miles to visit their physician. It is
worth noting that in every instance, the individual filling out the survey had higher
frequency of use of healthcare services than their household members.

45
Table 5-1: Use of health care services Health care Services Unit MeanHealthcare History
Use of these services over past two years Preventive care, respondent Yes=1, No=0 0.662 Preventive care, member of household Yes=1, No=0 0.458 Care of other illness respondent Yes=1, No=0 0.602 Care of other illness, household member Yes=1, No=0 0.467 X-ray/Diagnostic Services, respondent Yes=1, No=0 0.566 X-ray/Diagnostic Services, household member Yes=1, No=0 0.399
Emergency Room Services Care of emergency issues, respondent Yes=1, No=0 0.292 Care of emergency issues, household member Yes=1, No=0 0.263 Were ER issues life threatening? Yes=1, No=0 0.143 Care of non-emergency services, respondent Yes=1, No=0 0.202 Care of non-emergency services, household Yes=1, No=0 0.185
Specialty Care Services Cardiology, respondent Yes=1, No=0 0.218 Cardiology, household member Yes=1, No=0 0.145 Obstetrics/Gynecology, respondent Yes=1, No=0 0.232 Obstetrics/Gynecology, household member Yes=1, No=0 0.103 Radiology, respondent Yes=1, No=0 0.324 Radiology, household member Yes=1, No=0 0.213 Neurology, respondent Yes=1, No=0 0.102 Neurology, household member Yes=1, No=0 0.084 Psychiatry, respondent Yes=1, No=0 0.056 Psychiatry, household member Yes=1, No=0 0.043 Oncology, respondent Yes=1, No=0 0.071 Oncology, household member Yes=1, No=0 0.041 Urology, respondent Yes=1, No=0 0.110 Urology, household member Yes=1, No=0 0.088 Orthopedics, respondent Yes=1, No=0 0.128 Orthopedics, household member Yes=1, No=0 0.098 Pulmonology, respondent Yes=1, No=0 0.101 Pulmonology, household member Yes=1, No=0 0.078 Pediatrics Yes=1, No=0 0.130
Healthcare Providers Do you have a regular primary care physician? Yes=1, No=0 0.895 If affirmative, is physician based in your
county? Yes=1, No=0 0.590
If your primary care physician is not based in your county, how far do you drive to visit him/her?
Miles 29.646

46
Of those who had used a hospital in the last two years, almost every respondent
highly rated their hospitals with a 4 or 5, on a 5-point scale, indicating a satisfactory or
very satisfactory quality of experience. Most respondents selected physician referral (56%)
and “friends and family experiences” (54%) and “word of mouth” (35%) for the
information sources used when deciding which hospital to use (Table 5-2).
Table 5-2: Sources of Information for Choosing Hospital for Care
In table 5-3, 51% of respondents indicated that they believed their community had
a federally qualified health center or rural health clinic - the survey took great pains to
emphasize that this was not the health department, as most people casually associate rural
health clinics with the local health department. To a follow-up question, 28% of the
respondents indicated that they had used the federally qualified health center/rural health
clinic in their community in the last two years.
Sources of Information Mean Physician referral 0.566 Friends and family experiences 0.541 Word of mouth 0.346 County events (e.g. Fairs) 0.042 Internet 0.041 Newspaper 0.033 Radio/TV 0.022 Direct mail 0.019 Billboards 0.011 Facebook 0.008 Twitter/social media 0.004

47
Table 5-3: Communities with Qualified Health Center or Rural Health Clinic Availability/Use of Health Care Facility Mean
Availability of Federally Qualified Health Center/Rural Health Clinic)
Yes 0.51 No 0.49 Use of Federally Qualified Health Center/Rural Health Clinic in your
community
Yes 0.28 No 0.72 Table 5-4 summarizes the demographic characteristics and income distribution of
the study respondents. There sample had an average age of 55 years with 34% reporting as
male and more than half (66%) reporting as female. About 68% of the respondents were
married or living with a significant other, while about 35% of the respondents had children.
There was an average of 1.86 children (approximately 2 children) per household. Children
of respondents had an average age of 13 years. Of those who reported caring for the elderly
(17%), 31% indicated that their elderly relatives lived with them full-time.
Household combined income in the sample was distributed in a similar manner to
that of the actual population. 24% of respondents’ households earned less than $15,000;
18% earned between $15,000 and $25,000 and these are considered low income earners.
13% of respondents earned between $25,000 and $35,000. 12% are middle income
households earning between $35,000 and $50,000. 16% earned between $50,000 and
$75,000 and upper middle-class earners make of 7% of respondents earning $75,000 to
$99,000 and 5% earned over $100,000.

48
Table 5-4: Descriptive Statistics of Demographic Characteristics
Variables MeanStand. Dev.
Min Max
Age (years) 55.15 16.02 23.0 93.00Male 0.34 0.47 0.00 1.00 Married 0.68 0.47 0.00 1.00 Children under 18 years old 0.35 0.48 0.00 1.00 Number of Children 1.86 1.24 1.00 15.00Children’s ages 13.05 9.50 0.20 66.00Care for elderly (over 65 years) 0.17 0.38 0.00 1.00 Elderly live in respondent’s home 0.31 0.46 0.00 1.00
Income Distribution Income under 15k 0.24 0.43 0.00 1.00 Low Income: 15-25k 0.18 0.38 0.00 1.00 Income 25-35k 0.13 0.33 0.00 1.00 Middle Income: 35-50k 0.12 0.32 0.00 1.00 Income 50-75k 0.16 0.37 0.00 1.00 Upper Middle Income: 75-99k 0.07 0.25 0.00 1.00 Income over 100k 0.05 0.22 0.00 1.00
Figure 5-1 shows the distribution and types of insurance coverage of the
respondents. 33% of the respondents had Medicare coverage in 2012. The second largest
group of respondents with health insurance were those who had private employer-
sponsored health insurance (30%). 16% had Medicaid, 15% had employer-sponsored
public insurance, 15% had a combination of private insurance and Medicare, while 13% of
the respondents remaining uninsured in 2012. A summary of some comments penned by
respondents indicated that they often could not afford health insurance with their incomes
and in the slow recovery of the economy after the 2008 financial crisis. Many in their
households and communities were unable to find jobs and unable to afford healthcare.
Some also did acknowledge long emergency room wait times that had resulted from many
being unable to utilize healthcare otherwise.

49
Figure 5-1 : Bar graph of distribution of types of insurance coverage
On average, respondents had to drive 23 minutes to routine care services, 47
minutes to specialized care services, 32 minutes to urgent care services, 30 minutes to
emergency health care services and 33 minutes to diagnostic services. 5% of respondents
had to leave their state to visit the nearest service as their communities did not have a local
hospital. For these respondents, it would take 44 minutes on average to drive to access
regular services that are usually provided by a local hospital (see appendix).
More than half of the respondents (58%) ranked cancer treatment as very important.
The majority of respondents, 59%, thought access to cardiac rehabilitation was very
important. Similarly, 56% found diabetes treatment to be imperative by assigning it a very
important score. Dialysis services were ranked very important by 50% of sample, while
physical therapy was thought to be very important by 54% of our sample (see appendix).
When seeking immediate medical care, 86% of the sample believed that it was very
important that their provider accept their health insurance; Medicaid or Medicare.
Additionally, 66% of the sampled population elected that when seeking immediate medical
30%
15%
33%
16%
15%
13%
0% 5% 10% 15% 20% 25% 30% 35%
Private (employer‐sponsored)
Public (employer‐sponsored)
Medicare
Medicaid
Combination Private/Medicare
Uninsured
Health Insurance Coverage of Survey Respondents

50
care, it was very important that their provider accepts individuals who do not have health
insurance or those who self-pay, 14 % thought it somewhat important, 4% found it
somewhat unimportant and 6% of the respondents considered it not important at all (see
appendix).
Table 5-6 compares the actual population of the 10 counties surveyed to the
respondents’ demographic characteristics. The sample population is compared to actual
population in terms of gender, income, age and health insurance used. 66% of the
respondents were female whereas 51% of the actual population were male. The
respondents’ average household income is $38,205 whereas the actual population’s income
is $32,205. The respondents were older with an average age of 56 years whereas the
population’s average age is 48 years old. Among those who responded to the survey 13%
were uninsured whereas in the population 23% were uninsured in 2012. Finally, 16% of
the respondents were on Medicaid compared to 26% in the surveyed region who were on
Medicaid.
Table 5-6: Comparison of sample and actual populations
Demographic Variable Sample Mean Standard Deviation
10 County Average
Percent male 34% 47% 51% Household income $38,205 $30,762 $32,514 Age (years) 56 15 48 Percent uninsured 13% 34% 23% Percent on Medicaid 16% 36% 26%
Source: Allen et al., 2015, (n = 769)
From the comparisons in Table 5-6, the survey respondents were older, made up of
more females than the gender proportion living in that area and had more income. There
were also fewer respondents who had no health insurance (13%) than those uninsured in

51
the region. Finally, fewer of the respondents are on Medicaid (16%) than the actual rural
population’s proportion on Medicaid (26%). This comparison shows that the sample is
representative of the population being studied thus the results of the study can be
generalized to the population in the 10 rural counties specifically and may also be
applicable to other similar rural populations.
5.2 Health Status Index
To be able to incorporate a measure for how healthy or ill respondents are or how
much healthcare they utilize, a health status index was created from respondents’ utilization
of health services over the last 2 years. This index of patient ‘health service utilization’ was
generated by aggregating responses of the services utilized and distance to services by the
respondents. This illustrates respondent’ access to key health care facilities; particularly
how frequently the respondent uses the facilities and how far they have to drive to get to
the facility. The variables from this index used in the analyses in chapter 6 are shown in
table 5-7 below. The full index is shown in the appendix.
The variables for primary care, care for other illness and x-ray/diagnostic services
were combined into one new variable for preventive health so if a respondent or their
household member had used one or more of these services that would be indicated with the
numbers zero for no or 1 for yes. The more of these services the respondent and their
household used, the higher their number reported for the categorical variables. Specialty
services was designated a combined variable of all the specialty services listed in the
survey. These specialty services were cardiology, obstetrics/gynecology, radiology,
neurology, psychiatry, oncology, urology, orthopedics, pulmonology and pediatrics. The
ranking of distances to the various services listed below were also combined into one new

52
composite variable showing distance to services. The distance to emergency care variable
was not combined with other variables but was kept as a standalone variable. The
respondents’ ranking of importance to access to different healthcare facilities was also
combined into a new variable showing from their responses, how important those
healthcare facilities are to that household.
These variables were generated depicting whether they used emergency and
specialty services in the previous 2 years and how far they are from emergency and certain
specialty services in their locality. These variables help assess whether individuals who
utilize more healthcare services would be willing to pay for such attributes. The use of
emergency care variable was a dummy variable, but the distance from emergency care was
a categorical variable to capture the average distance respondents lived from various
healthcare services. The ranking of importance of certain aspects of access to care was a
categorical variable ranked on a scale of 1 to 4. Lower numbers on the scale show less use
of healthcare so may indicate healthier respondents and higher numbers show more use of
care and may portray less healthy respondents.
Table 5-7: Health Services Utilization Variable Type Description
Emergency Room (ERcare), Dummy variable
Used no emergency service = 0, Used emergency department=1.
Whether in the last 2 years, respondent or
household member has used Emergency Room
services Distance to Emergency Room Services (Diercare), Categorical variable
0-15 minutes = 1, 15-30 minutes = 2, 30-60 minutes = 3, over 60 minutes = 4
Distance to Emergency Room care services

53
Chapter 6: Results
The results of the choice experiment to determine the value rural residents place on
various healthcare attributes are presented here. Two models are used for estimation; the
alternative specific conditional logit model is used to provide a basis of comparison for the
mixed logit model. The alternatives specific conditional logit and the mixed logit allow the
specification of the attribute levels and the mixed logit model is used to address inherent
heterogeneity.
6.1. Comparing Alternative Specific Conditional Logit with Mixed Logit
The results for the conditional logit and the mixed logit are shown below in Tables
6.1. In the mixed logit results the estimated standard deviations of the coefficients of
attribute levels twenty-four hour service, physician immediately available and emergency
are significant at the 1% level; 9am to 5pm, 7 days a week is significant at the 5% level
and dialysis is significant at the 10% level which indicates that heterogeneity is present
with these attribute levels. This implies that the mean coefficients reported vary across the
respondents in the sample. The conditional logit model on the other hand does not report
standard deviations on the coefficients, as it assumes heterogeneity to be non-existent.
As expected, the study finds the price coefficient to be negative in both models
consistent with economic theory that as the price of a good increases the quantity demanded
of that normal good decreases. In the second column of Table 6.1 where the conditional
logit results are presented, almost all the significant variables are significant at the 1% level

54
except for one variable (whether a facility is open from 9am to 5pm, seven days a week)
which is significant at the 5% significance level.
Table 6-1: Comparing Alternatives Specific Conditional Logit to Mixed Logit
Conditional Logit Mixed Logit Model
VARIABLES Coefficient Coefficient Standard
Deviation Open 24 hours, 7 days/week 0.760*** 0.536*** 1.714*** (0.116) (0.097) (0.154) Open 9am-5pm, 7 days/week 0.302** 0.205** 0.351** (0.128) (0.087) (0.160) Physician, NP, PA seen by appointment only 0.407*** -0.013 0.193 (0.090) (0.084) (0.151) MD immediately available 0.543*** 0.361*** 0.936*** (0.090) (0.099) (0.185) X-rays, diagnostic labs only 0.639*** 0.543*** 0.173 (0.084) (0.091) (0.130) Full Diagnostic services (x-rays, labs, CATscans, MRI) 0.978*** 0.970*** -0.110 (0.093) (0.085) (0.110) Emergency care 0.477*** 0.363*** -0.358*** (0.074) (0.080) (0.109) Physical Therapy -0.075 -0.550*** -0.113 (0.108) (0.101) (0.108) Dialysis -0.162 -0.770*** 0.184* (0.117) (0.107) (0.107) Cancer care 0.187 -0.299*** 0.131 (0.125) (0.101) (0.090) Medicaid/Medicare, Income -based Sliding Scale fee and private insurance accepted 1.134*** 1.316*** 0.127 (0.095) (0.105) (0.095) Medicaid/Medicare and private insurance accepted 0.582*** 0.547*** -0.044 (0.103) (0.117) (0.105) Price -0.011*** -0.019*** (0.001) (0.001) Observations 8,604 8,604 8,604 Constant for Alternative B 0.004 - - (0.124) - - Constant for Alternative C 1.386*** - - (0.190) - -
Standard errors in parentheses, *** p<0.01, ** p<0.05, * p<0.1

55
The mixed logit results are presented in the last two columns of table 6-1. Most the
variables for the mixed logit specification are statistically significant at the 1% significance
level except hours of 9 – 5pm, seven days a week which is significant at the 5% significance
level just like in the conditional. Seeing medical practitioners by appointment only is not
significant at all, unlike in the alternatives specific conditional logit where it was significant
at the 1% significance level.
6.2 WTP for Conditional Logit and Mixed Logit
Since Willingness-to-pay is a marginal value as shown in the equation below, it can
be calculated as the negative of the ratio between the coefficient of an attribute and the
coefficient of price. From the coefficients of the various attributes and the coefficient of
‘price’ from the results table above, one can calculate respondents’ willingness to pay for
included attributes using the following formula;
Willingness to pay = -
The marginal effects of the facility attributes are displayed in Table 6.2 and 6.3.
For the logit model specification, the price coefficient is fixed while allowing the other
coefficients to vary (Revelt and Train, 1998). The willingness to pay for each attribute is
therefore distributed in the same way as the attribute’s randomly varying coefficient as the
willingness to pay value is the ratio of the attribute coefficient to the price coefficient. This
makes interpreting the model more convenient. In addition, the non-price coefficients are
specified to be independently and normally distributed. Variables that are found to be
significant have corresponding WTPs that are also significant as WTP is obtained simply
from the attribute coefficient divided by the price coefficient.

56
6.2.1 Willingness to Pay for Attribute Levels Using Mixed Logit
The WTP values are discussed here focusing on the mixed logit coefficients in
table 6-3 since its results are controlled for heterogeneity, however the WTP values are
presented in tables 6-2 and 6-3 below from both the conditional and mixed logits. The WTP
estimates are largely consistent in sign and magnitude and significant at the 1% level in
both the mixed logit and the conditional logit although the conditional logit’s estimates are
generally larger than the mixed logit’s WTP estimates. The WTP values are reported
relative to the value of the designated baseline option for each attribute.
The baseline option for the hours open attribute is 9am to 7pm, 5 days a week; the
baseline option for “providers” is only a mid-level practitioner i.e. only nurse practitioner
or only a physician assistant available. The baseline option for diagnostic services offered
is x-rays only, and the basic option of providing emergency services is that this facility
does not have an emergency department so does not offer emergency services. For
specialized care, the baseline option is no specialized care offered; and for insurance
accepted, the base option is that private insurance only is accepted.
The baseline facility is the facility that respondents accept by default if they select
the ‘neither’ option. This facility looks like a private practice that is operated or staffed by
either a nurse practitioner or a physician assistant which is open from 9am to 7pm, 5 days
a week. This baseline facility accepts only private insurance and for diagnostics services
has an x-ray machine only. The facility does not have an emergency department or offer
any form of specialized care. The upper and lower limits of the WTP estimates show the
2.5% and 97.5% quantiles and hence the range for each WTP value.

57
For the attribute “hours the facility is open”, compared to the baseline of 9am to
7pm, 5 days a week, respondents are willing to pay $28.50 for twenty-four-hour service;
and $10.90 for hours open of 9am to 5pm, 7 days a week. The willingness-to-pay for
twenty-four hour service is significant at the 1% level, and 9am to 5pm, 7 days a week is
significant at the 5% level in both models. Respondents value a facility that is open 24
hours a day the most, followed by a facility open from 9am to 5pm, 7 days a week. Both
of these attribute levels are preferable to the baseline facility open from 9am to 7pm, 5 days
a week, implying respondents value these options for the convenience of weekend service
and service throughout the night.
For emergency care, $19.30 is the WTP value which signals respondents’
relatively high valuation of an emergency department compared non-emergency care. This
amount is significant at the 1% level. This attribute is necessary for accidents and illnesses
where urgent or emergent care is needed. However, emergency departments are seen here
to be valued less (at $19.30) than 24-hour service (at $28.50). This is expected because
although it is essential to have emergent care for crisis situations, consumers prefer
preventative care or early interventions obtained from seeing a provider before the illness
escalates. For example, patients would prefer to get assessed by a clinician and receive a
prescription for pneumonia than to have to go to the emergency room when they are more
ill with the same disease. However, respondents still like to have the emergency department
for unavoidable incidents such as automobile or construction accidents, accidental
ingestions and poisonings with children or rapidly escalating illnesses such as an asthma
attack, a heart failure exacerbation or a chronic obstructive pulmonary disease
exacerbation.

58
On average respondents are willing to pay $19.20 to see a physician who is
immediately available without an appointment needed compared to the baseline of being
able to see only a mid-level practitioner such as a nurse practitioner or a physician assistant;
but have negative WTP (-$0.70) to see all these providers by appointment only whether
physicians or mid-level practitioners. The WTP for physicians immediately available is
significant at the 1% level in both models however, the WTP for needing an appointment
is not significant in the mixed logit model though it is significant at the 1% level in the
conditional logit. This speaks to respondents’ value for convenience and timeliness as an
aspect of access to healthcare. Patients who have urgent health needs may not want to wait
several days until their appointment date arrives hence will pay a significant amount to be
able to see a provider without needing to make an appointment.
Compared to the baseline option of having only X-ray services available for
diagnostics, respondents are willing to pay $28.80 for X-ray and other diagnostic labs only;
and $51.60 for full diagnostic procedures. Patients want the flexibility, accuracy and
specificity provided by other diagnostic radiology such as CAT (computer aided
tomography) scans and MRI’s (Magnetic Resonance imaging). Although these are costlier
to utilize, practitioners may need them to diagnose early and accurately tumors, cardiac or
other soft tissue abnormalities for precision and during immediate, interventional and
surgical treatment.
Physical therapy is valued at -$29.20, dialysis -$40.90, cancer-care -$15.90
compared to the no specialty services. These attribute levels are not significant in the
conditional logit but are all significant at the 1% level in the mixed logit model. These
options compared to the baseline option of no specialty care, elicit smaller or negative

59
amounts as these specialty services do not have a large demand or supply prices due to the
highly specific nature of the specialties and the lower occurrence of such ailments in rural
areas. Patients tend to travel to urban areas for such specialty services where they would
see more experienced personnel and perhaps receive better quality service do to larger
volumes of such services being provided, resulting in less need for and lower utilization
rates of those specialty services in rural areas.
Respondents are willing to pay $29.10 for a facility which only accepts those with
public insurance or private insurance coverage; this option was significant at the 1% level
with both models. This is preferable to a baseline facility that only accepts patients with
private insurance. This is because many patients in these rural areas have Medicare and
Medicaid. 16% of the respondents had Medicaid and 26% of the actual population of the
10- county area where this study was conducted had Medicaid in 2012. 33% of the
respondents had Medicare only. 15% of the respondents had some supplemental private
health insurance in addition to their Medicare coverage. Another 15% of respondents had
public employer-sponsored insurance. All these respondents would not be able to use the
baseline facility but would be able to use this facility which accepts public health insurance
in addition to private health insurance. Only 30% of the respondents who had private
employer-sponsored insurance could use the baseline facility because it requires private
health insurance. A quarter of the population utilizing Medicaid and 48% utilizing
Medicare could not access the baseline facility and hence the respondents are willing to
pay $29.10 annually on behalf of their household for this option of being able to use public
insurance.
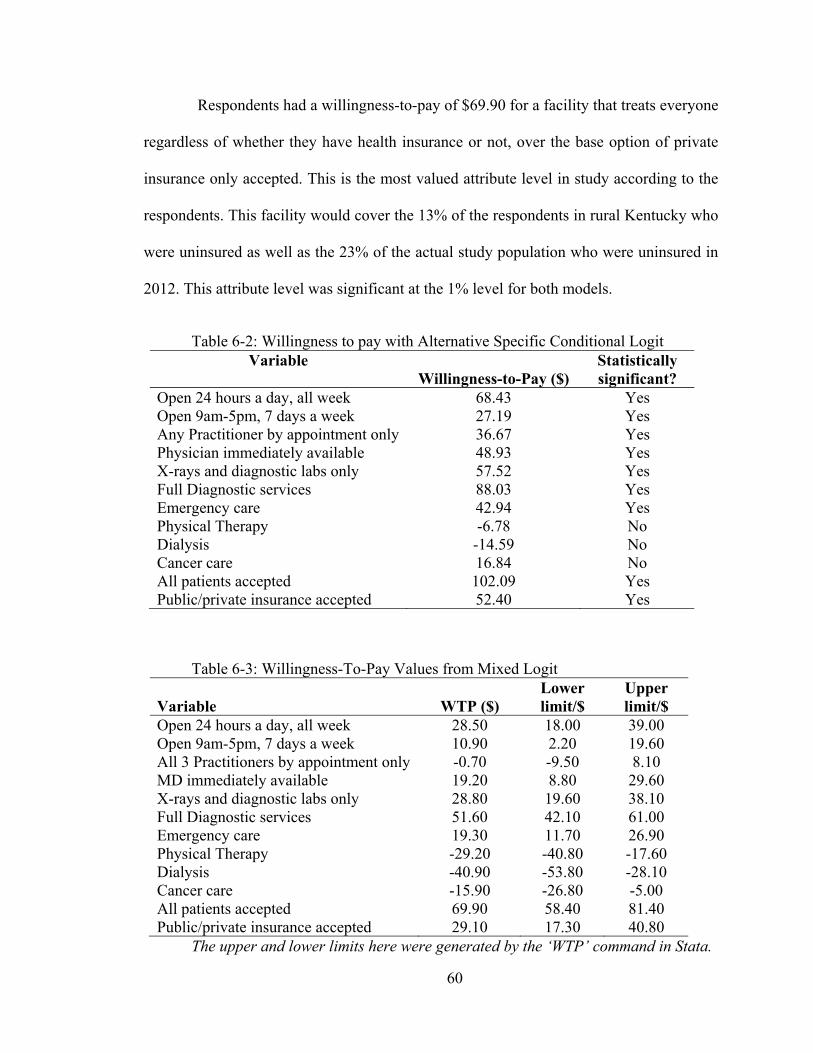
60
Respondents had a willingness-to-pay of $69.90 for a facility that treats everyone
regardless of whether they have health insurance or not, over the base option of private
insurance only accepted. This is the most valued attribute level in study according to the
respondents. This facility would cover the 13% of the respondents in rural Kentucky who
were uninsured as well as the 23% of the actual study population who were uninsured in
2012. This attribute level was significant at the 1% level for both models.
Table 6-2: Willingness to pay with Alternative Specific Conditional Logit Variable
Willingness-to-Pay ($) Statistically significant?
Open 24 hours a day, all week 68.43 Yes Open 9am-5pm, 7 days a week 27.19 Yes Any Practitioner by appointment only 36.67 Yes Physician immediately available 48.93 Yes X-rays and diagnostic labs only 57.52 Yes Full Diagnostic services 88.03 Yes Emergency care 42.94 Yes Physical Therapy -6.78 No Dialysis -14.59 No Cancer care 16.84 No All patients accepted 102.09 Yes Public/private insurance accepted 52.40 Yes
Table 6-3: Willingness-To-Pay Values from Mixed Logit
Variable WTP ($) Lower limit/$
Upper limit/$
Open 24 hours a day, all week 28.50 18.00 39.00 Open 9am-5pm, 7 days a week 10.90 2.20 19.60 All 3 Practitioners by appointment only -0.70 -9.50 8.10 MD immediately available 19.20 8.80 29.60 X-rays and diagnostic labs only 28.80 19.60 38.10 Full Diagnostic services 51.60 42.10 61.00 Emergency care 19.30 11.70 26.90 Physical Therapy -29.20 -40.80 -17.60 Dialysis -40.90 -53.80 -28.10 Cancer care -15.90 -26.80 -5.00 All patients accepted 69.90 58.40 81.40 Public/private insurance accepted 29.10 17.30 40.80
The upper and lower limits here were generated by the ‘WTP’ command in Stata.
61
6.3 Including Interaction Variables to Deal with Heterogeneity
To account for the fact that respondents are all different and have different
characteristics that come into play when they make decisions, some of their demographic
characteristics are incorporated into the results. This indicates the difference it makes when
respondents’ demographic characteristics and an index of their health status, compiled
from their self-reported utilization of medical services and distances from these services,
are incorporated into the base models.
For the marginal effects of the conditional logit model with interactions, only the
signs but not the magnitudes of the coefficients from the conditional logit will be
interpreted. The WTP obtained from the interaction terms are therefore only to be observed
for their signs. The WTP from the interaction term is added to the WTP from the original
standalone variable related to that interaction variable. When looking at the interactions of
the variables with respondents’ demographic variables, the study identifies significant
findings (Table 6-4). Not all the tested interactions were found to be statistically significant
although they may be clinically significant; even such statistical insignificance may be
useful information.
The interactions in the conditional model displayed in table 6-4 are from the
hypotheses in chapter 2 and the corresponding willingness-to-pay values are shown in table
6-5. The significant interactions, whose signs but not magnitudes will be presented, are as
follows. An uninsured respondent is willing to pay for a facility that accepts any patient
regardless of whether they have health insurance or not relative to a facility that only
accepts patients with private health insurance. A respondent with private health insurance
coverage is willing to pay a facility with full diagnostic services and residents with incomes

62
greater than $100,000 a year are willing to pay for full diagnostics services relative to a
facility with X-ray capability only. With increasing age, respondents are willing to pay for
dialysis services and with increasing age respondents are willing to pay for cancer services
compared to a facility with no specialty services in rural Kentucky.
Table 6-4: Conditional Logit with interactions VARIABLES Coefficient
(Standard Deviation)
Open 24 hours a day, 7 days a week 0.793*** (0.127) Open 9am-5pm, 7 days a week 0.361*** (0.134) MD, NP, or PA seen by appointment only 0.431*** (0.093) Physician immediately available 0.505*** (0.099) X-rays and diagnostic laboratory services only 0.682*** (0.087) Full Diagnostic services (x-rays, lab work, CATscans, MRI) 0.971*** (0.104) Emergency care 0.442*** (0.087) Physical Therapy (Specialized Care) -0.076 (0.112) Dialysis as a form of specialized care 0.508* (0.289) Cancer care as an offering of Specialized Care 0.747*** (0.267) Medicaid/Medicare, Sliding Scale based on patients’ income and private insurance are all accepted 1.048*** (0.105) Medicaid/Medicare and private insurance accepted 0.541***
(0.111) Price -0.012*** (0.001) Private insurance interacted with full diagnostics services
0.216* (0.116) Full diagnostics interacted with respondents with income of 50k-75k -0.042
(0.153)

63
Table 6-4 (continued)
24-hour service interacted with respondents with children 0.083 (0.110) Emergency care attribute interacted with respondent with children 0.100 (0.112) Dialysis interacted with age -0.012** (0.005) Oncology specialty services interacted with age -0.010** (0.004) Facility that accepts all patients interacted with uninsured patients 0.752*** (0.173) Facility that accepts patients with public or private insurance interacted with patients with Medicare and private insurance 0.273 (0.194) Facility having a Physician immediately available interacted with respondents who have income of 50k to 75k 0.010 (0.184) Facility which accepts all patients interacted with patients with income less than $15,000 0.035 (0.131) Constant (alternative 2) 0.045 (0.129) Constant (alternative 3) 1.442*** (0.197) Observations 8,160
Standard errors in parentheses, *** p<0.01, ** p<0.05, * p<0.1. Legend for variables is below in table 6.9.
Table 6-5: Sign of WTP with Conditional Logit and Interaction Variables Attribute WTP/$ Is WTP
Significant?
Twentyfour, open 24 hours a day, 7 days a week 66.00 Yes Ninetofive, open 9am-5pm, 7 days a week 31.14 Yes Allappt, Physician, Nurse Practitioner or Physician Assistant seen by appointment only
37.05 Yes
Phys, Physician immediately available 43.61 Yes Xraydiag, x-rays and diagnostic laboratory services only 58.55 Yes Fulldiag, Full Diagnostic services (x-rays, lab work, CATscans, MRI)
80.31 Yes
Emergency, Emergency care 37.25 Yes Therapy, Physical Therapy (Specialized Care) -6.53 No

64
Table 6-5 (continued) Dialysis, Dialysis as a form of specialized care 43.86 Yes Cancer, Cancer care as an offering of Specialized Care 65.23 Yes Allinsurance, Medicaid/Medicare, Sliding Scale based on patient’s income and private insurance are all accepted
90.68 Yes
Pubpriv, Medicaid/Medicare and private insurance 46.45 Yes Value with interactions Fulldiag_privat, value a respondent with private insurance has for full diagnostics versus their value for X-rays only
98.67 Yes
Fulldiag_Inc5075k, Full diagnostics interacted with respondents with income of 50k-75k
77.50 No
Emergency_kids, value a respondent with children has for emergency care versus their value for no emergency care
45.17 No
Dialysis_age, Dialysis interacted with respondents’ age -41.33 Yes Cancer_age, Cancer care interacted with respondents’ age -61.42 Yes Allinsurance_uninsured, Facility accepting all insurance types and out of pocket payers on a sliding scale interacted with uninsured respondents
150.10 Yes
Pubpriv_combo, Facility accepting only Medicare, Medicaid and Private insurance interacted with respondents who have a combination of Private insurance and Medicare
67.80 No
Phys_inc5075k, Facility having a Physician immediately available interacted with respondents’ income of 50k to 75k
42.92 No
Allinsurance_inc15k, Facility accepts all insurance types and uninsured interacted with respondents’ income < $15,000 a year
90.25 No
Fulldiag_inc100k, Facility offers full diagnostic services interacted with respondents’ income over $100,000 annually
142.67 Yes
Fulldiag_combo, Facility with full diagnostics interacted with respondents with combination of private insurance and Medicare
87.75 No
Phys_combo, Physician immediately available interacted with respondents with combination of private insurance and Medicare
34.83 No
6.3.1 Mixed Logit model with interactions
Some of the interaction variables with the mixed logit model include the
demographic characteristics and health status of respondents from the index in section 5.2.
The most valuable attribute, a facility which accepts all patients regardless of whether they
have health insurance [All insurance] was interacted with patients’ ranking of how

65
important it is to them that their provider accept all patients [No insurance], and also
interacted with patients who had no insurance[Uninsured]. An interaction between the
attribute of having an emergency department and whether respondents or members of their
household have used an emergency department was performed. An interaction between the
attribute of having an emergency department the distance respondents travelled to an
emergency department was performed.
Table 6-7: Mixed Logit with Health Index and Demographic Data
VARIABLES Mean Standard Deviation
Price -0.033*** (0.003) Open 24 hours a day, 7 days a week 0.929*** 2.281*** (0.215) (0.254) Open 9am-5pm, 7 days a week 0.378** 1.319*** (0.162) (0.245) MD, NP or PA seen by appointment only -0.139 2.209*** (0.185) (0.306) Physician immediately available 0.555*** -1.036*** (0.180) (0.363) X-rays and diagnostic laboratory services only 0.639*** 0.804*** (0.167) (0.269) Full Diagnostic services (x-rays, labs, CATscans, MRI) 1.805*** 1.146*** (0.191) (0.339) Emergency care -0.190 2.080*** (0.405) (0.282) Physical Therapy (Specialized Care) -0.865*** 1.151*** (0.201) (0.312) Dialysis as a form of specialized care -1.170*** 1.356***
(0.208) (0.325) Cancer care as an offering of Specialized Care 0.404 -0.565 (0.528) (0.347) Medicaid/Medicare, Sliding Scale based on patients’ income and private insurance are all accepted 1.207*** 1.498*** (0.355) (0.320) Medicaid/Medicare and private insurance accepted 0.992*** -1.240***
(0.202) (0.333)

66
Table 6-7 (continued) Emergency_ercare, Facility with emergency department interacted with Respondent use of ER last 2 years -0.027 1.475*** (0.203) (0.266) Emergency_diercare, ER and respondents’ distance to ER 0.312** 0.268** (0.150) (0.136) Allinsurance_noins, All insurance/uninsured accepted interacted with ranking of respondents indicating importance to them that their provider accept uninsured 0.234** 0.574*** (0.103) (0.111) Twentyfour_kids, A facility that is open 24 hours interacted with respondents with children 0.412 -0.736 (0.316) (0.507) Emergency_kids, ER interact with respondents with kids 0.346 -0.439 (0.321) (0.454) Emergency_uninsured, ER interacted with uninsured -0.070 -0.748 (0.461) (0.535) Cancer_age, Cancer services interacted with age -0.009 0.001 (0.009) (0.007) Allinsurance_uninsured, All insurance/uninsured accepted interacted with uninsured respondents 1.479** 3.617***
(0.610) (0.880)
Observations 8,184 8,184 Standard errors in parentheses *** p<0.01, ** p<0.05, * p<0.1
6.3.2 Estimation of the Willingness-to-pay with interactions
In the mixed logit model which includes respondents’ health history from the
health index and demographic variables, there are three significant interaction variables
(Table 6-7).

67
Table 6-8: WTP from Mixed Logit with Health History and Demographic Data
Variable Description WTP Lower Limit
Upper Limit
Twentyfour 24 hours a day, 7 days a week 28.08
15.37
40.79
Ninetofive 9am-5pm, 7 days a week 11.43
2.23
20.62 Allappt Practitioner by appointment only -4.19 -15.25 6.86 Phys MD immediately available 16.76 6.25 27.27
Xraydiag X-rays and diagnostic lab
services only 19.30
9.67
28.93
Fulldiag Full Diagnostic services 54.54
43.98
65.11 Emergency Emergency care -5.75 -29.80 18.29
Therapy Physical Therapy -26.14
-38.77
-13.51 Cancer Cancer care 12.21 -18.96 43.38 Allinsurance All patients accepted 36.48 15.59 57.37
Pubpriv Public/private insurance
accepted 29.99
18.58
41.41
Emergency_ercare ER interacted with respondent
using ER in last 2 years -0.82
-12.86
11.23
Emergency_diercare ER interacted with their distance
from ER
9.42
0.59
18.25
Allinsurance_noins
Facility that accepts all patients interacted with respondents’
ranking importance for facility to accept all patients
7.06
0.96
13.15
Twentyfour_kids 24-hour facility interacted with
respondents with children
12.45
-6.13
31.03
Emergency_kids ER interact with respondents
with kids
10.46
-8.54
29.47
Emergency_uninsured ER interact with uninsured
respondents
-2.10
-29.41
25.21
Cancer_age Cancer service interacted with
age
-0.28
-0.81
0.25
Allinsurance_uninsured
All insurance types accepted interacted with uninsured
respondents
44.68
7.82
81.54

68
The WTP values are presented below in Table 6-8. These results in Table 6-8 are
consistent with the hypotheses that the respondents are willing to pay for the attributes they
find valuable based on their particular individual demographic characteristics. First,
distance from emergency care interacted with a facility that has an emergency department
is significant at the 5% level. As respondents’ self-reported distance or driving time from
emergency care increased by one unit (1 unit is a 15 minute drive; e.g. from a 15- minute
drive to a 30-minute drive), they were willing to pay $3.67 for emergency department
services. This is consistent with the hypothesis that respondents’ WTP would increase with
increasing distance from emergency care.
Second, ‘No insurance’, a measure of how important respondents find it that the
provider accepts individuals who do not have insurance or who self-pay when seeking
immediate medical care being, being interacted with a facility that accepts all patience
regardless of whether they have public or private or no insurance is significant at the 1%
level. Respondents’ ranking the importance of their provider accepting everyone regardless
of their insurance coverage compared to seeing only accepting patients with private
insurance was valued at $43.52. This indicates how much respondents value access to care
and fits the hypothesis that as the respondents value their provider seeing all patients they
will be willing to pay for that attribute of access to care.
Third, a facility that accepts all patients regardless of health insurance type or lack
coverage interacted with uninsured persons is significant at the 5% level. In line with the
hypothesis, the study finds that uninsured respondents are willing to pay $81.15 for the
above facility compared to a facility that only accepts patient with private health insurance.

69
There are four findings that are interesting but not statistically significant. First,
respondents with children had a willingness-to-pay total of $40.52 whereas the average
respondent was willing to pay $28.08 for a facility that operated 24 hours compared to a
facility open from 9am to 7pm, 5 days a week. Second, respondents with children had a
WTP of $4.71 for emergency services; but the average respondent had a negative WTP for
emergency services when interactions were included. These findings are clinically
significant although they may appear to be statistically insignificant. This is because
households with children, knowing how especially prone children are to illness and
accidents, would want medical care to be available around the clock either in an emergency
department or in a 24-hour facility. These respondents would want a facility they could
take their children to for more comprehensive medical care and not only emergency
services. They appear to prefer a facility open 24 hours to an ED although they value both.
Although these findings are consistent with the hypotheses, they are not statistically
significant.
Third, as age increased, respondents WTP for cancer care had a negative sign and
respondents with no insurance had a negative sign for emergency services. These findings
seemed counter-intuitive that with increasing age they would not want to pay for a facility
to include cancer care or with no insurance a person would not want to pay for a facility to
include an attribute of emergency services. It appears that rural residents would prefer to
travel to urban medical centers or academic health centers for more advanced care from
more experienced practitioner than to have a facility in their rural locality providing
oncology services. Also, it may be that uninsured respondents have had many experiences
with emergency departments being their predominant source of care and do not wish to

70
pay for them either due to poor experiences or because they can always have such care
from an emergency department so do not see the need to pay for it themselves, but can use
it as a public good.
71
Chapter 7: Discussions and Conclusions
7.1 Main findings
The results from this study showed that respondents value attributes of healthcare
facilities presented to them. Access to healthcare in America is largely predicated on
having health insurance, being able to see a provider when needed, and having diagnostic
medical technologies available in a community. Thus, respondents value a facility that
treats everyone regardless of whether they have health insurance or not, compared to one
which only treats patients with private insurance, at $69.90. The study also found that
respondents are willing to pay $19.20 to see a physician who is immediately available
compared to only being able to see a mid-level practitioner. However, they are not willing
to pay for the attribute level which requires them to make an appointment first before they
can see their providers, whether the provider is a physician or mid-level practitioners
compared to only being able to see a mid-level practitioner. This would imply that
respondents prefer being able to see a practitioner quickly without having to make and wait
for an appointment whether a full physician or mid-level practitioner.
The third main finding related to patients’ access healthcare is medical technology
such as diagnostic information for detecting and staging cancer, obstetric or genetic
abnormalities, and infectious diseases. Respondents are willing to pay $28.80 for X-ray
and diagnostic labs only compared to only X-rays; and are willing to pay $51.60 for full
diagnostic services when compared to only X-rays. Full diagnostics services is the second
most valuable attribute level after a facility which treats all patients even if they do not
have health insurance coverage. In a developed country where technology drives many
sectors of the economy, technology drives healthcare provision to a large extent and makes

72
up a significant portion of the costs of healthcare in America. The study suggests the high
value respondents hold for expensive medical technology which is a significant cost driver
with healthcare spending. This valuation can help administrators in rural facilities justify
the need for more and improved medical technology to improve the services in the local
emergency departments and the satisfaction of their residents.
Incorporating respondent characteristics with the facility attributes provided some
relevant results. Respondents are willing to pay $19.30 on average for an emergency
department to be offered in a facility in their vicinity compared to having no emergency
department. However, those who had used an emergency department in the last 2 years
were not willing to pay for an emergency department. Several respondents indicated in the
comments section that they were not satisfied with the services they received in the
emergency departments in their rural or community hospitals. They indicated that they
would prefer to travel a longer distance to a large academic medical center for more
experienced practitioners, more advanced medical technology with more sensitivity in
detection and faster more efficient service delivery. Long wait and service times in smaller,
rural hospitals in which the facilities have a limited number of diagnostic machines, a larger
ratio of patients to providers, and inefficient processing and triage of patients were also a
dissatisfaction to respondents. The respondents prefer an ED visit at a larger facility that
would take less the time than at their rural facility. The patient may need transferred to or
have to later visit another facility to get the higher level of care they need that could not be
provided by their rural emergency department. There are also more limited hours of
operation in the day of personnel such as specialists, pharmacy staff and medical
technicians needed to support the operation of rural emergency departments. These reasons
73
explain why to rural residents who have experience with their local emergency department
not being willing to pay for an emergency department to be sited in their community.
The second respondent characteristic of distance from emergency department
services showed that an increase in drive time by 15 minutes from an emergency
department made respondents WTP $3.67. When adjusted for, the respondents’ self-
reported distance from emergency care positively increased their WTP for emergency
department services by $3.67 by every 15 minutes additional drive away from an
emergency care facility. This implies that respondents who lived farther away from an ED
were willing to pay more to have an ED nearby as their distance increased from such care.
Considering the dissatisfaction of residents who have used an ED recently and the
value of residents who live far from an ED, a group of rural communities near each other
can pool their resources to support the provision of an emergency department accessible
these communities. Instead of each community having a smaller emergency department
which may send home specialized personnel after a typical workday, they could
consolidate their resources to have a larger ED accessible to each other them within a
reasonable driving distance that is open 24 hours and having specialists such as
cardiologists on call or on staff 24 hours while retaining smaller urgent care facilities from
which patients could be transferred to this larger consolidated facility.
Oncology service is valued at -$15.90 compared to not having oncology service;
though this value is not significant, interacting age with oncology services showed that
with every additional year respondents were still not willing-to-pay for cancer (WTP -
$0.28). This implies that rural residents even when increasing in age and becoming
increasingly limited by transportation options would still prefer care at established hospital

74
systems or academic health centers in urban cities than in rural regions where more
experience, technological advancement and larger numbers of procedures tend to result in
improved outcomes for patients.
Uninsured respondents had a willingness-to-pay value for an emergency
department of -$7.85 compared a facility without an emergency department whereas the
average respondent had a WTP of $19.30. It implies that uninsured respondents do not
value an emergency department. However uninsured respondents were willing to pay
$81.16, an extra $11.26 over the $69.90 that the average respondent was willing to pay for
a facility that accepted and treated anyone regardless of whether they had insurance or not
compared to a facility that only accepts patients with private insurance. This may be a
beneficial attribute of a healthcare facility for the uninsured. The results suggest that
uninsured respondents prefer preventive health care to emergency health care. They would
prefer a facility which resembles a health department or federally qualified health center
that provides preventive, comprehensive and primary health care for chronic issues rather
than accessing emergency treatment for acute interventions. Preventive health care is more
desirable for patients, practitioners, society and the health system than emergency care as
many problems such as heart attacks or strokes dealt with in an emergency setting cost a
significant amount in time, resources, health personnel and money compared with treating
a patient’s high blood pressure at a primary care visit hence preventing such complications
such as heart attacks and strokes in the future.
This response reflects the value of the large number of uninsured persons in the
population. 13% of the respondents in this study were uninsured and 23% of the residents
of the 10-county region where this study was conducted were uninsured in 2012. The

75
significant willingness-to-pay values reflect how much uninsured residents value access to
medical care. The impact of having health insurance and the policy implication of
providing insurance therefore are to improve health and subsequently economic output of
rural areas as productivity and economic output depend heavily on the health of the labor
force. Andersen’s (1995, 2005) theory of health behavior and care utilization corroborates
the results of this study because based on their health status and health beliefs respondents
are willing to pay for what they believe are valued determinants of health in the biomedical
model of health some of which are the various attributes of healthcare seen here.
7.2 Policy implications
Since the majority of WTP studies conducted is to inform policy-making (Carson,
2000), for policy-makers the results of this study can be useful because they inform how
funds can be allocated to healthcare attributes that residents are willing to pay for.
7.2.1 Implications for providers of healthcare facilities
The findings from this study show that residents in rural Kentucky value the stated
attributes of healthcare. For hospital associations, private practitioners and public officials
who are involved in providing medical care facilities, paying attention to the attributes
consumers care about, how much they value them and the circumstances that affect their
willingness-to-pay will inform where necessary funds should be allocated. This will enable
facilities with the right services to be provided in the right locations for the right price to
the right consumers.
Gafni (1991) suggests using the willingness-to-pay of residents as a way to measure
the benefits accruing to the society to influence governmental decision making about

76
implementing health care programs. Decision makers such as governments and private
health care service providers need to understand the users’ willingness to pay values using
various direct or indirect measurements to get the best possible gauge of the public’s
perception (Gafni, 1991). Thus, the motivation for this study is to help inform public and
private providers of healthcare about consumers’ perception and value of heath care
facilities in rural areas.
Alderman and Lavy (1996) explain that the effectiveness of government
investments in healthcare depends on the public’s response to price and quality, and
whether these investments actually improve health outcomes. According to their findings,
consumers, even those in low-income households, are willing to pay fees for better health
care if those fees translate into improved access and reliability of health care facilities.
They further explained that the availability of basic healthcare has a relatively greater
impact on households with low incomes or low education or both than does the provision
of more specialized services (Alderman and Lavy, 1996).
Inferring from this study, facility administrators in a region that is distant from a
facility with an emergency department can sum up the value of the residents in their market
and their distances from the nearest emergency facility and come up with the value of their
locality for an emergency department. This administrator can justify the costs to provide
such a facility by comparing the welfare benefit to his clients especially if public funds will
be used to provide that emergency service. Facility managers may decide to provide
diagnostics services care to an aging population with favorable health insurance that
enables them to pay for such services to reduce the travel time to such services in urban
areas. They may also elect to provide preventive health care services to uninsured or
77
indigent populations who require public health insurance such as Medicare or Medicaid
and can justify such expenditures by showing that the benefits outweigh the costs. Finally,
health administrators may provide several services to several different population with
different health needs and justify public health spending necessary to meet the needs of
their local populations based the valuation of the residents for the attributes of the services
in their localities.
Market research is needed in each county to determine the needs of the population,
their willingness-to-pay, their ability to pay, education level, stages in life of household
residents (with young children or retirees) and type of insurance coverage. When
prioritizing the communities’ needs, public officials could use relevant resident
willingness-to-pay values to inform their budgets. Public officials in adjoining counties can
collaborate to review existing health services, and healthcare needs in their region and
consider consolidation of publicly provided healthcare services. This could be done at the
level of area development districts or even smaller regional groups.
7.2.2 Implications for rural residents
Because the rural healthcare system is supported by a mix of federal, state, and
private entities, knowing the private benefit of services could help federal and state entities
to focus their efforts on the amenities for which social benefits are greater private benefits.
In a region impacted by diabetes, obesity, cancer, and drug addiction, treatment services
for attribute levels valued by each community can be established by justifying the benefits
to society compared to the costs to society with community health needs assessments. This
is especially important in areas where a quarter of the population (23%) is uninsured and
another quarter of the population (26%) uses Medicaid in the 10-county region where the

78
study is conducted. Uninsured persons may still get medical care in emergency departments
and when they are unable to pay their medical bills, the hospitals have to write off the costs
or pass on the cost of these services to paying customers whose out-of-pocket payments or
insurance premiums get raised in response. It costs significantly more to use an emergency
department for care and when these options, costs and outcomes are presented to the
community members they may be willing to pay for all, including uninsured residents, to
have access to preventative primary health care. This is cost minimizing for the whole
community rather than using costlier emergency services for the same issues at the same
time or in future when complications have set in requiring emergency services for
transportation, hospitalization, or intensive care.
If, for example, each resident is willing to pay $30 dollars annually for an attribute,
based on the total number of residents, a facility with the needed attribute and value to
those residents can be justified. These attributes could be added on to existing infrastructure
provided by federal and state funding sources. For example, a physician assistant or nurse
practitioner could be hired on a part-time basis to run an outpatient service in an office
attached to a rural health clinic that attracts such funding designated for certain needs. As
communities’ health needs assessments dictate, residents’ willingness-to-pay, and what
services to provide can be addressed in a public forum by administrators to obtain resident
input at each step of the decision-making process.
7.3 Limitations and further research
There a few limitations in this study. First, it focused on one narrow aspect of access
to health care and insurance issues in rural areas and what the population values or is
willing to pay for in health care attributes. The study only examines basic attributes in areas
79
dealing with the burdens of shortages of health professionals, poor insurance coverage,
comparatively lower incomes and lower public and private sector funds for healthcare
amenities. Further research can assess attributes such technological advancement,
experience, expertise, quality, efficiency and long-term outcomes of care delivery in rural
areas with instruments that can quantify these attributes that are less tangible. Further
research can consider attributes such as quality of service and outcomes of interventions
on patient health which the centers for Medicare and Medicaid services now consider to
provide star ratings for facilities and hence improved reimbursement rates.
This work can be further developed by expanding the choice situations and
increasing the number and levels attributes offered respondents. The attributes, levels and
prices utilized can be increased despite inherent limitations of balancing the increase in
complexity of the experiment for respondents with trying to gain more reliability in results.
Second, the survey did not include an option for respondents to report educational
attainment. This may affect the results with demographic variables because education has
a correlation with income and health status so its exclusion may result in omitted variable
bias.
Zimmerman and McAdams (1999) looked at all 105 counties in Kansas to examine
local funding for healthcare with more depth than could be observed with the United States
Census data. They observe that there was substantial variation in spending between
counties based on income level, population age and population density. They explain that
in rural areas, incomes tend to be lower, age tends towards the elderly and poorer health,
and population density is lower. These three items explained about 40 percent of the
variation in spending between urban and rural counties showing the effect that income,

80
health status and distance from care can have on expenditures. Similarly, this study
suggests that rural respondents’ willingness-to-pay for services vary from the average
respondent according to income, health insurance coverage, health status and distance from
care. Hence public spending appears to mirror residents value for healthcare so that benefits
of spending appear to match the costs as Alderman and Lavy (1996) suggests.
In summary, this study provides relevant information to stakeholders and policy
makers about the rural residents in Kentucky value improvements in certain attributes of
health care. The results show that demographic characteristics influence willingness-to-
pay for healthcare. Decision-makers can decide the healthcare services that would most
benefit their communities. Public providers of care or private hospital groups can consider
the insurance reimbursement rates among the population of persons without insurance and
the amount of indigent care that would have to be written off. The results of the study may
also be applied to similar rural community across the United States of America which may
have similar demographics as rural Kentucky.

81
Appendices
Appendix A – Survey
The Value of Healthcare Survey
I. Healthcare History 1. Over the past two years have you or members of your household utilized the
following health care services? (Please check the ones that apply) Primary Care
Preventive Care ____ You ____ Member of household
Care of other illness or health concern ____ You ____ Member of household
X-Ray/Diagnostic Services ____ You ____ Member of household
Emergency Room Services
Care of emergency issues ____ You ____ Member of household
If so, were these issues life threatening? ____ YES ____ NO
Care of non-emergency issues ____ You ____ Member of household
Specialty Care Services
Cardiology ____ You ____ Member of household
Obstetrics/Gynecology ____ You ____ Member of household
Radiology ____ You ____ Member of household
Neurology ____ You ____ Member of household
Psychiatry ____ You ____ Member of household
Oncology (cancer care) ____ You ____ Member of household
Urology ____ You ____ Member of household
Orthopedics ____ You ____ Member of household
Pulmonology (lung care) ____ You ____ Member of household
Pediatrics ____ Children
2. Healthcare Providers a. Do you have a regular primary care physician? ____ YES____NO
b. If you answered yes to 2a, is your primary care physician located in your
county? ____ YES ____NO

82
c. If you answered no to question 2b, how far do you drive to visit your
primary care physician? ______ miles
d. If you or a member of your household have used a hospital in the past two years please list the name of the hospital and indicate if the visit was for emergency purposes. Please indicate the quality of your experience on a scale of 1 to 5 where 1 = very unsatisfactory, 2 = somewhat unsatisfactory, 3 = neutral 4 = somewhat satisfactory and 5 = very satisfactory.
Hospital Name Emergency room visit?
Quality of Experience
Yes No
Yes No
Yes No
Yes No
_______________________
Yes No _____
e. Do you use any of the following sources of information when making the decision about which hospital to use? (Check all that apply)
___ Billboards ___ Internet
___ County events (fairs, wellness events) ___ Newspaper
___ Direct mail ___ Physician referral
___ Facebook ___ Radio/TV
___ Friends and family experiences ___ Twitter/social media
___ Word of mouth
f. Do you believe your community has a Federally Qualified Health Center/Rural Health Clinic (this is not the Health Department)?
_____ YES _____NO
g. Have you used the Federally Qualified Health Center/Rural Health Clinic in your community in the last two years?
_____ YES _____ NO

83
In the following, you will be presented with a series of new medical facilities that
may be built to serve your community. These facilities are grouped in four choice
situations. Each choice situation presents two medical facilities. You are asked to indicate
your preferred facility in each choice situation. You can also indicate that you do not prefer
either. The two medical facilities in each choice situation are identical in all other
characteristics except those described. In order to create or maintain the characteristics
listed for these facilities, additional funding must be generated. The amount of household
funding necessary to support each facility is provided with each choice. While making your
choices, please keep in mind that:
Please choose ONLY ONE FACILITY in each situation
FACILITIES in each situation are the ONLY ones available
Do NOT compare facilities in different choice situations
Choice Situation 1 of 4
Facility A (following
features offered)
Facility B (following features
offered)
Hours Open 24 hours a day/7days
9-7/5 days
Providers on Staff
Physician, Nurse Practitioner, or
Physician Assistant seen by
appointment only
Only Nurse Practitioner or
Physician Assistant available
Services
x-rays and diagnostic
laboratory services only
x-rays only
I do not prefer either facility (please check
below)
Emergency Care Yes No
Specialized Care None None
Accepted Insurance
Private insurance only
Private insurance only

84
Mandatory fee every household will pay per year
$100 $80
I would prefer to have facility: (choose one only)
Please choose ONLY ONE FACILITY in each situation
FACILITIES in each situation are the ONLY ones available
Do NOT compare facilities in different choice situations Choice Situation 2 of 4
Facility A
(following features offered)
Facility B (following features
offered)
Hours Open 9-5/ 7days 9-7/5 days
Providers on Staff
Only Nurse Practitioner or
Physician Assistant available
Physician, Nurse Practitioner, or
Physician Assistant seen by appointment
only
Services
Full Diagnostic services (x-rays, lab
work, CATscans, MRI)
x-rays only
I do not prefer either facility (please check
below)
Emergency Care
Yes No
Specialized Care
Dialysis Dialysis
Accepted Insurance
Medicaid/Medicare, Sliding Scale based on patient’s income,
and private insurance
Medicaid/Medicare, Sliding Scale based on patient’s income,
and private insurance
Mandatory fee every household will pay per year
$100 $40
I would prefer to have facility: (choose one only)

85
Please choose ONLY ONE FACILITY in each situation
FACILITIES in each situation are the ONLY ones available
Do NOT compare facilities in different choice situations Choice Situation 3 of 4
Facility A
(following features offered)
Facility B (following features
offered)
Hours Open 24 hours a day/7 days 9-5/ 7days
Providers on Staff
Physician immediately available
Physician immediately available
Services
Full Diagnostic services (x-rays, lab
work, CATscans, MRI)
x-rays and diagnostic laboratory services
only
I do not prefer either
facility (please check below)
Emergency Care
Yes Yes
Specialized Care
Physical therapy Cancer care
Accepted Insurance
Medicaid/Medicare and private insurance
Medicaid/Medicare and private insurance
Mandatory fee every household will pay per year
$40 $80
I would prefer to have facility: (choose one only)

86
Please choose ONLY ONE FACILITY in each situation
FACILITIES in each situation are the ONLY ones available
Do NOT compare facilities in different choice situations
Choice Situation 4 of 4
Facility A
(following features offered)
Facility B (following features
offered)
Hours Open 24 hours a day/7 days 9-7/5 days
Providers on Staff
Physician, Nurse Practitioner, or
Physician Assistant seen by appointment
only
Only Nurse Practitioner or
Physician Assistant available
Services x-rays only x-rays and diagnostic laboratory services
only I do not prefer either
facility (please check below)
Emergency Care
No Yes
Specialized Care
Cancer care Physical therapy
Accepted Insurance
Medicaid/Medicare and private insurance
Medicaid/Medicare, Sliding Scale based on patient’s income, and
private insurance Mandatory fee every household will pay per year
$60 $120
I would prefer to have facility: (choose one only)

87
II. Follow up questions 3. How long do you have to travel to access the following services? (Please check
the appropriate box)
Services
Driving Time
0 to 15 minutes
15 to 30 minutes
30 minutes to
1 hour
Longer than 1 hour
Don’t know or not
applicable Routine care services (family doctor)
Specialized care services (cancer care, dialysis, etc.)
Urgent care services
Emergency health care services (emergency room)
Diagnostic services (x-ray, lab work, MRI, CATscan)
4. How important is it that you have access to the following specialty services in your community? (Please check one for each specialty service)
Not important
at all
Somewhat unimportant
Somewhat
important
Very importan
t
Don’t know or not
applicable
Cancer treatment Cardiac rehab Diabetes treatment
Kidney Dialysis Services
Physical therapy

88
5. When seeking immediate medical care how important is it that your provider accepts your health insurance, Medicaid, or Medicare? (Please circle one)
Not important at all Somewhat unimportant Somewhat Important
Very important NA
6. When seeking immediate medical care how important is it that your provider accepts individuals who do not have health insurance or those who self pay? (Please circle one)
Not important at all Somewhat unimportant Somewhat Important
Very important NA
7. If your community didn’t have a local hospital, how long would it take you to drive to access regular services that are usually provided by your local hospital? (Please check one)
___0-15 min ___15-30 min ___30 min - 1 hour ___ More than 1 hour
8. Would you have to leave the state to visit the nearest services?_ YES_ NO
III. Demographic Information 9. What is your postal code? ________________
10. What is your age? _____ Years
11. Are you? _____ Male _____ Female
12. Are you currently married or living with a significant other?___ YES___ NO
13. Are there children currently living in your household? ___ YES___ NO
If yes, how many children? _____ Children
What are the ages of the children? __________________________
89
14. Do you currently care for elderly members (older than 65) of your family?
_____ YES ____ NO
If yes, do these individuals live with you full-time? _____ YES ____ NO
15. Do you participate in any of the following private or public insurance plans? _____ Employer sponsored (Private)
_____ Employer sponsored (Public)
_____ Medicare
_____ Medicaid
_____ Combination Private/Medicare
_____ Uninsured
16. Please indicate your annual household income within the ranges below. _____ Under $15,000
_____ Between $15,000 and $24,999
_____ Between $25,000 and $34,999
_____ Between $35,000 and $49,999
_____ Between $50,000 and $74,999
_____ Between $75,000 and $99,999
_____ Over $100,000
Please use space below to provide any comments you may have on this survey.
_________________________________________________________

90
Appendix B. Table of responses from choice experiment
Mean Percentage of respondents who chose this facility %
Scenario 1 facility A 0.242 24.2 Scenario 1 facility B 0.376 37.6 Scenario 1, neither facility 0.352 35.2 Scenario 2 facility A 0.395 39.5 Scenario 2 facility B 0.227 22.7 Scenario 2, neither facility 0.328 32.8 Scenario 3 facility A 0.301 30.1 Scenario 3 facility B 0.379 37.9 Scenario 3, neither facility 0.276 27.6 Scenario 4 facility A 0.416 41.6 Scenario 4 facility B 0.144 14.4 Scenario 4, neither facility 0.386 38.6
Appendix C. Distances to the following services
Mean SD Min Max Routine care services (family doctor) 23.022 17.469 7.500 75.000 Specialized care (cancer, dialysis) 47.403 18.634 7.500 90.0 Urgent care services 32.482 18.979 7.500 75.000 Emergency health care services (ER) 29.820 18.856 7.500 75.000 Diagnostic services (x-ray, lab work, MRI, CAT scan)
33.128 19.403 7.500 75.000
No local hospital 43.725 15.354 7.500 75.000 Would have to leave the state (%) 5.4 0.226 0.0 1.000

91
Appendix D. Rankings of importance of specialty care
1. If it were applied to you, how important is it that you have access to the following specialty services in your community?
Cancer Frequency Percent
Don’t know or not applicable 119 15.18 Not important at all 36 4.59 Somewhat unimportant 28 3.57 Somewhat important 150 19.13 Very Important 451 57.53
Total 784 100
Cardiac Rehabilitation Frequency Percent
Don’t know or not applicable 100 12.76 Not important at all 26 3.32 Somewhat unimportant 27 3.44 Somewhat important 169 21.56 Very Important 462 58.93
Diabetes Frequency Percent
Don’t know or not applicable 111 14.16 Not important at all 33 4.21 Somewhat unimportant 35 4.46 Somewhat important 167 21.3 Very Important 437 55.74 45 1 0.13

92
Dialysis Frequency Percent
Don’t know or not applicable 138 17.6 Not important at all 38 4.85 Somewhat unimportant 43 5.48 Somewhat important 169 21.56 Very Important 395 50.38
Physical Therapy Frequency Percent
Don’t know or not applicable 97 12.37 Not important at all 24 3.06 Somewhat unimportant 32 4.08 Somewhat important 204 26.02 Very Important 426 54.34
2. When seeking immediate medical care how important is it that your provider accepts your health insurance, Medicaid or Medicare?
Respondent’s Insurance Frequency PercentDon’t know or not applicable 75 9.57 Not important at all 6 0.77 Somewhat unimportant 3 0.38 Somewhat important 23 2.93 Very Important 677 86.35
3. When seeking immediate medical care how important is it that your provider accepts individuals who do not have health insurance or those who self pay?
No insurance Frequency. PercentDon’t know or not applicable 84 10.71 Not important at all 44 5.61 Somewhat unimportant 34 4.34 Somewhat important 107 13.65 Very Important 515 65.69

93
Appendix E – Additional tables
Table E-1: Description of Variables Variable Description Healthcare History
Use of these services over past two years Preventive care Dummy variable, yes = 1 Care of other illness Dummy variable, yes = 1 X-ray/Diagnostic Services Dummy variable, yes = 1
Emergency Room Services Care of emergency issues Dummy variable, yes = 1 Were ER issues life threatening? Dummy variable, yes = 1 Care of non-emergency services Dummy variable, yes = 1
Specialty Care Services Cardiology Dummy variable, yes = 1 Obstetrics/Gynecology Dummy variable, yes = 1 Radiology Dummy variable, yes = 1 Neurology Dummy variable, yes = 1 Psychiatry Dummy variable, yes = 1 Oncology Dummy variable, yes = 1 Urology Dummy variable, yes = 1 Orthopedics Dummy variable, yes = 1 Pulmonology Dummy variable, yes = 1 Pediatrics Dummy variable, yes = 1
Healthcare Providers aDo you have a regular primary care
physician? Dummy variable, yes = 1
If affirmative, is physician based in your county?
Dummy variable, yes = 1
If your primary care physician is not located in your county, how far do you drive to visit your primary care physician?
Continuous variable, distance from Physician in miles

94
Table E-2: Importance of Services Variable Description
Cancer treatment Respondents rank how important it is to them to have cancer treatment specialty services in their community on a scale of 1 to 5.
Cardiac rehab Respondents rank how important it is to them to have cardiac rehabilitation specialty services in their community on a scale of 1 to 5.
Diabetes treatment Respondents rank how important it is to them to have diabetes treatment specialty services in their community on a scale of 1 to 5.
Kidney Dialysis Services
Respondents rank how important it is to them to have dialysis specialty services in their community on a scale of 1 to 5.
Physical therapy Respondents rank how important it is to them to have physical therapy specialty services in their community on a scale of 1 to 5.
How important is it that Provider accept your insurance, Medicare, or Medicaid
Respondents rank how important it is to them for their medical provider to accept their private health insurance, Medicare or Medicaid on a scale of 1 to 5.
For immediate care how important is it that provider accepts those with no insurance or those who self-pay
Respondents rank how important it is to them for their medical provider to accept those with no insurance or those who pay out of pocket for immediate care on a scale of 1 to 5.
Table E-3: Distance to Services Variable Description Routine care services (family doctor)
Categorical variable; 0-15min=1, 15-30min=2, 30-60min=3, over 60min=4, don’t know or NA=5
Specialized care services (cancer care, dialysis)
Categorical variable; 0-15min=1, 15-30min=2, 30-60min=3, over 60min=4, don’t know or NA=5
Urgent care services Categorical variable; 0-15min=1, 15-30min=2, 30-60min=3, over 60min=4, don’t know or NA=5
Emergency health care services (emergency room)
Categorical variable; 0-15min=1, 15-30min=2, 30-60min=3, over 60min=4, don’t know or NA=5
Diagnostic services (x-ray, lab work, MRI, CAT scan)
Categorical variable; 0-15min=1, 15-30min=2, 30-60min=3, over 60min=4, don’t know or NA=5

95
Table E-4: Health Services Utilization Variable Description
Emergency Room (ERcare)
Dummy variable; In the last 2 years, respondent or household member used no Emergency Room services= 0, used Emergency
Room service=1.
Specialty Care (Specicare)
Dummy variable; In the last 2 years, respondent or household member used no specialty care services=0, used 1 specialty care
service=1. Distance to Routine care/family doctor (Diprimcare)
Categorical variable; Distance to routine care services; 0-15 minutes=1, 15-30 minutes=2, 30-60 minutes=3, over 60
minutes=4 Distance to X-ray/Diagnostic services (Dixrayserv)
Categorical variable; distance to X-ray/diagnostic care services; 0-15 minutes =1, 15-30 minutes=2, 30-60 minutes=3, over 60
minutes=4 Distance to Emergency Room Services (Diercare)
Categorical variable; distance to Emergency Room care services; 0-15 minutes=1, 15-30 minutes=2, 30-60 minutes=3, over 60
minutes=4 Distance to Specialty care services (Dispecicare)
Categorical variable; distance to specialty care services; 0-15 minutes =1, 15-30 minutes=2, 30-60 minutes=3, over 60
minutes=4 If it were applied to you, how important is it that you have access to the following specialty services in your community
Ranking of importance of access to the following specialty services below
How important is access to cancer care (Cancer)
Respondents’ ranking of importance of access to cancer care
How important is access to cardiac care (Cardiac)
Respondents’ ranking of importance of access to cardiac care
How important is access to diabetes care (Diabetes)
Respondents’ ranking of importance of access to diabetes care
How important is to you that your provider accept anyone regardless of their insurance coverage or if they are uninsured (Noins)
Respondents’ ranking of importance of access regardless of insurance coverage “insurance” is index variable for how
important provider accept your insurance, medicare or Medicaid. “Noins” is variable for ranking of importance of access regardless
of insurance, used in index; and “uninsured” is demographic variable

96
Table E-5: Health Services Utilization Variable Description
Primary Care (Primcare)
Dummy variable; In the last two years, respondent or member of household used no primary care services= 0, used a primary care
service=1.
X-ray/diagnostic services (Xrayserv)
Dummy variable; In the last two years, respondent or member of household used no X-ray/diagnostic services= 0, used X-
ray/diagnostic service=1.
Emergency Room (ERcare)
Dummy variable; In the last 2 years, respondent or household member used no Emergency Room services= 0, used Emergency
Room service=1.
Specialty Care (Specicare)
Dummy variable; In the last 2 years, respondent or household member used no specialty care services=0, used 1 specialty care
service=1. Distance to Routine care/family doctor (Diprimcare)
Categorical variable; Distance to routine care services; 0-15 minutes=1, 15-30 minutes=2, 30-60 minutes=3, over 60
minutes=4 Distance to X-ray/Diagnostic services (Dixrayserv)
Categorical variable; distance to X-ray/diagnostic care services; 0-15 minutes =1, 15-30 minutes=2, 30-60 minutes=3, over 60
minutes=4 Distance to Emergency Room Services (Diercare)
Categorical variable; distance to Emergency Room care services; 0-15 minutes=1, 15-30 minutes=2, 30-60 minutes=3, over 60
minutes=4 Distance to Specialty care services (Dispecicare)
Categorical variable; distance to specialty care services; 0-15 minutes =1, 15-30 minutes=2, 30-60 minutes=3, over 60
minutes=4 If it were applied to you, how important is it that you have access to the following specialty services in your community
Ranking of importance of access to the following specialty services below
How important is access to cancer care (Cancer)
Respondents’ ranking of importance of access to cancer care
How important is access to cardiac care (Cardiac)
Respondents’ ranking of importance of access to cardiac care
How important is access to diabetes care (Diabetes)
Respondents’ ranking of importance of access to diabetes care
How important is access to dialysis care (Dialysis)
Respondents’ ranking of importance of access to dialysis care

97
How important is access to Physical Therapy (Ptherapy)
Respondents’ ranking of importance of access to physical therapy
How important is it that your provider accepts your health insurance, Medicaid or Medicare when seeking immediate medical care (insurance)
Respondents answered with the legend above of the categorical variable ranking importance
How important is it that your provider accepts individuals who do not have health insurance, or who self-pay when seeking immediate medical care (noINS)
Respondents answered with the legend above of the categorical variable ranking importance
For the categorical variables ranking importance in this table – Legend; Not at all important=1, somewhat unimportant=2, somewhat important=3, very important=4, Don’t know or not applicable=5.
Table E-6: Legend of mixed logit interactions with health status and demographics Variable Meaning of Variable
Emergency_ercare
Facility has emergency department interacted with index label “ercare” of whether Respondent or a member of their
household had used the emergency room in the last 2 years
Emergency_diercare Value for emergency department relative to no ER based on
respondents’ current distance to emergency department
Allinsurance_noins
All insurance types accepted interacted with health service utilization variable of respondents who indicated that the importance to them that their provider accept uninsured
Twentyfour_kids A facility that is open 24 hours interacting with respondents
with children
Emergency_kids A facility that has an emergency department interacting with
respondents with children
Emergency_uninsured A facility with an emergency department interacting with
respondents who indicated they were uninsured

98
Cancer_age A facility that offers cancer services as specialty services
interacted with age
Allinsurance_uninsured All insurance types accepted interacted with respondents’
response that they are uninsured
Fulldiag_privat Value a respondent who has private health insurance will pay
for Full Diagnostics relative to only X-rays
Emergency_kids Value a respondent with children will has for emergency care
relative to no emergency care

99
Bibliography
Adamowicz, W., Louviere, J., & Williams. M. (1994). Combining revealed and stated preference methods for valuing environmental amenities. Journal of Environmental Economics and Management, 26(3), 271-292.
Agago, T., Woldie, M., Ololo. S. (2014). Willingness to join and pay for the newly proposed social health insurance among teachers in Wolaita Sodo Town, South Ethiopia. Ethiopian Journal of Health Science, 23(3), 195 – 202.
Ahmad, S. N. B., Juhdi, N. (2010). Organic Food: A study on demographic characteristics and factors influencing purchase intentions among consumers in Klang Valley, Malaysia. International Journal of Business and Management, 5(2), 105.
Aizuddin, A.N., Sulong, S., & Aljunid S.M. (2012). Factors influencing willingness to pay for healthcare. In BMC Public Health, (Vol. 12, No. S2, p. A37). BioMed Central.
Alderman, H., Lavy, V. (1996). household responses to public health services: cost and quality tradeoffs. The World Bank Research Observer, 11(1), 3-22.
Allen, J. E., Davis, A. F., Hu, W., & Owusu-Amankwah, E. (2015). Residents’ willingness-to-pay for attributes of rural health care facilities. The Journal of Rural Health, 31(1), 7–18.
Alpizar, F., Carlsson, F., & Martinsson, P. (2003). Using choice experiments for non-market valuation. Economic Issues-Stoke On Trent, 8(1), 83-110.
Álvarez-Farizo, B., Hanley, N., & Barberán. R., (2001). The value of leisure time: a contingent rating approach. Journal of Environmental Planning and Management 44(5), 681-699.
Andersen, R. M. (1995). Revisiting the behavioral model and access to medical care: does it matter? Journal of Health and Social Behavior, 1-10.
Andersen, R., & Newman, J. F. (2005). societal and individual determinants of medical care utilization in the United States. Milbank Quarterly, 83(4), Online-only.
Anderson, T.J., Saman D.M., Lipsky M.S., Nawal Lutfiyya M. (2015). A cross-sectional study on health differences between rural and non-rural U.S. counties using the County Health Rankings. BMC Health Service Research, 15(1), 441
Applebaum, R., Straker, J., Geron. S. (1999). Assessing satisfaction in health and long-term care: practical approaches to hearing the voices of consumers. Springer Publishing Company.
Archana, R., Kar, S. S., Premarajan, K., & Lakshminarayanan, S. (2014). Out of pocket expenditure among the households of a rural area in Puducherry, South India. Journal of Natural Science, Biology, and Medicine, 5(1), 135–138.
Asselin, A. M. (2005). Eggcentric behavior - consumer characteristics that demonstrate greater willingness to pay for functionality. American Journal of Agricultural Economics, 87(5), 1339-1344.

100
Baji, P., Pavlova, M., Gulacsi, L., & Groot, W. (2012). Preferences of Hungarian consumers for quality, access and price attributes of health care services – results of a discrete choice experiment. Society and Economy, 34(2), 293-311.
Banerjee, A., Deaton, A., Duflo, E. (2004). Health, healthcare and economic development: wealth, health, and health services in rural Rajasthan. The American Economic Review, 94(2), 326 – 330.
Bayoumi, A. (2004). The measurement of contingent valuation for health economics, PharmacoEconomics, 22(11), 691 – 700.
Becker G. (2001). Effects of being uninsured on ethnic minorities’ management of chronic illness. Western Journal of Medicine, 175(1), 19–23.
Bellhouse, A., Malcom B., Griffith G., & Dunshea, F. (2010). Australian consumers’ willingness to pay and willingness to purchase a hypothetical lower cholesterol pork product. Australasian Agribusiness Review, 18, 161-192.
Ben-Akiva, M., Bolduc, D., & Bradley, M. (1993). Estimation of travel choice models with randomly distributed values of time. Transportation Research Record, 1413, 88-97.
Ben-Akiva, M., Bolduc, D. (1996). Multinomial probit with a logit kernel and a general parametric specification of the covariance structure. Preliminary, Department of Civil and Environmental Engineering, MIT.
Bhat, Chandra R. (1998). Accommodating variations in responsiveness to level-of-service measures in travel mode choice modeling. Transportation Research Part A: Policy and Practice, Elsevier, 32(7), 495-507.
Breidert, C., Hahsler, M., & Reutterer. T. (2006). A review of methods for measuring willingness-to-pay. Innovative Marketing, 2(4), 8-32.
Bridges, J. F. (2002). Stated preference methods in health care evaluation: an emerging methodological paradigm in health economics. Applied Health Economics and Health Policy 2(4), 213-224.
Cabinet for Health and Family Services, (2013). Fact sheet on ACA and Medicaid expansion. http://migration.kentucky.gov/nr/rdonlyres/611A39A2-740F-45C2-B715-2F36F3C6AC96/303412/PDFFactSheetonMedicaidExpansion5913.pdf, accessed 11/08/17.
Cameron, T. A., Poe, G. L., Ethier, R. G., & Schulze, W. (2002). Alternative non-market value-elicitation methods: are the underlying preferences the same? Journal of Environmental Economics and Management 44(3), 391-425.
Carlsson, F., Frykblom P. & Lagerkvist, C. J. (2007). Consumer benefits of labels and bans on GM foods – choice experiments with Swedish consumers. American Journal of Agricultural Economics, 89(1), 152-61.
Carson, R. T. (2000). Contingent valuation: a user's guide. Environmental Science & Technology.

101
Centers for Medicare and Medicaid Services. National Health Expenditure Data; Historical. Last modified 08/09/2016, 8:00am. Accessed 09/13/2017 , https://www.cms.gov/Research-Statistics-Data-and-Systems/Statistics-Trends-and-Reports/NationalHealthExpendData/NationalHealthAccountsHistorical.html
Champ, P. A., Boyle, K. J., Brown, C. B. (2003). A Primer on Nonmarket Valuation. Kluwer Academic Publishers.
Colombo, S.J., Calatrava-Requena, J., & Hanley, N. (2007). Testing choice experiment for benefit transfer with preference heterogeneity. American Journal of Agricultural Economics, 89(1), 135-51.
Davis, Alison (2012). 2012 Kentucky Healthcare Market Report. Lexington, KY: Community and Economic Development Initiative of Kentucky, University of Kentucky College of Agriculture.
Diener, A., O'Brien, B., & Gafni, A. (1998). Health Care Contingent Valuation Studies: A Review and Classification of the Literature. Health Economics, 7(4), 313-326.
Dillman, D.A., Phelps, G., Tortora, R., Swift, K., Kohrell, J., & Berck, J. (2009). Response Rate and Measurement Differences in Mixed-Mode Surveys Using Mail, Telephone, Interactive Voice Response (IVR) and the Internet. Social Science Research, 38(1),1-18.
District of Columbia, Department of Health, Medically Underserved Areas/Populations, http://doh.dc.gov/service/medically-underserved-areas-populations, accessed 6:00pm 15th May 2014.
Donfouet, P. P. H., Makaudze, E.M., Mahieu. P., Malin, E. (2011). The determinants of the willingness-to-pay for community-based prepayment scheme in rural Cameroon. International Journal of Health Care Finance and Economics, 11(3), 209-220.
Donfouet, P. P. H., Makaudze, E. M. (2011), The economic value of the willingness to pay for a community-based prepayment scheme in rural Cameroon. International Labor Office, Research Paper No. 3.
Douthit, N., Kivac, S., Dwolatzky, T., Biswas, S. (2015). Exposing some important barriers to health care access in the rural USA. Public Health, 129, 611-620.
Eberhardt, M. S., Pamuk, E. R. (2004). The Importance of place of residence: examining health in rural and non-rural areas. American Journal of Public Health, 94(10), 1682-1686.
Forbis, J. L., & Nitin T. M. (1981). Value-based strategies for industrial products. Business Horizons, 24(3), 32-42.
Gafni, A. (1991), Willingness-to-Pay as a measure of benefits: relevant questions in the context of public decision-making about health care programs, Medical Care, 29(12), 1246 – 1252.
Gil, J.M., Gracia A., & Sanchez M. (2001). Market Segmentation and willingness to pay for organic products in Spain. International Food and Agribusiness Management Review, 3(2), 207 – 226.

102
Haab, T. C., McConnell, K. E. (2002). Valuing environmental and natural resources: the econometrics of non-market valuation. Edward Elgar Publishing.
Health Policy Institute (2014). Rural and Urban Health. Georgetown University. accessed May 2014 https://hpi.georgetown.edu/agingsociety/pubhtml/rural/rural.html
Herring, B. (2005). The effect of the availability of charity care to the uninsured on the demand for private health insurance. Journal of Health Economics, 24(2), 225-252.
Hing, E., and Hsiao, C. (2012). US Department of Health and Human Services. State Variability in Supply of Office-based Primary Care Providers: United States 2012. NCHS Data Brief, No. 151, May 2014.
Holmes, G.M., Slifkin, R.T., Randolph, R.K., Poley, S., (2005). The effect of rural hospital closures on community economic health. Health Services Research, 41(2), 467-485.
Hu, W., Veeman, M.M., & Adamowicz, W.L. (2005). Labelling genetically modified food: heterogenous consumer preferences and the value of information. Canadian Journal of Agricultural Economics, 53(1), 83-102.
Hummer, R.A., Pacewicz, J., & Wang, S., Collins, C. (2004). Health insurance coverage in non-metropolitan America. Critical Issues in Rural Health, Blackwell Publishing.
Ionescu-Ittu, R., McCusker, J., Ciampi, A., Vadeboncoeur, A. M., Roberge, D., Larouche, D., & Pineault, R. (2007). Continuity of primary care and emergency department utilization among elderly people. Canadian Medical Association Journal, 177(11), 1362-1368.
Johnston, R.J., Rolfe. J., Rosenberger, R., Brouwer., R. (2015). Benefit transfer of environmental resource values: A guide for researchers and practitioners. The Economics of Non-Market Goods and Resources.
Kaiser Family Foundation, (2014). Healthcare expenditures per capita by State of residence, https://www.kff.org/other/state-indicator/health-spending-per-capita/?currentTimeframe=0&sortModel=%7B%22colId%22:%22Location%22,%22sort%22:%22asc%22%7D, accessed 4pm, December 3rd, 2015.
Kennedy, P. (2008). A guide to modern econometrics. Blackwell Publishing, Oxford.
Kentucky Health Benefit Exchange. Kentucky health care workforce capacity visualization tool. Deloitte. Accessed July 3rd, 2014. https://tableaui.deloitte.com/views/KYCapStudyVisualizationTool4_2_13vFINAL2_0/READFIRST#1.
Klose, T. (1999), The contingent valuation method in health care, Health Policy, Vol 47(2), 97 – 123.
Lancaster, K. (1966). A new approach to consumer theory. Journal of Political Economy, 74(2), 132-157.
Lang, H. C. (2010). Willingness to pay for lung cancer treatment. Value in Health, 13(6), 743-749.
103
Laura Ungar (2014). Nurse Practitioners fight for more independence, USA Today, August 19th 2014. http://www.usatoday.com/story/news/nation/2014/08/18/nurse-practitioner-independence-laws/13470733/, accessed December 2014.
Lenardson JD, Ziller EC, Coburn AF, Anderson N. (2009). Profile of Rural Health Insurance Coverage: A Chartbook. Portland, ME: University of Southern Maine, Muskie School of Public Service, Maine Rural Health Research Center.
Lee. W., Jiang. L., Phillips C., & Ohsfeldt R., (2014). Rural-urban differences in health care expenditures: empirical data from U.S. households. Advances in Public Health.
Lin, P. J., Cangelosi, M. J., Lee, D. W., & Neumann, P. J. (2013). Willingness to pay for diagnostic technologies: a review of the contingent valuation literature. Value in Health, 16(5), 797-805.
Lofgren, C., Thanh, N., Chuc, N., Emmelin, A., & Lindholm, L. (2008). People’s willingness to pay for health insurance in rural Vietnam, Cost Effectiveness and Resource Allocation, 6(1), 16.
Lorenzoni, L., Belloni, A., & Sassi, F. (2014). Health-care expenditure and health policy in the USA versus other high-spending OECD countries. The Lancet, 384(9937), 83-92.
Louviere, J.J., Hensher, D.A., & Swait, J.D. (2000). Stated choice methods: analysis and application. Cambridge University Press, Cambridge, UK.
Mathiyazaghan, K. (1998), Willingness to pay for rural health insurance through community participation in India, The International Journal of Health Planning and Management, 13(1), 47 – 67.
Martín-Fernández, J., del Cura-González, M. I., Gómez-Gascón, T., Oliva-Moreno, J., Domínguez-Bidagor, J., Beamud-Lagos, M., & Pérez-Rivas, F. J. (2010). Differences between willingness to pay and willingness to accept for visits by a family physician: a contingent valuation study. BMC Public Health, 10(1), 236.
McFadden, D. (1974). Conditional logit analysis of qualitative choice behavior. Frontiers in Econometrics, 105-142, Academic Press: New York.
Merino-Castello, A. (2003). Eliciting consumers’ preferences using stated preference discrete choice models: contingent ranking versus choice experiment. UPF Economics and Business working paper No. 705.
Morey, E., Rossman, K.G., & Chestnut, L.G., (2002). Modeling and estimating willingness to pay for reducing acid deposition injuries to cultural resources: using choice experiments in a group setting to estimate passive-use values. Valuing Cultural Resources. Edward Elgar Publishing
Newkirk V. R. II and Damico A. (2014). The Affordable Care Act and Insurance Coverage in Rural Areas. Kaiser Commission on Medicaid and the Uninsured. Kaiser Family Foundation. https://www.kff.org/uninsured/issue-brief/the-affordable-care-act-and-insurance-coverage-in-rural-areas/. Accessed November 8th 2017.

104
O’Toole, M. (2011), Rural Americans face greater lack of healthcare access, Reuters, http://www.reuters.com/article/2011/07/27/us-rural-idUSTRE76Q0MJ20110727, Reuters, July 27th, 2011; accessed 12/16/13.
Ona, L., Davis, A. (2011). Economic Impact of the Critical Access Hospital Program and Kentucky’s Communities, Journal of Rural Health, 27(1), 21-28.
Pavel, M. S., Chakrabarty, S., & Gow, J. (2017). Assessing willingness to pay for health care quality improvements. BMC Health Services Research, 15(1), 43.
Pearce, D., Ozdemiroglu, E., & Britain, G. (2002). Economic valuation with stated preference techniques: summary guide. Department for Transport, Local Government and the Regions.
Peterson, H. H., Hustvedt G., Chen Y. (2008). US consumers’ willingness to pay for wool product attributes, Selected paper prepared for presentation at the SAEA Annual Meeting, Dallas, TX Feb 6-10, 2008.
Phelps, C. E. (1992). Health economics, Harper Collins.
Phelps, C. E. (2017). Health economics. Routledge.
Portney, P. R. (1994). The contingent valuation debate: why economists should care. The Journal of Economic Perspectives, 8(4), 3-17.
Revelt, D., Train, K. (1994). Mixed logit with repeated choices: households’ choices of appliance efficiency level, The Review of Economics and Statistics, 80(4), 647-657.
Ricketts, T. C. (2000). The changing nature of rural health care. Annual Review of Public Health, 21(1), 639-657.
Robinson, J., & Guidry, J. J. (2001). Recruiting, training, and retaining rural health professionals. In Handbook of rural health (pp. 337-353). Springer, Boston, MA.
Rosenstock, I. M. (1966). Why people use health services. The Milbank Memorial Fund Quarterly, 44(3), 94-127.
Rural Health Information Hub, formerly - Rural Assistance Center (2016). Federally Qualified Health Centers Frequently Asked Questions [Web page]. Available at: http://www.raconline.org/topics/federallyqualified-health-centers/faqs/#services. Accessed May 31, 2016.
Rural Health Information Hub, formerly - Rural Assistance Center (2016). Rural Health Clinics Frequently Asked Questions [Web page]. Available at: http://www.raconline.org/topics/rural-health-clinics/ faqs/#whatis. Accessed July, 2016.
Sagebiel, J. (2011). Comparing the latent class model with the random parameters logit: A choice experiment analysis of highly heterogeneous electricity consumers in Hyderabad, India. Paper presented at the International Choice Modelling Conference, 4-6 July 2011, Leeds, UK.
Schoenberg, N. E., Hatcher J., & Dignan M.B. (2008). Appalachian women's perceptions of their community's health threats. The Journal of Rural Health, 24(1), 75-83.

105
Sibley, L. M. and Weiner, J. P. (2011). An evaluation of access to health care services along the rural-urban continuum in Canada. BMC Health Services Research, 11(1), 20.
Skillman, S. M., Doescher, M. P., Mouradian, W. E. and Brunson, D. K. (2010). The challenge to delivering oral health services in rural America. Journal of Public Health Dentistry, 70(s1), 49–57.
State Health Access Data Assistance Center (2013). “State Estimates of the Low-income Uninsured Not Eligible for the ACA Medicaid Expansion.” Issue Brief #35. Minneapolis, MN: University of Minnesota. Available at: http://www.rwjf.org/content/dam/farm/reports/issue_briefs/2013/rwjf404825.
Train, K. (2003). Discrete Choice Methods with Simulation. Cambridge University Press. Cambridge, U.K.
Train, K., McFadden, D., Goett, A. (1978) Consumer attitudes and voluntary rate schedules for public utilities. Review of Economics and Statistics, 69(3), 383-391.
US Census Bureau, American Community Survey, (2008-2012). American Community Survey 5-year Estimates. “Age and Sex”. American FactFinder. www.factfinder2.census.gov, accessed July 3rd 2014.
US Department of Agriculture, Economic Research Service. 2003 Rural-Urban Continuum Codes. Available at: http://www.ers.usda.gov/data-products/rural-urbancontinuum-codes.aspx#.UyDFe4Wa-yY. Retrieved March 10, 2014.
U.S. Department of Health and Human Services, Health Services Resources Administration (2014). Health Professional Shortage Area. http://bhpr.hrsa.gov/shortage/hpsas/designationcriteria/designationcriteria.html, accessed 3:00pm 15th May 2014.
U.S. Dept. of Health and Human Services, Health Services Resources Administration (2014). What are Rural Health Clinics? http://www.hrsa.gov/healthit/toolbox/RuralHealthITtoolbox/Introduction/ruralclinics.html, accessed 7:30pm May 15, 2014.
Venkatachalam, L(2004). The contingent valuation method: a review. Environmental Impact Assessment Review, 24(1), 89-124.
Verbeek, M. (2004). An introduction to linear regression; a guide to modern econometrics, Wiley and Sons Ltd.
Vincent, J.W., Hagen, D.A., Welle, P.G., Swanser, K. (1995). Passive use values of public forestlands: a survey of the literature. University of St. Paul, Department of Economics. St. Paul, MN.
Wallace, R. B., Grindeanu, L. A., & Cirillo, D. J. (2004). Rural/urban contrasts in population morbidity status. Critical issues in rural health, 15(1), 26.
Wellever, A., Glasgow, N., Morton, L. W., & Johnson, N. E. (2004). Networking in rural health. Critical Issues in Rural Health. Iowa: Blackwell Publishing, 225-236.

106
Wooldridge, J. M. (1999). Introductory Econometrics: A Modern Approach Stamford. CT: Thomson Learning.
Yammarino F.J., Skinner S.J., Childers T.L. (1991). Understanding mail survey response behavior: a meta-analysis. Public Opinion Quarterly, 55(4), 613-639.
Zimmerman, M. K., McAdams, R., & Halpert, B. P. (2004). Funding health services in the rural United States: Federal policies and local solutions. Critical issues in rural health, 211, 224.

Curriculum Vitae
EMMANUEL OWUSU-AMANKWAH
EDUCATION
University of Cincinnati, Cincinnati, OH Doctor of Pharmacy Degree: April 2017 University of Kentucky, Lexington, KY Candidate for Master’s Degree: May 2018 Amherst College, Amherst, MA Bachelor of Arts Degree: May 2010 Major: Economics. Certificates: Financial Accounting; Culture, Health and Science United World College of the American West, Montezuma, New Mexico International Baccalaureate Diploma: May 2006
LICENSES
Ohio Pharmacist License # 03337692 Kentucky Pharmacist License # 019677
PUBLICATIONS Allen, J.E., Davis, A., Hu, W., Owusu-Amankwah, E. (2015), Residents’ Willingness-to-Pay for Attributes of Rural Health Care Facilities. The Journal of Rural Health, 31: 7–18. Allen J.E. IV, Bowker, S.F., Stamper, C.E., Owusu-Amankwah, E., Davis, A. (2014), Resident Valuation of Kentucky's Extension Fine Arts Program. Journal of Extension, Volume 52, Number 2.
CURRENT RESEARCH
Master’s Thesis research on, “Willingness-to-Pay for Attributes of Health Care Facilities in Rural Kentucky Considering Residents’ Individual-Specific Characteristics”
RELEVANT WORK AND VOLUNTEER EXPERIENCE
Graduate Intern, Rite Aid Pharmacy, Cincinnati, OH January 2017 – January 2018 Volunteer, UC Open School Clinic, St. Vincent De Paul Food Bank, Cincinnati, OH August 2012 – April 2017 Volunteer, Drop Inn Shelter, Cincinnati, OH August 2012 – April 2017 Pharmacy Intern, CVS Pharmacy, Cincinnati, OH October 2013 – January 2015 Teaching Assistant, University of Kentucky, Lexington, KY May 2012 – December 2013

Research Assistant, University of Kentucky, Lexington, KY Jan 2012 – December 2013 Volunteer, Food Not Bombs, Memphis, TN July 2010 – June 2011 Language Assistant, Five College Supervised Independent Language Program, UMASS, Amherst Sept 2009 – May 2010
Field Assistant, Intervention Forum, Adenta, Ghana June – August 2009 Laboratory Assistant, Amherst College, Amherst, MA August 2008
Assistant to Director of Clinical Services, Tapestry Health, Florence, MA June – July 2008
Volunteer Tutor, Osu Children’s Orphanage Home, Accra, Ghana 23rd December 2007 - 26th January 2008 Student Assistant, Amherst College Archives and Special Collections, Amherst College May 2007 – September 2007
Coordinator, African Scholars Program, Five Colleges, M.A September 2007 – May 2010 IT Student Supervisor, Seeley Mudd Computer Center, Amherst College September 2006 – May 2010 Volunteer Tutor, Achimota School, Accra, Ghana May – July 2006
OTHER WORK AND VOLUNTEER EXPERIENCE
Care Giver, Close to Home and Bluegrass Connection/ Independent Opportunities, Lexington, KY Oct 2012 - Oct 2013
Safe Ride Driver and Student Security Monitor, Campus Police, Amherst College September 2006 – May 2010 Lobby Attendant, Mead Art Museum, Amherst College September 2006 – May 2010 Volunteer, Columbus House Inc, New Haven, CT July 2005 – August 2005 Volunteer, Las Vegas Recycling Plant, NM. September 2005 – May 2006 Volunteer, Habitat for Humanity, Santa Fe, NM. September 2005 – May 2006 Fitness Room Attendant, Amherst, MA, and at Montezuma, NM. September 2004 – May 2008

Digitizing Assistant, Amherst College Academic Technology Services, Amherst College October 2006 - May 2007
Tour guide, United World College, Montezuma NM, September 2005 – May 2006
LEADERSHIP SKILLS
Team Co-Captain, Innovative Pharmacy Business Plan April 2016 Board Member, Christian Students at UC, University of Cincinnati, Cincinnati, Ohio June 2015- April 2017 Board Member, Christians On Campus, University of Kentucky, Lexington, KY January 2012 – May 2015 Treasurer, PIWC Christian group, Lexington, KY May 2012 - May 2013 Orientation Leader, Amherst College, Amherst, MA March 2007 – May 2010
Board Member, Future Leaders of Ghana Program, Amherst, MA September 2007 – Present Captain of Intramural Soccer and Basketball Teams, Amherst College, MA September 2006 – May 2010 Entrepreneur, AfroCar; AfroWear Accra, Ghana. June 2006 – Present
AWARDS/HONORS
Awarded $500 for Second place team in Innovative Pharmacy Business Plan Competition April 2016 Awarded $1000 Plough Scholarship, UC College of Pharmacy, OH August 2015 Awarded $1500 Plough Scholarship, UC College of Pharmacy, OH June 2014 Awarded $6000 Fellowship for Graduate Education, Amherst College, MA 04/2014 Awarded $5900 Fellowship for Graduate Education, Amherst College, MA 04/2013 Awarded $3900 Fellowship for Graduate Education, Amherst College, MA 04/2012 Awarded $3000 Fellowship for Action, Amherst College, Amherst, MA 05/2009 Awarded $3500 Fellowship Amherst College, Amherst, MA 05/2008 Awarded $1200 Fellowship For Action Award, Amherst College, MA November 2007

Young Entrepreneur Award, National Foundation for Teaching Entrepreneurship, N.Y April 2006 First Runner up Team, New Mexico State’s Science Knowledge Bowl/ Science Olympiad, Albuquerque, N.M Feb 2006 National champions in Science and Mathematics Quiz competition April 2004 United World College representative for Ghana April 2004
Organizations
Member, Student National Pharmaceutical Association (SNPhA), UC Chapter. August 2013 – August 2017 Member, American College of Clinical Pharmacology (ACCP), UC Chapter. August 2015- August 2017 Member, Student Societies of Health System Pharmacy, (SSHP), UC Chapter. August 2015- August 2017
POSTER PRESENTATIONS 2016 Student Poster Presentation entitled, “PCOS, Obesity, Hypertension, Hyperlipidemia…, so managing weight”. UC College of Pharmacy, Cincinnati, Ohio. 2014 Student Poster Presentation entitled, “Managing PCOS in a 52 year old Caucasian Female”. UC College of Pharmacy, Cincinnati, Ohio. 2017 Student Poster Presentation entitled, “Willingness to pay for healthcare facility attributes in Rural Kentucky based on individual characteristics”. UC College of Pharmacy, Cincinnati, Ohio.
SKILLS
Health: First Aid, CPR and AED certified Computer: Used Stata and SAS for Master’s Thesis data analysis. Provided campus IT support in college (2006-2010). Java Programming Certified (2003). Languages: Twi (Ghana), English. Studied Spanish, Ewe (Ghana), German and French.