willis limited · s ummary protection and indemnity | market review 2011/2012 3 summary mixed...
TRANSCRIPT
PROTECTION AND INDEMNITY
MARKET REVIEW 2011/2012
Willis Limited
The Willis Building51 Lime StreetLondon, EC3M 7DQUnited KingdomTel: +44 (0)20 3124 6000
www.willis.com
Willis Limited, Registered number: 181116 England and Wales.Registered address: 51 Lime Street, London, EC3M 7DQ.A Lloyd’s Broker. Authorised and regulated by the Financial Services Authority.
10077/12/11
PROTECTION AND INDEMNITY | M
ARKET REVIEW 2011/2012
10077_REPORT_P&I REVIEW 2011_Cover.indd 1 19/12/2011 12:46:15
Summary 02
market Financial commentary 04
reinSurance and Pooling 14 – Changes in International Group Reinsurance at February 20, 2011 15 – Pool and Retention Development 19 – Pool Results - Prospects for the Future 20 – Expectations for the Reinsurance Renewal at February 20, 2012 21
general increaSeS 22
releaSe callS 26
club Financial PageS 32– Introduction to Club Pages 33– American Club 36– Britannia 38– Gard 40– Japan P&I Club 42– London Steam-Ship 44– North of England Club 46– Shipowners 48– Skuld 50– Standard (Bermuda) 52– Steamship 54– UK P&I Club 56– West of England 58– Liverpool & London 60– The Swedish Club 61
deFerred call HiStory 62– Historic Deferred (Supplementary) Call Accuracy 63– Future Trends 66– Comparison of Original and Actual Supplementary Calls 70– Percentage Variation from Initial Estimated Total Call 72
average exPenSe ratio (aer) 76
tHe non-international grouP P&i market 80
contactS 94
contents
sUM
MAR
Y
Protection and Indemnity | Market Review 2011/2012 3
Summary
MIXeD MessAGes The financial results for the Protection and Indemnity (P&I) market in the 2010/11 financial year were the strongest ever recorded. Total market free reserves stood at their highest level, some 22.7% higher than the previous year. This increase was driven by a solid investment return, averaging at 6.5% and a 3% overall underwriting surplus, the best underwriting result for the P&I market in living memory.
Against this positive background, the levels of announced general increases are somewhat surprising. Most clubs are seeking 5% increases, with additional increases in deductibles. The 2012 average increase (4.25%) is actually higher than the 2011 average (3.42%).
The rationale behind these decisions has been the combined effect of the dramatic fall and subsequent fragility of the world equity markets in the second half of 2011, along with increasing claims levels and volatility in the current policy year.
These two factors have produced a climate of apprehension within a number of clubs. With no realistic expectation of anything better than nominal investment returns, the pressure to balance the underwriting result is inevitably increased.
Ship operators by contrast are facing one of the most challenging economic periods in a generation. Ship owners in most sectors are losing money and every operator is looking for any way to save costs. When faced with decisions that potentially affect the survival of their companies, the pressure on a number of ship owners will be at least as great as that on their underwriters. Despite the relatively modest increases proposed therefore, the 2012 renewal has all the early signs of being unexpectedly confrontational.
Ben Abraham, December 2011
WILLIs 2011/12 P&I ReVIeWThis review analyses the financial results of the market in general and each individual club. We comment on the underlying issues and anticipate future trends.
We highlight the disparity between release calls and the deferred call accuracy of the market. Similarly the range of release calls between individual clubs. Despite modest improvement over the last 12 months these continue to be a key barrier to the ease of movement between clubs.
The report directly compares the historical deferred call performance of the market and of each individual club. We also comment on where we expect the most likely future problems and which clubs will outperform the market.
P&I is often viewed as a niche sector of the marine insurance market, but this perception is misleading as the costs involved can be substantial. In a challenging economic environment, the choice of specialist broker is particularly critical to ensure that best value is achieved from this idiosyncratic market.
The difference between individual clubs’ performance is significant and this report only touches on the comparisons. Willis P&I clients have access to more expansive information on request.
sUMMARY
Charles Dickens, A Tale of Two CitiesIt was the best of times, it was the worst of times…
MAR
KET
FINA
NCIA
L CO
MM
ENTA
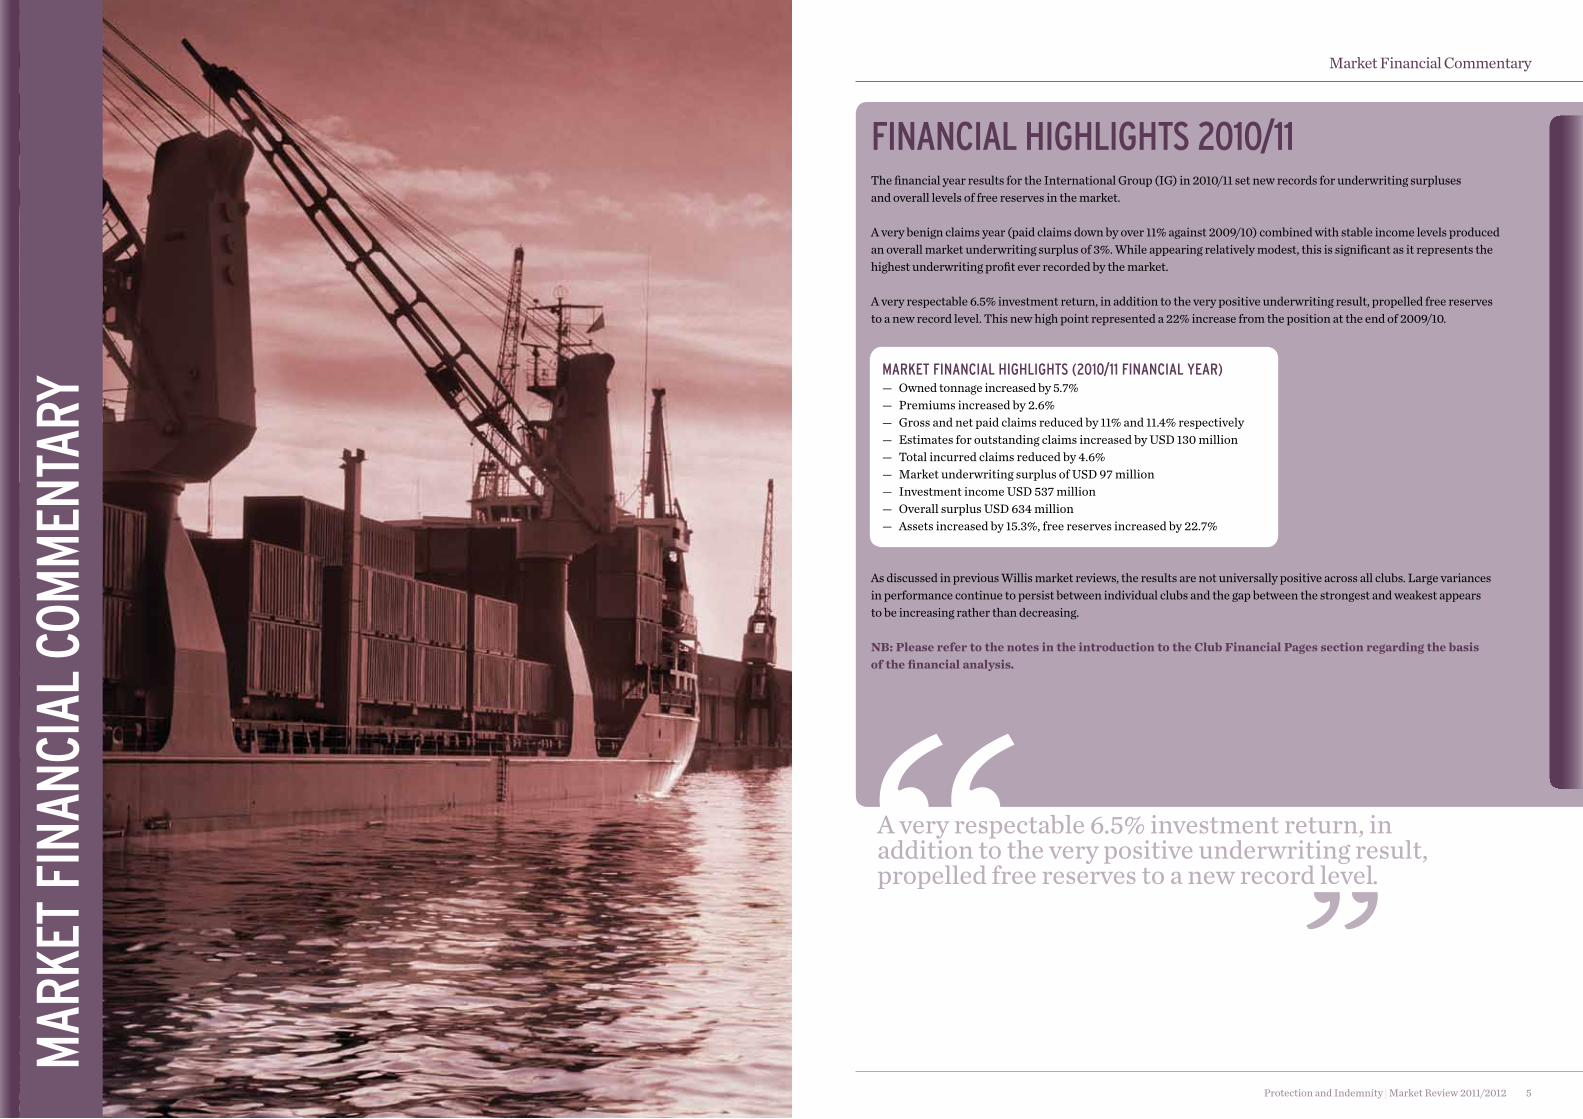
RYFINANCIAL HIGHLIGHTS 2010/11 The financial year results for the International Group (IG) in 2010/11 set new records for underwriting surpluses and overall levels of free reserves in the market.
A very benign claims year (paid claims down by over 11% against 2009/10) combined with stable income levels produced an overall market underwriting surplus of 3%. While appearing relatively modest, this is significant as it represents the highest underwriting profit ever recorded by the market.
A very respectable 6.5% investment return, in addition to the very positive underwriting result, propelled free reserves to a new record level. This new high point represented a 22% increase from the position at the end of 2009/10.
MARKET FINANCIAL HIGHLIGHTS (2010/11 FINANCIAL YEAR)— Owned tonnage increased by 5.7%— Premiums increased by 2.6%— Gross and net paid claims reduced by 11% and 11.4% respectively— Estimates for outstanding claims increased by USD 130 million— Total incurred claims reduced by 4.6%— Market underwriting surplus of USD 97 million— Investment income USD 537 million — Overall surplus USD 634 million — Assets increased by 15.3%, free reserves increased by 22.7%
As discussed in previous Willis market reviews, the results are not universally positive across all clubs. Large variances in performance continue to persist between individual clubs and the gap between the strongest and weakest appears to be increasing rather than decreasing.
NB: please refer to the notes in the introduction to the Club Financial pages section regarding the basis of the financial analysis.
Protection and Indemnity | Market Review 2011/2012 5
A very respectable 6.5% investment return, in addition to the very positive underwriting result, propelled free reserves to a new record level.
Market Financial Commentary
Protection and Indemnity | Market Review 2011/2012 7Protection and Indemnity | Market Review 2011/20126
2010/11 FINANCIAL YEAR RESULTSThe following comments relate to the combined financial year results of the individual clubs in the International Group.
The only club excluded from this analysis is the Swedish Club, which does not report on a like for like basis with the rest of the market. As the Swedish Club represents less than 2.5% of the P&I market, their omission does not affect the overall analysis materially.
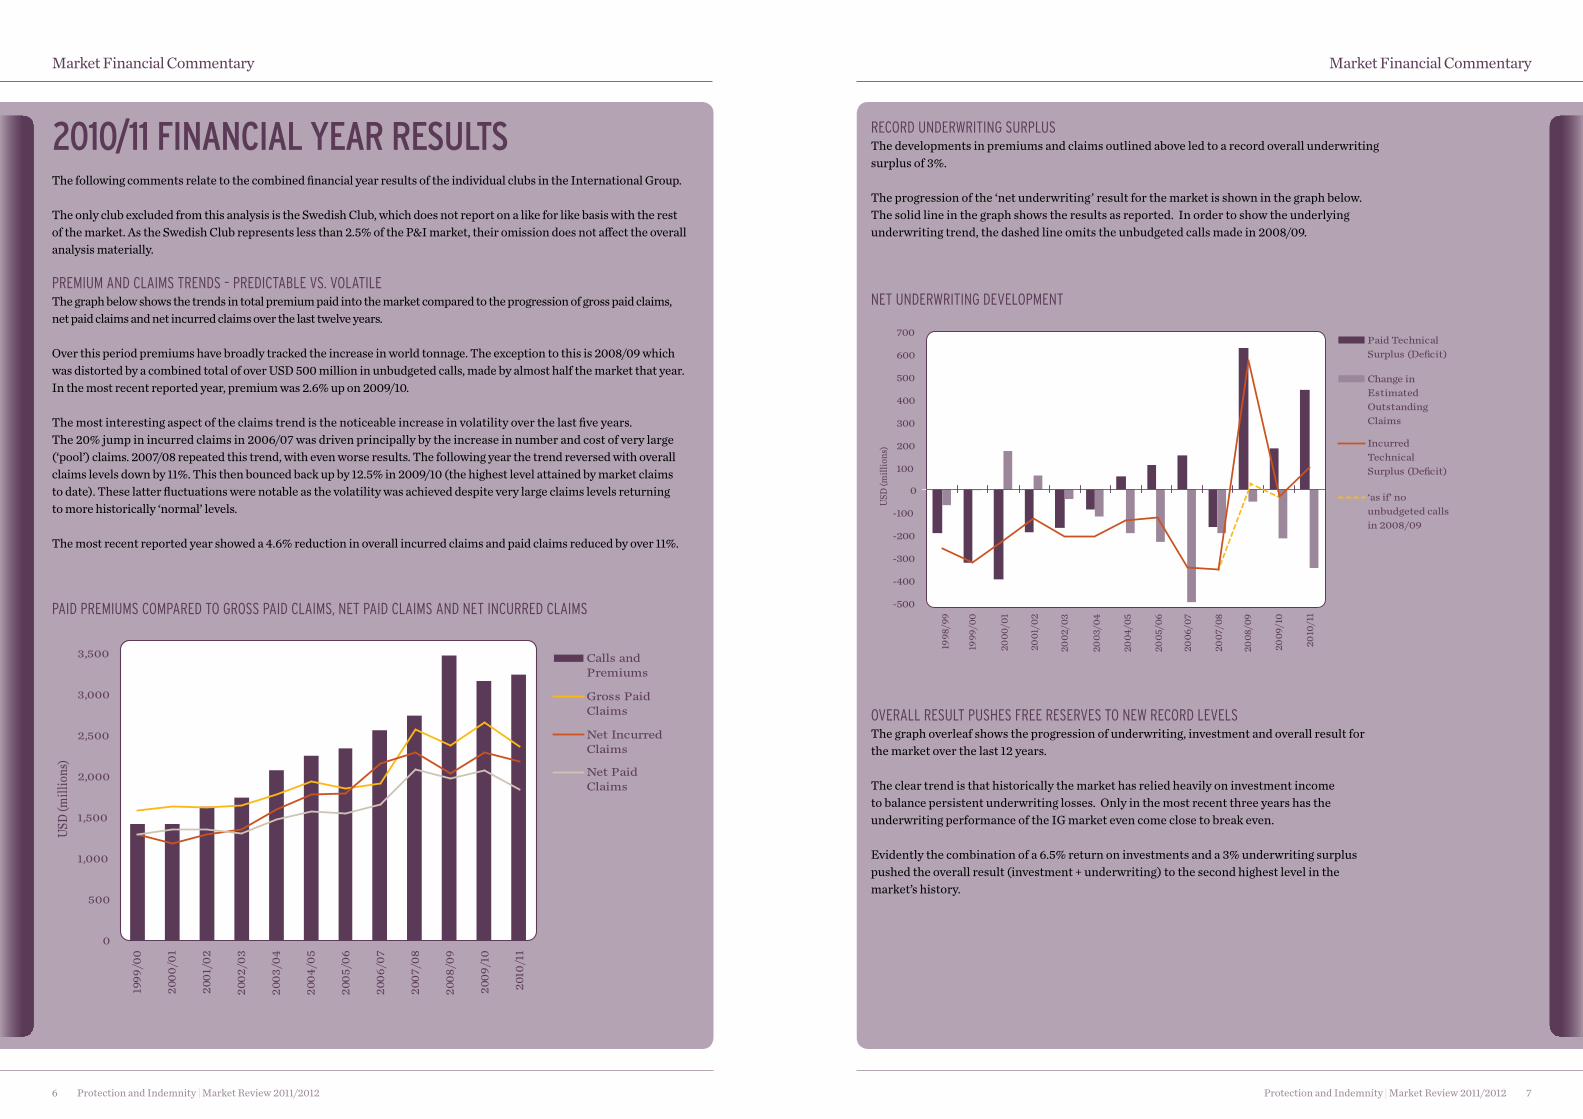
Premium and Claims Trends – PrediCTable vs. volaTile The graph below shows the trends in total premium paid into the market compared to the progression of gross paid claims, net paid claims and net incurred claims over the last twelve years.
Over this period premiums have broadly tracked the increase in world tonnage. The exception to this is 2008/09 which was distorted by a combined total of over USD 500 million in unbudgeted calls, made by almost half the market that year. In the most recent reported year, premium was 2.6% up on 2009/10.
The most interesting aspect of the claims trend is the noticeable increase in volatility over the last five years. The 20% jump in incurred claims in 2006/07 was driven principally by the increase in number and cost of very large (‘pool’) claims. 2007/08 repeated this trend, with even worse results. The following year the trend reversed with overall claims levels down by 11%. This then bounced back up by 12.5% in 2009/10 (the highest level attained by market claims to date). These latter fluctuations were notable as the volatility was achieved despite very large claims levels returning to more historically ‘normal’ levels.
The most recent reported year showed a 4.6% reduction in overall incurred claims and paid claims reduced by over 11%.
reCord underwriTing surPlusThe developments in premiums and claims outlined above led to a record overall underwriting surplus of 3%.
The progression of the ‘net underwriting’ result for the market is shown in the graph below. The solid line in the graph shows the results as reported. In order to show the underlying underwriting trend, the dashed line omits the unbudgeted calls made in 2008/09.
0
500
1,000
1,500
2,000
2,500
3,000
3,500
USD
(mill
ions
)
Calls andPremiums
Gross PaidClaims
Net IncurredClaims
Net PaidClaims
1999
/00
2000
/01
2001
/02
2002
/03
2003
/04
2004
/05
2005
/06
2006
/07
2007
/08
2008
/09
2009
/10
2010
/11
Paid Premiums ComPared To gross Paid Claims, neT Paid Claims and neT inCurred Claims -500
-400
-300
-200
-100
0
100
200
300
400
500
600
700
USD
(mill
ions
)
Paid TechnicalSurplus (Deficit)
Change inEstimatedOutstandingClaims
IncurredTechnicalSurplus (Deficit)
‘as if’ nounbudgeted callsin 2008/09
1998
/99
1999
/00
2000
/01
2001
/02
2002
/03
2003
/04
2004
/05
2005
/06
2006
/07
2007
/08
2008
/09
2009
/10
2010
/11
neT underwriTing develoPmenT
Market Financial Commentary Market Financial Commentary
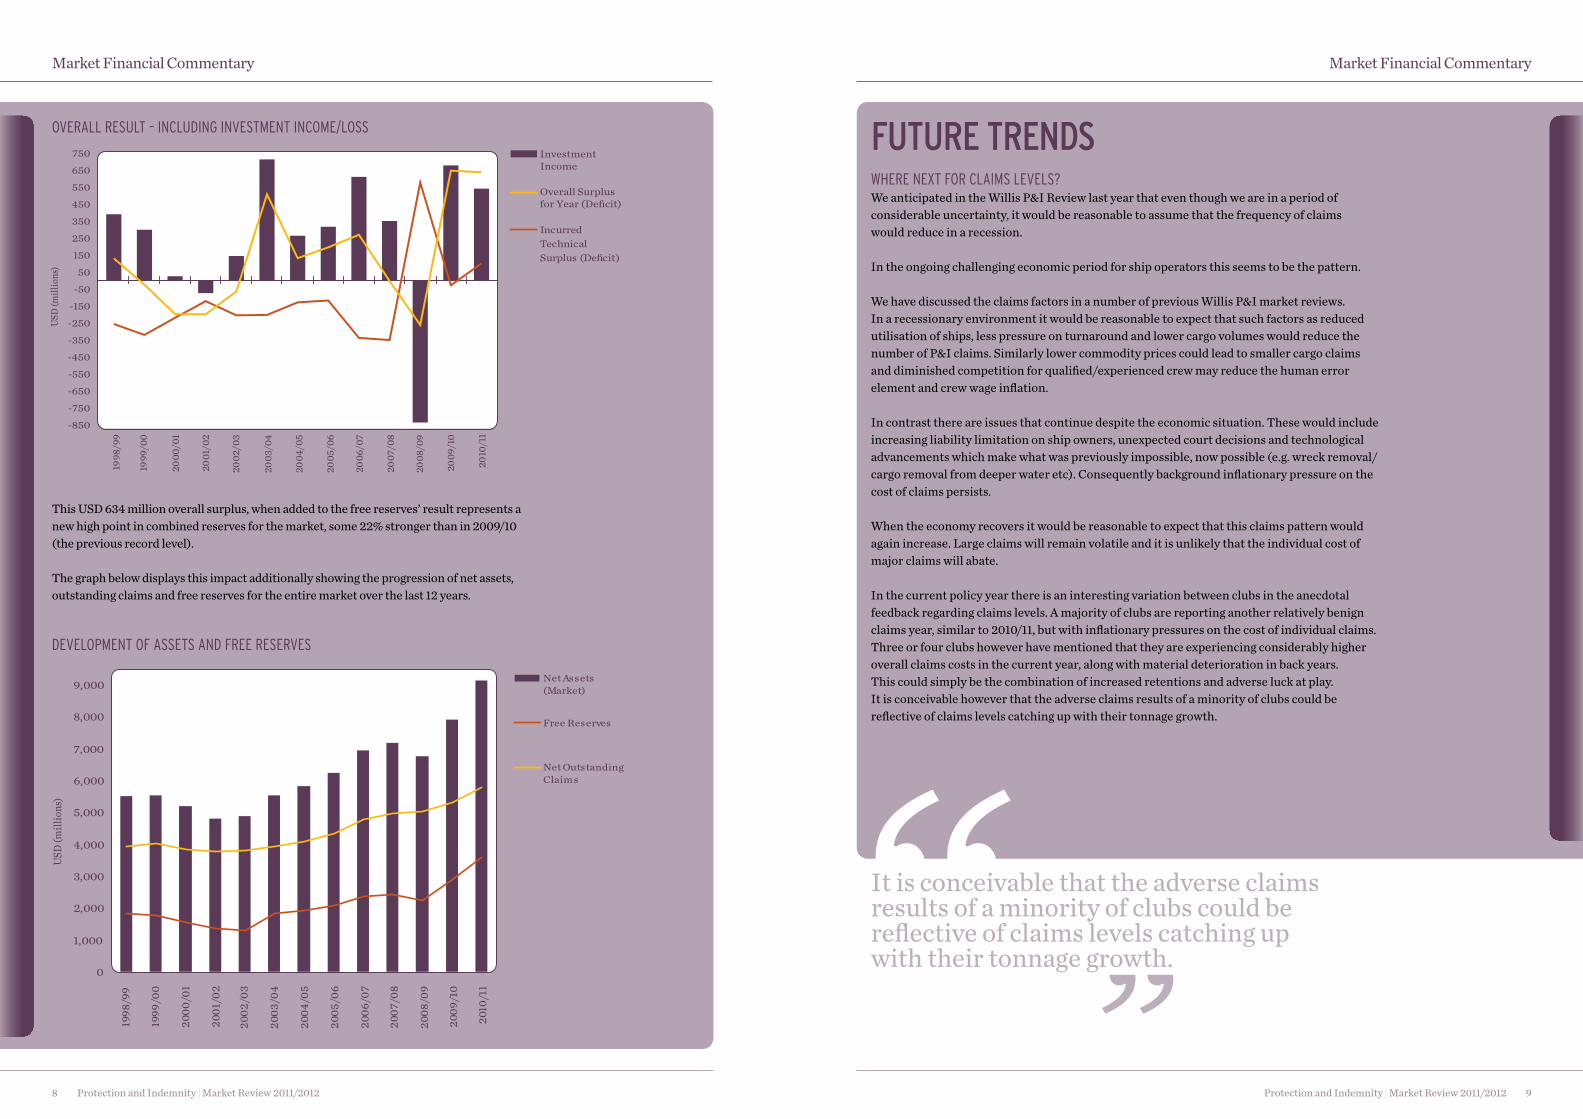
overall resulT Pushes Free reserves To new reCord levels The graph overleaf shows the progression of underwriting, investment and overall result for the market over the last 12 years.
The clear trend is that historically the market has relied heavily on investment income to balance persistent underwriting losses. Only in the most recent three years has the underwriting performance of the IG market even come close to break even.
Evidently the combination of a 6.5% return on investments and a 3% underwriting surplus pushed the overall result (investment + underwriting) to the second highest level in the market’s history.
It is conceivable that the adverse claims results of a minority of clubs could be reflective of claims levels catching up with their tonnage growth.
8 Protection and Indemnity | Market Review 2011/2012 Protection and Indemnity | Market Review 2011/2012 9
overall resulT – inCluding invesTmenT inCome/loss
This USD 634 million overall surplus, when added to the free reserves’ result represents a new high point in combined reserves for the market, some 22% stronger than in 2009/10 (the previous record level).
The graph below displays this impact additionally showing the progression of net assets, outstanding claims and free reserves for the entire market over the last 12 years.
develoPmenT oF asseTs and Free reserves
Market Financial Commentary Market Financial Commentary
FUTURE TRENDSwhere nexT For Claims levels?We anticipated in the Willis P&I Review last year that even though we are in a period of considerable uncertainty, it would be reasonable to assume that the frequency of claims would reduce in a recession.
In the ongoing challenging economic period for ship operators this seems to be the pattern.
We have discussed the claims factors in a number of previous Willis P&I market reviews. In a recessionary environment it would be reasonable to expect that such factors as reduced utilisation of ships, less pressure on turnaround and lower cargo volumes would reduce the number of P&I claims. Similarly lower commodity prices could lead to smaller cargo claims and diminished competition for qualified/experienced crew may reduce the human error element and crew wage inflation.
In contrast there are issues that continue despite the economic situation. These would include increasing liability limitation on ship owners, unexpected court decisions and technological advancements which make what was previously impossible, now possible (e.g. wreck removal/cargo removal from deeper water etc). Consequently background inflationary pressure on the cost of claims persists.
When the economy recovers it would be reasonable to expect that this claims pattern would again increase. Large claims will remain volatile and it is unlikely that the individual cost of major claims will abate.
In the current policy year there is an interesting variation between clubs in the anecdotal feedback regarding claims levels. A majority of clubs are reporting another relatively benign claims year, similar to 2010/11, but with inflationary pressures on the cost of individual claims. Three or four clubs however have mentioned that they are experiencing considerably higher overall claims costs in the current year, along with material deterioration in back years. This could simply be the combination of increased retentions and adverse luck at play. It is conceivable however that the adverse claims results of a minority of clubs could be reflective of claims levels catching up with their tonnage growth.
USD
(mill
ions
)
Investment Income
IncurredTechnicalSurplus (Deficit)
Overall Surplus for Year (Deficit)
1998
/99
1999
/00
2000
/01
2001
/02
2002
/03
2003
/04
2004
/05
2005
/06
2006
/07
2007
/08
2008
/09
2009
/10
2010
/11
-850
-750
-650
-550
-450
-350
-250
-150
-50
50
150
250
350
450
550
650
750
0
1,000
2,000
3,000
4,000
5,000
6,000
7,000
8,000
9,000
USD
(mill
ions
)
Net Assets(Market)
Free Reserves
Net OutstandingClaims
1999
/00
1998
/99
2000
/01
2001
/02
2002
/03
2003
/04
2004
/05
2005
/06
2006
/07
2007
/08
2008
/09
2009
/10
2010
/11
Protection and Indemnity | Market Review 2011/201210 Protection and Indemnity | Market Review 2011/2012 11
invesTmenT inCome dePendenCyInvestment income continues to be a fundamental component to the financial growth of most clubs.
The equity markets in the second half of 2011 have again highlighted the fragility of the current economic environment.
Very aggressive investment strategies in the current year could therefore result in overall investment losses. Conversely those clubs with very conservative strategies will be feeling vindicated by the recent losses in the equity markets.
There is clearly no absolutely right or wrong answer to the investment quandary. Those clubs that de-risked towards the end of 2008/09 realised their losses at the bottom of the market and missed out on considerably higher investment returns in 2009/10 than if they had retained their equity holdings. The de-risked investment portfolios, while unlikely to produce spectacular results, should at least be more predictable.
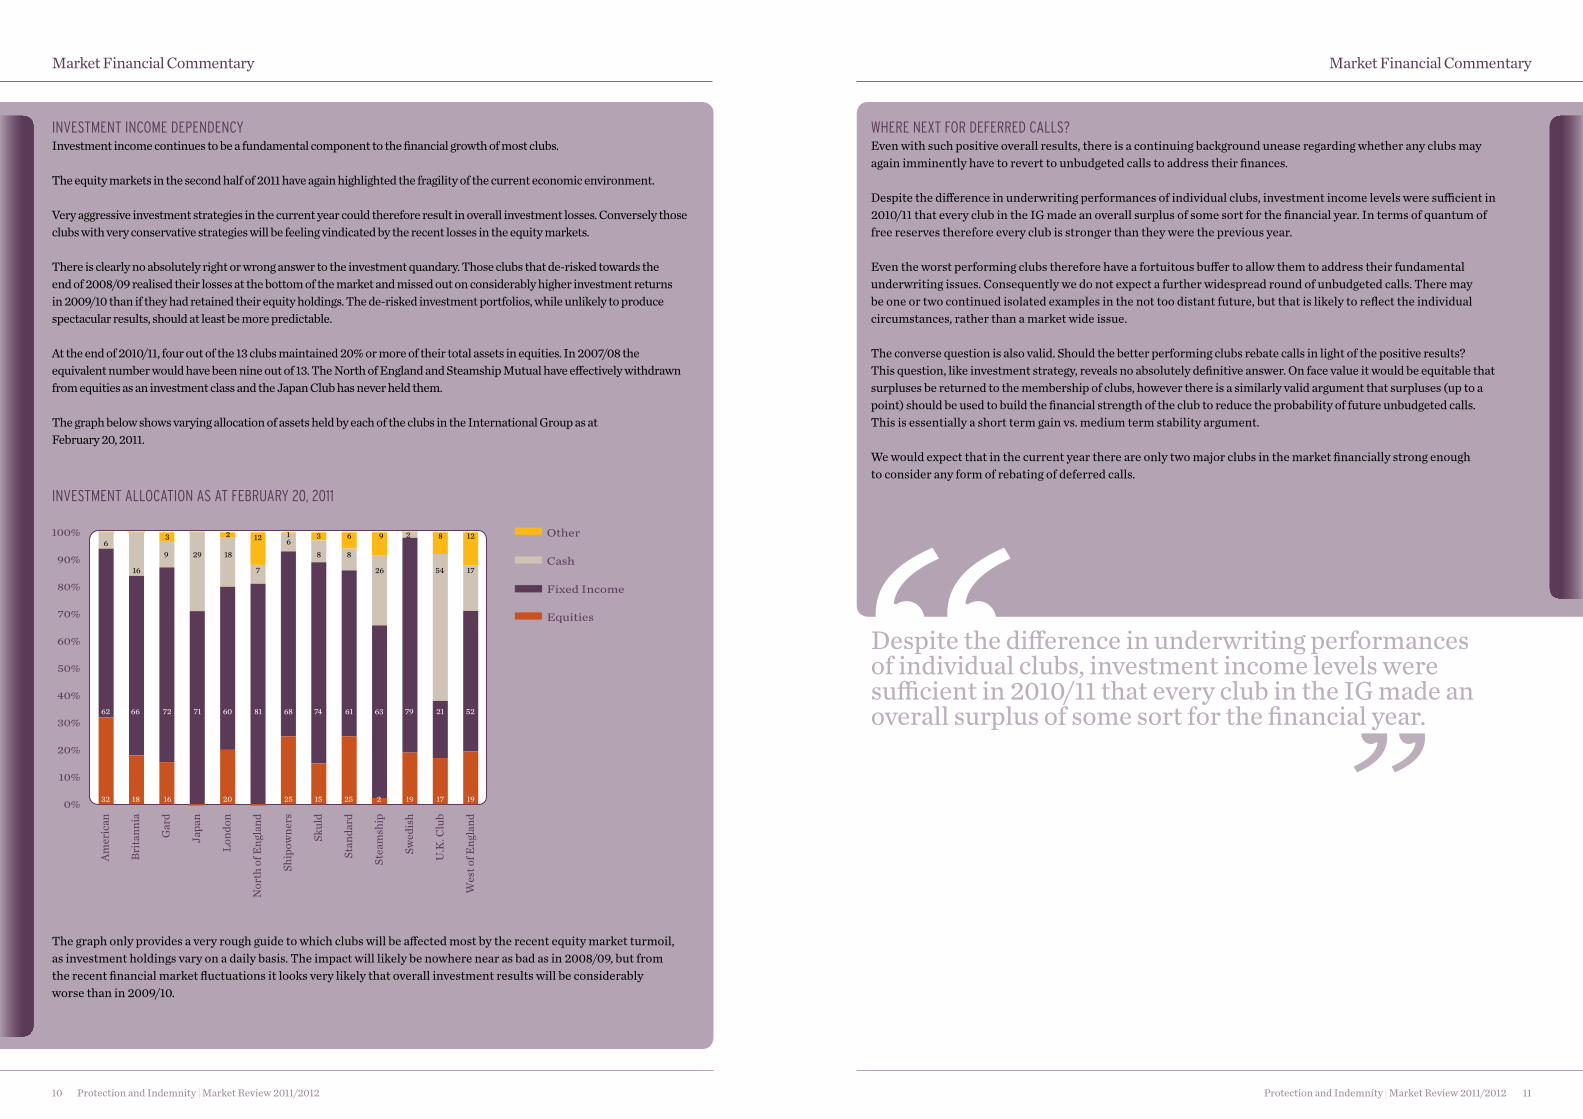
At the end of 2010/11, four out of the 13 clubs maintained 20% or more of their total assets in equities. In 2007/08 the equivalent number would have been nine out of 13. The North of England and Steamship Mutual have effectively withdrawn from equities as an investment class and the Japan Club has never held them.
The graph below shows varying allocation of assets held by each of the clubs in the International Group as at February 20, 2011.
The graph only provides a very rough guide to which clubs will be affected most by the recent equity market turmoil, as investment holdings vary on a daily basis. The impact will likely be nowhere near as bad as in 2008/09, but from the recent financial market fluctuations it looks very likely that overall investment results will be considerably worse than in 2009/10.
Market Financial Commentary Market Financial Commentary
Amer
ican
Brita
nnia
Gar
d
Japa
n
Lond
on
Nor
th o
f Eng
land
Ship
owne
rs
Skul
d
Stan
dard
Stea
msh
ip
Swed
ish
U.K
. Clu
b
Wes
t of E
ngla
nd
Other
Cash
Fixed Income
Equities
32 18 16 20 25 15 25 2 19 17 19
62 66 72 71 60 81 68 74 61 63 79 21 52
0%
10%
20%
30%
40%
50%
60%
70%
80%
90%
100%
invesTmenT alloCaTion as aT February 20, 2011
where nexT For deFerred Calls?Even with such positive overall results, there is a continuing background unease regarding whether any clubs may again imminently have to revert to unbudgeted calls to address their finances.
Despite the difference in underwriting performances of individual clubs, investment income levels were sufficient in 2010/11 that every club in the IG made an overall surplus of some sort for the financial year. In terms of quantum of free reserves therefore every club is stronger than they were the previous year.
Even the worst performing clubs therefore have a fortuitous buffer to allow them to address their fundamental underwriting issues. Consequently we do not expect a further widespread round of unbudgeted calls. There may be one or two continued isolated examples in the not too distant future, but that is likely to reflect the individual circumstances, rather than a market wide issue.
The converse question is also valid. Should the better performing clubs rebate calls in light of the positive results? This question, like investment strategy, reveals no absolutely definitive answer. On face value it would be equitable that surpluses be returned to the membership of clubs, however there is a similarly valid argument that surpluses (up to a point) should be used to build the financial strength of the club to reduce the probability of future unbudgeted calls. This is essentially a short term gain vs. medium term stability argument.
We would expect that in the current year there are only two major clubs in the market financially strong enough to consider any form of rebating of deferred calls.
Despite the difference in underwriting performances of individual clubs, investment income levels were sufficient in 2010/11 that every club in the IG made an overall surplus of some sort for the financial year.

Protection and Indemnity | Market Review 2011/201212 Protection and Indemnity | Market Review 2011/2012 13
Market Financial Commentary Market Financial Commentary
DIVERGENCE BETWEEN INDIVIDUAL CLUB RESULTSAs mentioned earlier, even within the generally positive financial results published at the end of 2010/11, the divergence between the best and worst performing clubs is considerable.
Just taking underwriting performance as an example, at the same time that the average market result has improved, the difference between the best and the worst performing clubs has increased.
On a financial year basis in 2010/11, the largest individual club combined ratio was 124%, the lowest was 78%. A 46% range in underwriting results across the market is clearly enormous.
Neither of these extremes of surplus or deficit is sustainable in a mutual environment.
NB: Comparative Analysis of Individual ClubsIn this section a number of references were made to variances in financial performance between individual clubs. Willis’ P&I clients have access on request to a materially more comprehensive comparative analysis of individual clubs.
EXPECTATIONS FOR THE 2012 RENEWAL SEASONIn light of the very positive 2010/11 results there is a not unreasonable expectation for a flexible renewal in 2012.
As mentioned earlier in this section, there is an interesting variation between clubs regarding their anecdotal feedback in respect of claims levels in the current year. A majority of clubs are reporting another relatively benign claims year, similar to 2010/11 but subject to inflationary pressures. Contrasting markedly with this, three or four clubs have reported that they seem to be experiencing considerably higher overall claims costs.
Probably the largest variable and major consideration is that investment income in the current year will be much diminished (if any) due to the precarious equity markets.
Additionally two or three clubs will face their own particular pre-existing challenges (as mentioned earlier in this section, underwriting results vary widely between clubs).
Based on the 2010/11 results and the current year claims feedback, there should be quite a wide range of increases announced. As ever in a market situation, logical theory is frequently not translated into practice. In the current year there is also significant pressure from ship operators facing some of the most challenging freight markets in decades. This is not to be underestimated in a mutual market. Regardless of each club’s technical requirements, the commercial pressure from ship operators will be enormous.
Consequently, despite the variation in the market, as expected general increases have been announced within the 0% to 5% range.
Amer
ican
Brita
nnia
Gar
d
Japa
n
Lond
on
Nor
th o
f Eng
land
Ship
owne
rs
Skul
d
Stan
dard
Stea
msh
ip
Swed
ish
U.K
. Clu
b
Wes
t of E
ngla
nd
Combined Ratio
Market Average
100%
60%
70%
80%
90%
100%
110%
120%
130%
Combined raTios 2010/11
Regardless of each club’s technical requirements, the commercial pressure from ship operators will be enormous.
NB: The Gard combined ratio (99.6%) shown in the graph above is the result on an estimated total call basis. i.e. the combined ratio ‘as if ’ the 2010 deferred call was not reduced from 25% to 15%.
Combined ratio: (incurred claims + expenses)/(premium - reinsurance).
Rein
suRa
nce
and
Pool
ing
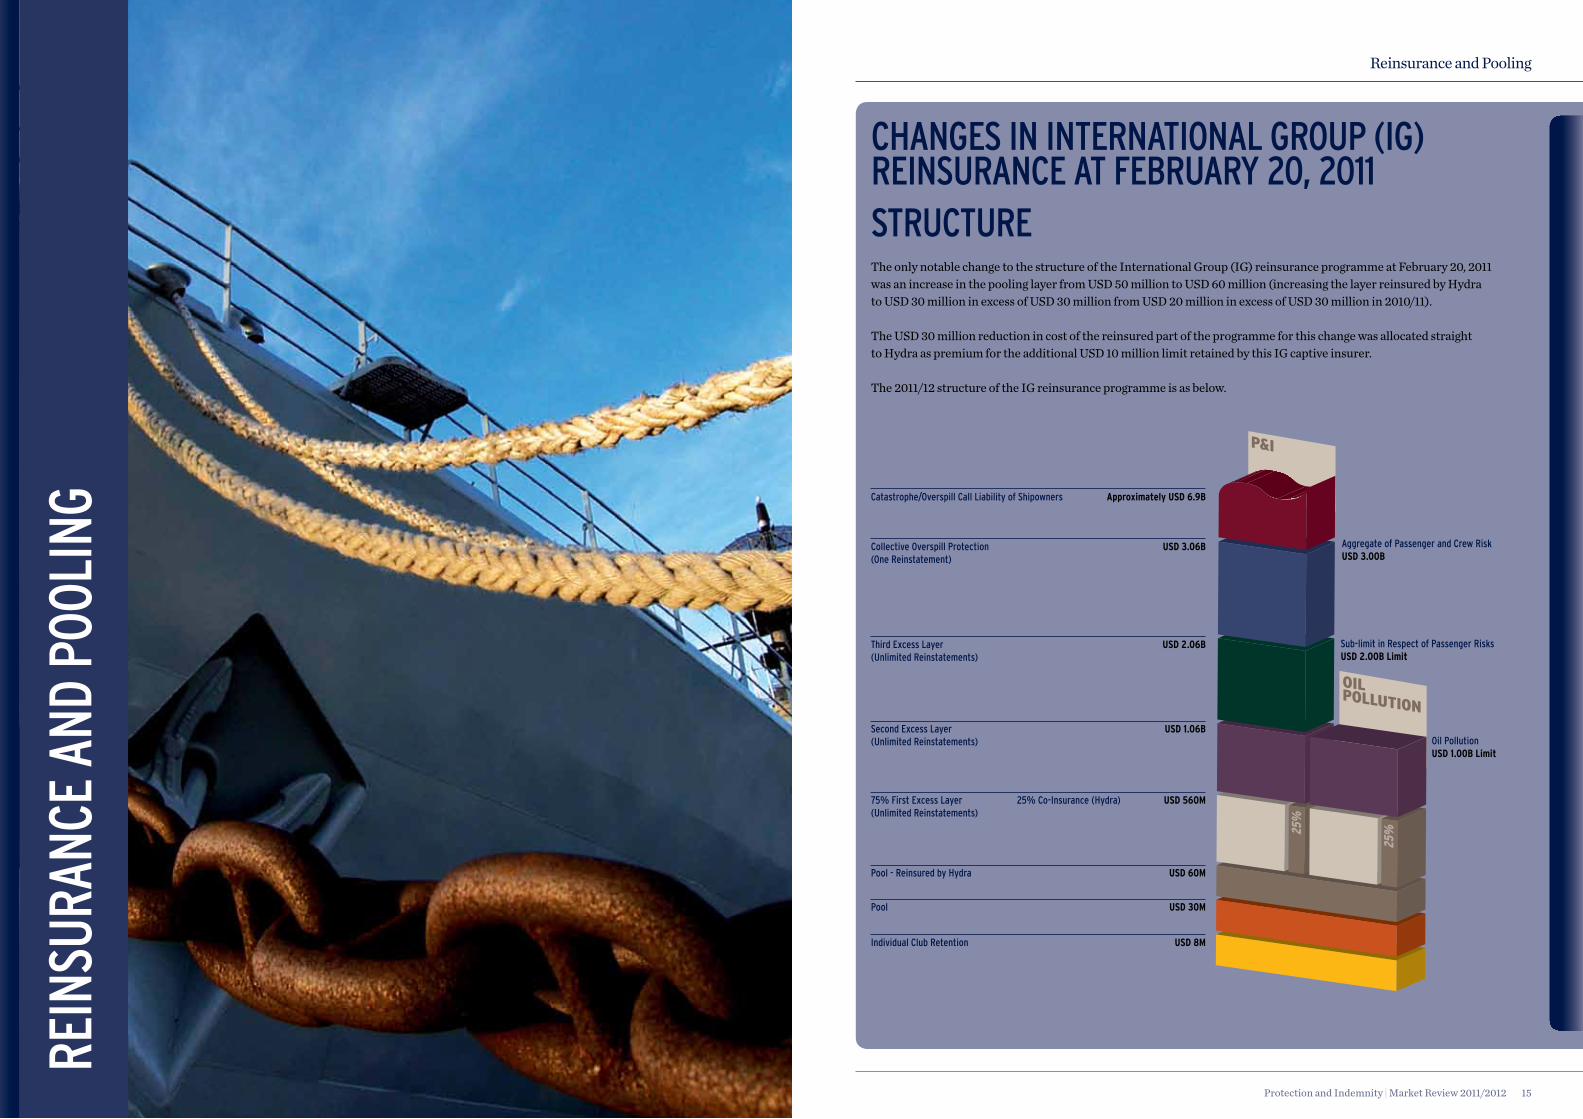
cHanges in inTeRnaTional gRouP (ig) ReinsuRance aT FeBRuaRY 20, 2011sTRucTuReThe only notable change to the structure of the International Group (IG) reinsurance programme at February 20, 2011 was an increase in the pooling layer from USD 50 million to USD 60 million (increasing the layer reinsured by Hydra to USD 30 million in excess of USD 30 million from USD 20 million in excess of USD 30 million in 2010/11).
The USD 30 million reduction in cost of the reinsured part of the programme for this change was allocated straight to Hydra as premium for the additional USD 10 million limit retained by this IG captive insurer.
The 2011/12 structure of the IG reinsurance programme is as below.
Protection and Indemnity | Market Review 2011/2012 15
Reinsurance and Pooling
collective overspill Protection (one Reinstatement)
USD 3.06B
Third excess layer (unlimited Reinstatements)
USD 2.06B
second excess layer (unlimited Reinstatements)
USD 1.06B
75% First excess layer (unlimited Reinstatements)
USD 560M
Pool - Reinsured by Hydra USD 60M
individual club Retention USD 8M
25% co-insurance (Hydra)
aggregate of Passenger and crew Risk USD 3.00B
sub-limit in Respect of Passenger Risks USD 2.00B Limit
oil Pollution USD 1.00B Limit
Pool USD 30M
catastrophe/overspill call liability of shipowners Approximately USD 6.9B
Protection and Indemnity | Market Review 2011/2012 17Protection and Indemnity | Market Review 2011/201216
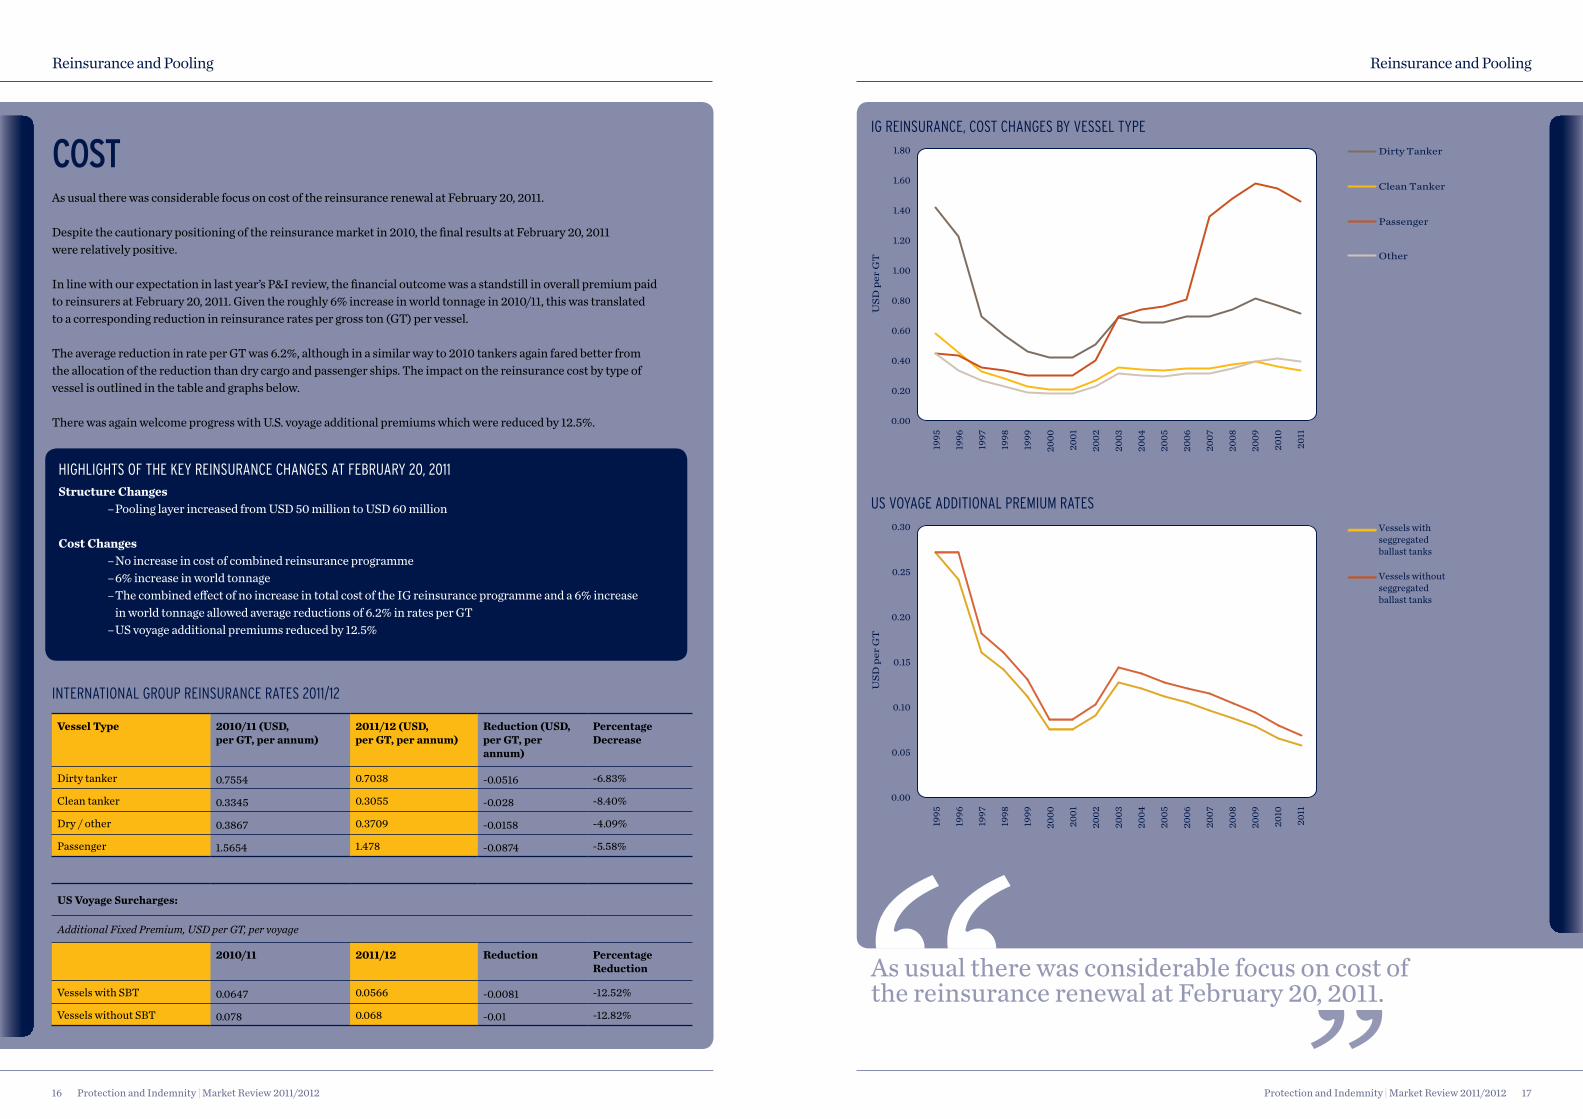
cosT As usual there was considerable focus on cost of the reinsurance renewal at February 20, 2011.
Despite the cautionary positioning of the reinsurance market in 2010, the final results at February 20, 2011 were relatively positive.
In line with our expectation in last year’s P&I review, the financial outcome was a standstill in overall premium paid to reinsurers at February 20, 2011. Given the roughly 6% increase in world tonnage in 2010/11, this was translated to a corresponding reduction in reinsurance rates per gross ton (GT) per vessel. The average reduction in rate per GT was 6.2%, although in a similar way to 2010 tankers again fared better from the allocation of the reduction than dry cargo and passenger ships. The impact on the reinsurance cost by type of vessel is outlined in the table and graphs below.
There was again welcome progress with U.S. voyage additional premiums which were reduced by 12.5%.
Reinsurance and Pooling Reinsurance and Pooling
INTERNATIONAL GROUP REINSURANCE RATES 2011/12
Vessel Type 2010/11 (USD, per GT, per annum)
2011/12 (USD, per GT, per annum)
Reduction (USD, per GT, per annum)
Percentage Decrease
Dirty tanker 0.7554 0.7038 -0.0516 -6.83%
Clean tanker 0.3345 0.3055 -0.028 -8.40%
Dry / other 0.3867 0.3709 -0.0158 -4.09%
Passenger 1.5654 1.478 -0.0874 -5.58%
US Voyage Surcharges:
Additional Fixed Premium, USD per GT, per voyage
2010/11 2011/12 Reduction Percentage Reduction
Vessels with SBT 0.0647 0.0566 -0.0081 -12.52%
Vessels without SBT 0.078 0.068 -0.01 -12.82%
HIGHLIGHTS OF THE KEY REINSURANCE CHANGES AT FEBRUARY 20, 2011 Structure Changes
– Pooling layer increased from USD 50 million to USD 60 million
Cost Changes– No increase in cost of combined reinsurance programme – 6% increase in world tonnage– The combined effect of no increase in total cost of the IG reinsurance programme and a 6% increase
in world tonnage allowed average reductions of 6.2% in rates per GT– US voyage additional premiums reduced by 12.5%
USD
per
GT
1995
1996
1997
1998
1999
2000
2001
2002
2003
2004
2005
2006
2011
2007
2008
2009
2010
0.00
0.20
0.40
0.60
0.80
1.00
1.20
1.40
1.60
1.80 Dirty Tanker
Clean Tanker
Passenger
Other
IG REINSURANCE, COST CHANGES BY VESSEL TYPE
USD
per
GT
1995
1996
1997
1998
1999
2000
2001
2002
2003
2004
2005
2006
2011
2007
2008
2009
2010
0.00
0.05
0.10
0.15
0.20
0.25
0.30 Vessels with seggregated ballast tanks
Vessels without seggregated ballast tanks
US VOYAGE AddITIONAL PREmIUm RATES
As usual there was considerable focus on cost of the reinsurance renewal at February 20, 2011.
18 Protection and Indemnity | Market Review 2011/2012 Protection and Indemnity | Market Review 2011/2012 19
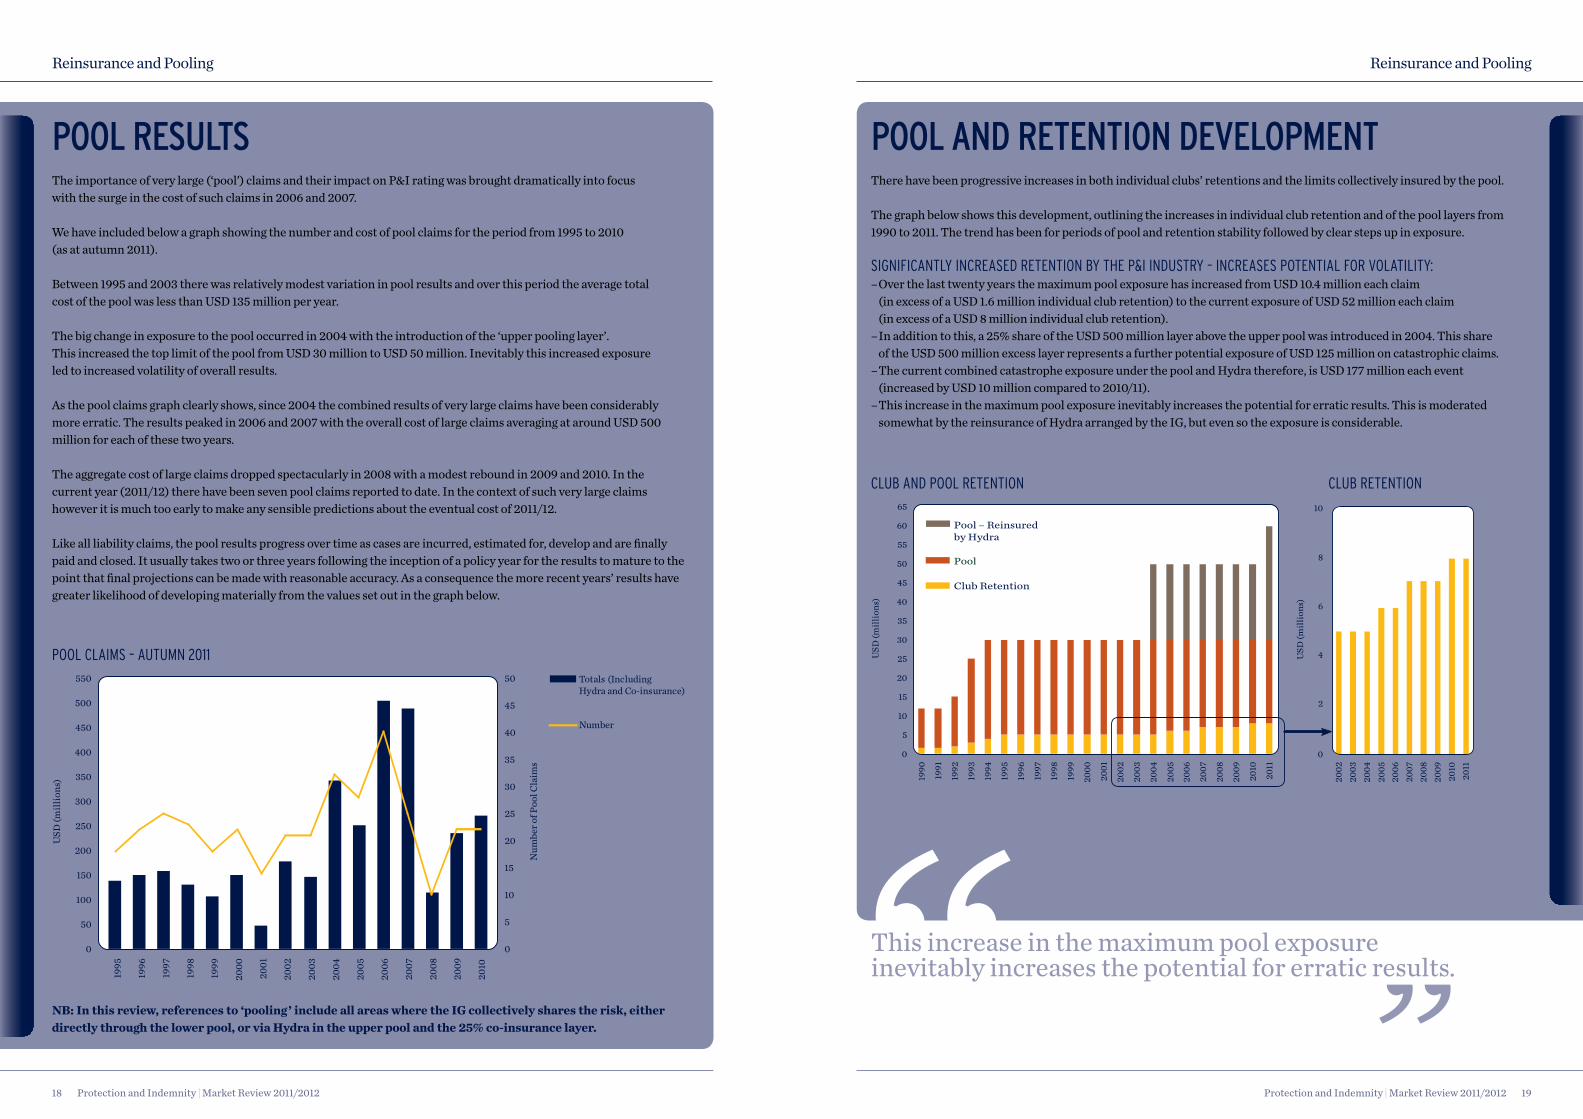
Pool ResulTsThe importance of very large (‘pool’) claims and their impact on P&I rating was brought dramatically into focus with the surge in the cost of such claims in 2006 and 2007.
We have included below a graph showing the number and cost of pool claims for the period from 1995 to 2010 (as at autumn 2011).
Between 1995 and 2003 there was relatively modest variation in pool results and over this period the average total cost of the pool was less than USD 135 million per year.
The big change in exposure to the pool occurred in 2004 with the introduction of the ‘upper pooling layer’. This increased the top limit of the pool from USD 30 million to USD 50 million. Inevitably this increased exposure led to increased volatility of overall results.
As the pool claims graph clearly shows, since 2004 the combined results of very large claims have been considerably more erratic. The results peaked in 2006 and 2007 with the overall cost of large claims averaging at around USD 500 million for each of these two years.
The aggregate cost of large claims dropped spectacularly in 2008 with a modest rebound in 2009 and 2010. In the current year (2011/12) there have been seven pool claims reported to date. In the context of such very large claims however it is much too early to make any sensible predictions about the eventual cost of 2011/12.
Like all liability claims, the pool results progress over time as cases are incurred, estimated for, develop and are finally paid and closed. It usually takes two or three years following the inception of a policy year for the results to mature to the point that final projections can be made with reasonable accuracy. As a consequence the more recent years’ results have greater likelihood of developing materially from the values set out in the graph below.
Pool and ReTenTion deVeloPMenTThere have been progressive increases in both individual clubs’ retentions and the limits collectively insured by the pool.
The graph below shows this development, outlining the increases in individual club retention and of the pool layers from 1990 to 2011. The trend has been for periods of pool and retention stability followed by clear steps up in exposure.
SIGNIFICANTLY INCREASEd RETENTION BY THE P&I INdUSTRY – INCREASES POTENTIAL FOR VOLATILITY:– Over the last twenty years the maximum pool exposure has increased from USD 10.4 million each claim
(in excess of a USD 1.6 million individual club retention) to the current exposure of USD 52 million each claim (in excess of a USD 8 million individual club retention).
– In addition to this, a 25% share of the USD 500 million layer above the upper pool was introduced in 2004. This share of the USD 500 million excess layer represents a further potential exposure of USD 125 million on catastrophic claims.
– The current combined catastrophe exposure under the pool and Hydra therefore, is USD 177 million each event (increased by USD 10 million compared to 2010/11).
– This increase in the maximum pool exposure inevitably increases the potential for erratic results. This is moderated somewhat by the reinsurance of Hydra arranged by the IG, but even so the exposure is considerable.
NB: in this review, references to ‘pooling’ include all areas where the iG collectively shares the risk, either directly through the lower pool, or via Hydra in the upper pool and the 25% co-insurance layer.
Reinsurance and Pooling Reinsurance and Pooling
1995
1996
1997
1998
1999
2000
2001
2002
2003
2004
2005
2006
2010
2007
2008
2009
Totals (Including Hydra and Co-insurance)
Number
Num
ber o
f Poo
l Cla
ims
USD
(mill
ions
)
0
50
100
150
200
250
300
350
400
450
500
550
0
5
10
15
20
25
30
35
40
45
50
1990
1991
1992
1993
1994
1995
1996
1997
1998
1999
2000
2001
2002
2003
2004
2005
2006
2011
2007
2008
2009
2010
USD
(mill
ions
)
Pool – Reinsured by Hydra
Pool
Club Retention
0
5
10
15
20
25
30
35
40
45
55
60
50
65
2002
2003
2004
2005
2006
2011
2007
2008
2009
2010
USD
(mill
ions
)
0
2
4
6
8
10
POOL CLAImS – AUTUmN 2011
CLUB ANd POOL RETENTION CLUB RETENTION
This increase in the maximum pool exposure inevitably increases the potential for erratic results.
Protection and Indemnity | Market Review 2011/201220 Protection and Indemnity | Market Review 2011/2012 21
Pool ResulTs - PRosPecTs FoR THe FuTuReThe pattern and causes of individual claims within the pooling layer have been analysed in our previous P&I Reviews. In summary, there were two key factors involved in the surge in very large claims in 2006 and 2007. The first was a significant increase in the average cost of individual major claims. The second factor was causational. The proximate cause of the majority of pool claims in these two years was predominantly human error, rather than for example, mechanical failure or involvement of sub-standard shipping.
Reviewing the cost factor, it is unlikely that the average cost of major claims will reduce. With the pressures of inflation, technological innovation and ever increasing limitation and liability awards, the opposite appears more realistic.
Reviewing the causation factor, the economic slowdown had the effect of decreasing world trade. Consequently in an environment with fewer ships operating the competition to secure better qualified and more experienced crew eased somewhat. Similarly with lessened commercial time pressure on ships, it seemed logical to expect that fewer decision making errors would be made.
Whether coincidental, or as a result of the economic situation, the number of very large cases decreased materially in 2008. This trend was continued, albeit to a lesser extent in 2009 and 2010.
When trade eventually increases it would seem similarly reasonable to expect that pressure on numbers of claims may again start to increase. The obvious corollary being that this may be the catalyst for an increase in the overall cost of very large claims.
Any predictions about very large cases should however be tempered with a considerable amount of caution. In statistical terms, the IG experiences a very small total number of pool claims. Even in 2006 and 2007 there were on average less than 40 cases per year above USD 7 million, across the entire industry. As a consequence, statistical anomalies easily occur. The general trend could follow a pattern in line with the expected market forces, but the potential for volatility is enormous.
The impact of statistical aberrations is also far greater today on the P&I clubs, due to the greater retentions in the current structure of the pool/IG reinsurance.
eXPecTaTions FoR THe ReinsuRance ReneWal aT FeBRuaRY 20, 2012To date in 2011 there has not been a claim advised within the IG which appears likely to exceed USD 60 million, i.e. nothing so far that is likely to impact the IG excess of loss reinsurance programme.
In each of the previous three years (2008, 2009 and 2010) only two claims are currently estimated as large enough to impact the IG excess of loss reinsurance programme. Even the quantum of these two cases only marginally impacts the first layer of the reinsurance programme. Interestingly, if the current structure with the increased excess point of USD 60 million had been in force for the last five years, there would have been no claim since 2007 that would have troubled the IG’s reinsurers.
The continuing positive results in the four most recent years (2008, 2009, 2010 and so far in 2011) will have offset the two extremely adverse years in 2006 and 2007. Added to this, the upper layers of the programme continue to run claims free.
At the time of writing, the negotiations on the IG reinsurance programme had not started in earnest.
Background factors will include the catastrophes of the Japan and New Zealand earthquakes, whether there will be amendments to US pollution liability legislation as a result of Deepwater Horizon and a couple of high profile energy losses in the last 12 months.
Like last year however, our expectation is that the improving loss record of the IG excess of loss programme will prove more compelling an argument than the general hardening pressures on large-limit liability programmes and possible future legislative changes.
COSTAt this stage we would anticipate probably a standstill in overall premium paid to reinsurers at February 20, 2012.
After considerable lobbying, we also expect that the scheme of US voyage additional premiums will either be finally eliminated or at least the cost further reduced at February 20, 2012.
STRUCTUREIn terms of changes to the structure of the IG reinsurance programme it is possible that the pool layer reinsured by Hydra may again be increased. To date it is difficult to argue that Hydra has served its original purpose and the longer term benefits are yet to be seen. It would be in line with the IG’s original intent for Hydra to progressively increase this pooling layer towards a USD 100 million limit. It is possible therefore that this could increase from USD 60 million to say USD 70 million or USD 75 million at February 20, 2012.
Reinsurance and Pooling Reinsurance and Pooling
After considerable lobbying, we also expect that the scheme of US voyage additional premiums will either be finally eliminated or at least the cost further reduced at February 20, 2012.
Gene
ral
Incr
ease
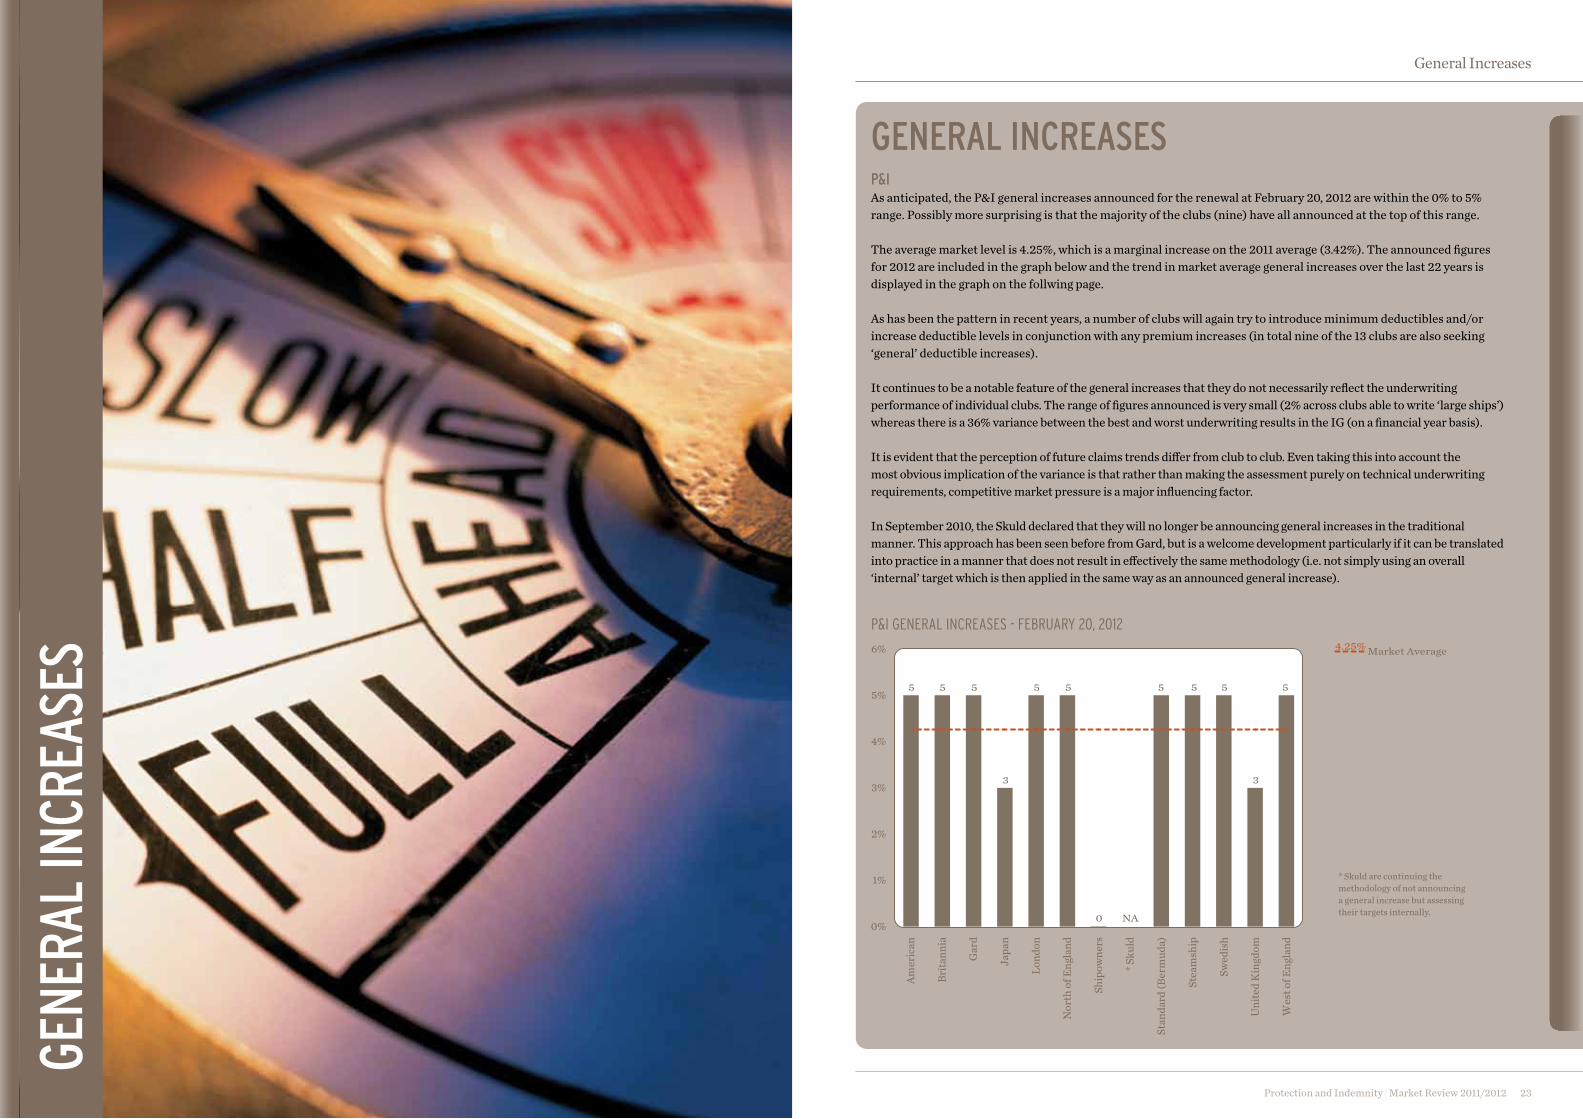
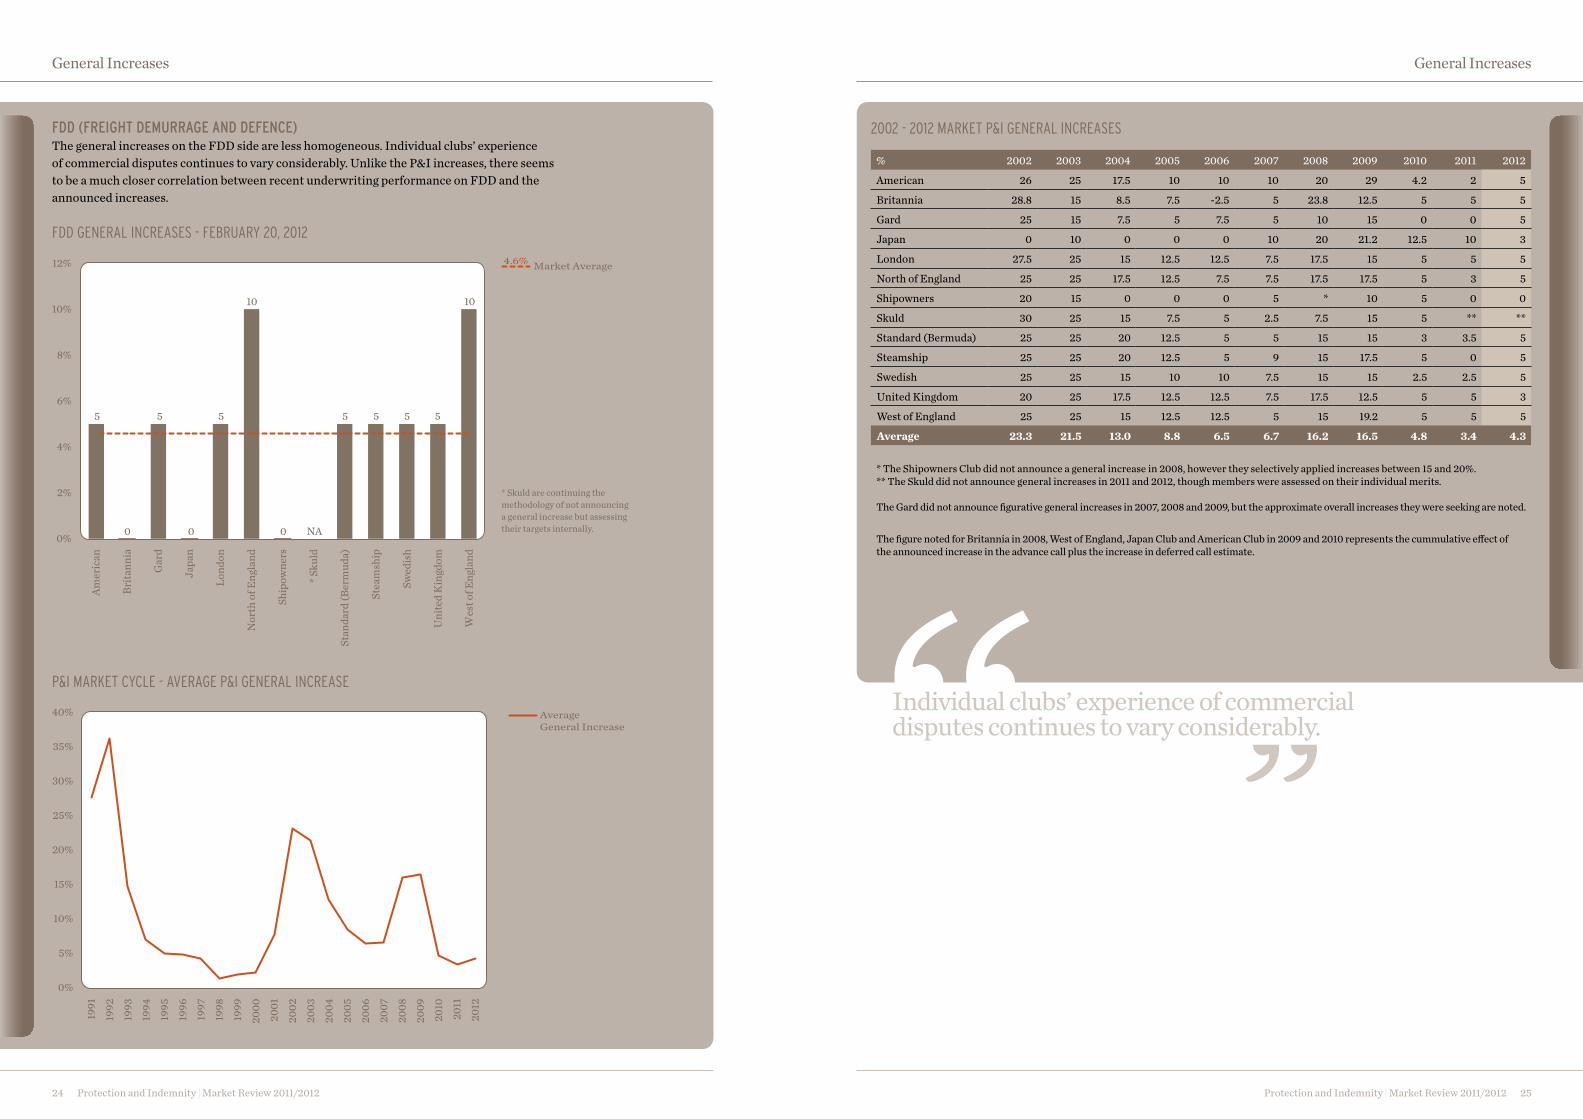
sGeneral IncreasesP&I As anticipated, the P&I general increases announced for the renewal at February 20, 2012 are within the 0% to 5% range. Possibly more surprising is that the majority of the clubs (nine) have all announced at the top of this range.
The average market level is 4.25%, which is a marginal increase on the 2011 average (3.42%). The announced figures for 2012 are included in the graph below and the trend in market average general increases over the last 22 years is displayed in the graph on the follwing page.
As has been the pattern in recent years, a number of clubs will again try to introduce minimum deductibles and/or increase deductible levels in conjunction with any premium increases (in total nine of the 13 clubs are also seeking ‘general’ deductible increases).
It continues to be a notable feature of the general increases that they do not necessarily reflect the underwriting performance of individual clubs. The range of figures announced is very small (2% across clubs able to write ‘large ships’) whereas there is a 36% variance between the best and worst underwriting results in the IG (on a financial year basis).
It is evident that the perception of future claims trends differ from club to club. Even taking this into account the most obvious implication of the variance is that rather than making the assessment purely on technical underwriting requirements, competitive market pressure is a major influencing factor.
In September 2010, the Skuld declared that they will no longer be announcing general increases in the traditional manner. This approach has been seen before from Gard, but is a welcome development particularly if it can be translated into practice in a manner that does not result in effectively the same methodology (i.e. not simply using an overall ‘internal’ target which is then applied in the same way as an announced general increase).
Protection and Indemnity | Market Review 2011/2012 23
General Increases
P&I GENERAL INCREASES - FEBRUARY 20, 2012
5 5 5
3
5 5
0 NA
5 5 5
3
5
4.25%
0%
2%
1%
3%
4%
5%
6% Market Average
Amer
ican
Brita
nnia
Gar
d
Japa
n
Lond
on
Nor
th o
f Eng
land
Ship
owne
rs
* Sku
ld
Stan
dard
(Ber
mud
a)
Stea
msh
ip
Swed
ish
Uni
ted
Kin
gdom
Wes
t of E
ngla
nd
* Skuld are continuing the methodology of not announcing a general increase but assessing their targets internally.
Protection and Indemnity | Market Review 2011/2012 25Protection and Indemnity | Market Review 2011/201224
FDD (FreIGHT DeMUrraGe anD DeFence)The general increases on the FDD side are less homogeneous. Individual clubs’ experience of commercial disputes continues to vary considerably. Unlike the P&I increases, there seems to be a much closer correlation between recent underwriting performance on FDD and the announced increases.
General Increases General Increases
Individual clubs’ experience of commercial disputes continues to vary considerably.
Fdd GENERAL INCREASES - FEBRUARY 20, 2012
P&I MARKET CYCLE - AVERAGE P&I GENERAL INCREASE
5
0
5
0
5
10
0 NA
5 5 5 5
10
4.6%
0%
4%
2%
6%
8%
10%
12% Market Average
Amer
ican
Brita
nnia
Gar
d
Japa
n
Lond
on
Nor
th o
f Eng
land
Ship
owne
rs
* Sku
ld
Stan
dard
(Ber
mud
a)
Stea
msh
ip
Swed
ish
Uni
ted
Kin
gdom
Wes
t of E
ngla
nd
1991
1992
1993
1994
1995
1996
1997
1998
1999
2000
2001
2002
2003
2004
2005
2006
2007
2008
2009
2010
2011
2012
0%
5%
10%
15%
20%
25%
30%
35%
40% AverageGeneral Increase
% 2002 2003 2004 2005 2006 2007 2008 2009 2010 2011 2012
American 26 25 17.5 10 10 10 20 29 4.2 2 5
Britannia 28.8 15 8.5 7.5 -2.5 5 23.8 12.5 5 5 5
Gard 25 15 7.5 5 7.5 5 10 15 0 0 5
Japan 0 10 0 0 0 10 20 21.2 12.5 10 3
London 27.5 25 15 12.5 12.5 7.5 17.5 15 5 5 5
North of England 25 25 17.5 12.5 7.5 7.5 17.5 17.5 5 3 5
Shipowners 20 15 0 0 0 5 * 10 5 0 0
Skuld 30 25 15 7.5 5 2.5 7.5 15 5 ** **
Standard (Bermuda) 25 25 20 12.5 5 5 15 15 3 3.5 5
Steamship 25 25 20 12.5 5 9 15 17.5 5 0 5
Swedish 25 25 15 10 10 7.5 15 15 2.5 2.5 5
United Kingdom 20 25 17.5 12.5 12.5 7.5 17.5 12.5 5 5 3
West of England 25 25 15 12.5 12.5 5 15 19.2 5 5 5
Average 23.3 21.5 13.0 8.8 6.5 6.7 16.2 16.5 4.8 3.4 4.3
* The Shipowners Club did not announce a general increase in 2008, however they selectively applied increases between 15 and 20%.** The Skuld did not announce general increases in 2011 and 2012, though members were assessed on their individual merits.
The Gard did not announce figurative general increases in 2007, 2008 and 2009, but the approximate overall increases they were seeking are noted.
The figure noted for Britannia in 2008, West of England, Japan Club and American Club in 2009 and 2010 represents the cummulative effect of the announced increase in the advance call plus the increase in deferred call estimate.
* Skuld are continuing the methodology of not announcing a general increase but assessing their targets internally.
2002 - 2012 MARKET P&I GENERAL INCREASES
Rele
ase
call
sRelease callsFollowing an increase in the average levels of club release calls in the early 2000’s, release calls are an issue that Willis have consistently highlighted in several previous reviews.
As P&I clubs are mutual, release calls are a fair and necessary mechanism. Unfortunately, in recent years it appears that there has been a tendency to use them as much as a commercial penalty for leaving, rather than purely as a reasonable estimate of future exposure to the club. The position has improved marginally over the last 12 months, but this section outlines each club’s release calls discussing them in context of current market averages and historic exposure.
BacKGROUNDThe intent of release calls is to remove any potential future liability for further calls to the club, following termination of membership in the particular club. By paying the release call, the member is ‘released’ from obligation to pay future supplementary calls to the club. Thus, the release call is intended to represent the member’s proportion of the club’s incurred but not reported (IBNR) claims for the open years outstanding.
This original intent is an entirely equitable mechanism in a mutual environment, but the level of release calls established in recent years suggests that this is not necessarily mirrored in practice.
Protection and Indemnity | Market Review 2011/2012 27
Release Calls
The position has improved marginally over the last 12 months, but this section outlines each club’s release calls discussing them in context of current market averages and historic exposure.
Protection and Indemnity | Market Review 2011/2012 29Protection and Indemnity | Market Review 2011/201228
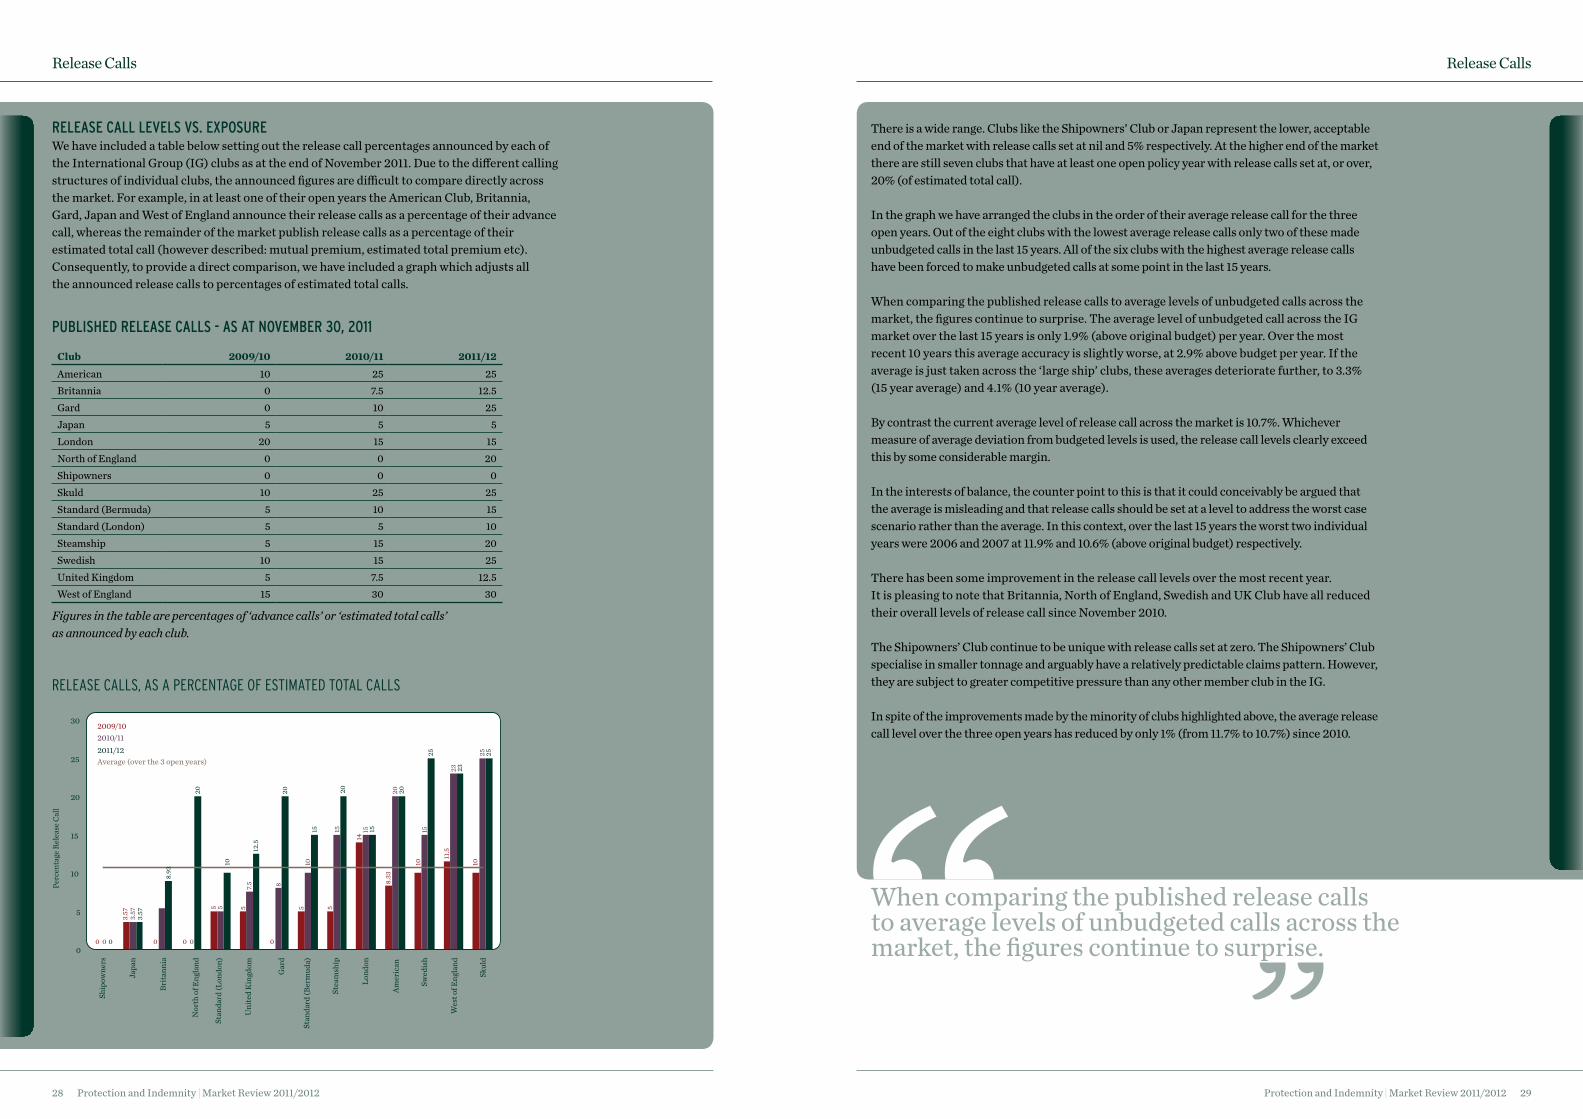
Release call leVels Vs. eXPOsUReWe have included a table below setting out the release call percentages announced by each of the International Group (IG) clubs as at the end of November 2011. Due to the different calling structures of individual clubs, the announced figures are difficult to compare directly across the market. For example, in at least one of their open years the American Club, Britannia, Gard, Japan and West of England announce their release calls as a percentage of their advance call, whereas the remainder of the market publish release calls as a percentage of their estimated total call (however described: mutual premium, estimated total premium etc). Consequently, to provide a direct comparison, we have included a graph which adjusts all the announced release calls to percentages of estimated total calls.
There is a wide range. Clubs like the Shipowners’ Club or Japan represent the lower, acceptable end of the market with release calls set at nil and 5% respectively. At the higher end of the market there are still seven clubs that have at least one open policy year with release calls set at, or over, 20% (of estimated total call).
In the graph we have arranged the clubs in the order of their average release call for the three open years. Out of the eight clubs with the lowest average release calls only two of these made unbudgeted calls in the last 15 years. All of the six clubs with the highest average release calls have been forced to make unbudgeted calls at some point in the last 15 years.
When comparing the published release calls to average levels of unbudgeted calls across the market, the figures continue to surprise. The average level of unbudgeted call across the IG market over the last 15 years is only 1.9% (above original budget) per year. Over the most recent 10 years this average accuracy is slightly worse, at 2.9% above budget per year. If the average is just taken across the ‘large ship’ clubs, these averages deteriorate further, to 3.3% (15 year average) and 4.1% (10 year average).
By contrast the current average level of release call across the market is 10.7%. Whichever measure of average deviation from budgeted levels is used, the release call levels clearly exceed this by some considerable margin. In the interests of balance, the counter point to this is that it could conceivably be argued that the average is misleading and that release calls should be set at a level to address the worst case scenario rather than the average. In this context, over the last 15 years the worst two individual years were 2006 and 2007 at 11.9% and 10.6% (above original budget) respectively.
There has been some improvement in the release call levels over the most recent year. It is pleasing to note that Britannia, North of England, Swedish and UK Club have all reduced their overall levels of release call since November 2010.
The Shipowners’ Club continue to be unique with release calls set at zero. The Shipowners’ Club specialise in smaller tonnage and arguably have a relatively predictable claims pattern. however, they are subject to greater competitive pressure than any other member club in the IG.
In spite of the improvements made by the minority of clubs highlighted above, the average release call level over the three open years has reduced by only 1% (from 11.7% to 10.7%) since 2010.
Release Calls Release Calls
Release Calls, as a PeRCentage of estimated total Calls
0
3.57
0 0
5 5
0
5 5
14
8.33
10
11.5
15
10
0
3.57
0
5
7.5 8
10
15 15
20
23
25
0
3.57
8.93
20
10
12.5
20
15
20
15
20
25
23
25
0
5
10
15
20
25
30
Gar
d
Perc
enta
ge R
elea
se C
all
2009/102010/112011/12Average (over the 3 open years)
Ship
owne
rs
Japa
n
Brita
nnia
Nor
th o
f Eng
land
Stan
dard
(Lon
don)
Uni
ted
Kin
gdom
Stan
dard
(Ber
mud
a)
Stea
msh
ip
Lond
on
Amer
ican
Swed
ish
Wes
t of E
ngla
nd
Skul
d
Club 2009/10 2010/11 2011/12American 10 25 25Britannia 0 7.5 12.5Gard 0 10 25Japan 5 5 5London 20 15 15North of England 0 0 20Shipowners 0 0 0Skuld 10 25 25Standard (Bermuda) 5 10 15Standard (London) 5 5 10Steamship 5 15 20Swedish 10 15 25United Kingdom 5 7.5 12.5West of England 15 30 30
PUBlIsHeD Release calls - as aT NOVeMBeR 30, 2011
When comparing the published release calls to average levels of unbudgeted calls across the market, the figures continue to surprise.
Figures in the table are percentages of ‘advance calls’ or ‘estimated total calls’ as announced by each club.
Protection and Indemnity | Market Review 2011/201230
Release Calls
GUaRaNTee Vs. PaYING Release callsClubs will argue that any Member can provide a bank guarantee from a first class bank as security for potential future calls instead of actually paying release calls. This is entirely true, however it is not without cost. In addition to bank costs there is frequently a requirement to tie up funds to secure the guarantee. In challenging economic times, where liquidity is all important the bank guarantee route is far from straightforward and in many cases presents as large a barrier to movement as actually paying the release calls outright.
cONclUsIONClubs have a wide variety of sophisticated modelling methods at their disposal. It is therefore curious that a club with significant release calls believe their claims may exceed expectation by up to 25%, even one or two years after the expiry of the policy.
Release calls are a material barrier to movement of business between clubs. Thus, while the theory is entirely equitable it is understandable why the release calls of some clubs are perceived more as a commercial ‘penalty’ for moving, rather than a realistic assessment of the potential for unbudgeted supplementary calls.
Clubs will argue that any Member can provide a bank guarantee from a first class bank as security for potential future calls instead of actually paying release calls.
Protection and Indemnity | Market Review 2011/2012 33
Club Financial PagesCl
ub F
inan
Cial
Pag
esinTRODuCTiOn The following section includes the consolidated, financial year summaries for each club.
BASIS OF FINANCIAL ANALYSISThe main aim in the Willis analysis of club report and accounts has been consistency. There are still variations between the way clubs report, however we try as far as possible to compare ‘like with like’ and have the same approach year after year. We simplify and summarise certain aspects but where information is available, we have tried to adopt the same approach for all clubs.
The terminology/figures included in Willis P&I publications as summarised under each heading are defined below.
Calls and premiums All calls (gross basis, including brokerage).Reinsurance premiums All reinsurance premiums.Operating expenses All general management, administrative and audit expenses
(not including claims management costs).Operating income Calls, less reinsurance costs, less expenses.
Gross paid claims Gross paid claims, including pool contributions (including claims management costs).
Net paid claims Gross paid claims less reinsurance and pool recoveries.Paid technical surplus (deficit) Operating income, less net paid claims.Net change in provision for claims Change in net estimated outstanding claims.
Incurred technical surplus (deficit) Paid technical surplus (deficit), plus/minus net change in provision for claims.
Investment income All investment income, including, exchange gains/losses, tax etc.Overall surplus for year (deficit) Incurred technical surplus (deficit), plus investment income.
Net assets Total assets, less creditors, less miscellaneous provisions for taxation etc., less additional calls advised but not yet debited.
Net outstanding claims Total net estimated outstanding claims.Forecast additional calls Premium/calls advised but not yet debited.Free reserves (including forecast additional calls)
Net assets, plus forecast additional calls, less outstanding claims.
All figures are on consolidated, financial year basis, in USD.
The main aim in the Willis analysis of club report and accounts has been consistency.
Protection and Indemnity | Market Review 2011/201234
Club Financial Pages
nOTesBRITANNIA With effect from the 1997/98 policy year Britannia entered into a reinsurance contract with Boudicca Insurance Company Limited, located and regulated in Bermuda. Boudicca Insurance holds assets in a way that they cannot be dissipated to the detriment of the reinsurance contract with Britannia. This is intended to be a tax efficient vehicle for a proportion of Britannia’s reserves.
Boudicca is owned and controlled by the Iceni Trust, a charitable trust for which reports and accounts are unavailable. In our summary page for Britannia for the sake of effective comparison we have always included Boudicca’s assets in the figures. The assets of Boudicca as disclosed by the Club are as follows:
1997/98 USD 62 million 1998/99 USD 87 million 1999/00 USD 97.5 million2000/01 USD 105.4 million2001/02 USD 106.7 million2002/03 USD 124.9 million2003/04 USD 152 million2004/05 USD 142.8 million2005/06 USD 132.3 million2006/07 USD 108.4 million2007/08 USD 80.3 million2008/09 USD 85 million2009/10 USD 153.8 million2010/11 USD 179.2 million
The relationship between Britannia and Boudicca presents an unusual challenge in terms of trying to show the 'combined' picture as accurately as possible.
The adjustments we make to Britannia’s reported figures to show the overall picture including Boudicca are as follows: – Britannia reinsurance premiums reduced by amounts paid
to Boudicca– Britannia paid claims increased by amounts recovered from Boudicca – The change in provision of claims for Boudicca added to the change
for Britannia– Inclusion of a non-technical adjustment under Britannia’s
‘investment income’ heading to reflect the difference between Boudicca’s investment income and operating costs.
GARDIn Gard’s 2010/11 Management Report the club changed their basis of reporting the P&Iclass of cover. The Gard P&I underwriting results continue to be provided in full, but the club has only published the combined Gard Group results for investment return, assets and free reserves (i.e. the combined results for P&I, Marine and Energy). To provide a meaningful comparison, the figures used in our financial graphs representing Gard’s investment income, assets and free reserves are Willis analysts’ estimates of the purely P&I proportion of each of these amounts (although the published ‘Group’ figures for these amounts are stated in the table on Gard’s page).
SWEDISH CLUBThe Swedish Club discloses its financial results on a different basis to the rest of the International Group. Within the Swedish Club’s published report and accounts there is no allocation of funds between their Protection and Indemnity and Hull and Machinery classes. This makes the P&I class impossible to compare directly with other clubs and consequently we have only included a partial financial summary for this club.
STANDARD AND POOR’SStandard and Poor’s (S&P) ratings mentioned in the following pages fall into two categories, interactive ratings and public information ratings. S&P establish interactive ratings following in-depth meetings with the club managers. Interactively rated clubs are identified by ‘*’ after the rating. Public information ratings are signified by a ‘pi’ subscript and are established purely on the basis of the information provided in the clubs’ published financial statements.
It is the clubs themselves that choose whether or not to pursue an interactive rating and there is a cost to the club from S&P for the consequent additional work involved. When an interactive rating is undertaken, the rating of the particular club usually shows some form of improvement.
All ratings are shown as at November 1 in the years noted.
Protection and Indemnity | Market Review 2011/2012 37
Club Financial Pages
Protection and Indemnity | Market Review 2011/201236
Club Financial Pages
TONNAGE SPLIT BY NATIONALITY OF MANAGEMENT
TONNAGE SPLIT BY VESSEL TYPE
ameRiCan Clubwww.american-club.com
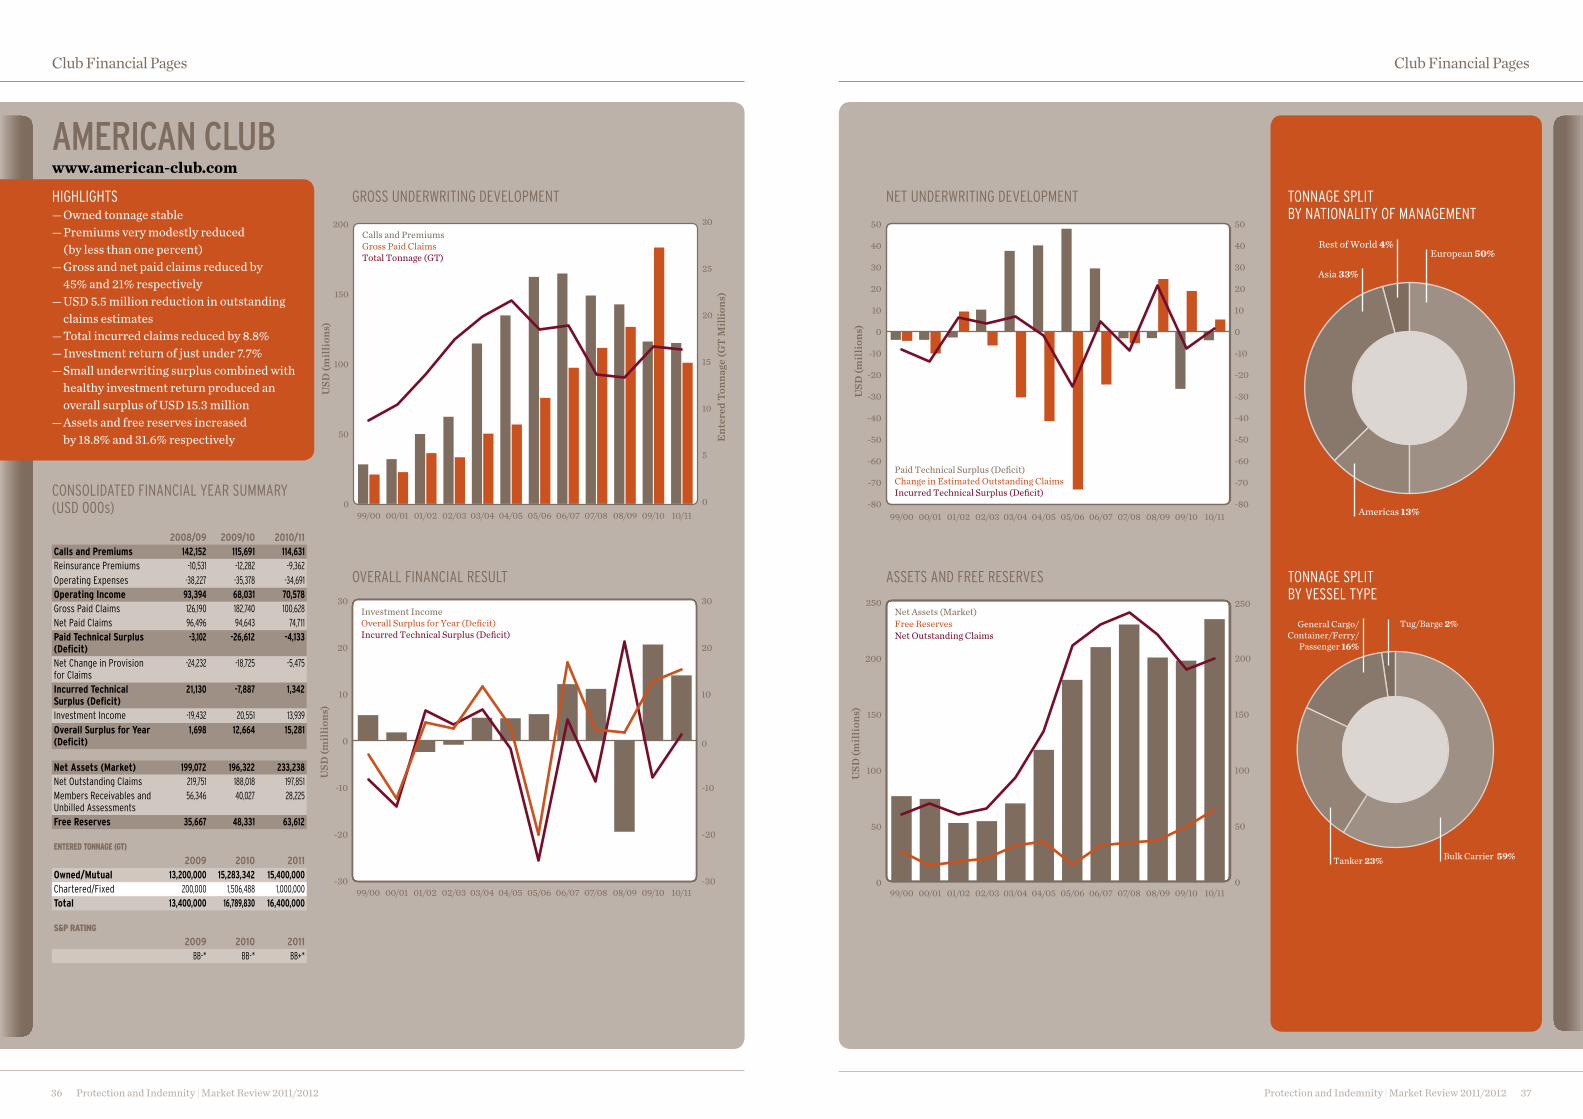
HIGHLIGHTS — Owned tonnage stable — Premiums very modestly reduced (by less than one percent) — Gross and net paid claims reduced by 45% and 21% respectively — USD 5.5 million reduction in outstanding claims estimates — Total incurred claims reduced by 8.8% — Investment return of just under 7.7% — Small underwriting surplus combined with healthy investment return produced an overall surplus of USD 15.3 million — Assets and free reserves increased by 18.8% and 31.6% respectively
CONSOLIDATED FINANCIAL YEAR SUMMARY (USD 000s)
2008/09 2009/10 2010/11Calls and Premiums 142,152 115,691 114,631 Reinsurance Premiums -10,531 -12,282 -9,362 Operating Expenses -38,227 -35,378 -34,691 Operating Income 93,394 68,031 70,578 Gross Paid Claims 126,190 182,740 100,628 Net Paid Claims 96,496 94,643 74,711 Paid Technical Surplus (Deficit)
-3,102 -26,612 -4,133
Net Change in Provision for Claims
-24,232 -18,725 -5,475
Incurred Technical Surplus (Deficit)
21,130 -7,887 1,342
Investment Income -19,432 20,551 13,939 Overall Surplus for Year (Deficit)
1,698 12,664 15,281
Net Assets (Market) 199,072 196,322 233,238 Net Outstanding Claims 219,751 188,018 197,851 Members Receivables and Unbilled Assessments
56,346 40,027 28,225
Free Reserves 35,667 48,331 63,612
EntErEd tonnagE (gt)
2009 2010 2011Owned/Mutual 13,200,000 15,283,342 15,400,000 Chartered/Fixed 200,000 1,506,488 1,000,000 Total 13,400,000 16,789,830 16,400,000
S&P rating
2009 2010 2011 BB-* BB-* BB+*
GROSS UNDERWRITING DEVELOPMENT NET UNDERWRITING DEVELOPMENT
ASSETS AND FREE RESERVESOVERALL FINANCIAL RESULT
European 50%
Americas 13%
Rest of World 4%
Asia 33%
Bulk Carrier 59%Tanker 23%
Tug/Barge 2%General Cargo/Container/Ferry/
Passenger 16%
0
50
100
150
200
0
5
10
15
20
25
30
99/00 00/01 01/02 02/03 03/04 04/05 05/06 06/07 07/08 08/09 09/10 10/11
Calls and PremiumsGross Paid ClaimsTotal Tonnage (GT)
USD
(mill
ions
)
Ente
red
Tonn
age (
GT M
illio
ns)
-80
-70
-60
-50
-40
-30
-20
-10
0
10
20
30
40
50
-80
-70
-60
-50
-40
-30
-20
-10
0
10
20
30
40
50
Paid Technical Surplus (Deficit)Change in Estimated Outstanding ClaimsIncurred Technical Surplus (Deficit)
USD
(mill
ions
)
99/00 00/01 01/02 02/03 03/04 04/05 05/06 06/07 07/08 08/09 09/10 10/11
USD
(mill
ions
)
0
50
100
150
200
250Net Assets (Market)Free ReservesNet Outstanding Claims
0
50
100
150
200
250
USD
(mill
ions
)
99/00 00/01 01/02 02/03 03/04 04/05 05/06 06/07 07/08 08/09 09/10 10/11
Protection and Indemnity | Market Review 2011/2012 39
Club Financial Pages
Protection and Indemnity | Market Review 2011/201238
Club Financial Pages
TONNAGE SPLIT BY NATIONALITY OF MANAGEMENT
TONNAGE SPLIT BY VESSEL TYPE
bRiTanniawww.britanniapandi.com
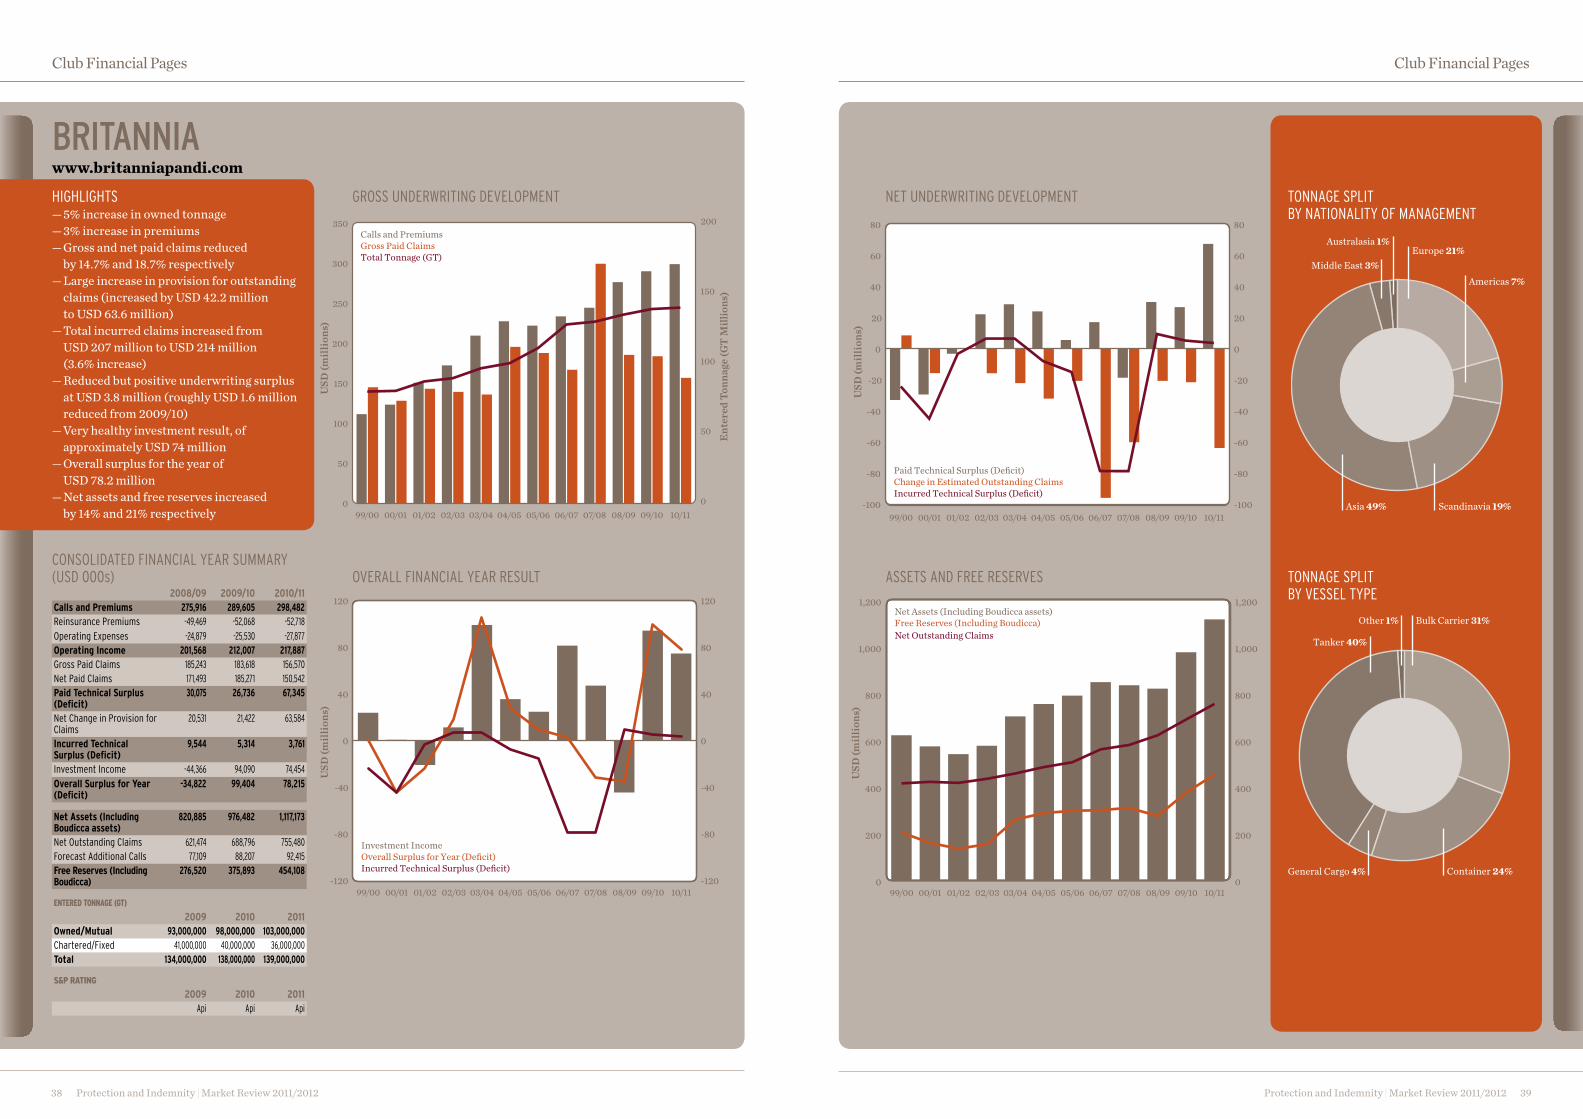
HIGHLIGHTS — 5% increase in owned tonnage — 3% increase in premiums — Gross and net paid claims reduced by 14.7% and 18.7% respectively — Large increase in provision for outstanding claims (increased by USD 42.2 million to USD 63.6 million) — Total incurred claims increased from USD 207 million to USD 214 million (3.6% increase) — Reduced but positive underwriting surplus at USD 3.8 million (roughly USD 1.6 million reduced from 2009/10) — Very healthy investment result, of approximately USD 74 million — Overall surplus for the year of USD 78.2 million — Net assets and free reserves increased by 14% and 21% respectively
CONSOLIDATED FINANCIAL YEAR SUMMARY (USD 000s)
GROSS UNDERWRITING DEVELOPMENT NET UNDERWRITING DEVELOPMENT
ASSETS AND FREE RESERVESOVERALL FINANCIAL YEAR RESULT2008/09 2009/10 2010/11
Calls and Premiums 275,916 289,605 298,482 Reinsurance Premiums -49,469 -52,068 -52,718 Operating Expenses -24,879 -25,530 -27,877 Operating Income 201,568 212,007 217,887 Gross Paid Claims 185,243 183,618 156,570 Net Paid Claims 171,493 185,271 150,542 Paid Technical Surplus (Deficit)
30,075 26,736 67,345
Net Change in Provision for Claims
20,531 21,422 63,584
Incurred Technical Surplus (Deficit)
9,544 5,314 3,761
Investment Income -44,366 94,090 74,454 Overall Surplus for Year (Deficit)
-34,822 99,404 78,215
Net Assets (Including Boudicca assets)
820,885 976,482 1,117,173
Net Outstanding Claims 621,474 688,796 755,480 Forecast Additional Calls 77,109 88,207 92,415 Free Reserves (Including Boudicca)
276,520 375,893 454,108
EntErEd tonnagE (gt)
2009 2010 2011Owned/Mutual 93,000,000 98,000,000 103,000,000 Chartered/Fixed 41,000,000 40,000,000 36,000,000 Total 134,000,000 138,000,000 139,000,000
S&P rating
2009 2010 2011 Api Api Api
Europe 21%
Americas 7%
Asia 49% Scandinavia 19%
Australasia 1%
Middle East 3%
Container 24%General Cargo 4%
Other 1%
Tanker 40%
Bulk Carrier 31%
-100
-60
-80
-40
-20
0
20
40
60
80
-100
-60
-80
-40
-20
0
20
40
60
80
Paid Technical Surplus (Deficit)Change in Estimated Outstanding ClaimsIncurred Technical Surplus (Deficit)
USD
(mill
ions
)
99/00 00/01 01/02 02/03 03/04 04/05 05/06 06/07 07/08 08/09 09/10 10/11
0
200
400
600
800
1,000
1,200
0
200
400
600
800
1,000
1,200Net Assets (Including Boudicca assets)Free Reserves (Including Boudicca)Net Outstanding Claims
USD
(mill
ions
)
99/00 00/01 01/02 02/03 03/04 04/05 05/06 06/07 07/08 08/09 09/10 10/11
0
50
200
100
150
250
300
350
0
50
100
150
200
99/00 00/01 01/02 02/03 03/04 04/05 05/06 06/07 07/08 08/09 09/10 10/11
Calls and PremiumsGross Paid ClaimsTotal Tonnage (GT)
USD
(mill
ions
)
Ente
red
Tonn
age (
GT M
illio
ns)
-120
-80
-40
0
40
80
120
-120
-80
-40
0
40
80
120
Investment IncomeOverall Surplus for Year (Deficit)Incurred Technical Surplus (Deficit)
USD
(mill
ions
)
99/00 00/01 01/02 02/03 03/04 04/05 05/06 06/07 07/08 08/09 09/10 10/11
Protection and Indemnity | Market Review 2011/2012 41
Club Financial Pages
Protection and Indemnity | Market Review 2011/201240
Club Financial Pages
TONNAGE SPLIT BY NATIONALITY OF MANAGEMENT
TONNAGE SPLIT BY VESSEL TYPE
gaRDwww.gard.no
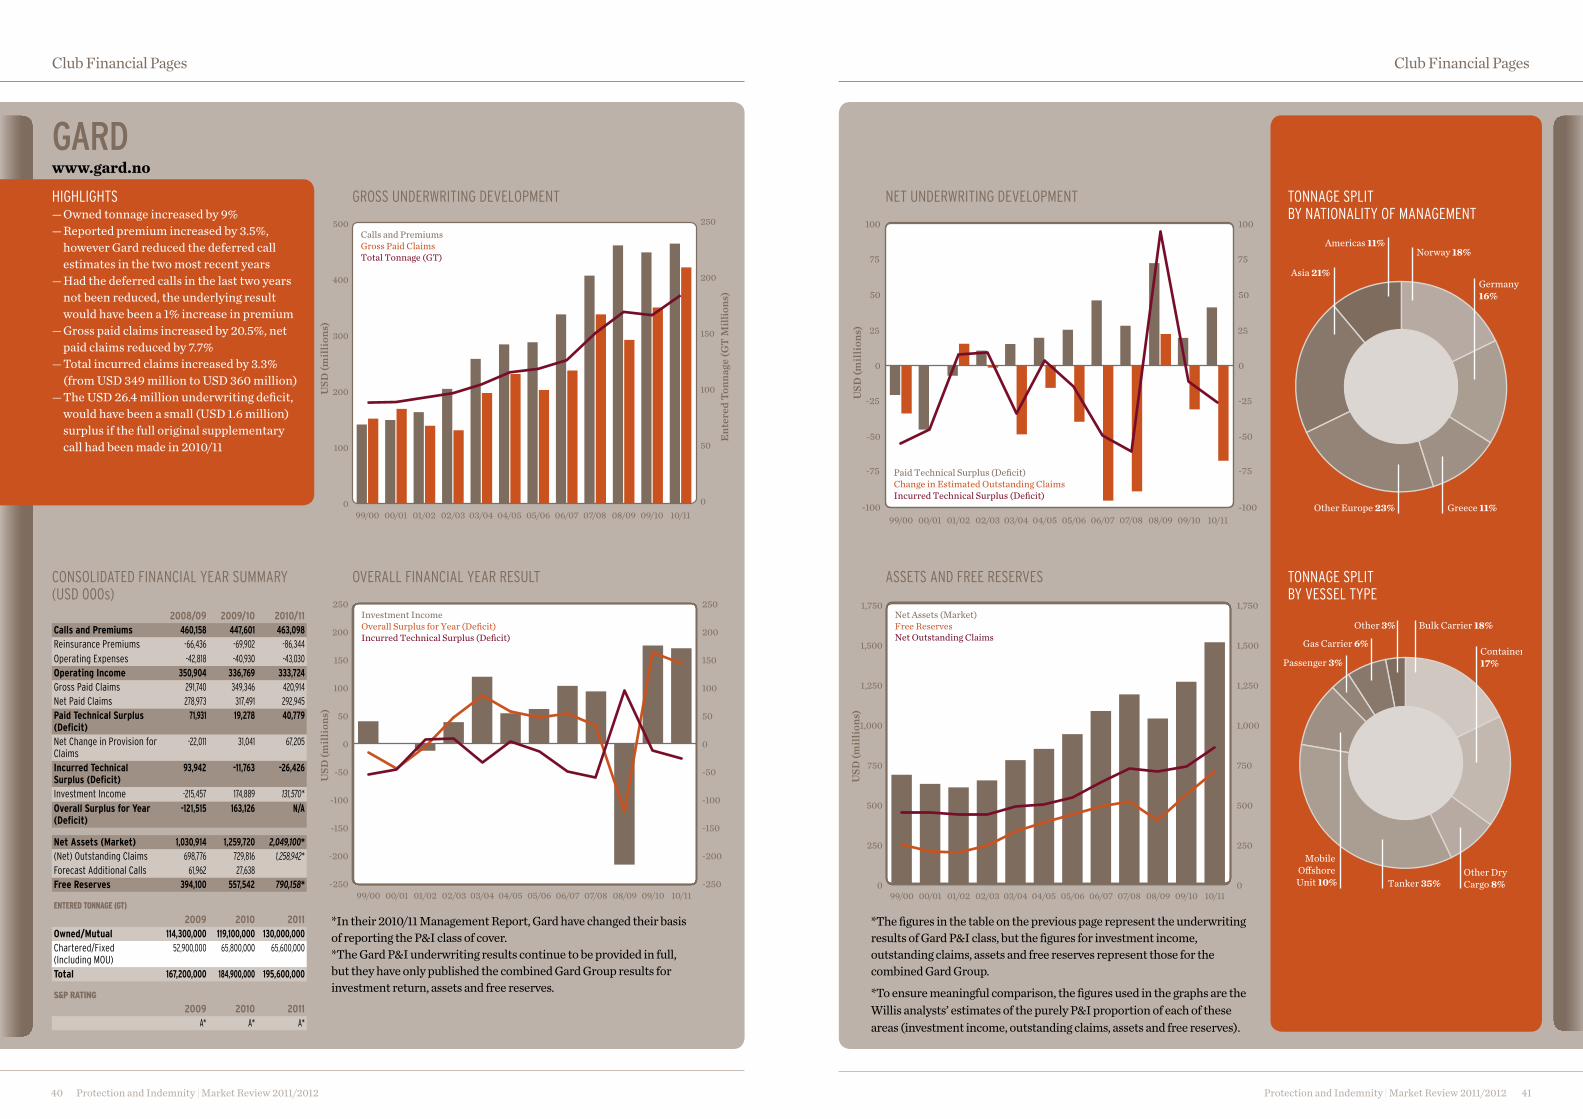
HIGHLIGHTS — Owned tonnage increased by 9% — Reported premium increased by 3.5%, however Gard reduced the deferred call estimates in the two most recent years — Had the deferred calls in the last two years not been reduced, the underlying result would have been a 1% increase in premium — Gross paid claims increased by 20.5%, net paid claims reduced by 7.7% — Total incurred claims increased by 3.3% (from USD 349 million to USD 360 million) — The USD 26.4 million underwriting deficit, would have been a small (USD 1.6 million) surplus if the full original supplementary call had been made in 2010/11
CONSOLIDATED FINANCIAL YEAR SUMMARY (USD 000s)
GROSS UNDERWRITING DEVELOPMENT NET UNDERWRITING DEVELOPMENT
ASSETS AND FREE RESERVESOVERALL FINANCIAL YEAR RESULT
2008/09 2009/10 2010/11Calls and Premiums 460,158 447,601 463,098 Reinsurance Premiums -66,436 -69,902 -86,344 Operating Expenses -42,818 -40,930 -43,030 Operating Income 350,904 336,769 333,724 Gross Paid Claims 291,740 349,346 420,914 Net Paid Claims 278,973 317,491 292,945 Paid Technical Surplus (Deficit)
71,931 19,278 40,779
Net Change in Provision for Claims
-22,011 31,041 67,205
Incurred Technical Surplus (Deficit)
93,942 -11,763 -26,426
Investment Income -215,457 174,889 131,570* Overall Surplus for Year (Deficit)
-121,515 163,126 N/A
Net Assets (Market) 1,030,914 1,259,720 2,049,100* (Net) Outstanding Claims 698,776 729,816 1,258,942*Forecast Additional Calls 61,962 27,638 Free Reserves 394,100 557,542 790,158*
EntErEd tonnagE (gt)
2009 2010 2011Owned/Mutual 114,300,000 119,100,000 130,000,000 Chartered/Fixed (Including MOU)
52,900,000 65,800,000 65,600,000
Total 167,200,000 184,900,000 195,600,000
S&P rating
2009 2010 2011 A* A* A*
Norway 18%
Germany 16%
Other Europe 23% Greece 11%
Americas 11%
Asia 21%
Other Dry Cargo 8%
Mobile O�shore Unit 10% Tanker 35%
Bulk Carrier 18%
Container 17%
Gas Carrier 6%
Passenger 3%
Other 3%
0
200
100
300
400
500
0
50
100
150
200
250
99/00 00/01 01/02 02/03 03/04 04/05 05/06 06/07 07/08 08/09 09/10 10/11
Calls and PremiumsGross Paid ClaimsTotal Tonnage (GT)
USD
(mill
ions
)
Ente
red
Tonn
age (
GT M
illio
ns)
-100
-50
50
0
100
-100
-50
50
0
100
Paid Technical Surplus (Deficit)Change in Estimated Outstanding ClaimsIncurred Technical Surplus (Deficit)
USD
(mill
ions
)
99/00 00/01 01/02 02/03 03/04 04/05 05/06 06/07 07/08 08/09 09/10 10/11
75
25
-25
-75
75
25
-25
-75
0
500
750
250
1,000
1,250
1,500
1,750
0
500
750
250
1,000
1,250
1,500
1,750Net Assets (Market)Free Reserves Net Outstanding Claims
USD
(mill
ions
)
99/00 00/01 01/02 02/03 03/04 04/05 05/06 06/07 07/08 08/09 09/10 10/11-250
-200
-150
-100
-50
0
50
200
150
100
250
-250
-200
-150
-100
-50
0
50
200
150
100
250Investment IncomeOverall Surplus for Year (Deficit)Incurred Technical Surplus (Deficit)
USD
(mill
ions
)
99/00 00/01 01/02 02/03 03/04 04/05 05/06 06/07 07/08 08/09 09/10 10/11
*In their 2010/11 Management Report, Gard have changed their basis of reporting the P&I class of cover.*The Gard P&I underwriting results continue to be provided in full, but they have only published the combined Gard Group results for investment return, assets and free reserves.
*The figures in the table on the previous page represent the underwriting results of Gard P&I class, but the figures for investment income, outstanding claims, assets and free reserves represent those for the combined Gard Group.
*To ensure meaningful comparison, the figures used in the graphs are the Willis analysts’ estimates of the purely P&I proportion of each of these areas (investment income, outstanding claims, assets and free reserves).
Protection and Indemnity | Market Review 2011/2012 43
Club Financial Pages
Protection and Indemnity | Market Review 2011/201242
Club Financial Pages
TONNAGE SPLIT BY REGISTRY
TONNAGE SPLIT BY VESSEL TYPE
Investment IncomeOverall Surplus for Year (Deficit)Incurred Technical Surplus (Deficit)
USD
(mill
ions
)
99/00 00/01 01/02 02/03 03/04 04/05 05/06 06/07 07/08 08/09 09/10 10/11-25
-15
-5
5
15
25
35
-25
-15
-5
5
15
25
35
-30
-20
-10
0
10
20
30
40
50
60
-30
-20
-10
0
10
20
30
40
50
60Paid Technical Surplus (Deficit)Change in Estimated Outstanding ClaimsIncurred Technical Surplus (Deficit)
USD
(mill
ions
)
99/00 00/01 01/02 02/03 03/04 04/05 05/06 06/07 07/08 08/09 09/10 10/11
jaPan P&i Clubwww.piclub.or.jp
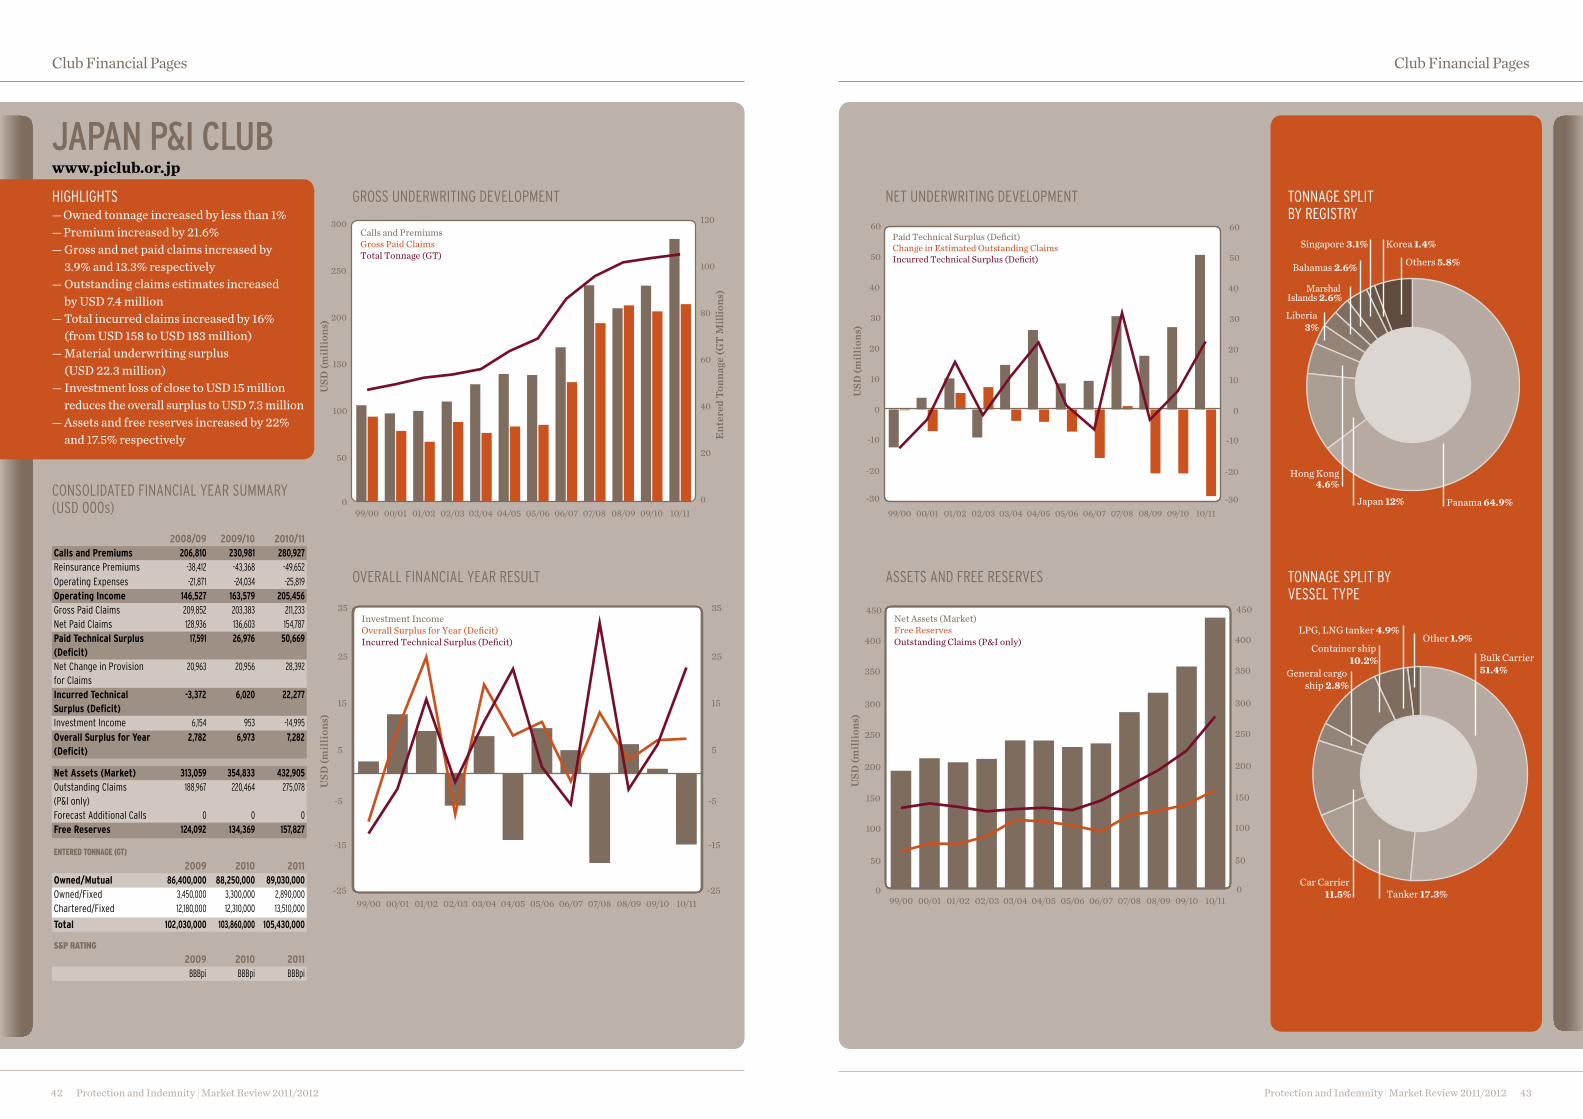
HIGHLIGHTS— Owned tonnage increased by less than 1%— Premium increased by 21.6%— Gross and net paid claims increased by
3.9% and 13.3% respectively— Outstanding claims estimates increased
by USD 7.4 million— Total incurred claims increased by 16%
(from USD 158 to USD 183 million)— Material underwriting surplus
(USD 22.3 million)— Investment loss of close to USD 15 million
reduces the overall surplus to USD 7.3 million— Assets and free reserves increased by 22%
and 17.5% respectively
0
50
100
150
200
250
300
350
400
450
0
50
100
150
200
250
300
350
400
450Net Assets (Market)Free ReservesOutstanding Claims (P&I only)
USD
(mill
ions
)
99/00 00/01 01/02 02/03 03/04 04/05 05/06 06/07 07/08 08/09 09/10 10/11
GROSS UNDERWRITING DEVELOPMENT NET UNDERWRITING DEVELOPMENT
ASSETS AND FREE RESERVESOVERALL FINANCIAL YEAR RESULT
2008/09 2009/10 2010/11Calls and Premiums 206,810 230,981 280,927 Reinsurance Premiums -38,412 -43,368 -49,652 Operating Expenses -21,871 -24,034 -25,819 Operating Income 146,527 163,579 205,456 Gross Paid Claims 209,852 203,383 211,233 Net Paid Claims 128,936 136,603 154,787 Paid Technical Surplus (Deficit)
17,591 26,976 50,669
Net Change in Provision for Claims
20,963 20,956 28,392
Incurred Technical Surplus (Deficit)
-3,372 6,020 22,277
Investment Income 6,154 953 -14,995 Overall Surplus for Year (Deficit)
2,782 6,973 7,282
Net Assets (Market) 313,059 354,833 432,905 Outstanding Claims (P&I only)
188,967 220,464 275,078
Forecast Additional Calls 0 0 0 Free Reserves 124,092 134,369 157,827
EntErEd tonnagE (gt)
2009 2010 2011Owned/Mutual 86,400,000 88,250,000 89,030,000 Owned/Fixed 3,450,000 3,300,000 2,890,000 Chartered/Fixed 12,180,000 12,310,000 13,510,000
Total 102,030,000 103,860,000 105,430,000
S&P rating
2009 2010 2011 BBBpi BBBpi BBBpi
Others 5.8%
Panama 64.9%Japan 12%
Hong Kong4.6%
Marshal Islands 2.6%Liberia
3%
Bahamas 2.6%
Singapore 3.1% Korea 1.4%
Bulk Carrier 51.4%
Other 1.9%
Tanker 17.3%Car Carrier
11.5%
General cargo ship 2.8%
Container ship 10.2%
LPG, LNG tanker 4.9%
0
50
100
150
200
250
300
0
20
40
60
80
100
120
99/00 00/01 01/02 02/03 03/04 04/05 05/06 06/07 07/08 08/09 09/10 10/11
Calls and PremiumsGross Paid ClaimsTotal Tonnage (GT)
USD
(mill
ions
)
Ente
red
Tonn
age (
GT M
illio
ns)
CONSOLIDATED FINANCIAL YEAR SUMMARY (USD 000s)
Protection and Indemnity | Market Review 2011/2012 45
Club Financial Pages
Protection and Indemnity | Market Review 2011/201244
Club Financial Pages
TONNAGE SPLIT BY NATIONALITY OF MANAGEMENT
TONNAGE SPLIT BY VESSEL TYPE
0
100
50
150
200
250
0
10
20
30
40
50
99/00 00/01 01/02 02/03 03/04 04/05 05/06 06/07 07/08 08/09 09/10 10/11
Calls and PremiumsGross Paid ClaimsTotal Tonnage (GT)
USD
(mill
ions
)
Ente
red
Tonn
age (
GT
Mill
ions
)
-50
-40
-30
-20
-10
0
10
50
40
60
30
20
80
70
-50
-40
-30
-20
-10
0
10
50
40
60
30
20
80
70Investment IncomeOverall Surplus for Year (Deficit)Incurred Technical Surplus (Deficit)
USD
(mill
ions
)
99/00 00/01 01/02 02/03 03/04 04/05 05/06 06/07 07/08 08/09 09/10 10/11
-100
-50
50
0
100
-100
-50
50
0
100Paid Technical Surplus (Deficit)Change in Estimated Outstanding ClaimsIncurred Technical Surplus (Deficit)
USD
(mill
ions
)
99/00 00/01 01/02 02/03 03/04 04/05 05/06 06/07 07/08 08/09 09/10 10/11
25
75
-25
-75
75
25
-25
-75
lOnDOn sTeam-shiPwww.lsso.com
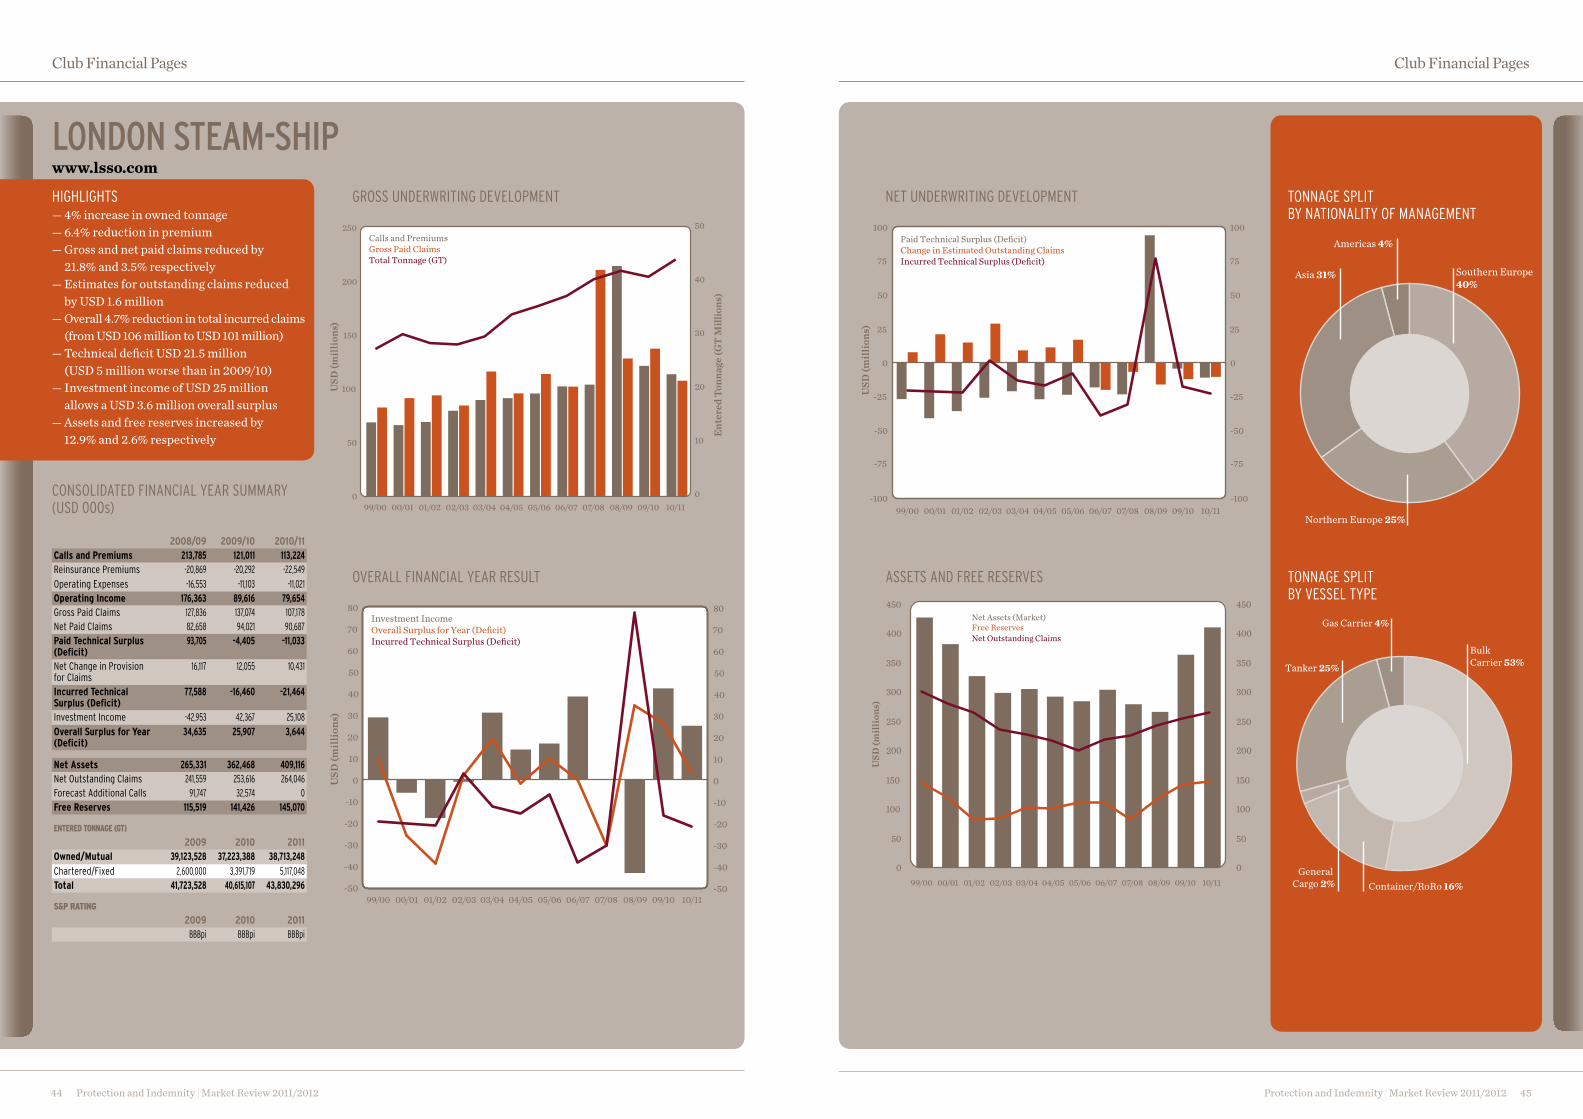
HIGHLIGHTS— 4% increase in owned tonnage — 6.4% reduction in premium— Gross and net paid claims reduced by
21.8% and 3.5% respectively— Estimates for outstanding claims reduced
by USD 1.6 million— Overall 4.7% reduction in total incurred claims
(from USD 106 million to USD 101 million)— Technical deficit USD 21.5 million
(USD 5 million worse than in 2009/10)— Investment income of USD 25 million
allows a USD 3.6 million overall surplus— Assets and free reserves increased by
12.9% and 2.6% respectively
CONSOLIDATED FINANCIAL YEAR SUMMARY (USD 000s)
0
50
100
150
200
250
300
350
400
450
0
50
100
150
200
250
300
350
400
450
99/00 00/01 01/02 02/03 03/04 04/05 05/06 06/07 07/08 08/09 09/10 10/11
Net Assets (Market)Free ReservesNet Outstanding Claims
USD
(mill
ions
)
GROSS UNDERWRITING DEVELOPMENT NET UNDERWRITING DEVELOPMENT
ASSETS AND FREE RESERVESOVERALL FINANCIAL YEAR RESULT
2008/09 2009/10 2010/11Calls and Premiums 213,785 121,011 113,224 Reinsurance Premiums -20,869 -20,292 -22,549 Operating Expenses -16,553 -11,103 -11,021 Operating Income 176,363 89,616 79,654 Gross Paid Claims 127,836 137,074 107,178 Net Paid Claims 82,658 94,021 90,687 Paid Technical Surplus (Deficit)
93,705 -4,405 -11,033
Net Change in Provision for Claims
16,117 12,055 10,431
Incurred Technical Surplus (Deficit)
77,588 -16,460 -21,464
Investment Income -42,953 42,367 25,108 Overall Surplus for Year (Deficit)
34,635 25,907 3,644
Net Assets 265,331 362,468 409,116 Net Outstanding Claims 241,559 253,616 264,046 Forecast Additional Calls 91,747 32,574 0 Free Reserves 115,519 141,426 145,070
EntErEd tonnagE (gt)
2009 2010 2011Owned/Mutual 39,123,528 37,223,388 38,713,248
Chartered/Fixed 2,600,000 3,391,719 5,117,048 Total 41,723,528 40,615,107 43,830,296
S&P rating
2009 2010 2011 BBBpi BBBpi BBBpi
Southern Europe 40%
Northern Europe 25%
Americas 4%
Asia 31%
General Cargo 2% Container/RoRo 16%
Bulk Carrier 53%Tanker 25%
Gas Carrier 4%
Protection and Indemnity | Market Review 2011/2012 47
Club Financial Pages
Protection and Indemnity | Market Review 2011/201246
Club Financial Pages
TONNAGE SPLIT BY MANAGEMENT
TONNAGE SPLIT BY VESSEL TYPE
0
50
100
150
200
300
250
350
0
20
40
60
80
100
120
140
160
99/00 00/01 01/02 02/03 03/04 04/05 05/06 06/07 07/08 08/09 09/10 10/11
Calls and PremiumsGross Paid ClaimsTotal Tonnage (GT)
USD
(mill
ions
)
Ente
red
Tonn
age (
GT
Mill
ions
)
-50
-40
-30
-20
-10
10
0
20
60
50
40
30
80
70
-50
-40
-30
-20
-10
10
0
20
60
50
40
30
80
70Investment IncomeOverall Surplus for Year (Deficit)Incurred Technical Surplus (Deficit)
USD
(mill
ions
)
99/00 00/01 01/02 02/03 03/04 04/05 05/06 06/07 07/08 08/09 09/10 10/11
-80
-60
-40
-20
0
20
40
60
80
100
-80
-60
-40
-20
0
20
40
60
80
100Paid Technical Surplus (Deficit)Change in Estimated Outstanding ClaimsIncurred Technical Surplus (Deficit)
USD
(mill
ions
)
99/00 00/01 01/02 02/03 03/04 04/05 05/06 06/07 07/08 08/09 09/10 10/11
nORTh OF englanD Clubwww.nepia.com
HIGHLIGHTS— Owned tonnage increased by 21%— Premium increased by 10%— Gross and net paid claims reduced
by 24% and 29% respectively— USD 31.5 million increase in provisions
for outstanding claims— Total incurred claims reduced from USD 190
to USD 156 million (18% reduction)— Substantial USD 54.8 million
underwriting surplus — A relatively modest, but consistent,
USD 16.8 million investment result (reflecting the club’s conservative investment strategy)
— USD 71.6 million overall surplus for the year. Uniquely within the IG, a considerable surplus driven by underwriting rather than investment income
— Net assets and free reserves increased by 21.5% and 31.1% respectively
CONSOLIDATED FINANCIAL YEAR SUMMARY (USD 000s)
0
100
200
300
400
500
600
700
800
900
1,000
0
100
200
300
400
500
600
700
800
900
1,000Net Assets (Market)Free Reserves Net Outstanding Claims
USD
(mill
ions
)
99/00 00/01 01/02 02/03 03/04 04/05 05/06 06/07 07/08 08/09 09/10 10/11
GROSS UNDERWRITING DEVELOPMENT NET UNDERWRITING DEVELOPMENT
ASSETS AND FREE RESERVESOVERALL FINANCIAL YEAR RESULT
2008/09 2009/10 2010/11Calls and Premiums 255,082 285,051 314,243 Reinsurance Premiums -44,177 -47,619 -59,738 Operating Expenses -34,024 -35,811 -43,721 Operating Income 176,881 201,621 210,784 Gross Paid Claims 162,405 188,551 142,485 Net Paid Claims 148,661 176,403 124,424 Paid Technical Surplus (Deficit)
28,220 25,218 86,360
Net Change in Provision for Claims
-6,435 14,066 31,532
Incurred Technical Surplus (Deficit)
34,655 11,152 54,828
Investment Income -40,407 17,222 16,782 Overall Surplus for Year (Deficit)
-5,752 28,374 71,610
Net Assets (Market) 663,480 706,697 810,400 Net Outstanding Claims 452,368 466,435 497,966 Forecast Additional Calls 0 0 0 Free Reserves 211,112 240,262 312,434
EntErEd tonnagE (gt)
2009 2010 2011Owned/Mutual 75,000,000 86,400,000 105,000,000 Chartered/Fixed 23,700,000 28,000,000 45,000,000 Total 98,700,000 114,400,000 150,000,000
S&P rating
2009 2010 2011 A* A* A*
Europe 55%
Asia Pacific 24%
Americas 8%
Middle East 13%
Container 21%LNG 3%
Bulk Carrier28%
Tanker 38%
Other 6%
Car Carrier 4%
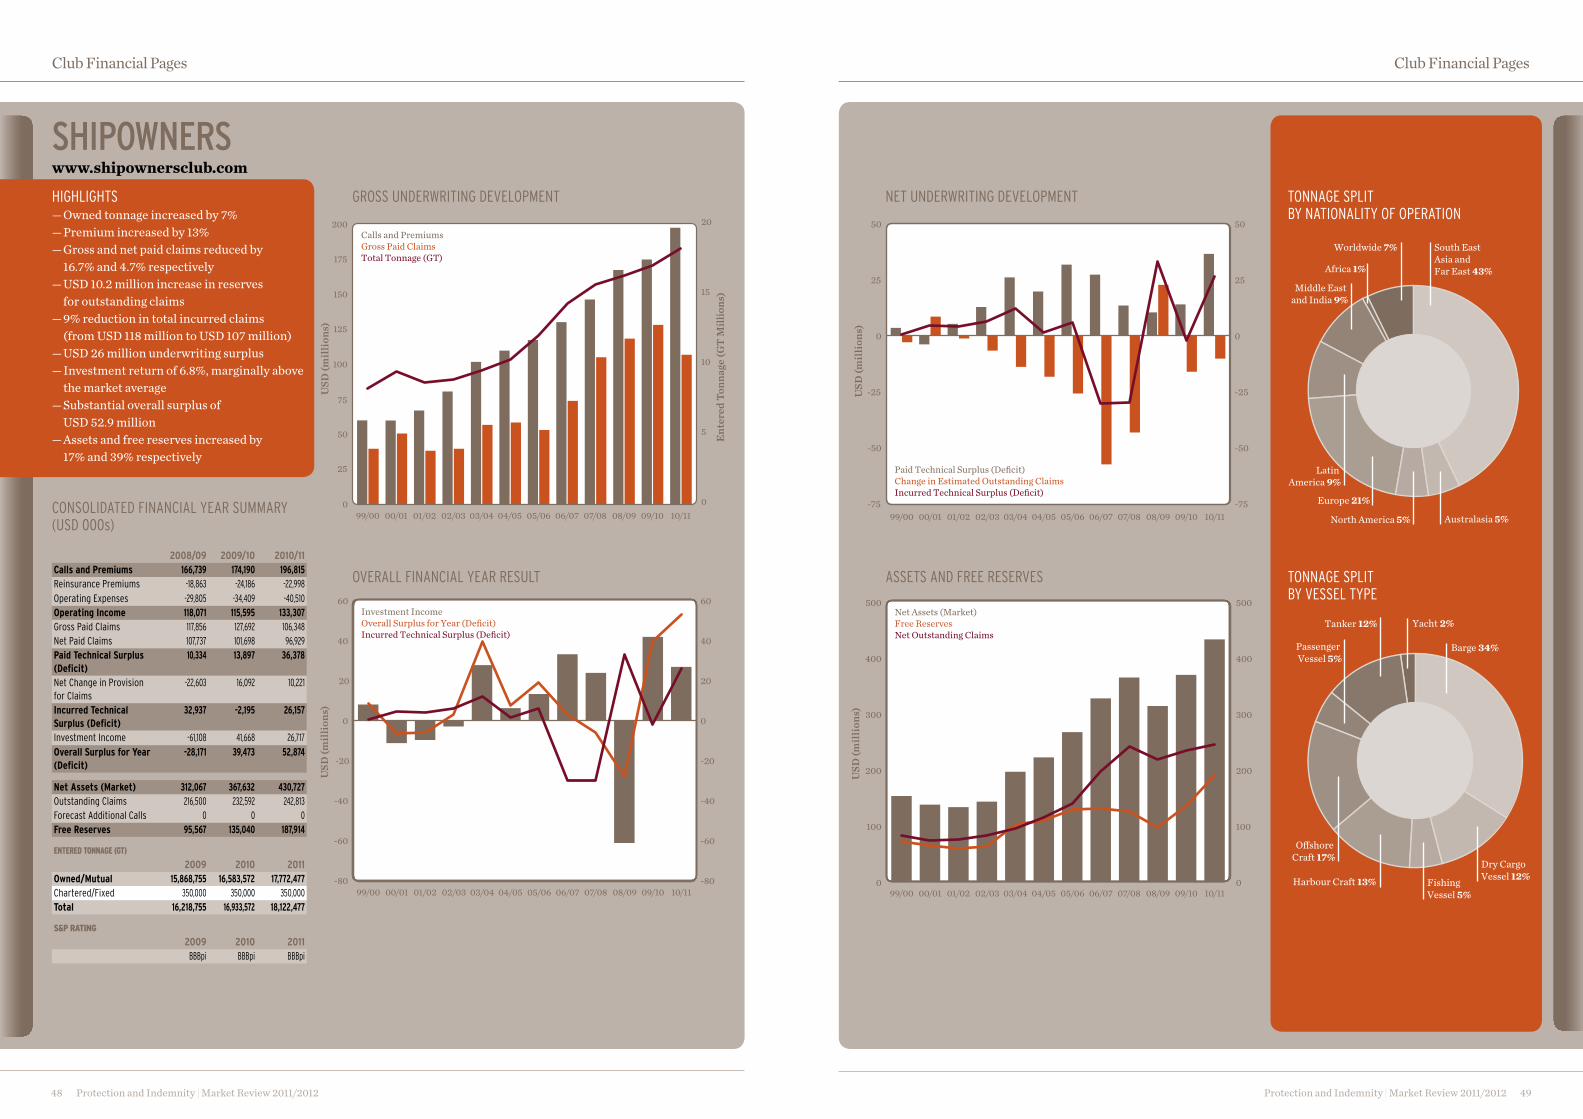
Protection and Indemnity | Market Review 2011/2012 49
Club Financial Pages
Protection and Indemnity | Market Review 2011/201248
Club Financial Pages
TONNAGE SPLIT BY NATIONALITY OF OPERATION
TONNAGE SPLIT BY VESSEL TYPE
shiPOwneRswww.shipownersclub.com
HIGHLIGHTS — Owned tonnage increased by 7% — Premium increased by 13% — Gross and net paid claims reduced by 16.7% and 4.7% respectively — USD 10.2 million increase in reserves for outstanding claims — 9% reduction in total incurred claims (from USD 118 million to USD 107 million) — USD 26 million underwriting surplus — Investment return of 6.8%, marginally above the market average — Substantial overall surplus of USD 52.9 million — Assets and free reserves increased by 17% and 39% respectively
CONSOLIDATED FINANCIAL YEAR SUMMARY (USD 000s)
GROSS UNDERWRITING DEVELOPMENT NET UNDERWRITING DEVELOPMENT
ASSETS AND FREE RESERVESOVERALL FINANCIAL YEAR RESULT
2008/09 2009/10 2010/11Calls and Premiums 166,739 174,190 196,815 Reinsurance Premiums -18,863 -24,186 -22,998 Operating Expenses -29,805 -34,409 -40,510 Operating Income 118,071 115,595 133,307 Gross Paid Claims 117,856 127,692 106,348 Net Paid Claims 107,737 101,698 96,929 Paid Technical Surplus (Deficit)
10,334 13,897 36,378
Net Change in Provision for Claims
-22,603 16,092 10,221
Incurred Technical Surplus (Deficit)
32,937 -2,195 26,157
Investment Income -61,108 41,668 26,717 Overall Surplus for Year (Deficit)
-28,171 39,473 52,874
Net Assets (Market) 312,067 367,632 430,727 Outstanding Claims 216,500 232,592 242,813 Forecast Additional Calls 0 0 0 Free Reserves 95,567 135,040 187,914
EntErEd tonnagE (gt)
2009 2010 2011Owned/Mutual 15,868,755 16,583,572 17,772,477 Chartered/Fixed 350,000 350,000 350,000 Total 16,218,755 16,933,572 18,122,477
S&P rating
2009 2010 2011 BBBpi BBBpi BBBpi
0
50
100
150
200
0
5
10
15
20
99/00 00/01 01/02 02/03 03/04 04/05 05/06 06/07 07/08 08/09 09/10 10/11
Calls and PremiumsGross Paid ClaimsTotal Tonnage (GT)
USD
(mill
ions
)
Ente
red
Tonn
age (
GT M
illio
ns)
25
75
125
175
-75
-50
-25
0
25
50
-75
-50
-25
0
25
50
Paid Technical Surplus (Deficit)Change in Estimated Outstanding ClaimsIncurred Technical Surplus (Deficit)
USD
(mill
ions
)
99/00 00/01 01/02 02/03 03/04 04/05 05/06 06/07 07/08 08/09 09/10 10/11
-80
-40
-60
-20
0
20
40
60
-80
-40
-60
-20
0
20
40
60Investment IncomeOverall Surplus for Year (Deficit)Incurred Technical Surplus (Deficit)
USD
(mill
ions
)
99/00 00/01 01/02 02/03 03/04 04/05 05/06 06/07 07/08 08/09 09/10 10/110
100
200
300
500
0
100
200
300
500
400 400
Net Assets (Market)Free Reserves Net Outstanding Claims
USD
(mill
ions
)
99/00 00/01 01/02 02/03 03/04 04/05 05/06 06/07 07/08 08/09 09/10 10/11
South East Asia and Far East 43%
Latin America 9%
Australasia 5%North America 5%
Europe 21%
Worldwide 7%
Africa 1%
Middle East and India 9%
Fishing Vessel 5%
Dry Cargo Vessel 12%Harbour Craft 13%
Oshore Craft 17%
Yacht 2%
Barge 34%
Tanker 12%
Passenger Vessel 5%
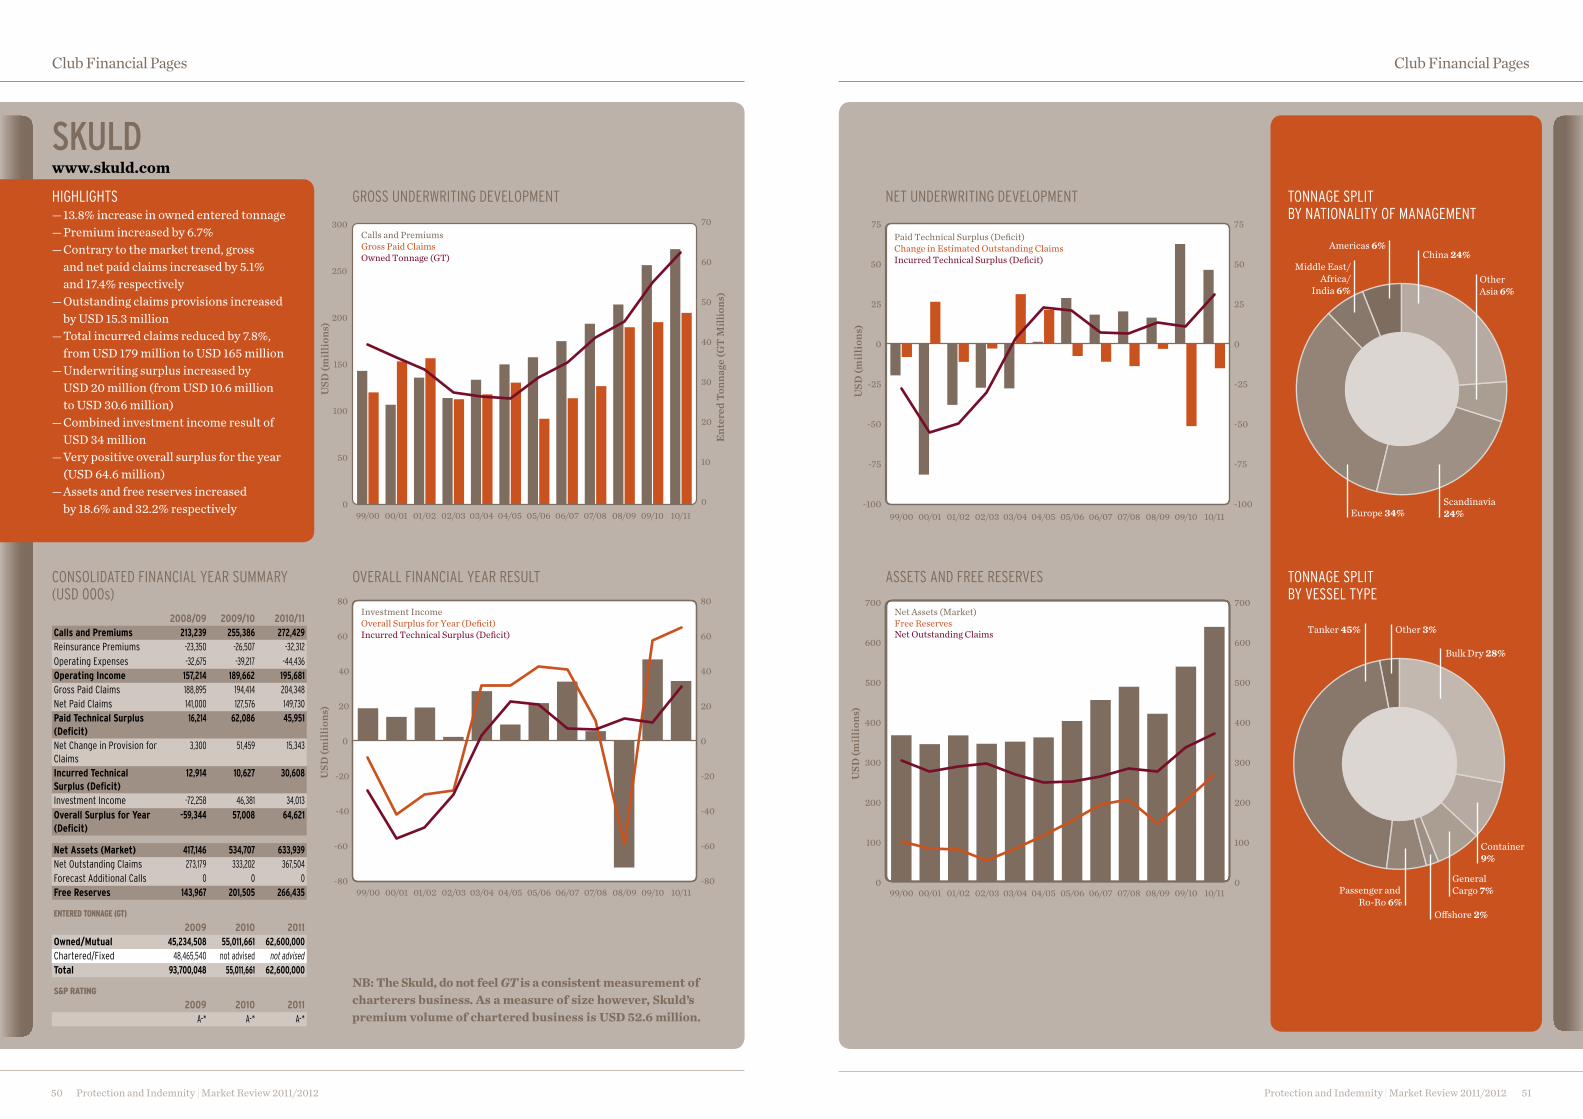
Protection and Indemnity | Market Review 2011/2012 51
Club Financial Pages
Protection and Indemnity | Market Review 2011/201250
Club Financial Pages
TONNAGE SPLIT BY NATIONALITY OF MANAGEMENT
TONNAGE SPLIT BY VESSEL TYPE
skulDwww.skuld.com
HIGHLIGHTS — 13.8% increase in owned entered tonnage — Premium increased by 6.7% — Contrary to the market trend, gross and net paid claims increased by 5.1% and 17.4% respectively — Outstanding claims provisions increased by USD 15.3 million — Total incurred claims reduced by 7.8%, from USD 179 million to USD 165 million — Underwriting surplus increased by USD 20 million (from USD 10.6 million to USD 30.6 million) — Combined investment income result of USD 34 million — Very positive overall surplus for the year (USD 64.6 million) — Assets and free reserves increased by 18.6% and 32.2% respectively
CONSOLIDATED FINANCIAL YEAR SUMMARY (USD 000s)
GROSS UNDERWRITING DEVELOPMENT NET UNDERWRITING DEVELOPMENT
ASSETS AND FREE RESERVESOVERALL FINANCIAL YEAR RESULT
2008/09 2009/10 2010/11Calls and Premiums 213,239 255,386 272,429 Reinsurance Premiums -23,350 -26,507 -32,312 Operating Expenses -32,675 -39,217 -44,436 Operating Income 157,214 189,662 195,681 Gross Paid Claims 188,895 194,414 204,348 Net Paid Claims 141,000 127,576 149,730 Paid Technical Surplus (Deficit)
16,214 62,086 45,951
Net Change in Provision for Claims
3,300 51,459 15,343
Incurred Technical Surplus (Deficit)
12,914 10,627 30,608
Investment Income -72,258 46,381 34,013 Overall Surplus for Year (Deficit)
-59,344 57,008 64,621
Net Assets (Market) 417,146 534,707 633,939 Net Outstanding Claims 273,179 333,202 367,504 Forecast Additional Calls 0 0 0 Free Reserves 143,967 201,505 266,435
EntErEd tonnagE (gt)
2009 2010 2011Owned/Mutual 45,234,508 55,011,661 62,600,000 Chartered/Fixed 48,465,540 not advised not advised Total 93,700,048 55,011,661 62,600,000
S&P rating
2009 2010 2011 A-* A-* A-*
NB: The Skuld, do not feel GT is a consistent measurement of charterers business. As a measure of size however, Skuld’s premium volume of chartered business is USD 52.6 million.
0
50
100
150
300
250
200
0
10
20
30
40
50
60
70
99/00 00/01 01/02 02/03 03/04 04/05 05/06 06/07 07/08 08/09 09/10 10/11
Calls and PremiumsGross Paid ClaimsOwned Tonnage (GT)
USD
(mill
ions
)
Ente
red
Tonn
age (
GT M
illio
ns)
-100
-75
-50
-25
0
25
50
75
-100
-75
-50
-25
0
25
50
75Paid Technical Surplus (Deficit)Change in Estimated Outstanding ClaimsIncurred Technical Surplus (Deficit)
USD
(mill
ions
)
99/00 00/01 01/02 02/03 03/04 04/05 05/06 06/07 07/08 08/09 09/10 10/11
-80
-60
-40
-20
0
40
20
60
80
-80
-60
-40
-20
0
40
20
60
80Investment IncomeOverall Surplus for Year (Deficit)Incurred Technical Surplus (Deficit)
USD
(mill
ions
)
99/00 00/01 01/02 02/03 03/04 04/05 05/06 06/07 07/08 08/09 09/10 10/110
300
200
100
400
500
600
700
0
300
200
100
400
500
600
700Net Assets (Market)Free ReservesNet Outstanding Claims
USD
(mill
ions
)
99/00 00/01 01/02 02/03 03/04 04/05 05/06 06/07 07/08 08/09 09/10 10/11
China 24%
Other Asia 6%
Europe 34%Scandinavia 24%
Americas 6%
Middle East/Africa/
India 6%
O�shore 2%
General Cargo 7%
Container 9%
Passenger and Ro-Ro 6%
Bulk Dry 28%
Other 3%Tanker 45%
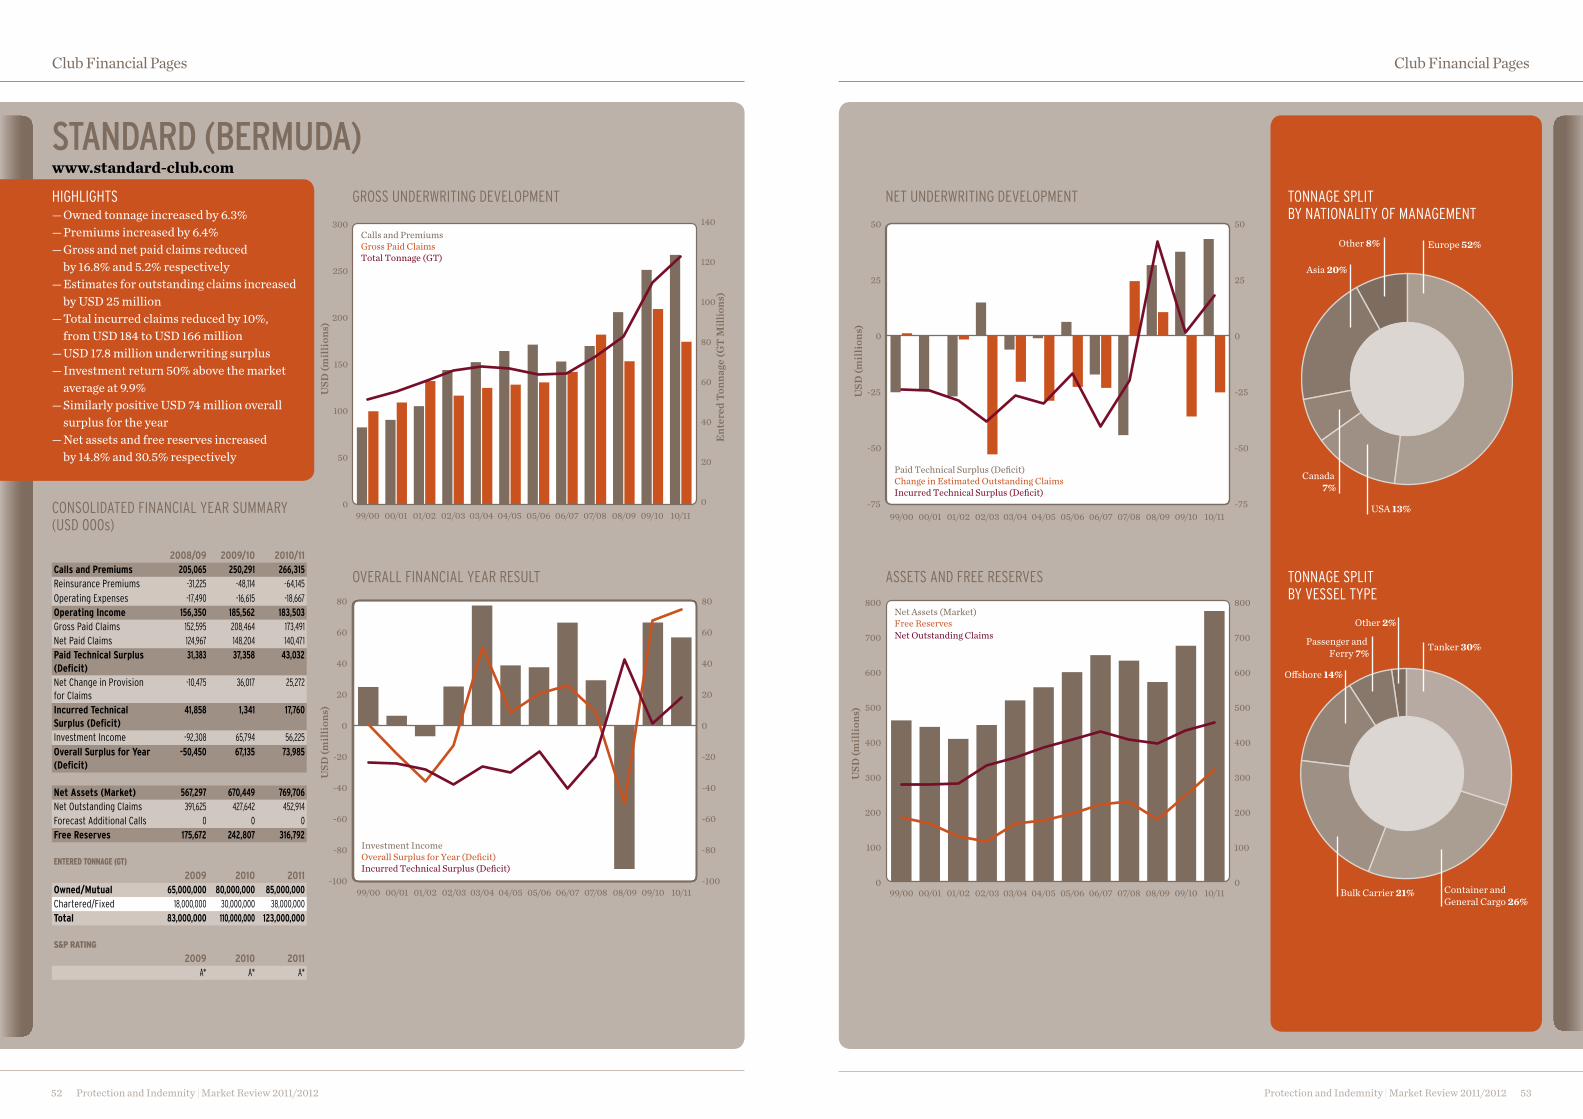
Protection and Indemnity | Market Review 2011/2012 53
Club Financial Pages
Protection and Indemnity | Market Review 2011/201252
Club Financial Pages
TONNAGE SPLIT BY NATIONALITY OF MANAGEMENT
TONNAGE SPLIT BY VESSEL TYPE
sTanDaRD (beRmuDa)www.standard-club.com
HIGHLIGHTS — Owned tonnage increased by 6.3% — Premiums increased by 6.4% — Gross and net paid claims reduced by 16.8% and 5.2% respectively — Estimates for outstanding claims increased by USD 25 million — Total incurred claims reduced by 10%, from USD 184 to USD 166 million — USD 17.8 million underwriting surplus — Investment return 50% above the market average at 9.9% — Similarly positive USD 74 million overall surplus for the year — Net assets and free reserves increased by 14.8% and 30.5% respectively
CONSOLIDATED FINANCIAL YEAR SUMMARY (USD 000s)
GROSS UNDERWRITING DEVELOPMENT NET UNDERWRITING DEVELOPMENT
ASSETS AND FREE RESERVESOVERALL FINANCIAL YEAR RESULT
2008/09 2009/10 2010/11Calls and Premiums 205,065 250,291 266,315 Reinsurance Premiums -31,225 -48,114 -64,145 Operating Expenses -17,490 -16,615 -18,667 Operating Income 156,350 185,562 183,503 Gross Paid Claims 152,595 208,464 173,491 Net Paid Claims 124,967 148,204 140,471 Paid Technical Surplus (Deficit)
31,383 37,358 43,032
Net Change in Provision for Claims
-10,475 36,017 25,272
Incurred Technical Surplus (Deficit)
41,858 1,341 17,760
Investment Income -92,308 65,794 56,225 Overall Surplus for Year (Deficit)
-50,450 67,135 73,985
Net Assets (Market) 567,297 670,449 769,706 Net Outstanding Claims 391,625 427,642 452,914 Forecast Additional Calls 0 0 0 Free Reserves 175,672 242,807 316,792
EntErEd tonnagE (gt)
2009 2010 2011Owned/Mutual 65,000,000 80,000,000 85,000,000 Chartered/Fixed 18,000,000 30,000,000 38,000,000 Total 83,000,000 110,000,000 123,000,000
S&P rating
2009 2010 2011 A* A* A*
0
150
100
50
200
250
300
0
20
40
60
80
100
120
140
99/00 00/01 01/02 02/03 03/04 04/05 05/06 06/07 07/08 08/09 09/10 10/11
Calls and PremiumsGross Paid ClaimsTotal Tonnage (GT)
USD
(mill
ions
)
Ente
red
Tonn
age (
GT M
illio
ns)
-75
-50
-25
0
25
50
-75
-50
-25
0
25
50
Paid Technical Surplus (Deficit)Change in Estimated Outstanding ClaimsIncurred Technical Surplus (Deficit)
USD
(mill
ions
)
99/00 00/01 01/02 02/03 03/04 04/05 05/06 06/07 07/08 08/09 09/10 10/11
-100
-80
-40
-60
-20
0
20
40
60
80
-100
-80
-40
-60
-20
0
20
40
60
80
Investment IncomeOverall Surplus for Year (Deficit)Incurred Technical Surplus (Deficit)
USD
(mill
ions
)
99/00 00/01 01/02 02/03 03/04 04/05 05/06 06/07 07/08 08/09 09/10 10/110
300
200
100
400
500
600
800
700
0
300
200
100
400
500
600
800
700
Net Assets (Market)Free ReservesNet Outstanding Claims
USD
(mill
ions
)
99/00 00/01 01/02 02/03 03/04 04/05 05/06 06/07 07/08 08/09 09/10 10/11
Europe 52%
Canada 7%
USA 13%
Other 8%
Asia 20%
Container and General Cargo 26%
Bulk Carrier 21%
Tanker 30%
O shore 14%
Passenger and Ferry 7%
Other 2%
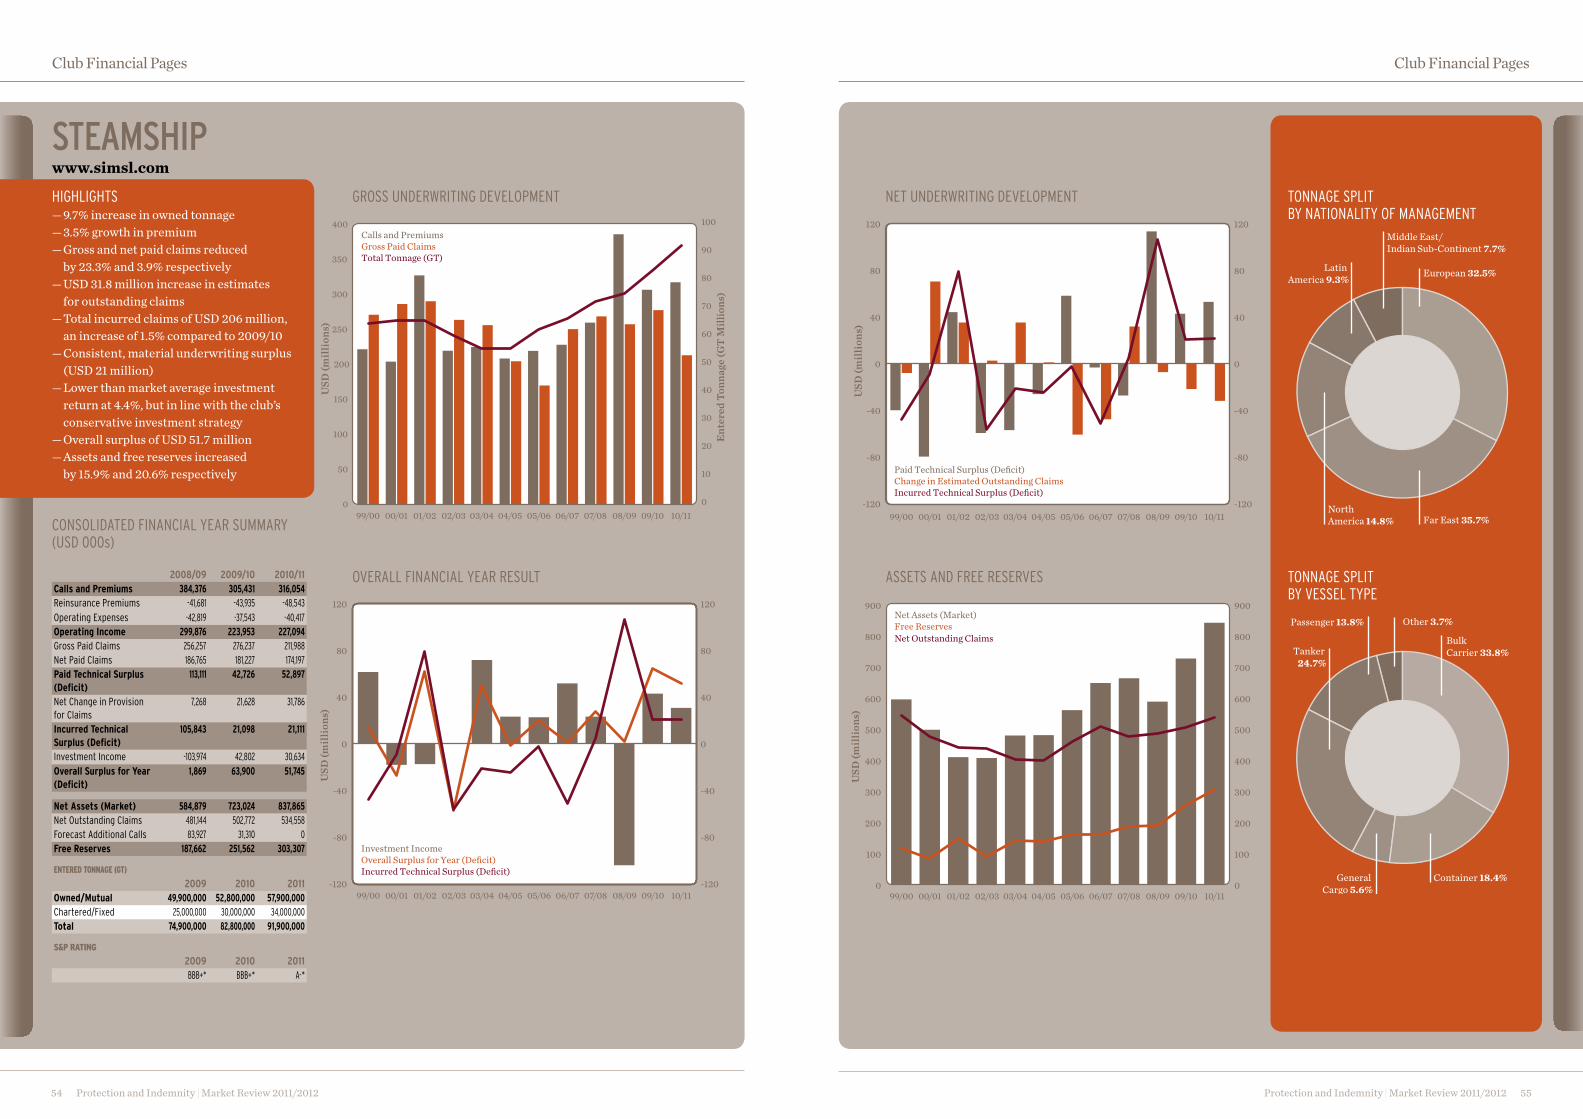
Protection and Indemnity | Market Review 2011/2012 55
Club Financial Pages
Protection and Indemnity | Market Review 2011/201254
Club Financial Pages
TONNAGE SPLIT BY NATIONALITY OF MANAGEMENT
TONNAGE SPLIT BY VESSEL TYPE
sTeamshiPwww.simsl.com
HIGHLIGHTS — 9.7% increase in owned tonnage — 3.5% growth in premium — Gross and net paid claims reduced by 23.3% and 3.9% respectively — USD 31.8 million increase in estimates for outstanding claims — Total incurred claims of USD 206 million, an increase of 1.5% compared to 2009/10 — Consistent, material underwriting surplus (USD 21 million) — Lower than market average investment return at 4.4%, but in line with the club’s conservative investment strategy — Overall surplus of USD 51.7 million — Assets and free reserves increased by 15.9% and 20.6% respectively
CONSOLIDATED FINANCIAL YEAR SUMMARY (USD 000s)
GROSS UNDERWRITING DEVELOPMENT NET UNDERWRITING DEVELOPMENT
ASSETS AND FREE RESERVESOVERALL FINANCIAL YEAR RESULT2008/09 2009/10 2010/11Calls and Premiums 384,376 305,431 316,054 Reinsurance Premiums -41,681 -43,935 -48,543 Operating Expenses -42,819 -37,543 -40,417 Operating Income 299,876 223,953 227,094 Gross Paid Claims 256,257 276,237 211,988 Net Paid Claims 186,765 181,227 174,197 Paid Technical Surplus (Deficit)
113,111 42,726 52,897
Net Change in Provision for Claims
7,268 21,628 31,786
Incurred Technical Surplus (Deficit)
105,843 21,098 21,111
Investment Income -103,974 42,802 30,634 Overall Surplus for Year (Deficit)
1,869 63,900 51,745
Net Assets (Market) 584,879 723,024 837,865 Net Outstanding Claims 481,144 502,772 534,558 Forecast Additional Calls 83,927 31,310 0 Free Reserves 187,662 251,562 303,307
EntErEd tonnagE (gt)
2009 2010 2011Owned/Mutual 49,900,000 52,800,000 57,900,000 Chartered/Fixed 25,000,000 30,000,000 34,000,000 Total 74,900,000 82,800,000 91,900,000
S&P rating
2009 2010 2011 BBB+* BBB+* A-*
European 32.5%
North America 14.8% Far East 35.7%
Middle East/Indian Sub-Continent 7.7%
Latin America 9.3%
Container 18.4%General Cargo 5.6%
Other 3.7%Passenger 13.8%
Tanker 24.7%
Bulk Carrier 33.8%
0
50
100
150
200
400
350
300
250
0
10
20
30
40
50
70
60
100
90
80
99/00 00/01 01/02 02/03 03/04 04/05 05/06 06/07 07/08 08/09 09/10 10/11
Calls and PremiumsGross Paid ClaimsTotal Tonnage (GT)
USD
(mill
ions
)
Ente
red
Tonn
age (
GT M
illio
ns)
-120
-80
-40
40
0
80
120
-120
-80
-40
40
0
80
120
Paid Technical Surplus (Deficit)Change in Estimated Outstanding ClaimsIncurred Technical Surplus (Deficit)
USD
(mill
ions
)
99/00 00/01 01/02 02/03 03/04 04/05 05/06 06/07 07/08 08/09 09/10 10/11
0
300
200
100
400
500
600
900
700
800
0
300
200
100
400
500
600
900
800
700
Net Assets (Market)Free Reserves Net Outstanding Claims
USD
(mill
ions
)
99/00 00/01 01/02 02/03 03/04 04/05 05/06 06/07 07/08 08/09 09/10 10/11
Investment IncomeOverall Surplus for Year (Deficit)Incurred Technical Surplus (Deficit)
USD
(mill
ions
)
99/00 00/01 01/02 02/03 03/04 04/05 05/06 06/07 07/08 08/09 09/10 10/11-120
-80
-40
40
80
120
0
-120
-80
-40
40
0
80
120
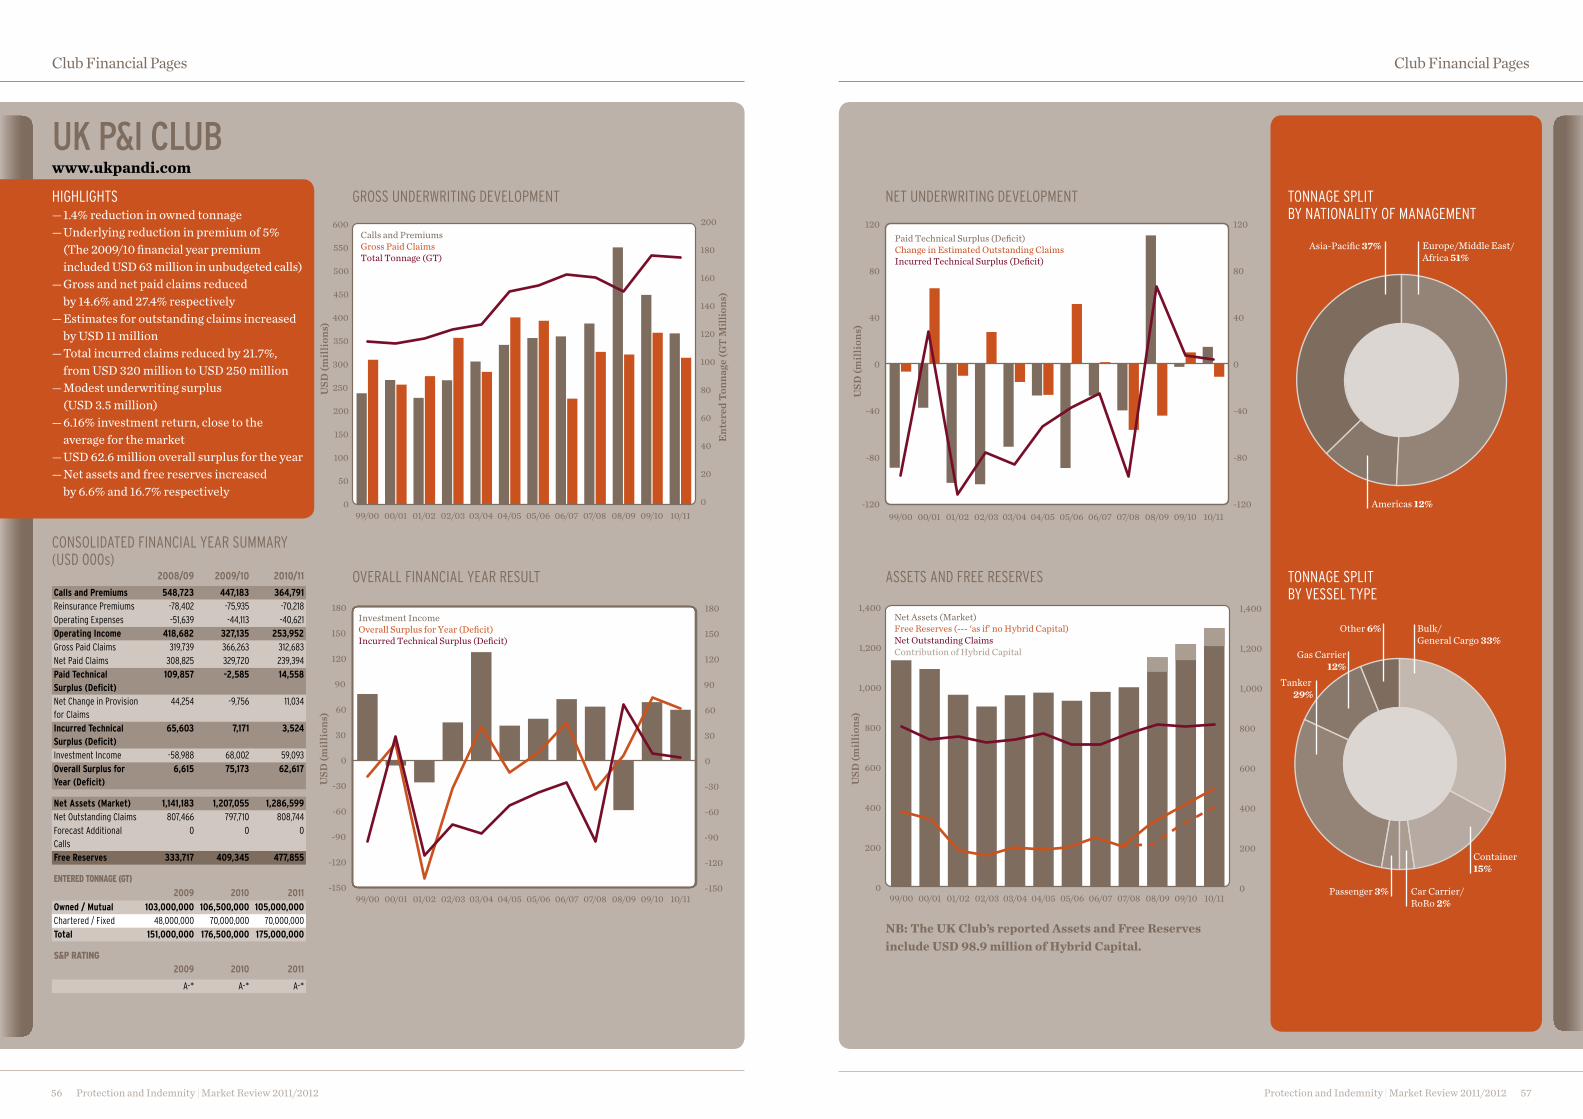
Protection and Indemnity | Market Review 2011/2012 57
Club Financial Pages
Protection and Indemnity | Market Review 2011/201256
Club Financial Pages
TONNAGE SPLIT BY NATIONALITY OF MANAGEMENT
TONNAGE SPLIT BY VESSEL TYPE
0
50
100
150
200
600
450
500
550
400
350
300
250
0
20
40
60
80
100
140
120
200
180
160
99/00 00/01 01/02 02/03 03/04 04/05 05/06 06/07 07/08 08/09 09/10 10/11
Calls and PremiumsGross Paid ClaimsTotal Tonnage (GT)
USD
(mill
ions
)
Ente
red
Tonn
age (
GT M
illio
ns)
Investment IncomeOverall Surplus for Year (Deficit)Incurred Technical Surplus (Deficit)
USD
(mill
ions
)
99/00 00/01 01/02 02/03 03/04 04/05 05/06 06/07 07/08 08/09 09/10 10/11-150
-120
-60
-90
-30
60
30
0
120
90
180
150
-150
-120
-60
-90
-30
60
30
0
120
90
180
150
-120
-80
-40
40
0
80
120
-120
-80
-40
40
0
80
120Paid Technical Surplus (Deficit)Change in Estimated Outstanding ClaimsIncurred Technical Surplus (Deficit)
USD
(mill
ions
)
99/00 00/01 01/02 02/03 03/04 04/05 05/06 06/07 07/08 08/09 09/10 10/11
uk P&i Clubwww.ukpandi.com
HIGHLIGHTS — 1.4% reduction in owned tonnage — Underlying reduction in premium of 5% (The 2009/10 financial year premium included USD 63 million in unbudgeted calls) — Gross and net paid claims reduced by 14.6% and 27.4% respectively — Estimates for outstanding claims increased by USD 11 million — Total incurred claims reduced by 21.7%, from USD 320 million to USD 250 million — Modest underwriting surplus (USD 3.5 million) — 6.16% investment return, close to the average for the market — USD 62.6 million overall surplus for the year — Net assets and free reserves increased by 6.6% and 16.7% respectively
CONSOLIDATED FINANCIAL YEAR SUMMARY (USD 000s)
0
200
400
600
1,400
1,000
1,200
800
0
200
400
600
1,400
1,000
1,200
800
Net Assets (Market)Free Reserves (--- ‘as if’ no Hybrid Capital) Net Outstanding ClaimsContribution of Hybrid Capital
USD
(mill
ions
)
99/00 00/01 01/02 02/03 03/04 04/05 05/06 06/07 07/08 08/09 09/10 10/11
GROSS UNDERWRITING DEVELOPMENT NET UNDERWRITING DEVELOPMENT
ASSETS AND FREE RESERVESOVERALL FINANCIAL YEAR RESULT
NB: The UK Club’s reported Assets and Free Reserves include USD 98.9 million of Hybrid Capital.
Container 15%
Passenger 3% Car Carrier/RoRo 2%
Bulk/General Cargo 33%
Other 6%
Gas Carrier12%
Tanker 29%
Europe/Middle East/Africa 51%
Americas 12%
Asia-Pacific 37%
2008/09 2009/10 2010/11
Calls and Premiums 548,723 447,183 364,791 Reinsurance Premiums -78,402 -75,935 -70,218 Operating Expenses -51,639 -44,113 -40,621 Operating Income 418,682 327,135 253,952 Gross Paid Claims 319,739 366,263 312,683 Net Paid Claims 308,825 329,720 239,394 Paid Technical Surplus (Deficit)
109,857 -2,585 14,558
Net Change in Provision for Claims
44,254 -9,756 11,034
Incurred Technical Surplus (Deficit)
65,603 7,171 3,524
Investment Income -58,988 68,002 59,093 Overall Surplus for Year (Deficit)
6,615 75,173 62,617
Net Assets (Market) 1,141,183 1,207,055 1,286,599 Net Outstanding Claims 807,466 797,710 808,744 Forecast Additional Calls
0 0 0
Free Reserves 333,717 409,345 477,855
EntErEd tonnagE (gt)
2009 2010 2011
Owned / Mutual 103,000,000 106,500,000 105,000,000 Chartered / Fixed 48,000,000 70,000,000 70,000,000 Total 151,000,000 176,500,000 175,000,000
S&P rating2009 2010 2011
A-* A-* A-*

Protection and Indemnity | Market Review 2011/2012 59
Club Financial Pages
Protection and Indemnity | Market Review 2011/201258
Club Financial Pages
TONNAGE SPLIT BY NATIONALITY OF MANAGEMENT
TONNAGE SPLIT BY VESSEL TYPE
0
50
100
150
200
450
400
350
300
250
0
10
20
30
40
50
70
60
100
90
80
99/00 00/01 01/02 02/03 03/04 04/05 05/06 06/07 07/08 08/09 09/10 10/11
Calls and PremiumsGross Paid ClaimsTotal Tonnage (GT)
USD
(mill
ions
)
Ente
red
Tonn
age (
GT M
illio
ns)
Investment IncomeOverall Surplus for Year (Deficit)Incurred Technical Surplus (Deficit)
USD
(mill
ions
)
99/00 00/01 01/02 02/03 03/04 04/05 05/06 06/07 07/08 08/09 09/10 10/11-100
-80
-40
-60
-20
40
60
20
0
80
100
-100
-80
-40
-60
-20
40
60
20
0
80
100
-120
-80
-40
40
0
80
120
-120
-80
-40
40
0
80
120
Paid Technical Surplus (Deficit)Change in Estimated Outstanding ClaimsIncurred Technical Surplus (Deficit)
USD
(mill
ions
)
99/00 00/01 01/02 02/03 03/04 04/05 05/06 06/07 07/08 08/09 09/10 10/11
wesT OF englanDwww.westpandi.com
HIGHLIGHTS— Owned tonnage reduced by 6%— Premium increased by 1.5%— Gross and net paid claims reduced by 14%
and 24% respectively— Estimates for outstanding claims increased
by USD 36 million— Total incurred claims reduced by 4.7%, from
USD 214 million to USD 204 million — Reduced, but still substantial,
USD 36.7 million underwriting deficit— Positive investment return more than offset
underwriting deficit to produce an overall surplus of USD 13.5 million
— Assets and free reserves increased by 19% and 8% respectively
CONSOLIDATED FINANCIAL YEAR SUMMARY (USD 000s)
0
300
200
100
400
500
600
700
0
300
200
100
400
500
600
700Net Assets (Market)Free Reserves Net Outstanding Claims
USD
(mill
ions
)
99/00 00/01 01/02 02/03 03/04 04/05 05/06 06/07 07/08 08/09 09/10 10/11
GROSS UNDERWRITING DEVELOPMENT NET UNDERWRITING DEVELOPMENT
ASSETS AND FREE RESERVESOVERALL FINANCIAL YEAR RESULT
2008/09 2009/10 2010/11Calls and Premiums 408,549 239,589 243,167 Reinsurance Premiums -44,967 -45,641 -39,831 Operating Expenses -49,917 -35,157 -35,532 Operating Income 313,665 158,791 167,804 Gross Paid Claims 239,704 256,205 219,943 Net Paid Claims 205,387 196,527 149,998 Paid Technical Surplus (Deficit)
108,278 -37,736 17,806
Net Change in Provision for Claims
26,529 17,944 54,475
Incurred Technical Surplus (Deficit)
81,749 -55,680 -36,669
Investment Income -94,126 63,929 50,176 Overall Surplus for Year (Deficit)
-12,377 8,249 13,507
Net Assets (Market) 452,764 553,997 659,469 Net Outstanding Claims 438,357 456,301 510,776 Forecast Additional Calls 146,367 71,413 33,971 Free Reserves 160,774 169,109 182,664
EntErEd tonnagE (gt)
2009 2010 2011Owned/Mutual 50,700,000 52,300,000 49,000,000 Chartered/Fixed 16,000,000 16,500,000 20,000,000 Total 66,700,000 68,800,000 69,000,000
S&P rating
2009 2010 2011 BBBpi BBBpi BBBpi
European (including Russia) 45%
Asia 39.4% Americas 7.9%
Middle East and Africa
7.7%
General Cargo 16.1%
Container/RoRo 17.8%
Bulk Carrier 36%Other 2.4%
Ferry/Passenger3.3%
Tanker 24.4%
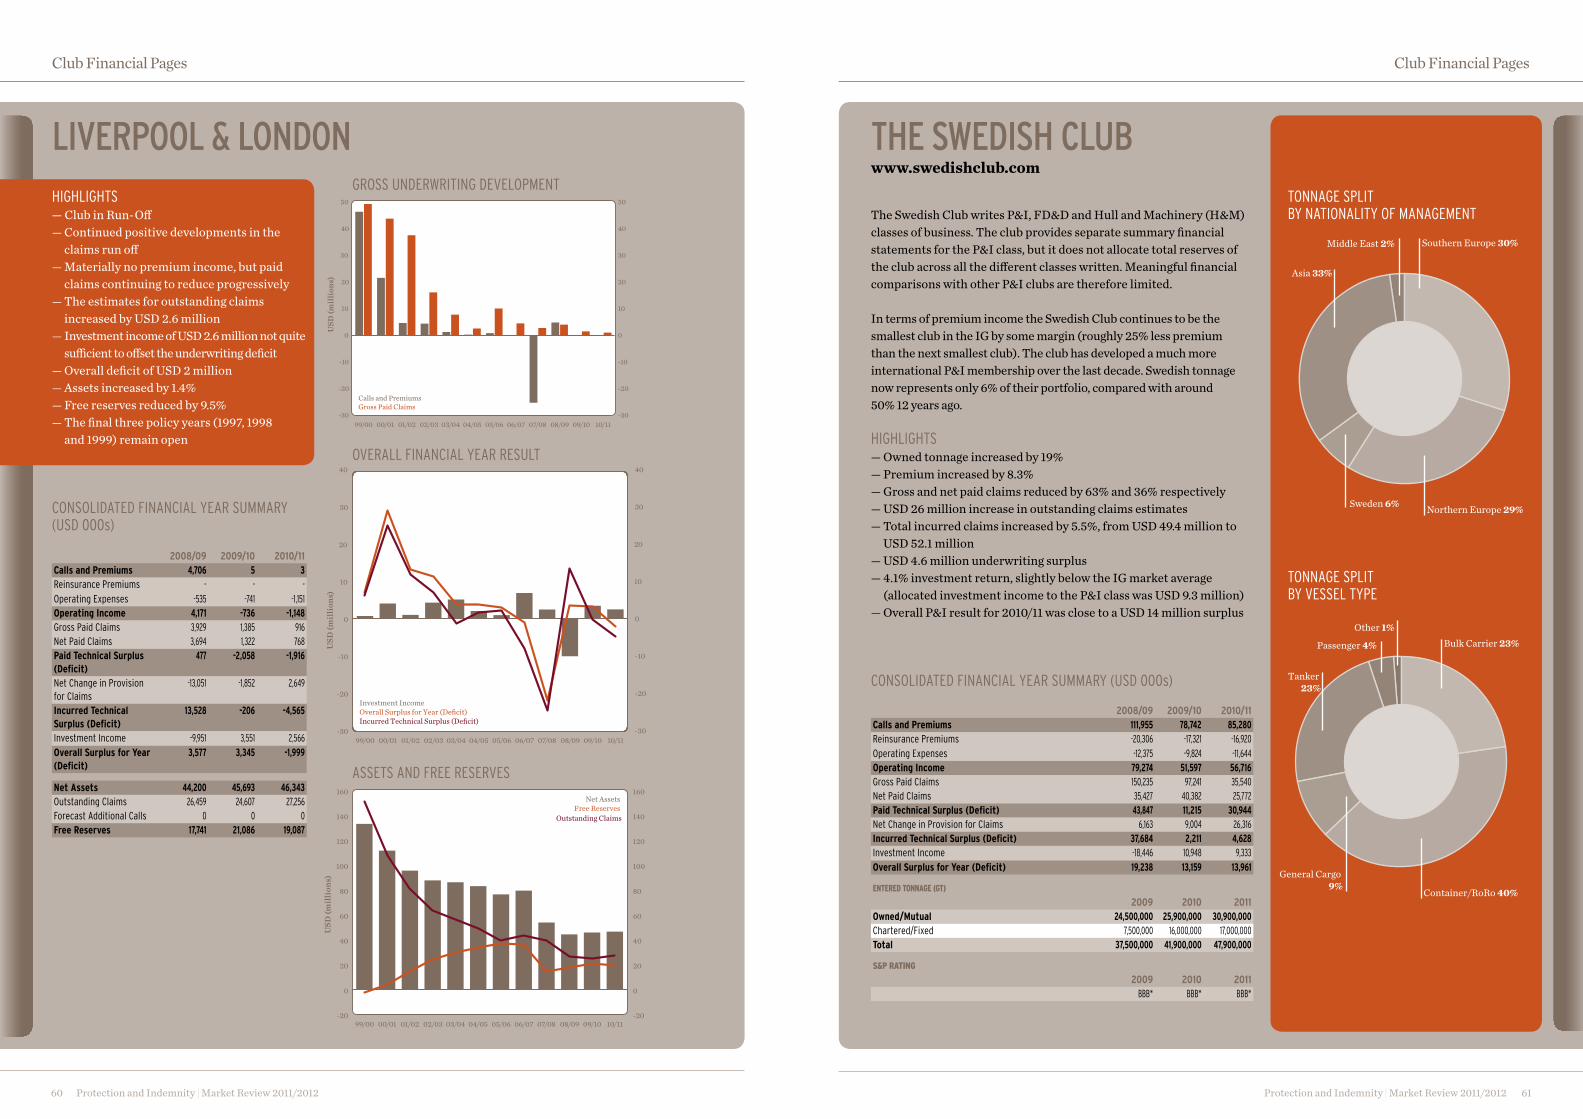
Protection and Indemnity | Market Review 2011/2012 61
Club Financial Pages
Protection and Indemnity | Market Review 2011/201260
Club Financial Pages
TONNAGE SPLIT BY NATIONALITY OF MANAGEMENT
TONNAGE SPLIT BY VESSEL TYPE
Northern Europe 29%
Southern Europe 30%Middle East 2%
Sweden 6%
Asia 33%
Container/RoRo 40%
Bulk Carrier 23%Passenger 4%
General Cargo 9%
Tanker 23%
Other 1%
-30
-20
-10
50
40
30
20
10
0
99/00 00/01 01/02 02/03 03/04 04/05 05/06 06/07 07/08 08/09 09/10 10/11
Calls and PremiumsGross Paid Claims
USD
(mill
ions
)
-30
-20
-10
50
40
30
20
10
0
liveRPOOl & lOnDOnHIGHLIGHTS— Club in Run-Off— Continued positive developments in the
claims run off— Materially no premium income, but paid
claims continuing to reduce progressively— The estimates for outstanding claims
increased by USD 2.6 million — Investment income of USD 2.6 million not quite
sufficient to offset the underwriting deficit— Overall deficit of USD 2 million— Assets increased by 1.4%— Free reserves reduced by 9.5%— The final three policy years (1997, 1998
and 1999) remain open
CONSOLIDATED FINANCIAL YEAR SUMMARY (USD 000s)
GROSS UNDERWRITING DEVELOPMENT
2008/09 2009/10 2010/11Calls and Premiums 4,706 5 3 Reinsurance Premiums - - - Operating Expenses -535 -741 -1,151 Operating Income 4,171 -736 -1,148 Gross Paid Claims 3,929 1,385 916 Net Paid Claims 3,694 1,322 768 Paid Technical Surplus (Deficit)
477 -2,058 -1,916
Net Change in Provision for Claims
-13,051 -1,852 2,649
Incurred Technical Surplus (Deficit)
13,528 -206 -4,565
Investment Income -9,951 3,551 2,566 Overall Surplus for Year (Deficit)
3,577 3,345 -1,999
Net Assets 44,200 45,693 46,343 Outstanding Claims 26,459 24,607 27,256 Forecast Additional Calls 0 0 0 Free Reserves 17,741 21,086 19,087
Investment IncomeOverall Surplus for Year (Deficit)Incurred Technical Surplus (Deficit)
USD
(mill
ions
)
99/00 00/01 01/02 02/03 03/04 04/05 05/06 06/07 07/08 08/09 09/10 10/11-30
-20
10
-10
20
0
30
-30
-20
10
-10
20
0
30
4040OVERALL FINANCIAL YEAR RESULT
-20
40
20
0
60
80
100
120
140
160
-20
40
20
0
60
80
100
120
140
160Net Assets
Free Reserves Outstanding Claims
USD
(mill
ions
)
99/00 00/01 01/02 02/03 03/04 04/05 05/06 06/07 07/08 08/09 09/10 10/11
ASSETS AND FREE RESERVES
The sweDish Clubwww.swedishclub.com
The Swedish Club writes P&I, FD&D and Hull and Machinery (H&M) classes of business. The club provides separate summary financial statements for the P&I class, but it does not allocate total reserves of the club across all the different classes written. Meaningful financial comparisons with other P&I clubs are therefore limited.
In terms of premium income the Swedish Club continues to be the smallest club in the IG by some margin (roughly 25% less premium than the next smallest club). The club has developed a much more international P&I membership over the last decade. Swedish tonnage now represents only 6% of their portfolio, compared with around 50% 12 years ago.
HIGHLIGHTS— Owned tonnage increased by 19%— Premium increased by 8.3%— Gross and net paid claims reduced by 63% and 36% respectively— USD 26 million increase in outstanding claims estimates— Total incurred claims increased by 5.5%, from USD 49.4 million to
USD 52.1 million— USD 4.6 million underwriting surplus— 4.1% investment return, slightly below the IG market average
(allocated investment income to the P&I class was USD 9.3 million)— Overall P&I result for 2010/11 was close to a USD 14 million surplus
CONSOLIDATED FINANCIAL YEAR SUMMARY (USD 000s)
2008/09 2009/10 2010/11Calls and Premiums 111,955 78,742 85,280 Reinsurance Premiums -20,306 -17,321 -16,920 Operating Expenses -12,375 -9,824 -11,644 Operating Income 79,274 51,597 56,716 Gross Paid Claims 150,235 97,241 35,540 Net Paid Claims 35,427 40,382 25,772 Paid Technical Surplus (Deficit) 43,847 11,215 30,944 Net Change in Provision for Claims 6,163 9,004 26,316 Incurred Technical Surplus (Deficit) 37,684 2,211 4,628 Investment Income -18,446 10,948 9,333 Overall Surplus for Year (Deficit) 19,238 13,159 13,961
EntErEd tonnagE (gt)
2009 2010 2011Owned/Mutual 24,500,000 25,900,000 30,900,000 Chartered/Fixed 7,500,000 16,000,000 17,000,000 Total 37,500,000 41,900,000 47,900,000
S&P rating
2009 2010 2011 BBB* BBB* BBB*
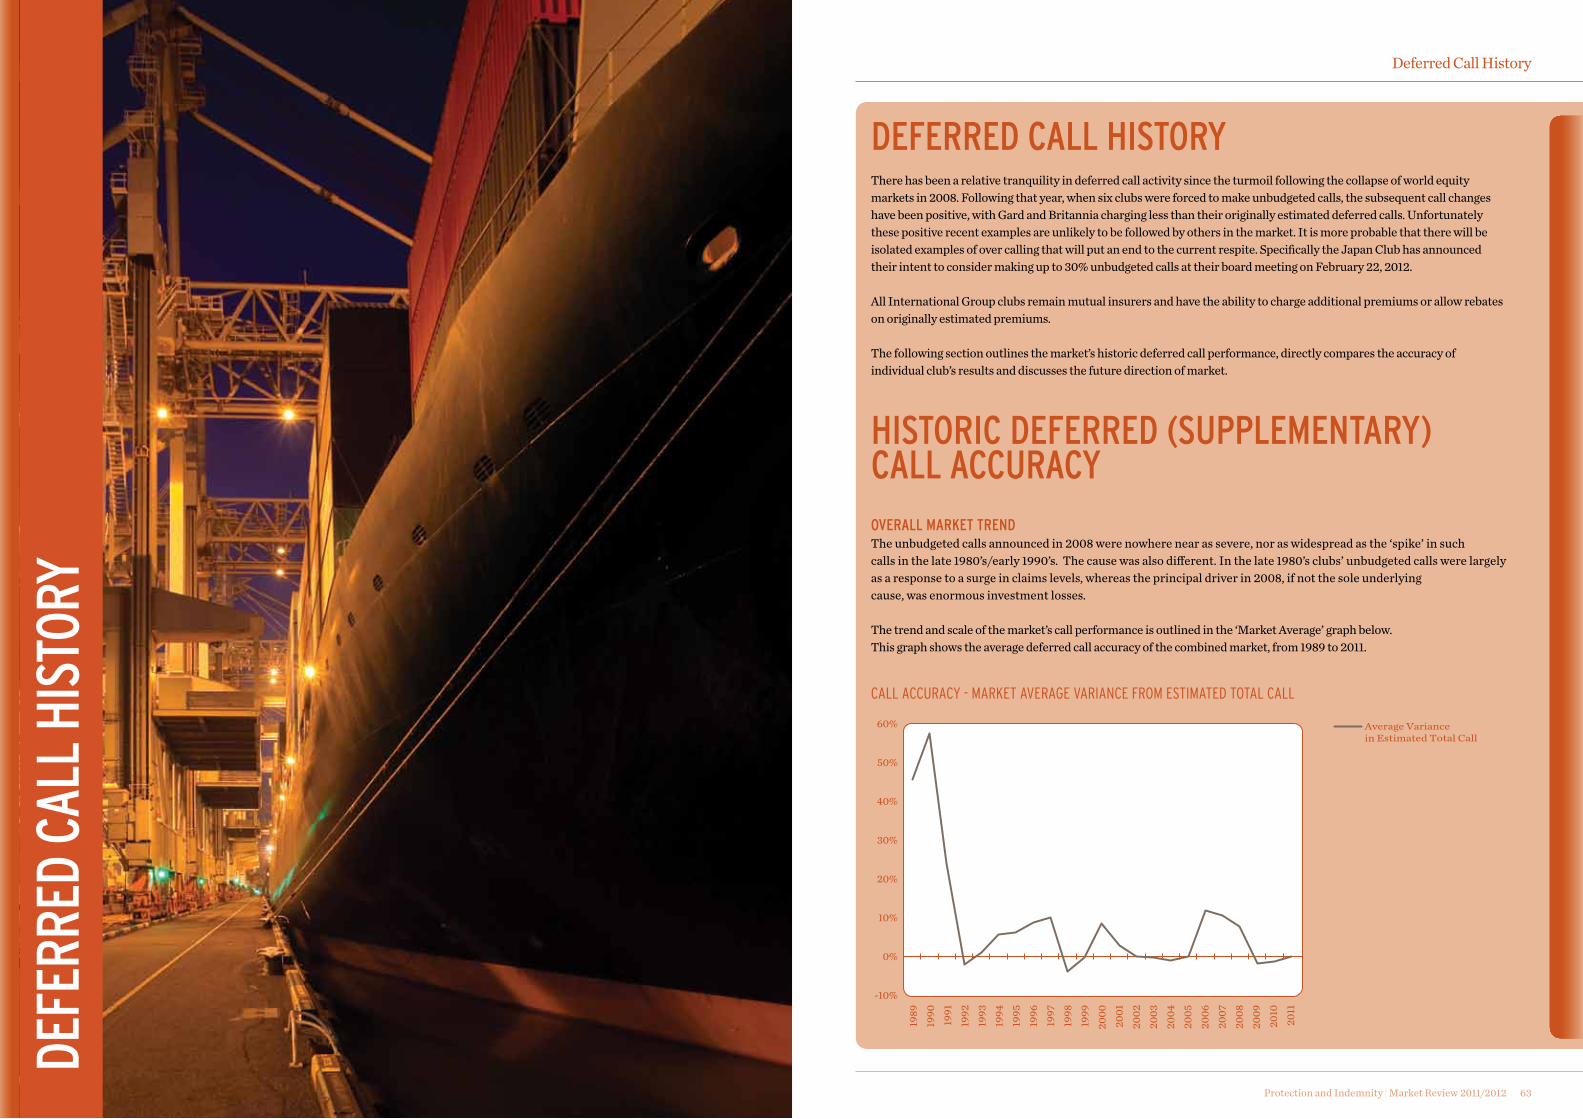
DEFE
RRED
CAL
L HI
STOR
Y DEFERRED CALL HISTORY There has been a relative tranquility in deferred call activity since the turmoil following the collapse of world equity markets in 2008. Following that year, when six clubs were forced to make unbudgeted calls, the subsequent call changes have been positive, with Gard and Britannia charging less than their originally estimated deferred calls. Unfortunately these positive recent examples are unlikely to be followed by others in the market. It is more probable that there will be isolated examples of over calling that will put an end to the current respite. Specifically the Japan Club has announced their intent to consider making up to 30% unbudgeted calls at their board meeting on February 22, 2012. All International Group clubs remain mutual insurers and have the ability to charge additional premiums or allow rebates on originally estimated premiums. The following section outlines the market’s historic deferred call performance, directly compares the accuracy of individual club’s results and discusses the future direction of market.
HISTORIC DEFERRED (SUPPLEMENTARY) CALL ACCURACYOVERALL MARKET TRENDThe unbudgeted calls announced in 2008 were nowhere near as severe, nor as widespread as the ‘spike’ in such calls in the late 1980’s/early 1990’s. The cause was also different. In the late 1980’s clubs’ unbudgeted calls were largely as a response to a surge in claims levels, whereas the principal driver in 2008, if not the sole underlying cause, was enormous investment losses.
The trend and scale of the market’s call performance is outlined in the ‘Market Average’ graph below. This graph shows the average deferred call accuracy of the combined market, from 1989 to 2011.
Protection and Indemnity | Market Review 2011/2012 63
Deferred Call History
-10%
0%
10%
20%
30%
40%
50%
60% Average Variance in Estimated Total Call
1989
1990
1991
1992
1993
1994
1995
1996
1997
1998
1999
2000
2001
2002
2003
2004
2005
2006
2007
2008
2009
2010
2011
Call aCCuraCy - Market average varianCe FroM estiMated total Call
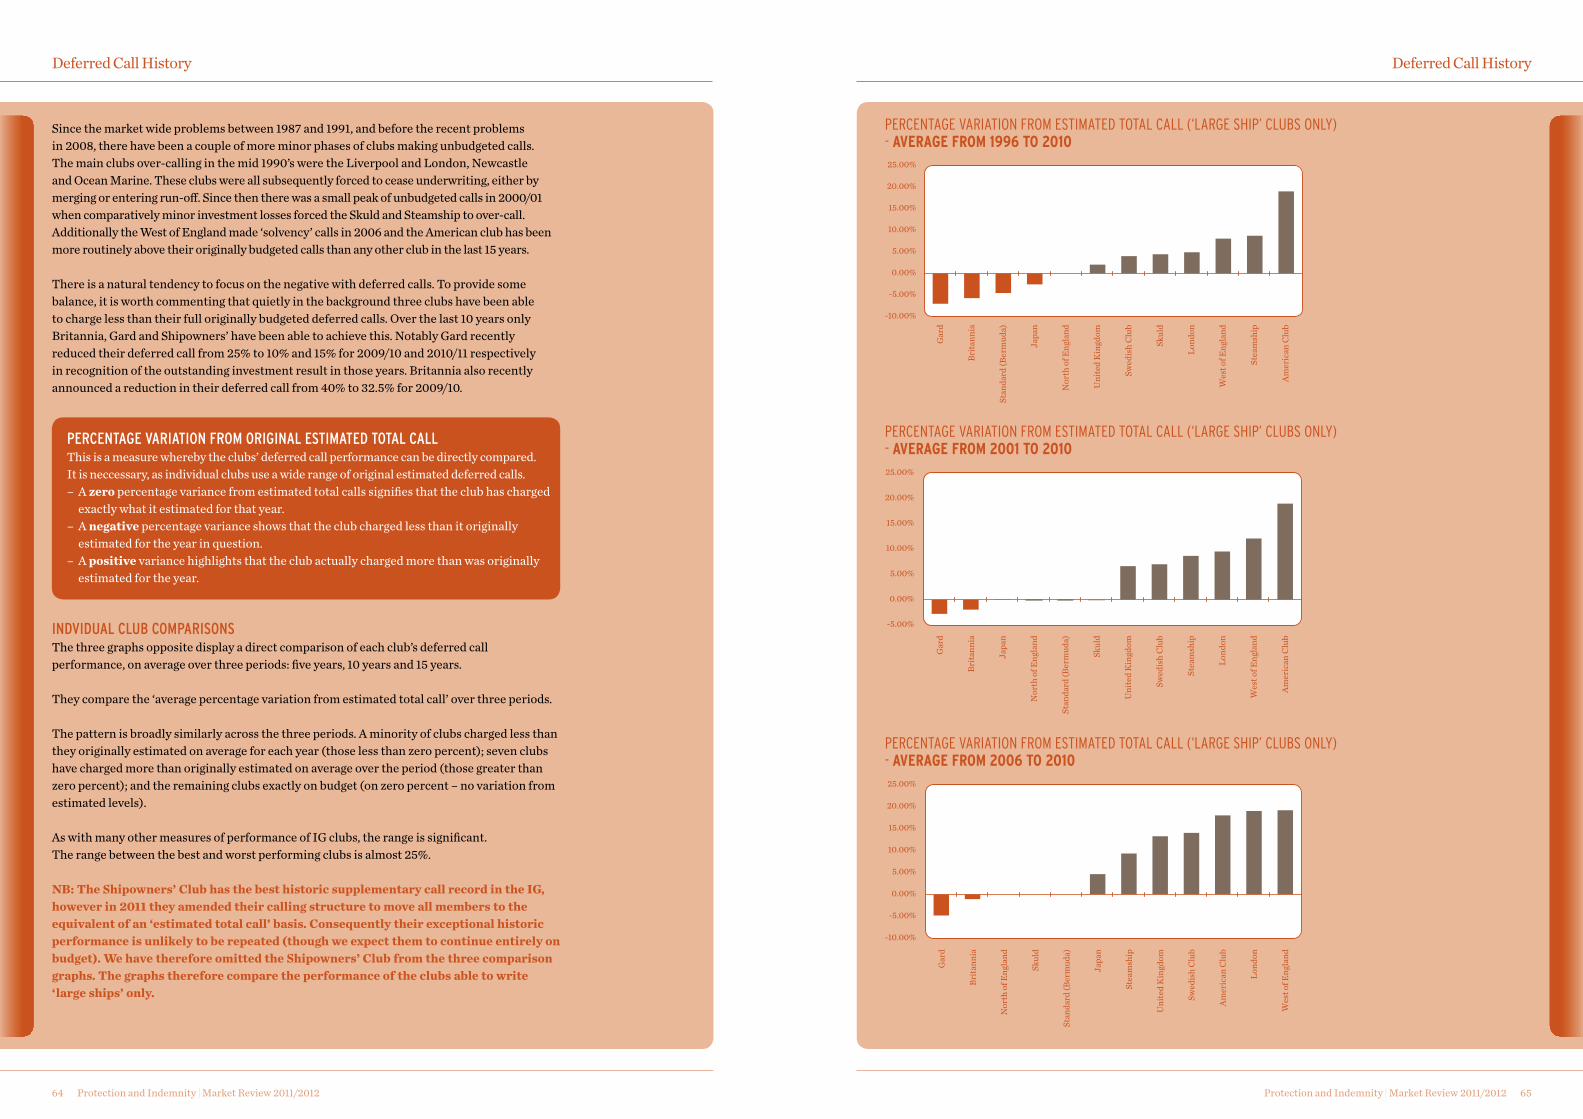
Protection and Indemnity | Market Review 2011/2012 65Protection and Indemnity | Market Review 2011/201264
Since the market wide problems between 1987 and 1991, and before the recent problems in 2008, there have been a couple of more minor phases of clubs making unbudgeted calls. The main clubs over-calling in the mid 1990’s were the Liverpool and London, Newcastle and Ocean Marine. These clubs were all subsequently forced to cease underwriting, either by merging or entering run-off. Since then there was a small peak of unbudgeted calls in 2000/01 when comparatively minor investment losses forced the Skuld and Steamship to over-call. Additionally the West of England made ‘solvency’ calls in 2006 and the American club has been more routinely above their originally budgeted calls than any other club in the last 15 years.
There is a natural tendency to focus on the negative with deferred calls. To provide some balance, it is worth commenting that quietly in the background three clubs have been able to charge less than their full originally budgeted deferred calls. Over the last 10 years only Britannia, Gard and Shipowners’ have been able to achieve this. Notably Gard recently reduced their deferred call from 25% to 10% and 15% for 2009/10 and 2010/11 respectively in recognition of the outstanding investment result in those years. Britannia also recently announced a reduction in their deferred call from 40% to 32.5% for 2009/10.
PERCENTAGE VARIATION FROM ORIGINAL ESTIMATED TOTAL CALLThis is a measure whereby the clubs’ deferred call performance can be directly compared. It is neccessary, as individual clubs use a wide range of original estimated deferred calls.– A zero percentage variance from estimated total calls signifies that the club has charged
exactly what it estimated for that year. – A negative percentage variance shows that the club charged less than it originally
estimated for the year in question. – A positive variance highlights that the club actually charged more than was originally
estimated for the year.
INDVIDUAL CLUB COMPARISONSThe three graphs opposite display a direct comparison of each club’s deferred call performance, on average over three periods: five years, 10 years and 15 years.
They compare the ‘average percentage variation from estimated total call’ over three periods.
The pattern is broadly similarly across the three periods. A minority of clubs charged less than they originally estimated on average for each year (those less than zero percent); seven clubs have charged more than originally estimated on average over the period (those greater than zero percent); and the remaining clubs exactly on budget (on zero percent – no variation from estimated levels).
As with many other measures of performance of IG clubs, the range is significant. The range between the best and worst performing clubs is almost 25%.
NB: The Shipowners’ Club has the best historic supplementary call record in the IG, however in 2011 they amended their calling structure to move all members to the equivalent of an ‘estimated total call’ basis. Consequently their exceptional historic performance is unlikely to be repeated (though we expect them to continue entirely on budget). We have therefore omitted the Shipowners’ Club from the three comparison graphs. The graphs therefore compare the performance of the clubs able to write ‘large ships’ only.
Deferred Call History Deferred Call History
-10.00%
-5.00%
0.00%
5.00%
10.00%
15.00%
20.00%
25.00%
Gar
d
Brita
nnia
Stan
dard
(Ber
mud
a)
Japa
n
Nor
th o
f Eng
land
Uni
ted
Kin
gdom
Swed
ish
Clu
b
Skul
d
Lond
on
Wes
t of E
ngla
nd
Stea
msh
ip
Amer
ican
Clu
b
Gar
d
Brita
nnia
Japa
n
Nor
th o
f Eng
land
Stan
dard
(Ber
mud
a)
Skul
d
Uni
ted
Kin
gdom
Swed
ish
Clu
b
Stea
msh
ip
Lond
on
Wes
t of E
ngla
nd
Amer
ican
Clu
b
-5.00%
0.00%
5.00%
10.00%
15.00%
20.00%
25.00%
Gar
d
Brita
nnia
Nor
th o
f Eng
land
Skul
d
Stan
dard
(Ber
mud
a)
Japa
n
Stea
msh
ip
Uni
ted
Kin
gdom
Swed
ish
Clu
b
Amer
ican
Clu
b
Lond
on
Wes
t of E
ngla
nd
-10.00%
-5.00%
0.00%
5.00%
10.00%
15.00%
20.00%
25.00%
PerCentage variation FroM estiMated total Call (‘large sHiP’ CluBs only) - AverAge from 1996 to 2010
PerCentage variation FroM estiMated total Call (‘large sHiP’ CluBs only) - AverAge from 2001 to 2010
PerCentage variation FroM estiMated total Call (‘large sHiP’ CluBs only) - AverAge from 2006 to 2010
Protection and Indemnity | Market Review 2011/201266
Deferred Call History
FUTURE TRENDSThere was an understandable period of uncertainty immediately after almost half the market was forced to make unbudgeted calls in 2008. Following the announcements of the six offending clubs, a significant number of commentators continued to question which club would be next. At the time Willis consistently highlighted that we did not expect this particular problem to imminently spread to the stronger half of the market.
As highlighted earlier in this review, all clubs are financially stronger after the 2010/11 financial year.
This is not to say unbudgeted calls are a thing of the past, there could well be further isolated announcements in the next couple of years. However, as previously mentioned in our reviews, we do not expect unbudgeted calls to frequently recur for the majority of the market.
The inherent issues with the American and West of England clubs continue to make them vulnerable to fluctuations in the investment and/or claims climate. The Japan Club similarly faces a challenging outlook. The Japan Club specifically put their members on notice in November 2011 that up to a 30% unbudgeted call for the 2010/11 year was possible and was to be decided upon at the club’s board meeting on February 22, 2012.
The clubs in the stronger half of the market are likely to continue with stable deferred call performance. Thus, the broad market picture is expected to continue, with one or two isolated problem clubs at the bottom, contrasted with one or two clubs at the top granting rebates.
The broad market picture is expected to continue, with one or two isolated problem clubs at the bottom, contrasted with one or two clubs at the top granting rebates.
Protection and Indemnity | Market Review 2011/2012 67
Deferred Call History
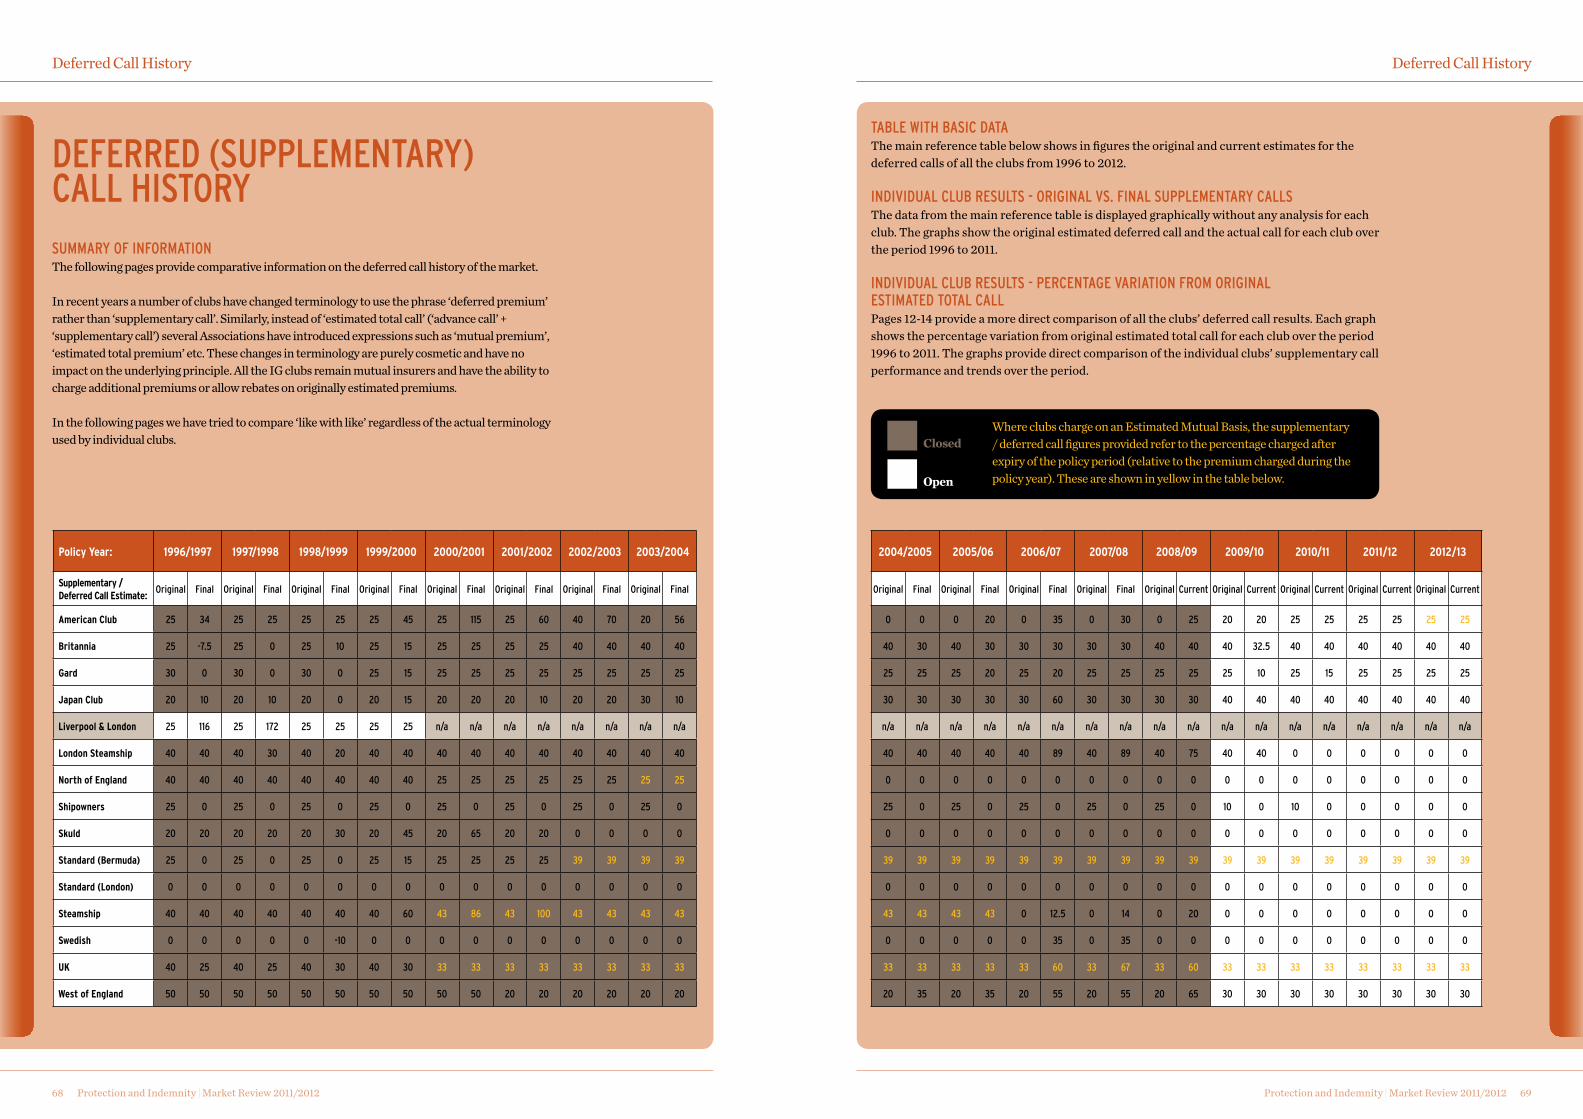
Protection and Indemnity | Market Review 2011/2012 69Protection and Indemnity | Market Review 2011/201268
DEFERRED (SUPPLEMENTARY) CALL HISTORYSUMMARY OF INFORMATIONThe following pages provide comparative information on the deferred call history of the market.
In recent years a number of clubs have changed terminology to use the phrase ‘deferred premium’ rather than ‘supplementary call’. Similarly, instead of ‘estimated total call’ (‘advance call’ + ‘supplementary call’) several Associations have introduced expressions such as ‘mutual premium’, ‘estimated total premium’ etc. These changes in terminology are purely cosmetic and have no impact on the underlying principle. All the IG clubs remain mutual insurers and have the ability to charge additional premiums or allow rebates on originally estimated premiums.
In the following pages we have tried to compare ‘like with like’ regardless of the actual terminology used by individual clubs.
Deferred Call History Deferred Call History
TABLE wITH BASIC DATA The main reference table below shows in figures the original and current estimates for the deferred calls of all the clubs from 1996 to 2012.
INDIVIDUAL CLUB RESULTS - ORIGINAL VS. FINAL SUPPLEMENTARY CALLS The data from the main reference table is displayed graphically without any analysis for each club. The graphs show the original estimated deferred call and the actual call for each club over the period 1996 to 2011.
INDIVIDUAL CLUB RESULTS - PERCENTAGE VARIATION FROM ORIGINAL ESTIMATED TOTAL CALLPages 12-14 provide a more direct comparison of all the clubs’ deferred call results. Each graph shows the percentage variation from original estimated total call for each club over the period 1996 to 2011. The graphs provide direct comparison of the individual clubs’ supplementary call performance and trends over the period.
Policy Year: 1996/1997 1997/1998 1998/1999 1999/2000 2000/2001 2001/2002 2002/2003 2003/2004
Supplementary / Deferred Call estimate:
Original Final Original Final Original Final Original Final Original Final Original Final Original Final Original Final
American Club 25 34 25 25 25 25 25 45 25 115 25 60 40 70 20 56
Britannia 25 -7.5 25 0 25 10 25 15 25 25 25 25 40 40 40 40
gard 30 0 30 0 30 0 25 15 25 25 25 25 25 25 25 25
Japan Club 20 10 20 10 20 0 20 15 20 20 20 10 20 20 30 10
Liverpool & London 25 116 25 172 25 25 25 25 n/a n/a n/a n/a n/a n/a n/a n/a
London Steamship 40 40 40 30 40 20 40 40 40 40 40 40 40 40 40 40
North of england 40 40 40 40 40 40 40 40 25 25 25 25 25 25 25 25
Shipowners 25 0 25 0 25 0 25 0 25 0 25 0 25 0 25 0
Skuld 20 20 20 20 20 30 20 45 20 65 20 20 0 0 0 0
Standard (Bermuda) 25 0 25 0 25 0 25 15 25 25 25 25 39 39 39 39
Standard (London) 0 0 0 0 0 0 0 0 0 0 0 0 0 0 0 0
Steamship 40 40 40 40 40 40 40 60 43 86 43 100 43 43 43 43
Swedish 0 0 0 0 0 -10 0 0 0 0 0 0 0 0 0 0
UK 40 25 40 25 40 30 40 30 33 33 33 33 33 33 33 33
West of england 50 50 50 50 50 50 50 50 50 50 20 20 20 20 20 20
2004/2005 2005/06 2006/07 2007/08 2008/09 2009/10 2010/11 2011/12 2012/13
Original Final Original Final Original Final Original Final Original Current Original Current Original Current Original Current Original Current
0 0 0 20 0 35 0 30 0 25 20 20 25 25 25 25 25 25
40 30 40 30 30 30 30 30 40 40 40 32.5 40 40 40 40 40 40
25 25 25 20 25 20 25 25 25 25 25 10 25 15 25 25 25 25
30 30 30 30 30 60 30 30 30 30 40 40 40 40 40 40 40 40
n/a n/a n/a n/a n/a n/a n/a n/a n/a n/a n/a n/a n/a n/a n/a n/a n/a n/a
40 40 40 40 40 89 40 89 40 75 40 40 0 0 0 0 0 0
0 0 0 0 0 0 0 0 0 0 0 0 0 0 0 0 0 0
25 0 25 0 25 0 25 0 25 0 10 0 10 0 0 0 0 0
0 0 0 0 0 0 0 0 0 0 0 0 0 0 0 0 0 0
39 39 39 39 39 39 39 39 39 39 39 39 39 39 39 39 39 39
0 0 0 0 0 0 0 0 0 0 0 0 0 0 0 0 0 0
43 43 43 43 0 12.5 0 14 0 20 0 0 0 0 0 0 0 0
0 0 0 0 0 35 0 35 0 0 0 0 0 0 0 0 0 0
33 33 33 33 33 60 33 67 33 60 33 33 33 33 33 33 33 33
20 35 20 35 20 55 20 55 20 65 30 30 30 30 30 30 30 30
Where clubs charge on an Estimated Mutual Basis, the supplementary / deferred call figures provided refer to the percentage charged after expiry of the policy period (relative to the premium charged during the policy year). These are shown in yellow in the table below.
Closed
Open
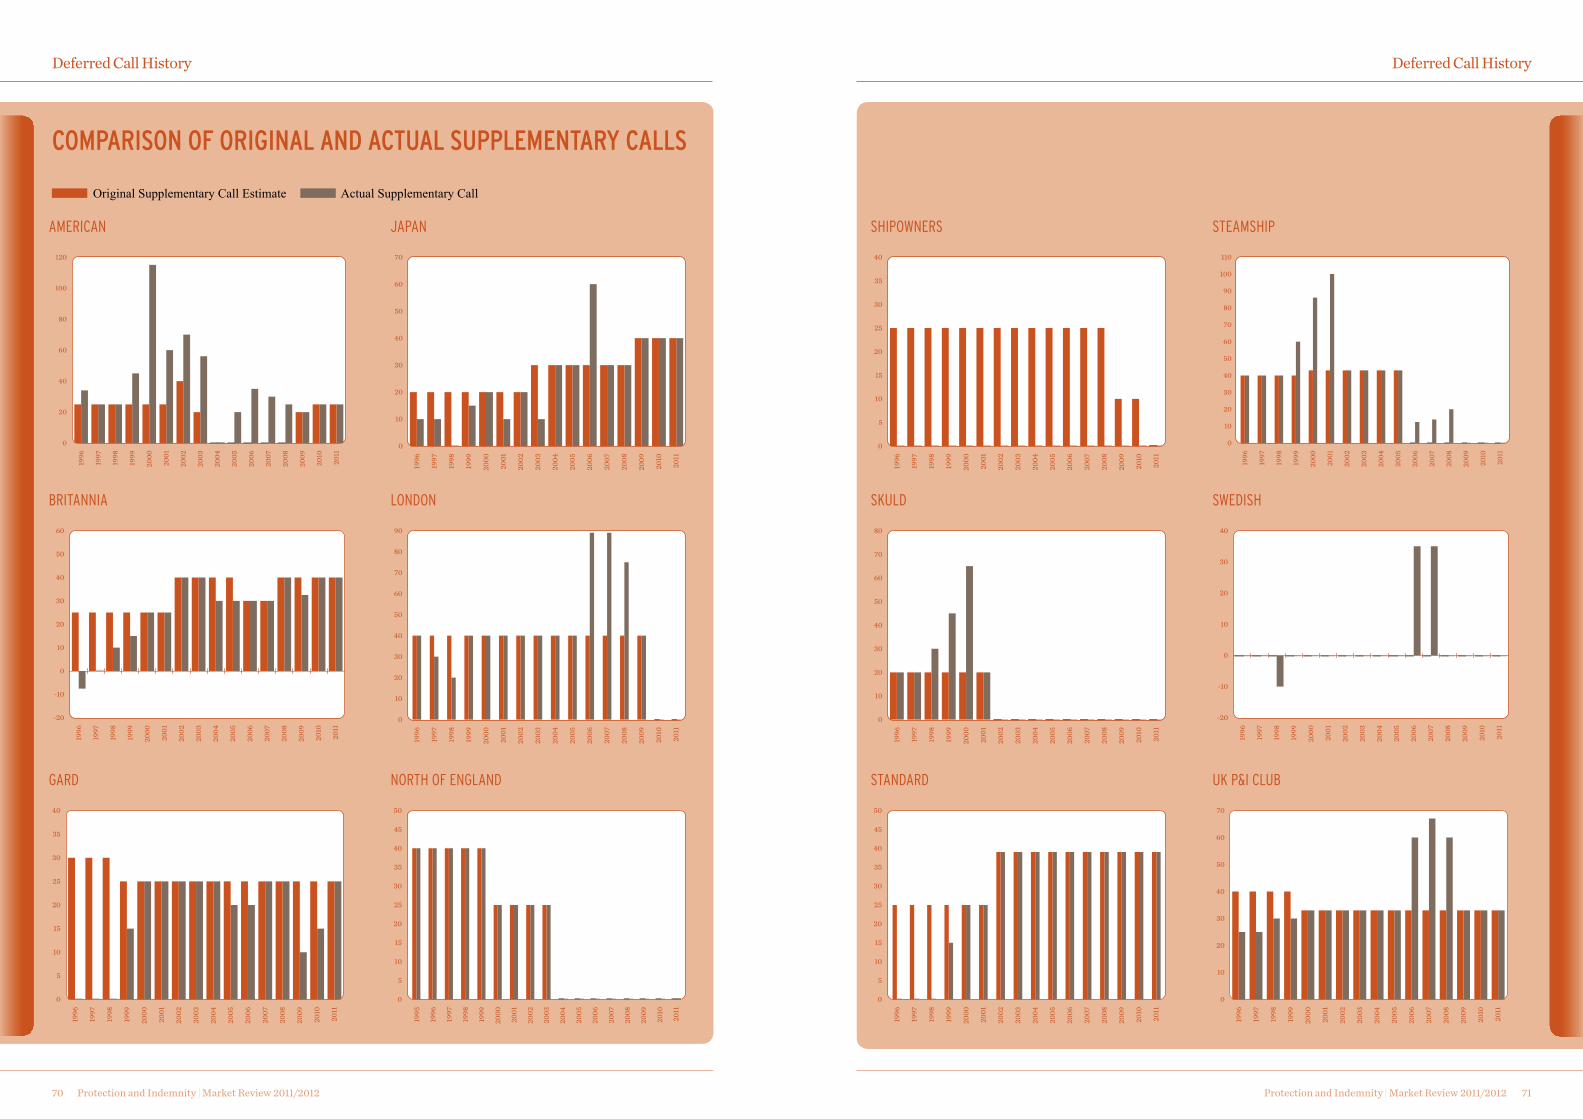
Protection and Indemnity | Market Review 2011/201270
Deferred Call History
Protection and Indemnity | Market Review 2011/2012 71
Deferred Call History
Original SupplementaryCall Estimate
Actual SupplementaryCall
1996
1997
1998
1999
2000
2001
2002
2003
2004
2005
2006
2007
2008
2009
2010
2011
0
40
20
60
80
100
120
aMeriCan
Original SupplementaryCall Estimate
Actual SupplementaryCall
1996
1997
1998
1999
2000
2001
2002
2003
2004
2005
2006
2007
2008
2009
2010
2011
0
10
5
15
20
25
30
35
40
sHiPowners
Original SupplementaryCall Estimate
Actual SupplementaryCall
1996
1997
1998
1999
2000
2001
2002
2003
2004
2005
2006
2007
2008
2009
2010
2011
0
10
20
30
40
50
60
70
JaPan
1996
1997
1998
1999
2000
2001
2002
2003
2004
2005
2006
2007
2008
2009
2010
2011
Original SupplementaryCall Estimate
Actual SupplementaryCall
0
30
20
10
40
50
70
60
110
90
100
80
steaMsHiP
Original SupplementaryCall Estimate
Actual SupplementaryCall
1996
1997
1998
1999
2000
2001
2002
2003
2004
2005
2006
2007
2008
2009
2010
2011
-20
0
-10
10
20
40
30
60
50
Britannia
Original SupplementaryCall Estimate
Actual SupplementaryCall
1996
1997
1998
1999
2000
2001
2002
2003
2004
2005
2006
2007
2008
2009
2010
2011
0
20
10
30
40
50
60
70
80
skuld
1996
1997
1998
1999
2000
2001
2002
2003
2004
2005
2006
2007
2008
2009
2010
2011
Original SupplementaryCall Estimate
Actual SupplementaryCall
0
20
10
30
40
60
50
90
80
70
london
1996
1997
1998
1999
2000
2001
2002
2003
2004
2005
2006
2007
2008
2009
2010
2011
Original SupplementaryCall Estimate
Actual SupplementaryCall
-20
0
-10
10
20
40
30
swedisH
Original SupplementaryCall Estimate
Actual SupplementaryCall
1996
1997
1998
1999
2000
2001
2002
2003
2004
2005
2006
2007
2008
2009
2010
2011
0
10
5
15
20
25
30
35
40
gard
1996
1997
1998
1999
2000
2001
2002
2003
2004
2005
2006
2007
2008
2009
2010
2011
Original SupplementaryCall Estimate
Actual SupplementaryCall
0
15
10
5
20
25
35
30
50
45
40
standard
1995
1996
1997
1998
1999
2000
2001
2002
2003
2004
2005
2006
2007
2008
2009
2010
2011
Original SupplementaryCall Estimate
Actual SupplementaryCall
0
15
10
5
20
25
35
30
50
45
40
nortH oF england
Original SupplementaryCall Estimate
Actual SupplementaryCall
1996
1997
1998
1999
2000
2001
2002
2003
2004
2005
2006
2007
2008
2009
2010
2011
0
10
20
30
40
50
60
70
uk P&i CluB
COMPARISON OF ORIGINAL AND ACTUAL SUPPLEMENTARY CALLS
Original Supplementary� Call Estimate Actual Supplementary� Call
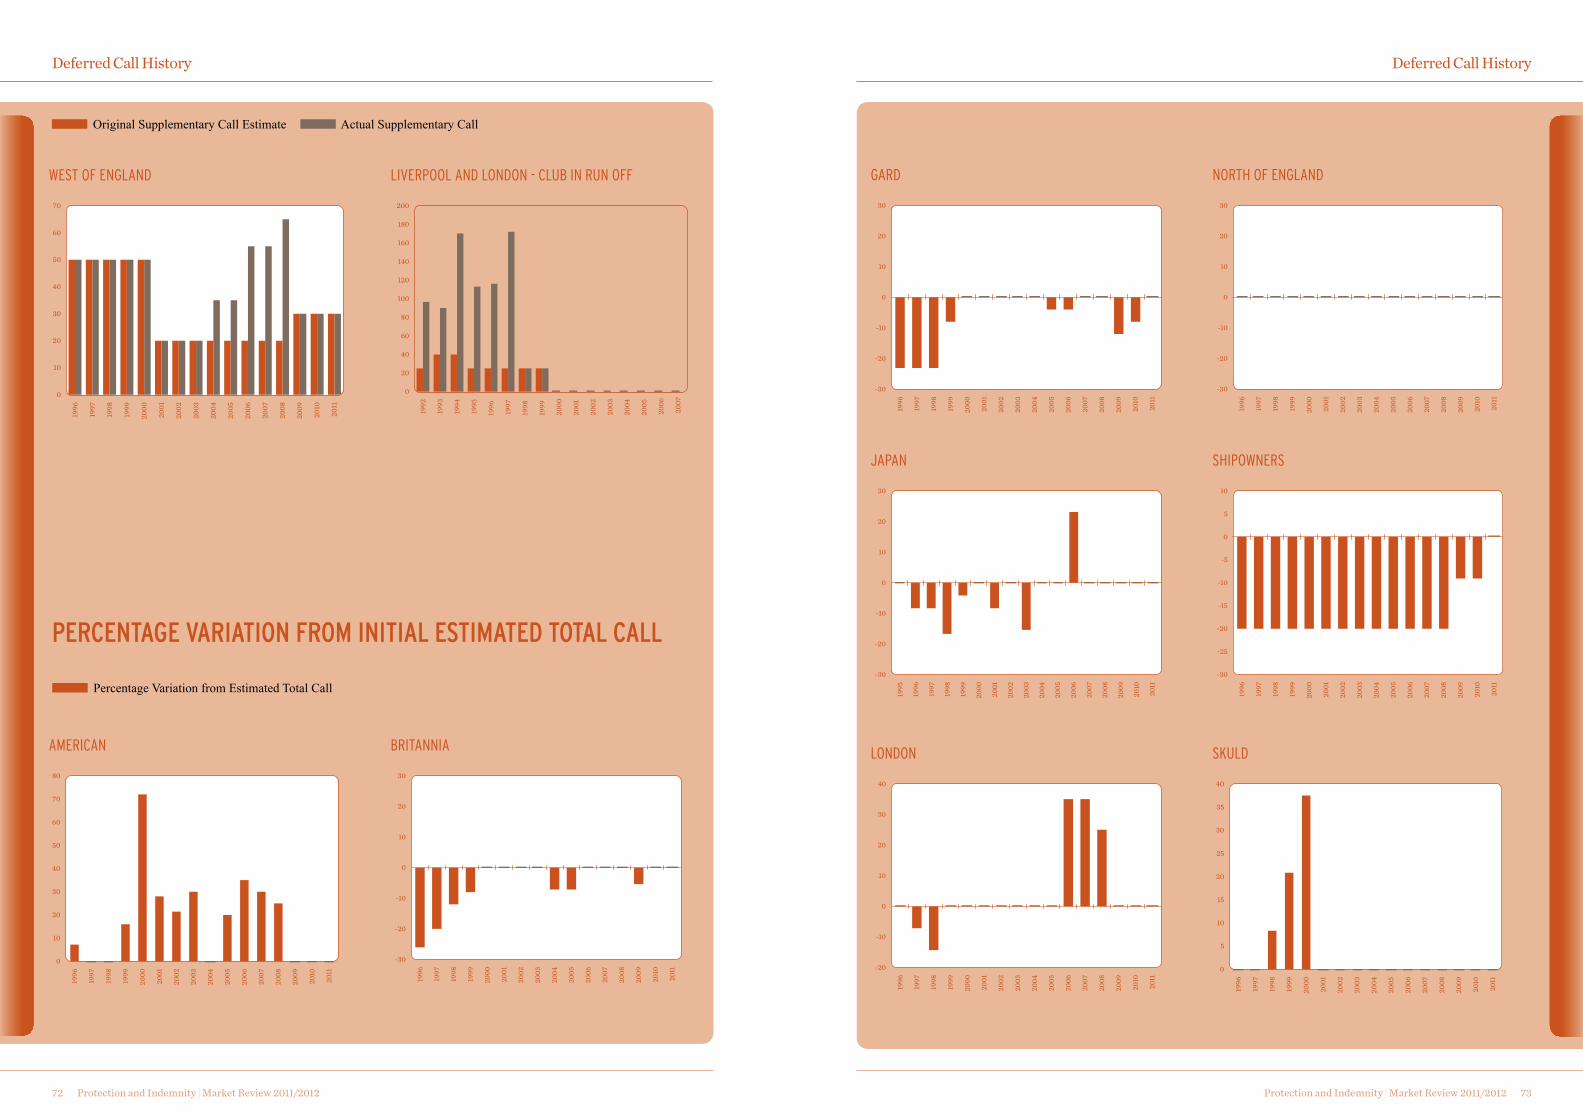
Protection and Indemnity | Market Review 2011/201272
Deferred Call History
Protection and Indemnity | Market Review 2011/2012 73
Deferred Call History
Original SupplementaryCall Estimate
Actual SupplementaryCall
1996
1997
1998
1999
2000
2001
2002
2003
2004
2005
2006
2007
2008
2009
2010
2011
0
10
20
30
40
50
60
70
west oF england
Original SupplementaryCall Estimate
Actual SupplementaryCall
1992
1993
1994
1995
1996
1997
1998
1999
2000
2001
2002
2003
2004
2005
2006
2007
0
20
40
60
80
100
120
140
160
180
200
liverPool and london - CluB in run oFF
Original Supplementary� Call Estimate Actual Supplementary� Call
Percentage Variation fromEstimated Total Call
1996
1997
1998
1999
2000
2001
2002
2003
2004
2005
2006
2007
2008
2009
2010
2011
-30
-20
0
-10
10
20
30
gard
Percentage Variation fromEstimated Total Call
1996
1997
1998
1999
2000
2001
2002
2003
2004
2005
2006
2007
2008
2009
2010
2011
-30
-20
0
-10
10
20
30
nortH oF england
Percentage Variation fromEstimated Total Call
1995
1996
1997
1998
1999
2000
2001
2002
2003
2004
2005
2006
2007
2008
2009
2010
2011
-30
-20
0
-10
10
20
30
JaPan
Percentage Variation fromEstimated Total Call
1996
1997
1998
1999
2000
2001
2002
2003
2004
2005
2006
2007
2008
2009
2010
2011
-30
-20
-15
-25
0
-10
-5
5
10
sHiPowners
Percentage Variation fromEstimated Total Call
1996
1997
1998
1999
2000
2001
2002
2003
2004
2005
2006
2007
2008
2009
2010
2011
-20
0
-10
10
20
40
30
london
Percentage Variation fromEstimated Total Call
1996
1997
1998
1999
2000
2001
2002
2003
2004
2005
2006
2007
2008
2009
2010
2011
0
10
5
15
20
30
25
40
35
skuld
Percentage Variation fromEstimated Total Call
1996
1997
1998
1999
2000
2001
2002
2003
2004
2005
2006
2007
2008
2009
2010
2011
0
20
10
30
40
60
50
80
70
aMeriCan
Percentage Variation fromEstimated Total Call
1996
1997
1998
1999
2000
2001
2002
2003
2004
2005
2006
2007
2008
2009
2010
2011
-30
-20
0
-10
10
20
30
Britannia
PERCENTAGE VARIATION FROM INITIAL ESTIMATED TOTAL CALL
Percentage Variation from Estimated Total Call
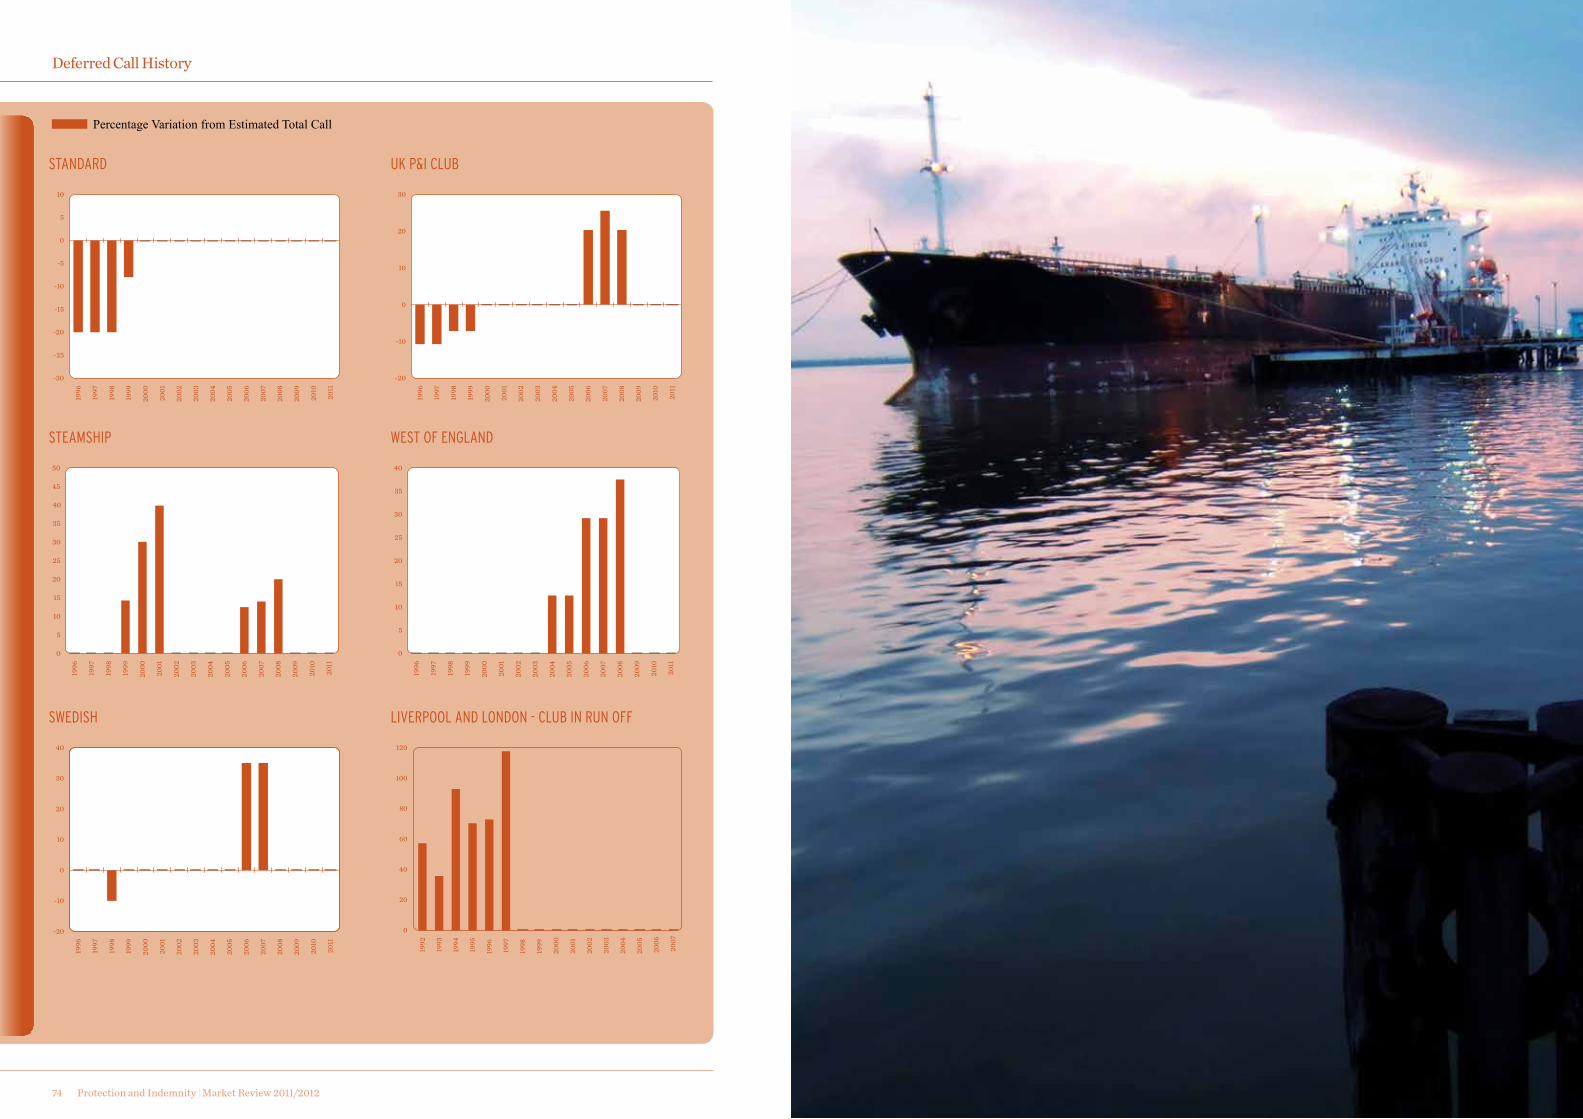
Protection and Indemnity | Market Review 2011/201274
Deferred Call History
Percentage Variation from Estimated Total Call
Percentage Variation fromEstimated Total Call
1996
1997
1998
1999
2000
2001
2002
2003
2004
2005
2006
2007
2008
2009
2010
2011
-30
-20
-15
-25
0
-10
-5
5
10
standard
Percentage Variation fromEstimated Total Call
1996
1997
1998
1999
2000
2001
2002
2003
2004
2005
2006
2007
2008
2009
2010
2011
-20
0
-10
10
20
30
uk P&i CluB
Percentage Variation fromEstimated Total Call
1996
1997
1998
1999
2000
2001
2002
2003
2004
2005
2006
2007
2008
2009
2010
2011
0
10
5
15
20
30
25
50
45
35
40
steaMsHiP
Percentage Variation fromEstimated Total Call
1996
1997
1998
1999
2000
2001
2002
2003
2004
2005
2006
2007
2008
2009
2010
2011
0
10
5
15
20
30
25
40
35
west oF england
Percentage Variation fromEstimated Total Call
1996
1997
1998
1999
2000
2001
2002
2003
2004
2005
2006
2007
2008
2009
2010
2011
-20
0
-10
10
20
40
30
swedisH
Percentage Variation fromEstimated Total Call
0
40
20
60
80
100
120
1992
1993
1994
1995
1996
1997
1998
1999
2000
2001
2002
2003
2004
2005
2006
2007
liverPool and london - CluB in run oFF
Protection and Indemnity | Market Review 2011/2012 77
Average Expense Ratios (AERs)
In principle the AER is a reasonable idea, but in reality it is only ever a very approximate guide to the relative operating costs of clubs.
AVERAGE EXPENSE RATIO (AER) Average Expense Ratios (AERs) were introduced in 1999 following pressure from the European Commission in an attempt to enable direct comparisons of operating costs between clubs within the International Group.
The formula that all clubs are required to adhere to when calculating their AER figure is as follows:
The AER formula is the five-year average of:
Operating costs x 100
(Premium income + Investment income)
In principle the AER is a reasonable idea, but in reality it is only ever a very approximate guide to the relative operating costs of clubs. Direct comparisons between clubs are by no means straightforward therefore while the ratio is a crude guide to relative efficiency it is too simplistic to assume that the club with the lowest AER is the most efficient and the club with the highest - the most inefficient.
LIMITATIONS TO DIRECT COMPARISONThere are a number of factors that affect the AER figure, examples of which include:• Disproportionately high levels of premium or investment income will produce a lower AER.• Different membership profiles also have an impact. For example because the Shipowners’ Club has a membership
which consists of a large number of small ships paying relatively low premiums per vessel, they have a significantly higher AER than the other clubs.
• The exact basis of calculation adopted is also material. For example, the increase in the Standard Club’s AER in 2004/05 was caused principally by the club revising the basis upon which they calculated their AER. They moved to the methodology adopted by most other clubs of including commissions within the calculation.
• Loss prevention programmes increase operating costs and therefore push up the AER. Naturally most clubs would argue that such costs are more than offset by claims avoided.
• If a club owns its offices, the club’s operating costs will be less, therefore reducing the AER. The capital cost of the building will however not be available for investment, therefore potentially reducing investment income.
AVER
AGE
EXPE
NSE
RATI
O (A
ER)
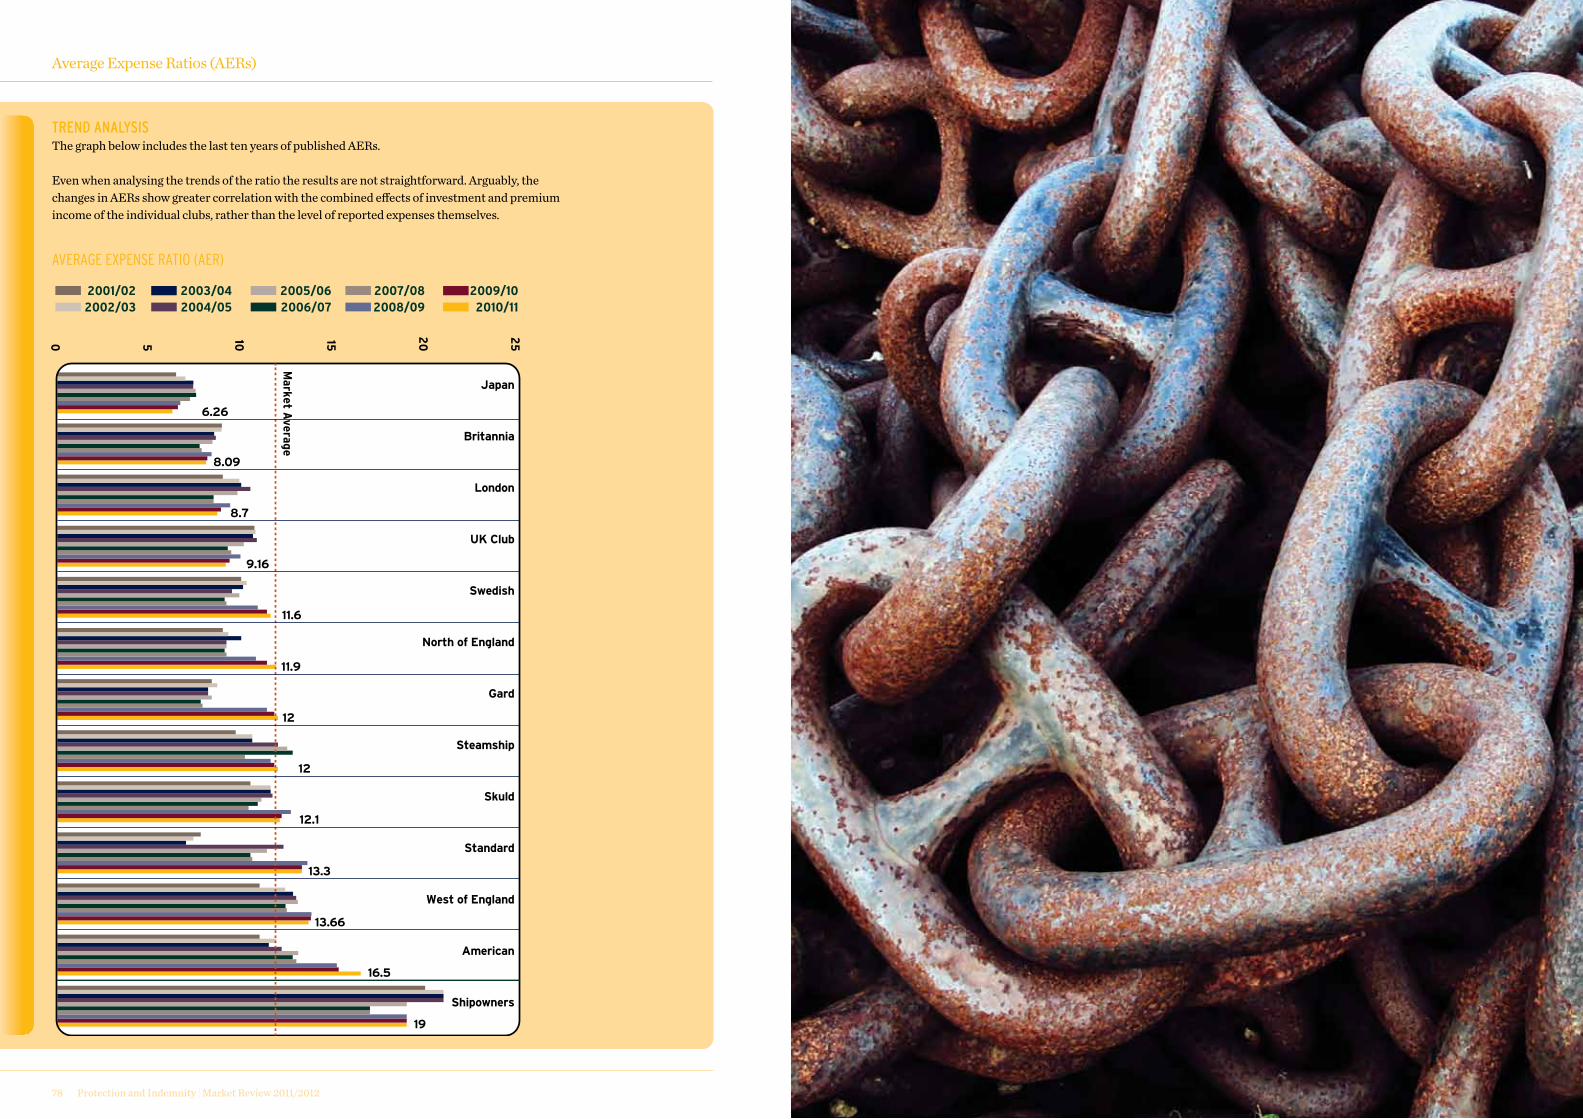
Protection and Indemnity | Market Review 2011/201278
TREND ANALYSISThe graph below includes the last ten years of published AERs.
Even when analysing the trends of the ratio the results are not straightforward. Arguably, the changes in AERs show greater correlation with the combined effects of investment and premium income of the individual clubs, rather than the level of reported expenses themselves.
Average Expense Ratios (AERs)
AVERAGE EXPENSE RATIO (AER)
Market A
verage
0 5 10 15
20
25
2001/022002/03
2003/042004/05
2005/062006/07
2007/082008/09
2009/102010/11
Japan
Britannia
London
UK Club
Swedish
North of England
Gard
Steamship
Skuld
Standard
West of England
American
Shipowners
6.26
8.09
8.7
9.16
11.6
11.9
12
12
12.1
13.3
13.66
16.5
19
Protection and Indemnity | Market Review 2011/2012 81
Non-International Group Marketth
e NO
N-IN
teRN
AtIO
NAL
GROU
P P&
I MAR
Ket the NON-INteRNAtIONAL GROUP
P&I MARKetThe ‘non-International Group’ P&I market continues to evolve, with two significant developments in 2011.
Since our review last year we have witnessed the demise of the South of England P&I Association and the preparations for launching a new fixed premium venture, provisionally to be named Lodestar.
SOUTH OF ENGLAND P&I ASSOCIATION – IN LIQUIDATIONOn November 22, 2011 the Supreme Court of Bermuda handed down a winding-up order in relation to the South of England Protection and Indemnity Association (Bermuda) Limited. KPMG Advisory Ltd were appointed as Joint Provisional Liquidators and on November 29, 2011 they issued a notice of cancelation on all current policies to take effect from midnight (GMT) on December 9, 2011.
The collapse of the South of England P&I Association is the first major mutual club failure since the Ocean Marine Mutual 12 years ago.
Although the South of England P&I Association was not a market ever fully approved by Willis, we recognise that their disappearance narrows down enormously the coverage opportunities for ships unable to obtain P&I cover within the IG and which are too large for the fixed premium market.
STALLED NEW ENTRANT TO THE FIXED PREMIUM MARKETA team of 12, comprising mainly of ex-British Marine staff was assembled during spring/summer 2011 with the intent of forming the core of a new fixed premium P&I facility under the provisional name ‘Lodestar’.
As at the end of November 2011 the project stalled, being tied up in legal action brought by QBE, the parent company of British Marine. Currently the fledgling facility is prevented from writing business pending the outcome of court decisions.
The collapse of the South of England P&I Association is the first major mutual club failure since the Ocean Marine Mutual, 12 years ago.
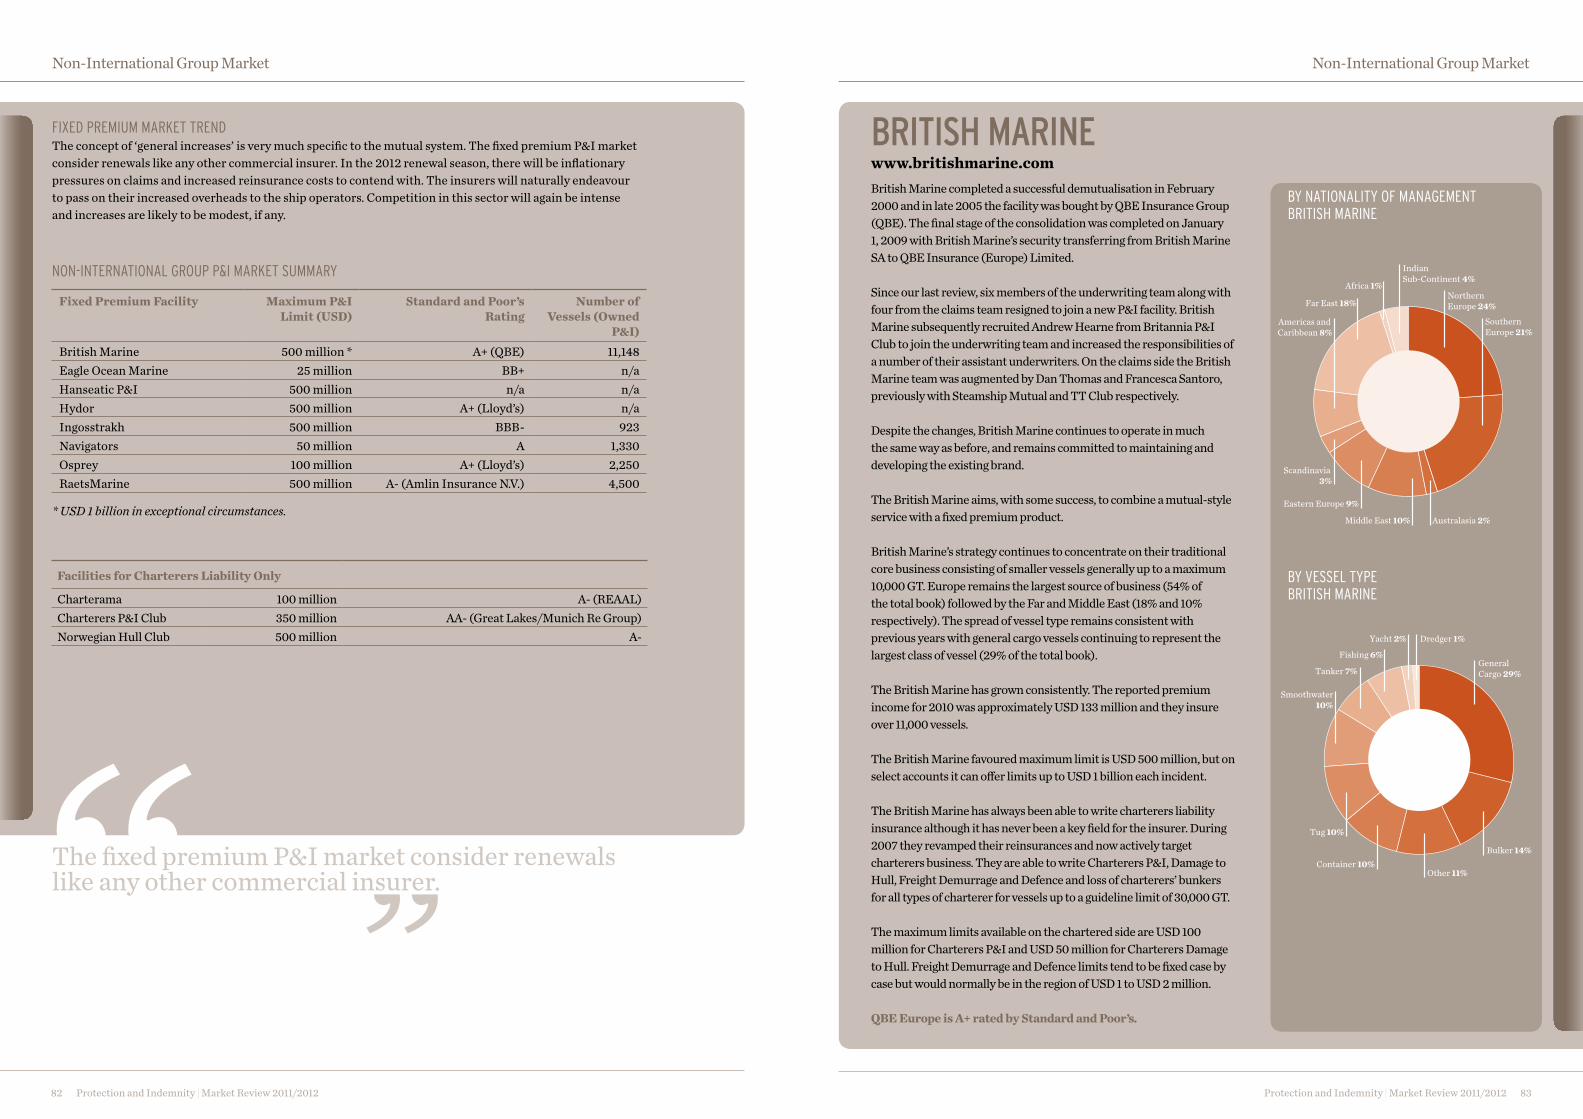
Protection and Indemnity | Market Review 2011/201282
Non-International Group Market
Protection and Indemnity | Market Review 2011/2012 83
Non-International Group Market
FIXED PREMIUM MARKET TRENDThe concept of ‘general increases’ is very much specific to the mutual system. The fixed premium P&I market consider renewals like any other commercial insurer. In the 2012 renewal season, there will be inflationary pressures on claims and increased reinsurance costs to contend with. The insurers will naturally endeavour to pass on their increased overheads to the ship operators. Competition in this sector will again be intense and increases are likely to be modest, if any.
By NATIONALITy OF MANAGEMENT BRITISH MARINE
By VESSEL TyPE BRITISH MARINE
Northern Europe 24%
Southern Europe 21%
Australasia 2%Middle East 10%
Eastern Europe 9%
Scandinavia 3%
Americas and Caribbean 8%
Far East 18%
Africa 1%
Indian Sub-Continent 4%
General Cargo 29%
Bulker 14%
Other 11%Container 10%
Tug 10%
Smoothwater10%
Tanker 7%
Fishing 6%
Yacht 2% Dredger 1%
BRItIsh MARINe www.britishmarine.comBritish Marine completed a successful demutualisation in February 2000 and in late 2005 the facility was bought by QBE Insurance Group (QBE). The final stage of the consolidation was completed on January 1, 2009 with British Marine’s security transferring from British Marine SA to QBE Insurance (Europe) Limited.
Since our last review, six members of the underwriting team along with four from the claims team resigned to join a new P&I facility. British Marine subsequently recruited Andrew Hearne from Britannia P&I Club to join the underwriting team and increased the responsibilities of a number of their assistant underwriters. On the claims side the British Marine team was augmented by Dan Thomas and Francesca Santoro, previously with Steamship Mutual and TT Club respectively.
Despite the changes, British Marine continues to operate in much the same way as before, and remains committed to maintaining and developing the existing brand.
The British Marine aims, with some success, to combine a mutual-style service with a fixed premium product.
British Marine’s strategy continues to concentrate on their traditional core business consisting of smaller vessels generally up to a maximum 10,000 GT. Europe remains the largest source of business (54% of the total book) followed by the Far and Middle East (18% and 10% respectively). The spread of vessel type remains consistent with previous years with general cargo vessels continuing to represent the largest class of vessel (29% of the total book).
The British Marine has grown consistently. The reported premium income for 2010 was approximately USD 133 million and they insure over 11,000 vessels.
The British Marine favoured maximum limit is USD 500 million, but on select accounts it can offer limits up to USD 1 billion each incident.
The British Marine has always been able to write charterers liability insurance although it has never been a key field for the insurer. During 2007 they revamped their reinsurances and now actively target charterers business. They are able to write Charterers P&I, Damage to Hull, Freight Demurrage and Defence and loss of charterers’ bunkers for all types of charterer for vessels up to a guideline limit of 30,000 GT.
The maximum limits available on the chartered side are USD 100 million for Charterers P&I and USD 50 million for Charterers Damage to Hull. Freight Demurrage and Defence limits tend to be fixed case by case but would normally be in the region of USD 1 to USD 2 million.
QBE Europe is A+ rated by Standard and Poor’s.
Facilities for Charterers Liability Only
Charterama 100 million A- (REAAL)Charterers P&I Club 350 million AA- (Great Lakes/Munich Re Group)Norwegian Hull Club 500 million A-
Fixed Premium Facility Maximum P&I Limit (USD)
Standard and Poor’s Rating
Number of Vessels (Owned
P&I)British Marine 500 million * A+ (QBE) 11,148Eagle Ocean Marine 25 million BB+ n/aHanseatic P&I 500 million n/a n/aHydor 500 million A+ (Lloyd’s) n/aIngosstrakh 500 million BBB- 923Navigators 50 million A 1,330Osprey 100 million A+ (Lloyd’s) 2,250RaetsMarine 500 million A- (Amlin Insurance N.V.) 4,500
* USD 1 billion in exceptional circumstances.
NON-INTERNATIONAL GROUP P&I MARKET SUMMARy
The fixed premium P&I market consider renewals like any other commercial insurer.
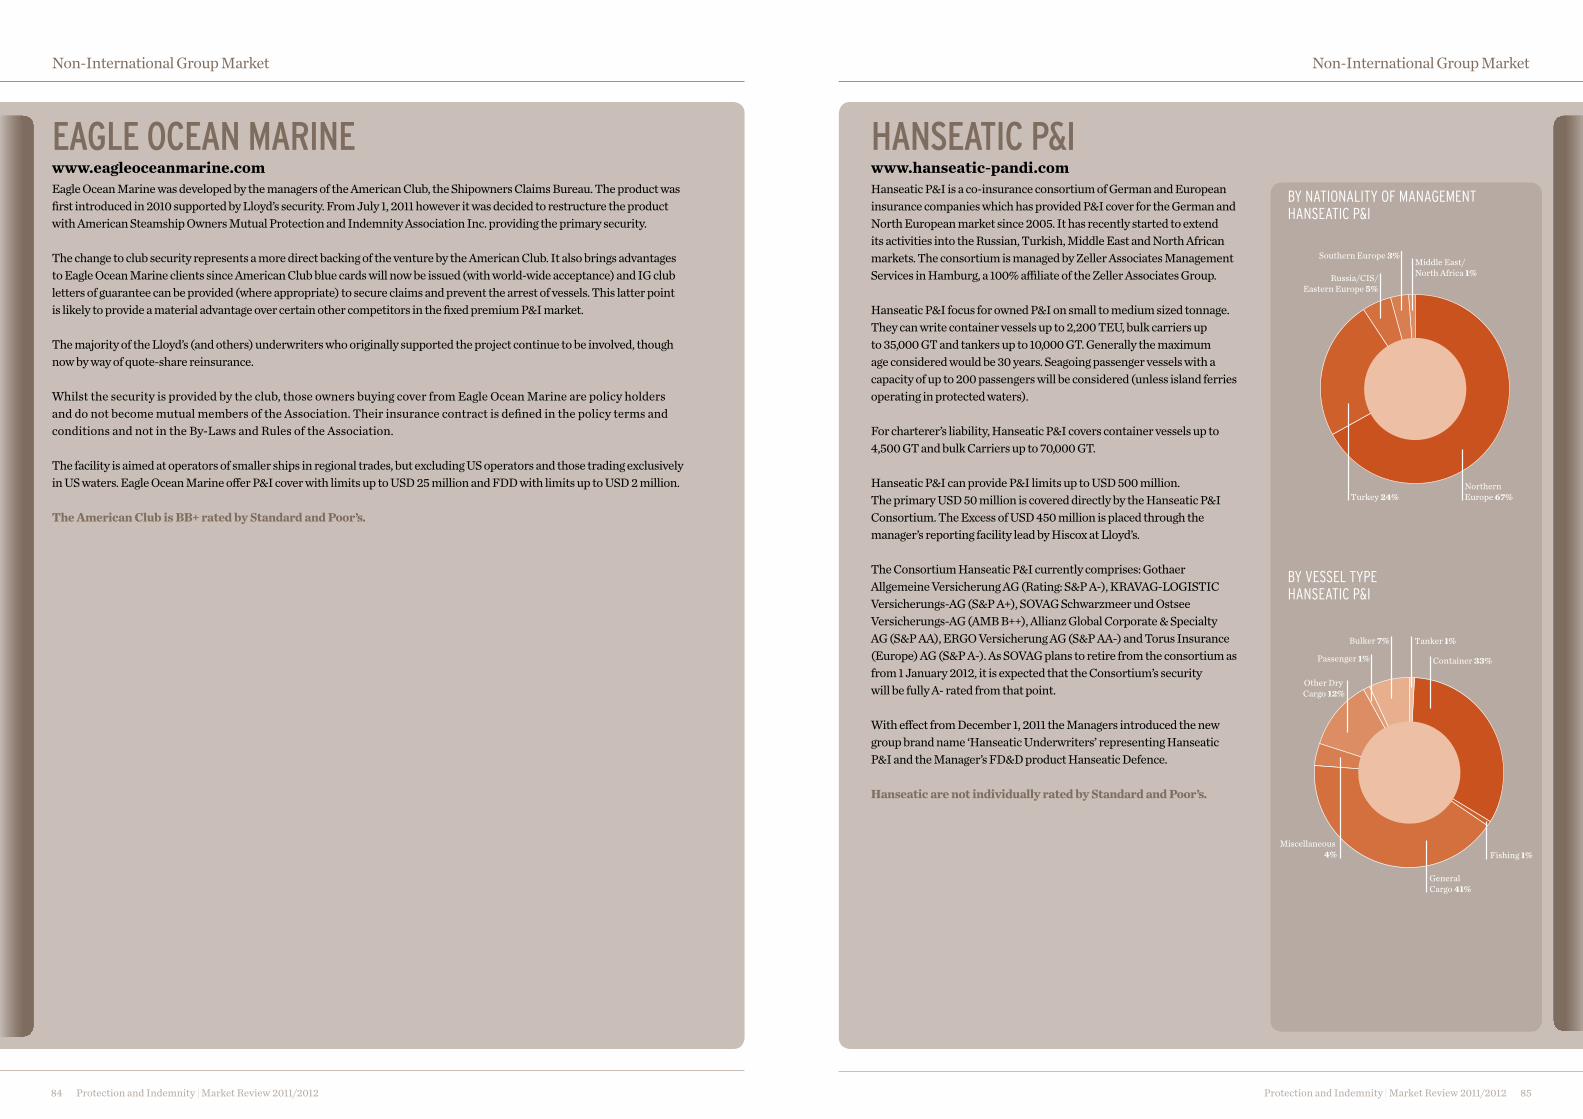
Protection and Indemnity | Market Review 2011/201284
Non-International Group Market
Protection and Indemnity | Market Review 2011/2012 85
Non-International Group Market
Hanseatic P&I is a co-insurance consortium of German and European insurance companies which has provided P&I cover for the German and North European market since 2005. It has recently started to extend its activities into the Russian, Turkish, Middle East and North African markets. The consortium is managed by Zeller Associates Management Services in Hamburg, a 100% affiliate of the Zeller Associates Group.
Hanseatic P&I focus for owned P&I on small to medium sized tonnage. They can write container vessels up to 2,200 TEU, bulk carriers up to 35,000 GT and tankers up to 10,000 GT. Generally the maximum age considered would be 30 years. Seagoing passenger vessels with a capacity of up to 200 passengers will be considered (unless island ferries operating in protected waters).
For charterer’s liability, Hanseatic P&I covers container vessels up to 4,500 GT and bulk Carriers up to 70,000 GT.
Hanseatic P&I can provide P&I limits up to USD 500 million. The primary USD 50 million is covered directly by the Hanseatic P&I Consortium. The Excess of USD 450 million is placed through the manager’s reporting facility lead by Hiscox at Lloyd’s.
The Consortium Hanseatic P&I currently comprises: Gothaer Allgemeine Versicherung AG (Rating: S&P A-), KRAVAG-LOGISTIC Versicherungs-AG (S&P A+), SOVAG Schwarzmeer und Ostsee Versicherungs-AG (AMB B++), Allianz Global Corporate & Specialty AG (S&P AA), ERGO Versicherung AG (S&P AA-) and Torus Insurance (Europe) AG (S&P A-). As SOVAG plans to retire from the consortium as from 1 January 2012, it is expected that the Consortium’s security will be fully A- rated from that point.
With effect from December 1, 2011 the Managers introduced the new group brand name ‘Hanseatic Underwriters’ representing Hanseatic P&I and the Manager’s FD&D product Hanseatic Defence.
Hanseatic are not individually rated by Standard and Poor’s.
Eagle Ocean Marine was developed by the managers of the American Club, the Shipowners Claims Bureau. The product was first introduced in 2010 supported by Lloyd’s security. From July 1, 2011 however it was decided to restructure the product with American Steamship Owners Mutual Protection and Indemnity Association Inc. providing the primary security.
The change to club security represents a more direct backing of the venture by the American Club. It also brings advantages to Eagle Ocean Marine clients since American Club blue cards will now be issued (with world-wide acceptance) and IG club letters of guarantee can be provided (where appropriate) to secure claims and prevent the arrest of vessels. This latter point is likely to provide a material advantage over certain other competitors in the fixed premium P&I market.
The majority of the Lloyd’s (and others) underwriters who originally supported the project continue to be involved, though now by way of quote-share reinsurance.
Whilst the security is provided by the club, those owners buying cover from Eagle Ocean Marine are policy holders and do not become mutual members of the Association. Their insurance contract is defined in the policy terms and conditions and not in the By-Laws and Rules of the Association.
The facility is aimed at operators of smaller ships in regional trades, but excluding US operators and those trading exclusively in US waters. Eagle Ocean Marine offer P&I cover with limits up to USD 25 million and FDD with limits up to USD 2 million.
The American Club is BB+ rated by Standard and Poor’s.
By NATIONALITy OF MANAGEMENT HANSEATIC P&I
By VESSEL TyPE HANSEATIC P&I
Northern Europe 67%Turkey 24%
Russia/CIS/Eastern Europe 5%
Southern Europe 3%Middle East/North Africa 1%
Tanker 1%
Container 33%
Fishing 1%
General Cargo 41%
Miscellaneous 4%
Other Dry Cargo 12%
Passenger 1%
Bulker 7%
eAGLe OceAN MARINe www.eagleoceanmarine.com
hANseAtIc P&I www.hanseatic-pandi.com
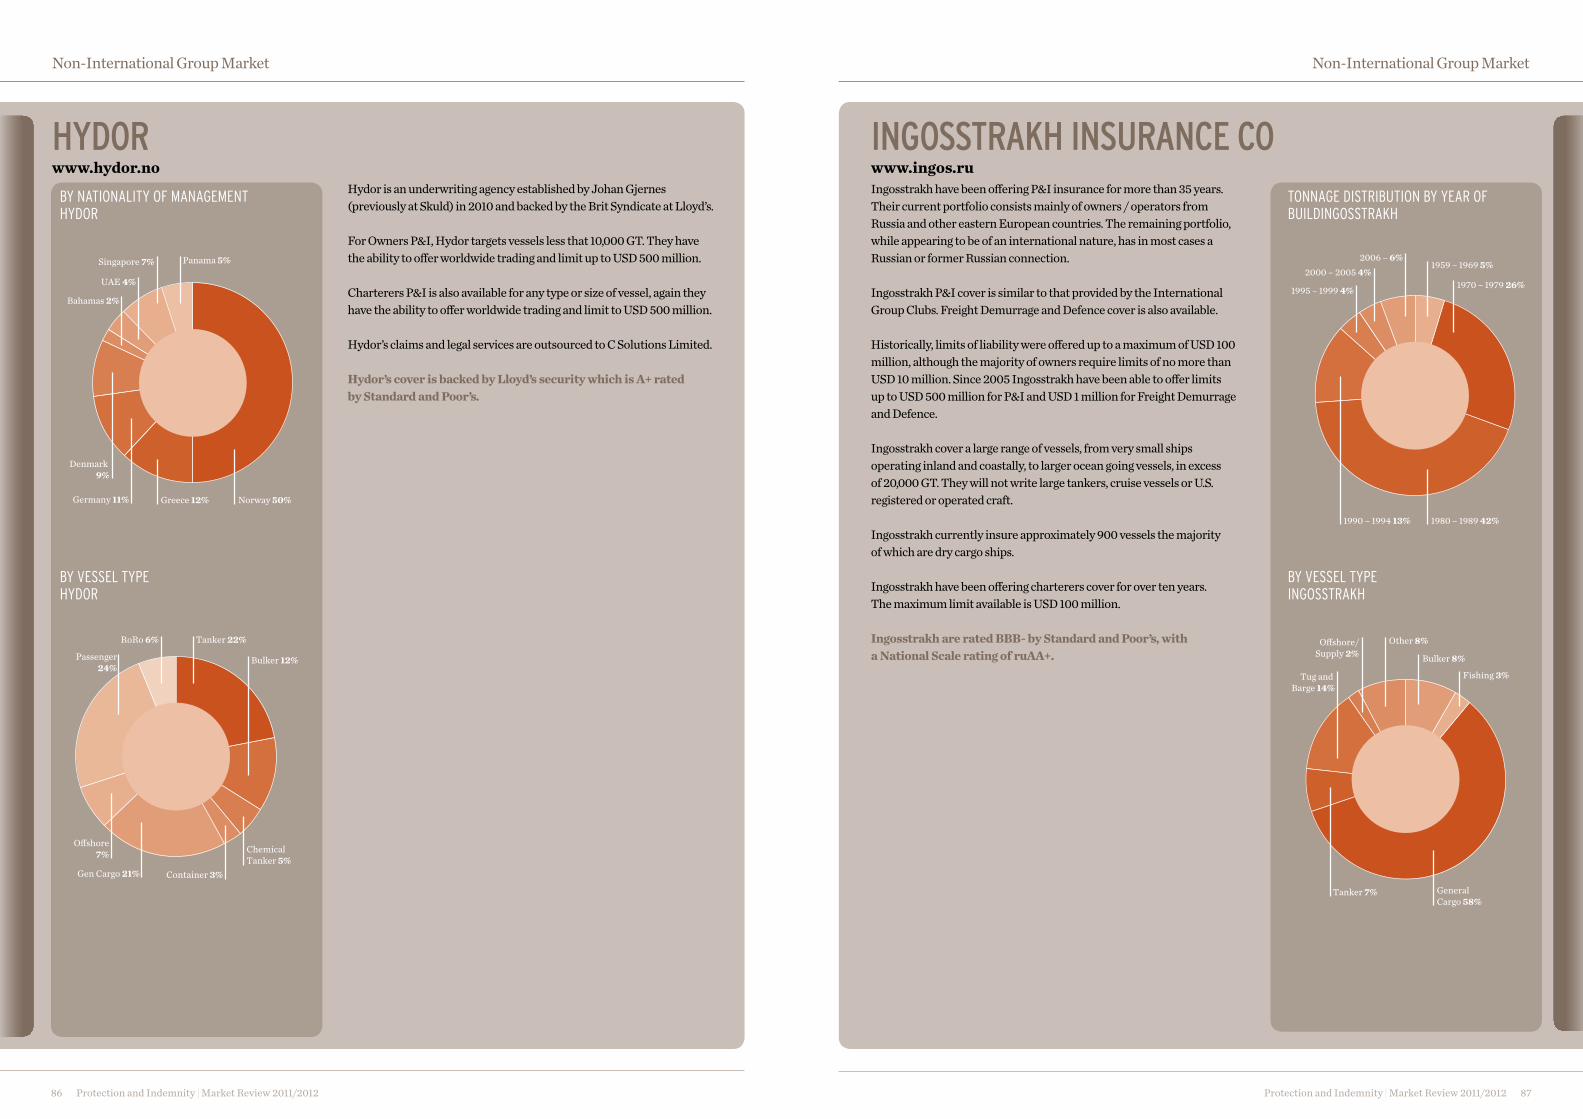
Protection and Indemnity | Market Review 2011/201286
Non-International Group Market
Protection and Indemnity | Market Review 2011/2012 87
Non-International Group Market
Ingosstrakh have been offering P&I insurance for more than 35 years. Their current portfolio consists mainly of owners / operators from Russia and other eastern European countries. The remaining portfolio, while appearing to be of an international nature, has in most cases a Russian or former Russian connection.
Ingosstrakh P&I cover is similar to that provided by the International Group Clubs. Freight Demurrage and Defence cover is also available.
Historically, limits of liability were offered up to a maximum of USD 100 million, although the majority of owners require limits of no more than USD 10 million. Since 2005 Ingosstrakh have been able to offer limits up to USD 500 million for P&I and USD 1 million for Freight Demurrage and Defence.
Ingosstrakh cover a large range of vessels, from very small ships operating inland and coastally, to larger ocean going vessels, in excess of 20,000 GT. They will not write large tankers, cruise vessels or U.S. registered or operated craft.
Ingosstrakh currently insure approximately 900 vessels the majority of which are dry cargo ships.
Ingosstrakh have been offering charterers cover for over ten years. The maximum limit available is USD 100 million.
Ingosstrakh are rated BBB- by Standard and Poor’s, with a National Scale rating of ruAA+.
Hydor is an underwriting agency established by Johan Gjernes (previously at Skuld) in 2010 and backed by the Brit Syndicate at Lloyd’s.
For Owners P&I, Hydor targets vessels less that 10,000 GT. They have the ability to offer worldwide trading and limit up to USD 500 million.
Charterers P&I is also available for any type or size of vessel, again they have the ability to offer worldwide trading and limit to USD 500 million.
Hydor’s claims and legal services are outsourced to C Solutions Limited.
Hydor’s cover is backed by Lloyd’s security which is A+ rated by Standard and Poor’s.
TONNAGE DISTRIBUTION By yEAR OF BUILDINGOSSTRAKH
By NATIONALITy OF MANAGEMENT HyDOR
By VESSEL TyPE INGOSSTRAKH
By VESSEL TyPE HyDOR
1959 – 1969 5%
1970 – 1979 26%
1980 – 1989 42%1990 – 1994 13%
1995 – 1999 4%
2000 – 2005 4%2006 – 6%
Norway 50%Greece 12%Germany 11%
Denmark 9%
Bahamas 2%
UAE 4%
Singapore 7% Panama 5%
Bulker 8%
Fishing 3%
General Cargo 58%
Tanker 7%
Tug and Barge 14%
O�shore/Supply 2%
Other 8%Tanker 22%
Bulker 12%
Chemical Tanker 5%
Container 3%Gen Cargo 21%
O�shore7%
Passenger24%
RoRo 6%
hydOR www.hydor.no
INGOsstRAKh INsURANce cO www.ingos.ru
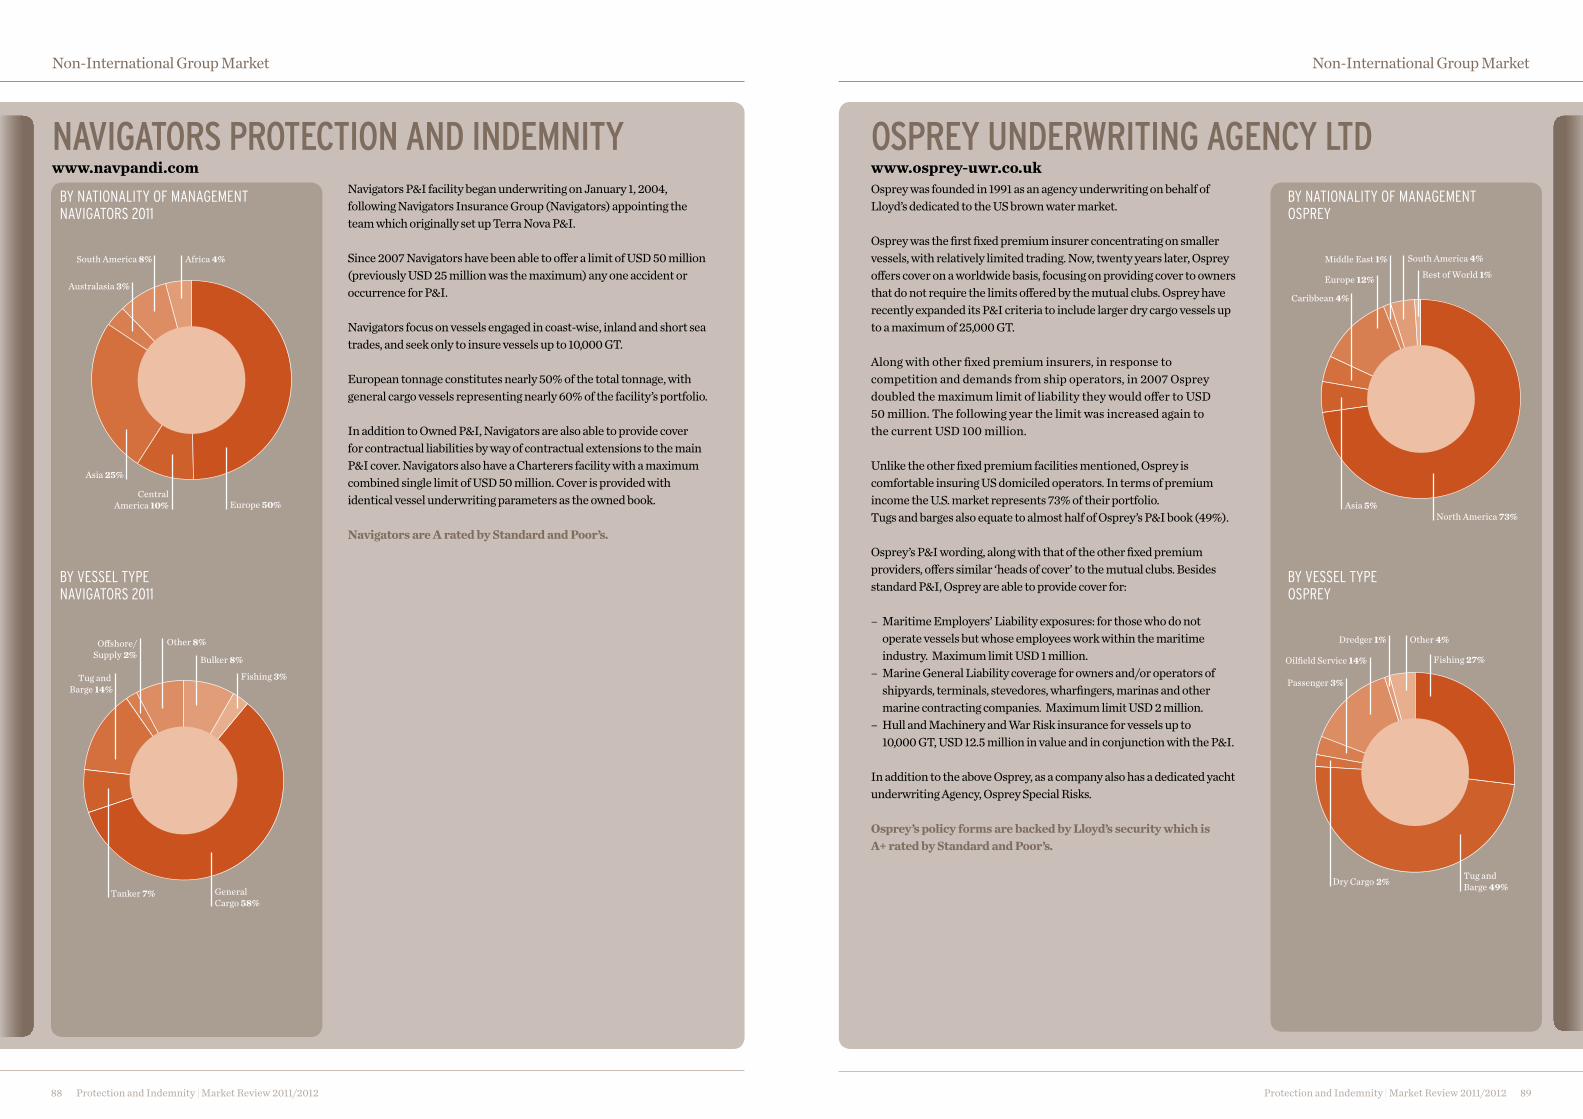
Protection and Indemnity | Market Review 2011/201288
Non-International Group Market
Protection and Indemnity | Market Review 2011/2012 89
Non-International Group Market
Osprey was founded in 1991 as an agency underwriting on behalf of Lloyd’s dedicated to the US brown water market.
Osprey was the first fixed premium insurer concentrating on smaller vessels, with relatively limited trading. Now, twenty years later, Osprey offers cover on a worldwide basis, focusing on providing cover to owners that do not require the limits offered by the mutual clubs. Osprey have recently expanded its P&I criteria to include larger dry cargo vessels up to a maximum of 25,000 GT.
Along with other fixed premium insurers, in response to competition and demands from ship operators, in 2007 Osprey doubled the maximum limit of liability they would offer to USD 50 million. The following year the limit was increased again to the current USD 100 million.
Unlike the other fixed premium facilities mentioned, Osprey is comfortable insuring US domiciled operators. In terms of premium income the U.S. market represents 73% of their portfolio.Tugs and barges also equate to almost half of Osprey’s P&I book (49%).
Osprey’s P&I wording, along with that of the other fixed premium providers, offers similar ‘heads of cover’ to the mutual clubs. Besides standard P&I, Osprey are able to provide cover for:
– Maritime Employers’ Liability exposures: for those who do not operate vessels but whose employees work within the maritime industry. Maximum limit USD 1 million.
– Marine General Liability coverage for owners and/or operators of shipyards, terminals, stevedores, wharfingers, marinas and other marine contracting companies. Maximum limit USD 2 million.
– Hull and Machinery and War Risk insurance for vessels up to 10,000 GT, USD 12.5 million in value and in conjunction with the P&I.
In addition to the above Osprey, as a company also has a dedicated yacht underwriting Agency, Osprey Special Risks.
Osprey’s policy forms are backed by Lloyd’s security which is A+ rated by Standard and Poor’s.
Navigators P&I facility began underwriting on January 1, 2004, following Navigators Insurance Group (Navigators) appointing the team which originally set up Terra Nova P&I.
Since 2007 Navigators have been able to offer a limit of USD 50 million (previously USD 25 million was the maximum) any one accident or occurrence for P&I.
Navigators focus on vessels engaged in coast-wise, inland and short sea trades, and seek only to insure vessels up to 10,000 GT.
European tonnage constitutes nearly 50% of the total tonnage, with general cargo vessels representing nearly 60% of the facility’s portfolio.
In addition to Owned P&I, Navigators are also able to provide cover for contractual liabilities by way of contractual extensions to the main P&I cover. Navigators also have a Charterers facility with a maximum combined single limit of USD 50 million. Cover is provided with identical vessel underwriting parameters as the owned book.
Navigators are A rated by Standard and Poor’s.
By NATIONALITy OF MANAGEMENT OSPREy
By NATIONALITy OF MANAGEMENT NAVIGATORS 2011
By VESSEL TyPE OSPREy
By VESSEL TyPE NAVIGATORS 2011
North America 73%Asia 5%
Caribbean 4%
Europe 12%
Middle East 1% South America 4%Rest of World 1%
Europe 50%Central
America 10%
Asia 25%
Australasia 3%
South America 8% Africa 4%
Fishing 27%
Tug and Barge 49%Dry Cargo 2%
Passenger 3%
Oilfield Service 14%
Dredger 1% Other 4%
Bulker 8%
Fishing 3%
General Cargo 58%
Tanker 7%
Tug and Barge 14%
O�shore/Supply 2%
Other 8%
NAvIGAtORs PROtectION ANd INdeMNIty www.navpandi.com
OsPRey UNdeRwRItING AGeNcy Ltd www.osprey-uwr.co.uk
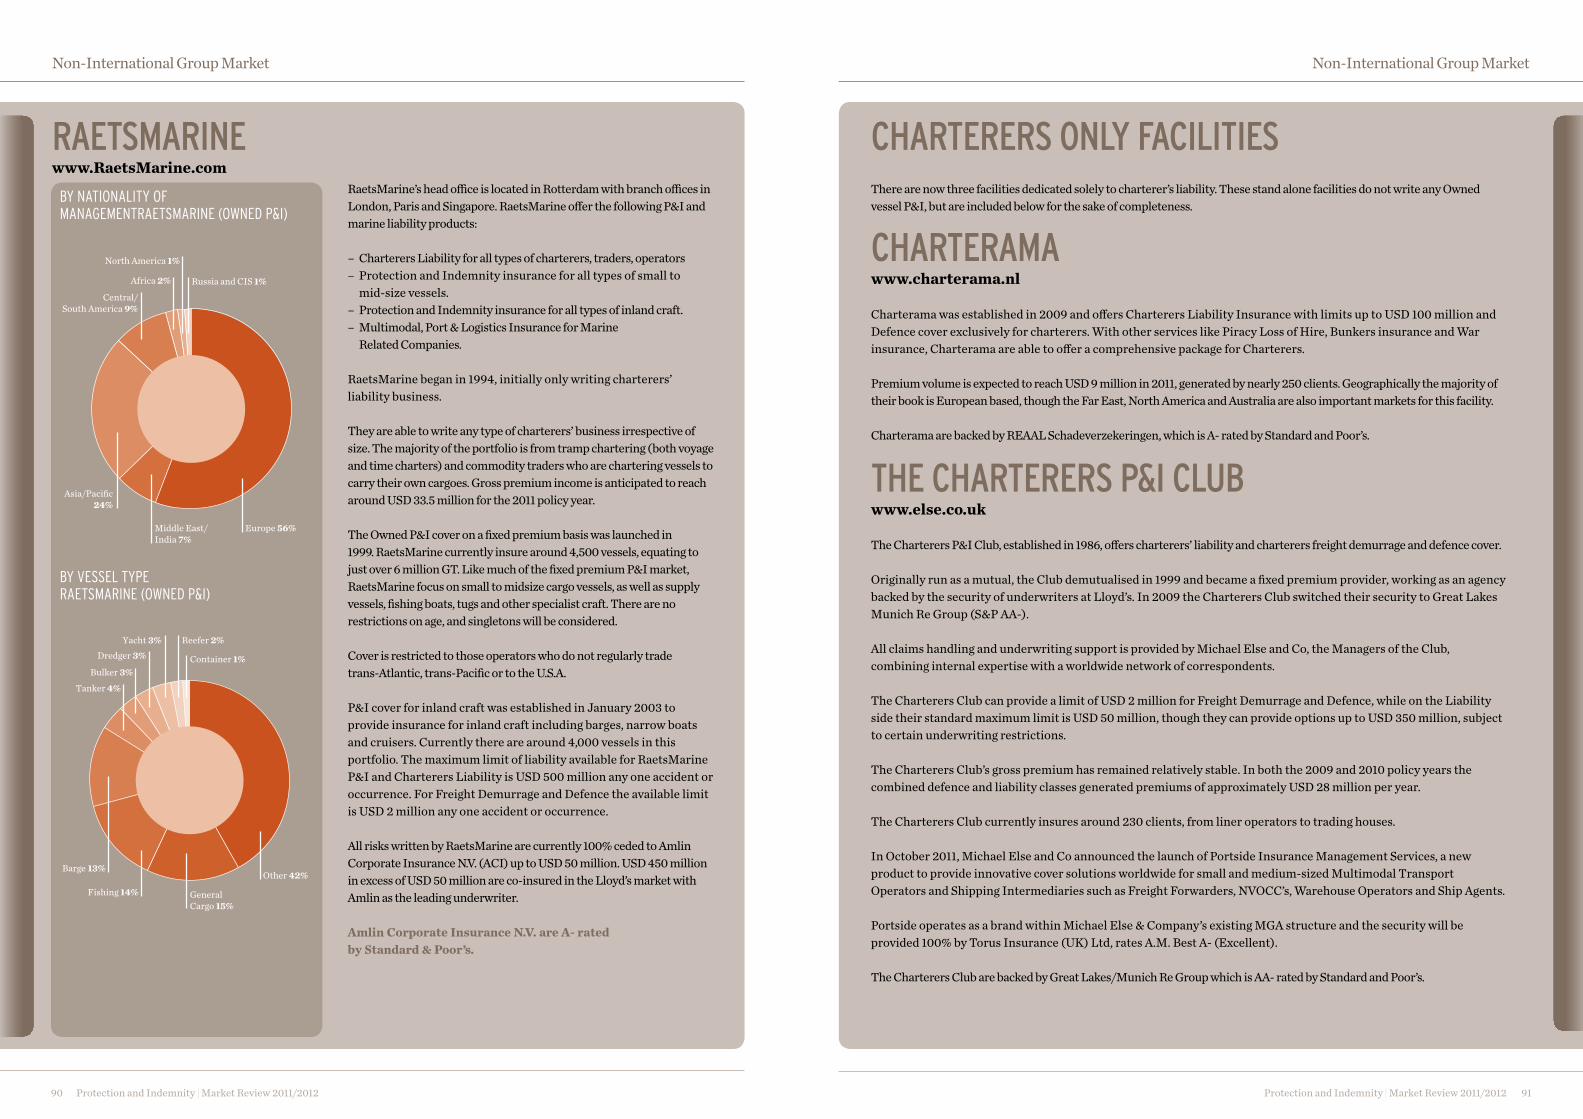
Protection and Indemnity | Market Review 2011/201290
Non-International Group Market
Protection and Indemnity | Market Review 2011/2012 91
Non-International Group Market
There are now three facilities dedicated solely to charterer’s liability. These stand alone facilities do not write any Owned vessel P&I, but are included below for the sake of completeness.
chARteRAMAwww.charterama.nl
Charterama was established in 2009 and offers Charterers Liability Insurance with limits up to USD 100 million and Defence cover exclusively for charterers. With other services like Piracy Loss of Hire, Bunkers insurance and War insurance, Charterama are able to offer a comprehensive package for Charterers.
Premium volume is expected to reach USD 9 million in 2011, generated by nearly 250 clients. Geographically the majority of their book is European based, though the Far East, North America and Australia are also important markets for this facility.
Charterama are backed by REAAL Schadeverzekeringen, which is A- rated by Standard and Poor’s.
the chARteReRs P&I cLUBwww.else.co.uk
The Charterers P&I Club, established in 1986, offers charterers’ liability and charterers freight demurrage and defence cover.
Originally run as a mutual, the Club demutualised in 1999 and became a fixed premium provider, working as an agency backed by the security of underwriters at Lloyd’s. In 2009 the Charterers Club switched their security to Great Lakes Munich Re Group (S&P AA-).
All claims handling and underwriting support is provided by Michael Else and Co, the Managers of the Club, combining internal expertise with a worldwide network of correspondents.
The Charterers Club can provide a limit of USD 2 million for Freight Demurrage and Defence, while on the Liability side their standard maximum limit is USD 50 million, though they can provide options up to USD 350 million, subject to certain underwriting restrictions.
The Charterers Club’s gross premium has remained relatively stable. In both the 2009 and 2010 policy years the combined defence and liability classes generated premiums of approximately USD 28 million per year.
The Charterers Club currently insures around 230 clients, from liner operators to trading houses.
In October 2011, Michael Else and Co announced the launch of Portside Insurance Management Services, a new product to provide innovative cover solutions worldwide for small and medium-sized Multimodal Transport Operators and Shipping Intermediaries such as Freight Forwarders, NVOCC’s, Warehouse Operators and Ship Agents.
Portside operates as a brand within Michael Else & Company’s existing MGA structure and the security will be provided 100% by Torus Insurance (UK) Ltd, rates A.M. Best A- (Excellent).
The Charterers Club are backed by Great Lakes/Munich Re Group which is AA- rated by Standard and Poor’s.
RaetsMarine’s head office is located in Rotterdam with branch offices in London, Paris and Singapore. RaetsMarine offer the following P&I and marine liability products:
– Charterers Liability for all types of charterers, traders, operators – Protection and Indemnity insurance for all types of small to
mid-size vessels.– Protection and Indemnity insurance for all types of inland craft.– Multimodal, Port & Logistics Insurance for Marine
Related Companies.
RaetsMarine began in 1994, initially only writing charterers’ liability business.
They are able to write any type of charterers’ business irrespective of size. The majority of the portfolio is from tramp chartering (both voyage and time charters) and commodity traders who are chartering vessels to carry their own cargoes. Gross premium income is anticipated to reach around USD 33.5 million for the 2011 policy year.
The Owned P&I cover on a fixed premium basis was launched in 1999. RaetsMarine currently insure around 4,500 vessels, equating to just over 6 million GT. Like much of the fixed premium P&I market, RaetsMarine focus on small to midsize cargo vessels, as well as supply vessels, fishing boats, tugs and other specialist craft. There are no restrictions on age, and singletons will be considered.
Cover is restricted to those operators who do not regularly trade trans-Atlantic, trans-Pacific or to the U.S.A.
P&I cover for inland craft was established in January 2003 to provide insurance for inland craft including barges, narrow boats and cruisers. Currently there are around 4,000 vessels in this portfolio. The maximum limit of liability available for RaetsMarine P&I and Charterers Liability is USD 500 million any one accident or occurrence. For Freight Demurrage and Defence the available limit is USD 2 million any one accident or occurrence.
All risks written by RaetsMarine are currently 100% ceded to Amlin Corporate Insurance N.V. (ACI) up to USD 50 million. USD 450 million in excess of USD 50 million are co-insured in the Lloyd’s market with Amlin as the leading underwriter.
Amlin Corporate Insurance N.V. are A- rated by Standard & Poor’s.
By NATIONALITy OF MANAGEMENTRAETSMARINE (OWNED P&I)
By VESSEL TyPE RAETSMARINE (OWNED P&I)
Europe 56%Middle East/India 7%
Asia/Pacific24%
Central/South America 9%
Africa 2%
North America 1%
Russia and CIS 1%
Other 42%
General Cargo 15%
Fishing 14%
Barge 13%
Tanker 4%Bulker 3%
Dredger 3%Yacht 3% Reefer 2%
Container 1%
RAetsMARINe www.RaetsMarine.com
chARteReRs ONLy FAcILItIes
Protection and Indemnity | Market Review 2011/201292
Non-International Group Market
the NORweGIAN hULL cLUB www.norclub.no
The Norwegian Hull Club has long been established in the hull and machinery and loss of hire markets (2012 will represent the 175th anniversary of the club). In 2008 the Club made a move into the charterers liability sector employing a team with many years experience from the Skuld P&I club. The team has since expanded from five to seven people and the premium and portfolio have grown progressively over the period. The premium income has increased from USD 5 million in 2008 to almost USD 11 million in 2010. They currently insure approximately 130 charterers. The majority of the Club’s clients are currently from Europe and Asia. The Club has the ability to offer limits up to USD 500 million. In addition to the traditional charterers P&I, damage to hull and freight demurrage and defence covers, they also have access to a range of ancillary covers for charterers. The Club has its own dedicated claims handling team.
The Norwegian Hull Club is “A-” by Standard & Poor and has reinsurance placed in the Lloyd’s market.
CONTACTs London P&I PLacIng Team
Ben AbrahamExecutive Director Email: [email protected] line: +44 20 3124 7786
Kate CollinsAccount HandlerEmail: [email protected] Direct line: +44 20 3124 7755
Jacqui CoplenAccount Handler Email: [email protected] Direct line: +44 20 3124 8202
Spencer CraneAccount Handler Email: [email protected] Direct Line: +44 203124 7709
Eilert EilertsenExecutive Director Email: [email protected] line: +44 20 3124 8009
Richard FurnessExecutive Director Email: [email protected] line: +44 20 3124 7612
Ian M. HarrisExecutive Director Email: [email protected] line: +44 20 3124 7595
Anna HarrisonAccount Handler Email: [email protected] line: +44 20 3124 7704
Paul D. HarrisonDivisional Director Email: [email protected] line: +44 20 3124 8291
Cathy NiceAccount Handler Email: [email protected] Line: +44 20 3124 7639
Andreea PetroAccount HandlerEmail: [email protected] line: +44 20 3124 7632
Nick RoblinAccount HandlerEmail: [email protected] Line: +44 20 3124 7332
Rachel SebbornExecutive Director Email: [email protected] line: +44 20 3124 7718
Lynda StuartAccount HandlerEmail: [email protected] line: +44 20 3124 7179
London cLaIms Team
George H. McMenaminExecutive Director Email: [email protected] line: +44 20 3124 7419
Claire BarryClaims BrokerEmail:[email protected] line: +44 20 3124 8638
Simon MatherExecutive Director Email: [email protected] line: +44 20 3124 7707
Kirk SimpsonClaims BrokerEmail: [email protected] line: +44 20 3124 8517
This Review is published for the benefit of clients and prospective clients of Willis. It is intended to highlight general issues relating to the subject matter which may be of interest and does not necessarily deal with every important subject nor cover every aspect of the subjects contained herein. If you intend to take any action or make any decision on the basis of the content of this bulletin, you should first seek specific professional advice and verify its content. Copyright Willis 2011. All rights reserved.
CONT
ACTs
Contacts
Protection and Indemnity | Market Review 2011/2012 95

PROTECTION AND INDEMNITY
MARKET REVIEW 2011/2012
Willis Limited
The Willis Building51 Lime StreetLondon, EC3M 7DQUnited KingdomTel: +44 (0)20 3124 6000
www.willis.com
Willis Limited, Registered number: 181116 England and Wales.Registered address: 51 Lime Street, London, EC3M 7DQ.A Lloyd’s Broker. Authorised and regulated by the Financial Services Authority.
10077/12/11
PROTECTION AND INDEMNITY | M
ARKET REVIEW 2011/2012
10077_REPORT_P&I REVIEW 2011_Cover.indd 1 19/12/2011 12:46:15