wilmington trust collective investment trust indexselect
TRANSCRIPT
WILMINGTON TRUST COLLECTIVE INVESTMENT TRUST
INDEXSELECT FUNDS SUB-ADVISED BY FLEXPATH STRATEGIES, LLC
FINANCIAL STATEMENTS
DECEMBER 31, 2020
WITH
INDEPENDENT AUDITOR'S REPORT
Wilmington Trust Collective Investment Trust IndexSelect Funds Sub-Advised by flexPATH Strategies, LLC
CONTENTS Independent Auditor's Report ..................................................................................................................................................................... 1 Fund Index ................................................................................................................................................................................................. 3 IndexSelect Aggressive Retirement Fund .................................................................................................................................................. 4 IndexSelect Aggressive 2025 Fund ............................................................................................................................................................ 8 IndexSelect Aggressive 2035 Fund .......................................................................................................................................................... 12 IndexSelect Aggressive 2045 Fund .......................................................................................................................................................... 16 IndexSelect Aggressive 2055 Fund .......................................................................................................................................................... 20 IndexSelect Moderate Retirement Fund ................................................................................................................................................... 24 IndexSelect Moderate 2025 Fund ............................................................................................................................................................ 28 IndexSelect Moderate 2035 Fund ............................................................................................................................................................ 32 IndexSelect Moderate 2045 Fund ............................................................................................................................................................ 36 IndexSelect Moderate 2055 Fund ............................................................................................................................................................ 40 IndexSelect Conservative Retirement Fund ............................................................................................................................................. 44 IndexSelect Conservative 2025 Fund....................................................................................................................................................... 48 IndexSelect Conservative 2035 Fund....................................................................................................................................................... 52 IndexSelect Conservative 2045 Fund....................................................................................................................................................... 56 IndexSelect Conservative 2055 Fund....................................................................................................................................................... 60 Notes to the Financial Statements............................................................................................................................................................ 64
1
INDEPENDENT AUDITOR'S REPORT Wilmington Trust, N.A., Trustee for Wilmington Trust Collective Investment Trust Report on the Financial Statements We have audited the accompanying financial statements of the IndexSelect Funds sub-advised by flexPATH Strategies, LLC of Wilmington Trust Collective Investment Trust (the "Trust"), comprising the Funds (the "Funds") included on the Fund Index on page 3, which comprise the statements of assets and liabilities, including the schedules of investments, as of December 31, 2020, the related statements of operations and changes in net assets, and the financial highlights for the year then ended, and the related notes to the financial statements. These financial statements and financial highlights are hereinafter collectively referred to as financial statements. Management's Responsibility for the Financial Statements Management is responsible for the preparation and fair presentation of these financial statements in accordance with accounting principles generally accepted in the United States of America; this includes the design, implementation, and maintenance of internal control relevant to the preparation and fair presentation of financial statements that are free from material misstatement, whether due to fraud or error. Auditor's Responsibility Our responsibility is to express an opinion on these financial statements based on our audits. We conducted our audits in accordance with auditing standards generally accepted in the United States of America. Those standards require that we plan and perform the audits to obtain reasonable assurance about whether the financial statements are free from material misstatement. An audit involves performing procedures to obtain audit evidence about the amounts and disclosures in the financial statements. The procedures selected depend on the auditor's judgment, including the assessment of the risks of material misstatement of the financial statements, whether due to fraud or error. In making those risk assessments, the auditor considers internal control relevant to the entity's preparation and fair presentation of the financial statements in order to design audit procedures that are appropriate in the circumstances, but not for the purpose of expressing an opinion on the effectiveness of the entity's internal control. Accordingly, we express no such opinion. An audit also includes evaluating the appropriateness of accounting policies used and the reasonableness of significant accounting estimates made by management, as well as evaluating the overall presentation of the financial statements. We believe that the audit evidence we have obtained is sufficient and appropriate to provide a basis for our audit opinion. Opinion In our opinion, the financial statements referred to above present fairly, in all material respects, the financial position of each of the Funds as of December 31, 2020, the results of its operations, changes in its net assets and its financial highlights for the for the year then ended, in accordance with accounting principles generally accepted in the United States of America.
www.hogantaylor.com

2
Other Matter Our audits were conducted for the purpose of forming an opinion on the financial statements of each Fund as a whole. The supplementary information for the year ended December 31, 2020, following the schedule of investments, is presented for purposes of additional analysis and is not a required part of the financial statements. Such information is the responsibility of management and was derived from and relates directly to the underlying accounting and other records used to prepare the financial statements. The information has been subjected to the auditing procedures applied in the audits of the financial statements and certain additional procedures, including comparing and reconciling such information directly to the underlying accounting and other records used to prepare the financial statements or to the financial statements themselves, and other additional procedures in accordance with auditing standards generally accepted in the United States of America. In our opinion, the information is fairly stated in all material respects in relation to the financial statements as a whole.
Tulsa, Oklahoma April 30, 2021
flexPATH Strategies, LLC

Wilmington Trust Collective Investment Trust IndexSelect Funds Sub-Advised by flexPATH Strategies, LLC
3
FUND INDEX
FUND NAME FUND OBJECTIVE All IndexSelect Aggressive Funds
(Inclusive of the Retirement, 2025, 2035, 2045, and 2055 Funds)
The Funds seek to provide long-term investors with an asset allocation strategy designed to maximize their retirement savings consistent with the risk that investors with an aggressive risk tolerance may be willing to accept given their investment time horizon.
All IndexSelect Moderate Funds (Inclusive
of the Retirement, 2025, 2035, 2045, and 2055 Funds)
The Funds seek to provide long-term investors with an asset allocation strategy designed to maximize their retirement savings consistent with the risk that investors with a moderate risk tolerance may be willing to accept given their investment time horizon.
All IndexSelect Conservative Funds
(Inclusive of the Retirement, 2025, 2035, 2045, and 2055 Funds)
The Funds seek to provide long-term investors with an asset allocation strategy designed to maximize their retirement savings consistent with the risk that investors with a conservative risk tolerance may be willing to accept given their investment time horizon.

Wilmington Trust Collective Investment Trust IndexSelect Funds Sub-Advised by flexPATH Strategies, LLC
See Notes to the Financial Statements. 4
IndexSelect Aggressive Retirement Fund
Schedule of Investments December 31, 2020
Principal
Amount or FairShares Cost Value
Collective Funds - 100.0%BlackRock MSCI ACWI ex-U.S. IMI Index Fund F 311,152 4,134,322$ 5,062,602$ Commodity Index Daily Fund F 86,312 386,852 432,398 Developed Real Estate Index Fund F 31,569 590,548 685,461 Russell 1000® Index Fund F 157,447 6,490,816 8,110,214 Russell 2000® Index Fund F 13,514 583,655 842,947 U.S. Debt Index Fund F 18,753 681,026 683,191 U.S. Treasury Inflation Protected Securities Fund F 64,215 1,475,185 1,582,857 WTNA Stable Value Fund Class R 1,212,067 12,617,432 12,788,158
Total Investments - 100.0% 26,959,836$ 30,187,828 Other Assets and Liabilities, Net - (0.0%) (15,007) Net Assets - 100% 30,172,821$
The following is a summary of the fair value of the investments in the Fund based on the inputs used to value them as of December 31, 2020 (see Note 3):
InvestmentsMeasured at
Level 1 Level 2 Level 3 Net Asset Value* Total
Collective Funds -$ -$ -$ 30,187,828$ 30,187,828$ Total -$ -$ -$ 30,187,828$ 30,187,828$
Fair Value Measurements
*Certain investments that are measured at fair value using the net asset value per share (or its equivalent) as a practical expedient have not been categorized in the fair value hierarchy. The fair value amounts presented in this table are intended to permit reconciliation of the fair value hierarchy to the amounts presented in the Statement of Assets and Liabilities. Concentration of Ownership: As of December 31, 2020, the Fund had two unitholders holding 10% or more of the outstanding units of the Fund, and aggregated to 20.8% of the Fund's total units outstanding. Supplementary Information: Total investment purchases, sales proceeds, and realized gain for the year ended December 31, 2020, were:
Purchases Sales Realizedat Cost Proceeds Gain
Investments 24,184,920$ 18,663,787$ 899,895$

Wilmington Trust Collective Investment Trust IndexSelect Funds Sub-Advised by flexPATH Strategies, LLC
See Notes to the Financial Statements. 5
AssetsInvestments in securities, at fair value (cost $26,959,836) 30,187,828$ Receivable for fund units sold 22,386 Receivable for reimbursement 16 Total assets 30,210,230
Liabilities and Net AssetsPayable for investment securities purchased 17,121 Payable for fund units redeemed 5,265 Accrued expenses 15,023 Total liabilities 37,409 Net assets 30,172,821$
ExpensesTrustee, management and service provider fees 32,533$ Professional services and other operating expenses 6,829 Total expenses 39,362 Net investment loss (39,362)
Net realized gain on:Investments 899,895
Net change in unrealized appreciation on:Investments 2,049,702 Net realized and unrealized gain on investments 2,949,597 Net increase in net assets resulting from operations 2,910,235$
IndexSelect Aggressive Retirement Fund
Statement of OperationsFor the year ended December 31, 2020
Statement of Assets and LiabilitiesDecember 31, 2020

Wilmington Trust Collective Investment Trust IndexSelect Funds Sub-Advised by flexPATH Strategies, LLC
See Notes to the Financial Statements. 6
Increase in net assets resulting from operationsNet investment loss (39,362)$ Net realized gain on investments 899,895 Net change in unrealized appreciation on investments 2,049,702 Net increase in net assets resulting from operations 2,910,235
Fund unit transactionsProceeds from units issuedClass I 12,594,649 Class I1 854,540 Class R 8,647 Class R6 1,485,551 Total proceeds from units issued 14,943,387
Value of units redeemedClass I (8,074,529) Class I1 (255,527) Class R (28,140) Class R6 (1,030,403) Total value of units redeemed (9,388,599)
Increase in net assets resulting from fund unit transactions 5,554,788
Increase in net assets 8,465,023
Net assets, beginning of year 21,707,798 Net assets, end of year 30,172,821$
Statement of Changes in Net AssetsFor the year ended December 31, 2020
IndexSelect Aggressive Retirement Fund

Wilmington Trust Collective Investment Trust IndexSelect Funds Sub-Advised by flexPATH Strategies, LLC
See Notes to the Financial Statements. 7
Per Unit Operating Performance Class I Class I1 Class R Class R6Net asset value, beginning of year 11.77$ 11.78$ 11.58$ 11.76$ Income from investment operations:
Net investment loss (1) (0.02) (0.02) (0.10) (0.01) Net realized and unrealized gain on investments (1) 1.19 1.18 1.16 1.18
Total income from investment operations 1.17 1.16 1.06 1.17 Net asset value, end of year 12.94$ 12.94$ 12.64$ 12.93$
Total Return 9.94% 9.85% 9.15% 9.95%
Supplemental DataRatio to average net assets:
Expenses 0.14% 0.19% 0.94% 0.11%Net investment loss (0.14%) (0.19%) (0.94%) (0.11%)
Fund Unit ActivityUnits, beginning of year 1,717,272 6,318 1,774 118,593 Issued 1,076,004 78,175 786 125,397 Redeemed (677,271) (24,737) (2,471) (87,234) Units, end of year 2,116,005 59,756 89 156,756 (1) Based on average units outstanding.
Financial HighlightsFor the year ended December 31, 2020
IndexSelect Aggressive Retirement Fund
Wilmington Trust Collective Investment Trust IndexSelect Funds Sub-Advised by flexPATH Strategies, LLC
See Notes to the Financial Statements. 8
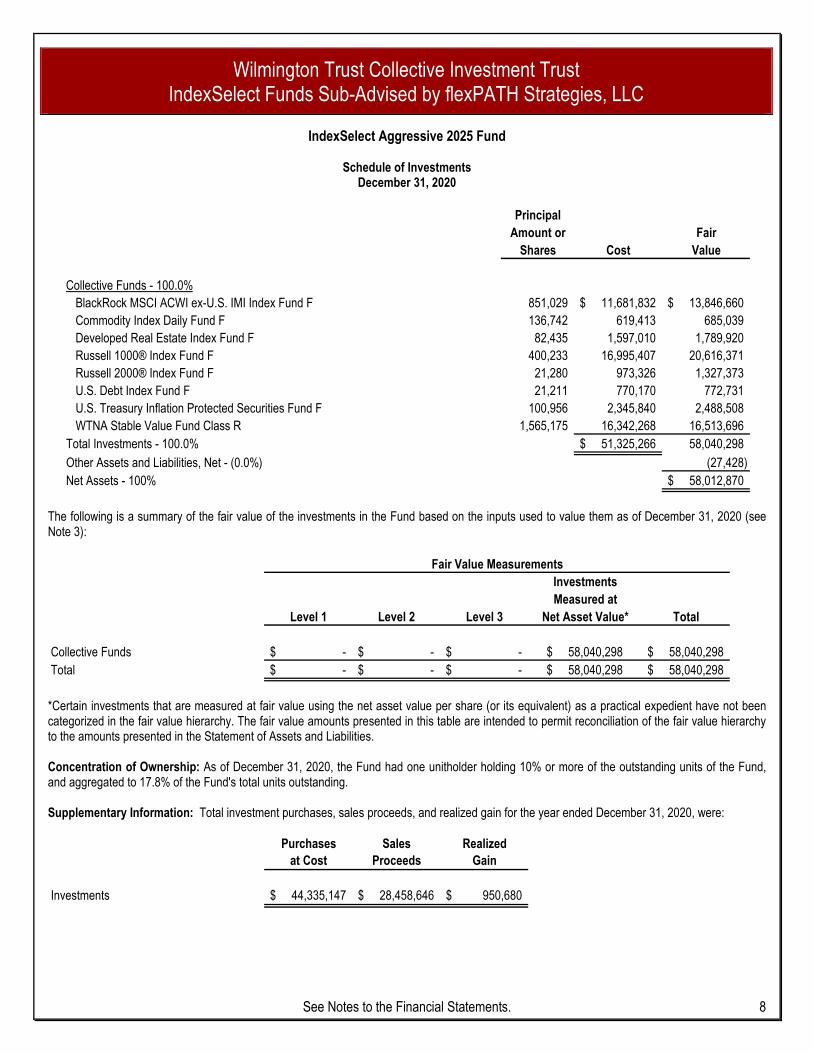
IndexSelect Aggressive 2025 Fund
Schedule of Investments December 31, 2020
Principal
Amount or FairShares Cost Value
Collective Funds - 100.0%BlackRock MSCI ACWI ex-U.S. IMI Index Fund F 851,029 11,681,832$ 13,846,660$ Commodity Index Daily Fund F 136,742 619,413 685,039 Developed Real Estate Index Fund F 82,435 1,597,010 1,789,920 Russell 1000® Index Fund F 400,233 16,995,407 20,616,371 Russell 2000® Index Fund F 21,280 973,326 1,327,373 U.S. Debt Index Fund F 21,211 770,170 772,731 U.S. Treasury Inflation Protected Securities Fund F 100,956 2,345,840 2,488,508 WTNA Stable Value Fund Class R 1,565,175 16,342,268 16,513,696
Total Investments - 100.0% 51,325,266$ 58,040,298 Other Assets and Liabilities, Net - (0.0%) (27,428) Net Assets - 100% 58,012,870$
The following is a summary of the fair value of the investments in the Fund based on the inputs used to value them as of December 31, 2020 (see Note 3):
InvestmentsMeasured at
Level 1 Level 2 Level 3 Net Asset Value* Total
Collective Funds -$ -$ -$ 58,040,298$ 58,040,298$ Total -$ -$ -$ 58,040,298$ 58,040,298$
Fair Value Measurements
*Certain investments that are measured at fair value using the net asset value per share (or its equivalent) as a practical expedient have not been categorized in the fair value hierarchy. The fair value amounts presented in this table are intended to permit reconciliation of the fair value hierarchy to the amounts presented in the Statement of Assets and Liabilities. Concentration of Ownership: As of December 31, 2020, the Fund had one unitholder holding 10% or more of the outstanding units of the Fund, and aggregated to 17.8% of the Fund's total units outstanding. Supplementary Information: Total investment purchases, sales proceeds, and realized gain for the year ended December 31, 2020, were:
Purchases Sales Realizedat Cost Proceeds Gain
Investments 44,335,147$ 28,458,646$ 950,680$

Wilmington Trust Collective Investment Trust IndexSelect Funds Sub-Advised by flexPATH Strategies, LLC
See Notes to the Financial Statements. 9
AssetsInvestments in securities, at fair value (cost $51,325,266) 58,040,298$ Receivable for investment securities sold 311,987 Receivable for fund units sold 23,624 Total assets 58,375,909
Liabilities and Net AssetsPayable for fund units redeemed 335,611 Accrued expenses 27,428 Total liabilities 363,039 Net assets 58,012,870$
ExpensesTrustee, management and service provider fees 54,695$ Professional services and other operating expenses 13,949 Total expenses 68,644 Net investment loss (68,644)
Net realized gain on:Investments 950,680
Net change in unrealized appreciation on:Investments 4,720,252 Net realized and unrealized gain on investments 5,670,932 Net increase in net assets resulting from operations 5,602,288$
IndexSelect Aggressive 2025 Fund
Statement of OperationsFor the year ended December 31, 2020
Statement of Assets and LiabilitiesDecember 31, 2020

Wilmington Trust Collective Investment Trust IndexSelect Funds Sub-Advised by flexPATH Strategies, LLC
See Notes to the Financial Statements. 10
Increase in net assets resulting from operationsNet investment loss (68,644)$ Net realized gain on investments 950,680 Net change in unrealized appreciation on investments 4,720,252 Net increase in net assets resulting from operations 5,602,288
Fund unit transactionsProceeds from units issuedClass I 23,764,473 Class I1 2,707,238 Class R 118,645 Class R6 4,770,929 Total proceeds from units issued 31,361,285
Value of units redeemedClass I (11,733,827) Class I1 (1,370,975) Class R (152,112) Class R6 (2,173,955) Total value of units redeemed (15,430,869)
Increase in net assets resulting from fund unit transactions 15,930,416
Increase in net assets 21,532,704
Net assets, beginning of year 36,480,166 Net assets, end of year 58,012,870$
Statement of Changes in Net AssetsFor the year ended December 31, 2020
IndexSelect Aggressive 2025 Fund

Wilmington Trust Collective Investment Trust IndexSelect Funds Sub-Advised by flexPATH Strategies, LLC
See Notes to the Financial Statements. 11
Per Unit Operating Performance Class I Class I1 Class R Class R6Net asset value, beginning of year 12.35$ 12.34$ 12.11$ 12.35$ Income from investment operations:
Net investment loss (1) (0.02) (0.03) (0.11) (0.01) Net realized and unrealized gain on investments (1) 1.41 1.43 1.36 1.40
Total income from investment operations 1.39 1.40 1.25 1.39 Net asset value, end of year 13.74$ 13.74$ 13.36$ 13.74$
Total Return 11.26% 11.35% 10.32% 11.26%
Supplemental DataRatio to average net assets:
Expenses 0.15% 0.20% 0.95% 0.12%Net investment loss (0.15%) (0.20%) (0.95%) (0.12%)
Fund Unit ActivityUnits, beginning of year 2,169,747 106,961 20,487 657,671 Issued 1,930,082 229,088 9,907 383,894 Redeemed (969,273) (116,859) (12,229) (186,040) Units, end of year 3,130,556 219,190 18,165 855,525 (1) Based on average units outstanding.
Financial HighlightsFor the year ended December 31, 2020
IndexSelect Aggressive 2025 Fund

Wilmington Trust Collective Investment Trust IndexSelect Funds Sub-Advised by flexPATH Strategies, LLC
See Notes to the Financial Statements. 12
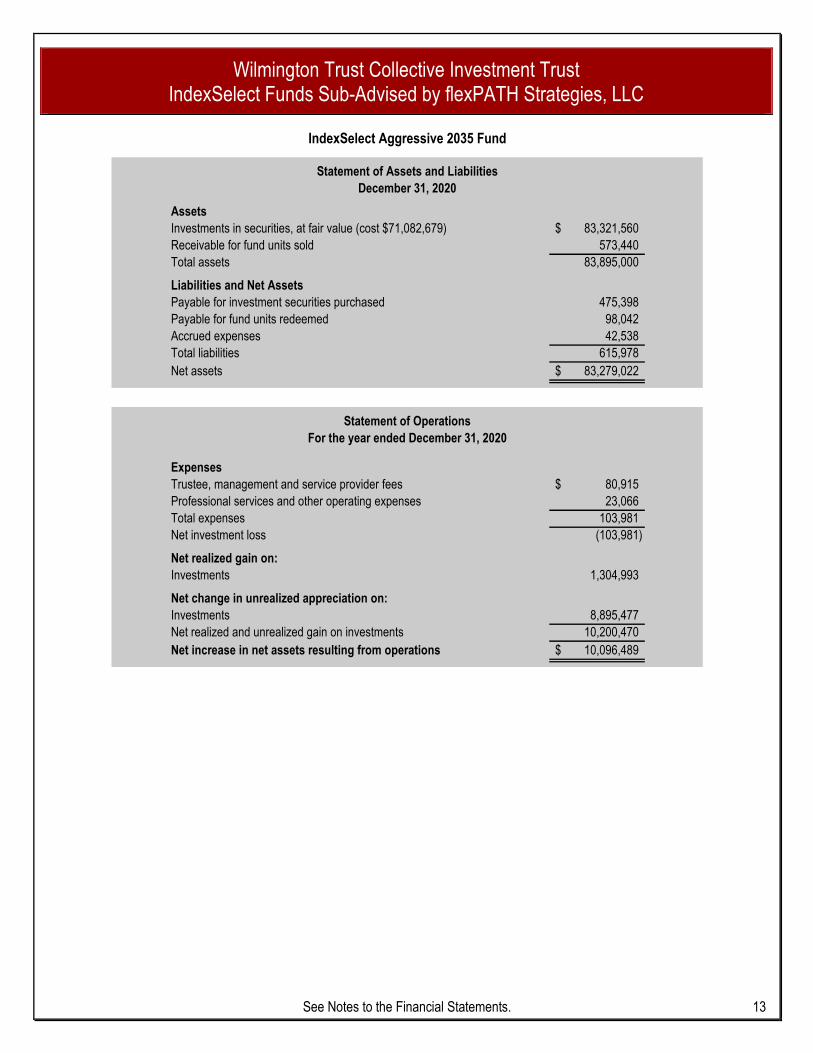
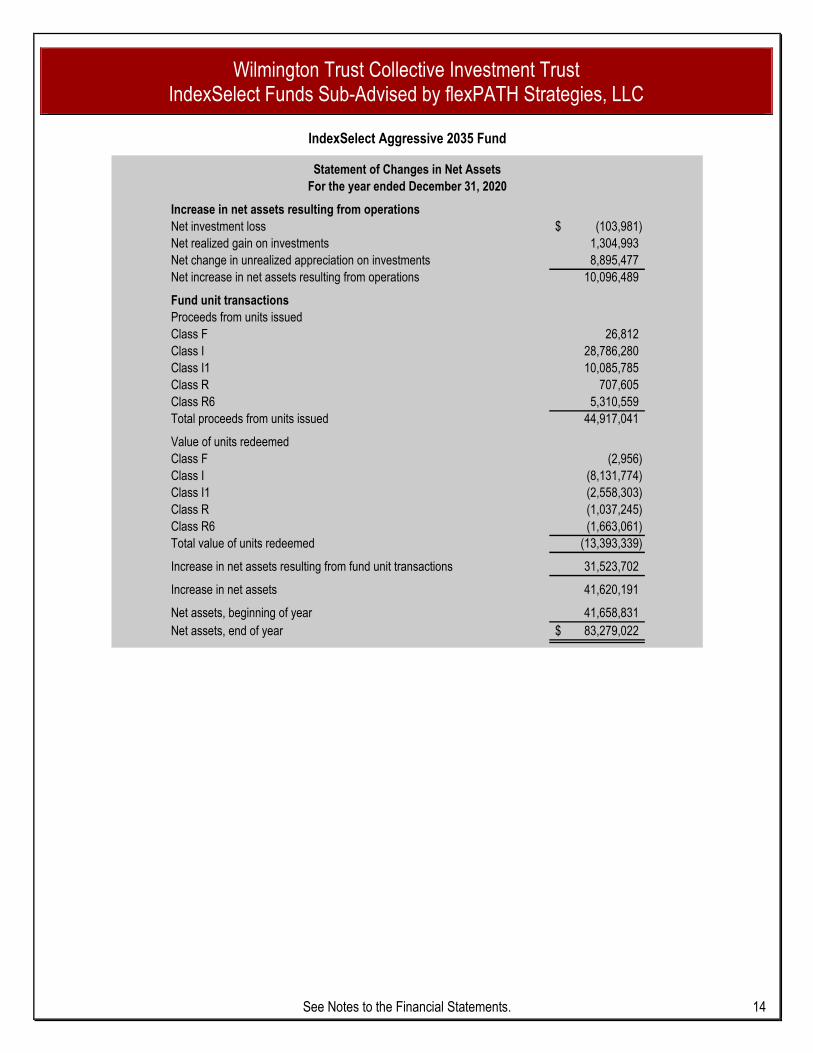
IndexSelect Aggressive 2035 Fund
Schedule of Investments December 31, 2020
Principal
Amount or FairShares Cost Value
Collective Funds - 100.1%BlackRock MSCI ACWI ex-U.S. IMI Index Fund F 1,750,937 24,177,280$ 28,488,614$ Commodity Index Daily Fund F 92,470 417,558 463,246 Developed Real Estate Index Fund F 164,083 3,292,476 3,562,727 Russell 1000® Index Fund F 774,899 32,792,413 39,915,763 Russell 2000® Index Fund F 21,226 998,530 1,323,984 U.S. Debt Index Fund F 12,526 455,095 456,347 U.S. Treasury Inflation Protected Securities Fund F 68,117 1,588,151 1,679,061 WTNA Stable Value Fund Class R 704,391 7,361,176 7,431,818
Total Investments - 100.1% 71,082,679$ 83,321,560 Other Assets and Liabilities, Net - (0.1%) (42,538) Net Assets - 100% 83,279,022$
The following is a summary of the fair value of the investments in the Fund based on the inputs used to value them as of December 31, 2020 (see Note 3):
InvestmentsMeasured at
Level 1 Level 2 Level 3 Net Asset Value* Total
Collective Funds -$ -$ -$ 83,321,560$ 83,321,560$ Total -$ -$ -$ 83,321,560$ 83,321,560$
Fair Value Measurements
*Certain investments that are measured at fair value using the net asset value per share (or its equivalent) as a practical expedient have not been categorized in the fair value hierarchy. The fair value amounts presented in this table are intended to permit reconciliation of the fair value hierarchy to the amounts presented in the Statement of Assets and Liabilities. Supplementary Information: Total investment purchases, sales proceeds, and realized gain for the year ended December 31, 2020, were:
Purchases Sales Realizedat Cost Proceeds Gain
Investments 54,406,552$ 22,961,804$ 1,304,993$
Wilmington Trust Collective Investment Trust IndexSelect Funds Sub-Advised by flexPATH Strategies, LLC
See Notes to the Financial Statements. 13
AssetsInvestments in securities, at fair value (cost $71,082,679) 83,321,560$ Receivable for fund units sold 573,440 Total assets 83,895,000
Liabilities and Net AssetsPayable for investment securities purchased 475,398 Payable for fund units redeemed 98,042 Accrued expenses 42,538 Total liabilities 615,978 Net assets 83,279,022$
ExpensesTrustee, management and service provider fees 80,915$ Professional services and other operating expenses 23,066 Total expenses 103,981 Net investment loss (103,981)
Net realized gain on:Investments 1,304,993
Net change in unrealized appreciation on:Investments 8,895,477 Net realized and unrealized gain on investments 10,200,470 Net increase in net assets resulting from operations 10,096,489$
IndexSelect Aggressive 2035 Fund
Statement of OperationsFor the year ended December 31, 2020
Statement of Assets and LiabilitiesDecember 31, 2020
Wilmington Trust Collective Investment Trust IndexSelect Funds Sub-Advised by flexPATH Strategies, LLC
See Notes to the Financial Statements. 14
Increase in net assets resulting from operationsNet investment loss (103,981)$ Net realized gain on investments 1,304,993 Net change in unrealized appreciation on investments 8,895,477 Net increase in net assets resulting from operations 10,096,489
Fund unit transactionsProceeds from units issuedClass F 26,812 Class I 28,786,280 Class I1 10,085,785 Class R 707,605 Class R6 5,310,559 Total proceeds from units issued 44,917,041
Value of units redeemedClass F (2,956) Class I (8,131,774) Class I1 (2,558,303) Class R (1,037,245) Class R6 (1,663,061) Total value of units redeemed (13,393,339)
Increase in net assets resulting from fund unit transactions 31,523,702
Increase in net assets 41,620,191
Net assets, beginning of year 41,658,831 Net assets, end of year 83,279,022$
Statement of Changes in Net AssetsFor the year ended December 31, 2020
IndexSelect Aggressive 2035 Fund

Wilmington Trust Collective Investment Trust IndexSelect Funds Sub-Advised by flexPATH Strategies, LLC
See Notes to the Financial Statements. 15
Per Unit Operating Performance Class F Class I Class I1Net asset value, beginning of year 13.06$ 13.04$ 13.04$ Income from investment operations:
Net investment loss (1) (0.01) (0.02) (0.03) Net realized and unrealized gain on investments (1) 1.83 1.83 1.84
Total income from investment operations 1.82 1.81 1.81 Net asset value, end of year 14.88$ 14.85$ 14.85$
Total Return 13.94% 13.88% 13.88%
Supplemental DataRatio to average net assets:
Expenses 0.11% 0.16% 0.21%Net investment loss (0.11%) (0.16%) (0.21%)
Fund Unit ActivityUnits, beginning of year 36,240 2,192,880 225,333 Issued 2,205 2,216,227 788,725 Redeemed (228) (637,632) (210,678) Units, end of year 38,217 3,771,475 803,380
Per Unit Operating Performance Class R Class R6Net asset value, beginning of year 12.77$ 13.32$ Income from investment operations:
Net investment loss (1) (0.12) (0.02) Net realized and unrealized gain on investments (1) 1.77 1.87
Total income from investment operations 1.65 1.85 Net asset value, end of year 14.42$ 15.17$
Total Return 12.92% 13.89%
Supplemental DataRatio to average net assets:
Expenses 0.96% 0.12%Net investment loss (0.96%) (0.12%)
Fund Unit ActivityUnits, beginning of year 33,156 692,909 Issued 63,642 397,227 Redeemed (80,325) (131,908) Units, end of year 16,473 958,228 (1) Based on average units outstanding.
Financial HighlightsFor the year ended December 31, 2020
IndexSelect Aggressive 2035 Fund

Wilmington Trust Collective Investment Trust IndexSelect Funds Sub-Advised by flexPATH Strategies, LLC
See Notes to the Financial Statements. 16
IndexSelect Aggressive 2045 Fund
Schedule of Investments December 31, 2020
Principal
Amount or FairShares Cost Value
Collective Funds - 100.1%BlackRock MSCI ACWI ex-U.S. IMI Index Fund F 1,485,490 20,283,688$ 24,169,642$ Commodity Index Daily Fund F 13,575 60,523 68,009 Developed Real Estate Index Fund F 137,005 2,746,862 2,974,795 Russell 1000® Index Fund F 643,607 26,989,162 33,152,771 Russell 2000® Index Fund F 12,934 600,023 806,797 U.S. Debt Index Fund F 1,233 44,794 44,903 U.S. Treasury Inflation Protected Securities Fund F 9,949 233,113 245,239 WTNA Stable Value Fund Class R 75,588 790,322 797,511
Total Investments - 100.1% 51,748,487$ 62,259,667 Other Assets and Liabilities, Net - (0.1%) (32,762) Net Assets - 100% 62,226,905$
The following is a summary of the fair value of the investments in the Fund based on the inputs used to value them as of December 31, 2020 (see Note 3):
InvestmentsMeasured at
Level 1 Level 2 Level 3 Net Asset Value* Total
Collective Funds -$ -$ -$ 62,259,667$ 62,259,667$ Total -$ -$ -$ 62,259,667$ 62,259,667$
Fair Value Measurements
*Certain investments that are measured at fair value using the net asset value per share (or its equivalent) as a practical expedient have not been categorized in the fair value hierarchy. The fair value amounts presented in this table are intended to permit reconciliation of the fair value hierarchy to the amounts presented in the Statement of Assets and Liabilities. Supplementary Information: Total investment purchases, sales proceeds, and realized gain for the year ended December 31, 2020, were:
Purchases Sales Realizedat Cost Proceeds Gain
Investments 37,277,625$ 15,608,818$ 846,502$

Wilmington Trust Collective Investment Trust IndexSelect Funds Sub-Advised by flexPATH Strategies, LLC
See Notes to the Financial Statements. 17
AssetsInvestments in securities, at fair value (cost $51,748,487) 62,259,667$ Receivable for fund units sold 406,341 Total assets 62,666,008
Liabilities and Net AssetsPayable for fund units redeemed 291,046 Payable for investment securities purchased 115,294 Accrued expenses 32,763 Total liabilities 439,103 Net assets 62,226,905$
ExpensesTrustee, management and service provider fees 59,843$ Professional services and other operating expenses 18,397 Total expenses 78,240 Net investment loss (78,240)
Net realized gain on:Investments 846,502
Net change in unrealized appreciation on:Investments 7,437,405 Net realized and unrealized gain on investments 8,283,907 Net increase in net assets resulting from operations 8,205,667$
IndexSelect Aggressive 2045 Fund
Statement of OperationsFor the year ended December 31, 2020
Statement of Assets and LiabilitiesDecember 31, 2020

Wilmington Trust Collective Investment Trust IndexSelect Funds Sub-Advised by flexPATH Strategies, LLC
See Notes to the Financial Statements. 18
Increase in net assets resulting from operationsNet investment loss (78,240)$ Net realized gain on investments 846,502 Net change in unrealized appreciation on investments 7,437,405 Net increase in net assets resulting from operations 8,205,667
Fund unit transactionsProceeds from units issuedClass I 22,741,256 Class I1 6,769,521 Class R 126,713 Class R6 2,566,763 Total proceeds from units issued 32,204,253
Value of units redeemedClass I (6,642,289) Class I1 (3,240,067) Class R (350,526) Class R6 (241,380) Total value of units redeemed (10,474,262)
Increase in net assets resulting from fund unit transactions 21,729,991
Increase in net assets 29,935,658
Net assets, beginning of year 32,291,247 Net assets, end of year 62,226,905$
Statement of Changes in Net AssetsFor the year ended December 31, 2020
IndexSelect Aggressive 2045 Fund

Wilmington Trust Collective Investment Trust IndexSelect Funds Sub-Advised by flexPATH Strategies, LLC
See Notes to the Financial Statements. 19
Per Unit Operating Performance Class I Class I1 Class R Class R6Net asset value, beginning of year 13.23$ 13.22$ 12.95$ 13.24$ Income from investment operations:
Net investment loss (1) (0.02) (0.03) (0.12) (0.02) Net realized and unrealized gain on investments (1) 2.02 2.03 1.97 2.03
Total income from investment operations 2.00 2.00 1.85 2.01 Net asset value, end of year 15.23$ 15.22$ 14.80$ 15.25$
Total Return 15.12% 15.13% 14.29% 15.18%
Supplemental DataRatio to average net assets:
Expenses 0.16% 0.21% 0.96% 0.13%Net investment loss (0.16%) (0.21%) (0.96%) (0.13%)
Fund Unit ActivityUnits, beginning of year 1,768,565 400,344 25,565 246,751 Issued 1,752,983 530,074 11,205 193,739 Redeemed (531,876) (265,449) (28,203) (18,476) Units, end of year 2,989,672 664,969 8,567 422,014 (1) Based on average units outstanding.
Financial HighlightsFor the year ended December 31, 2020
IndexSelect Aggressive 2045 Fund
Wilmington Trust Collective Investment Trust IndexSelect Funds Sub-Advised by flexPATH Strategies, LLC
See Notes to the Financial Statements. 20
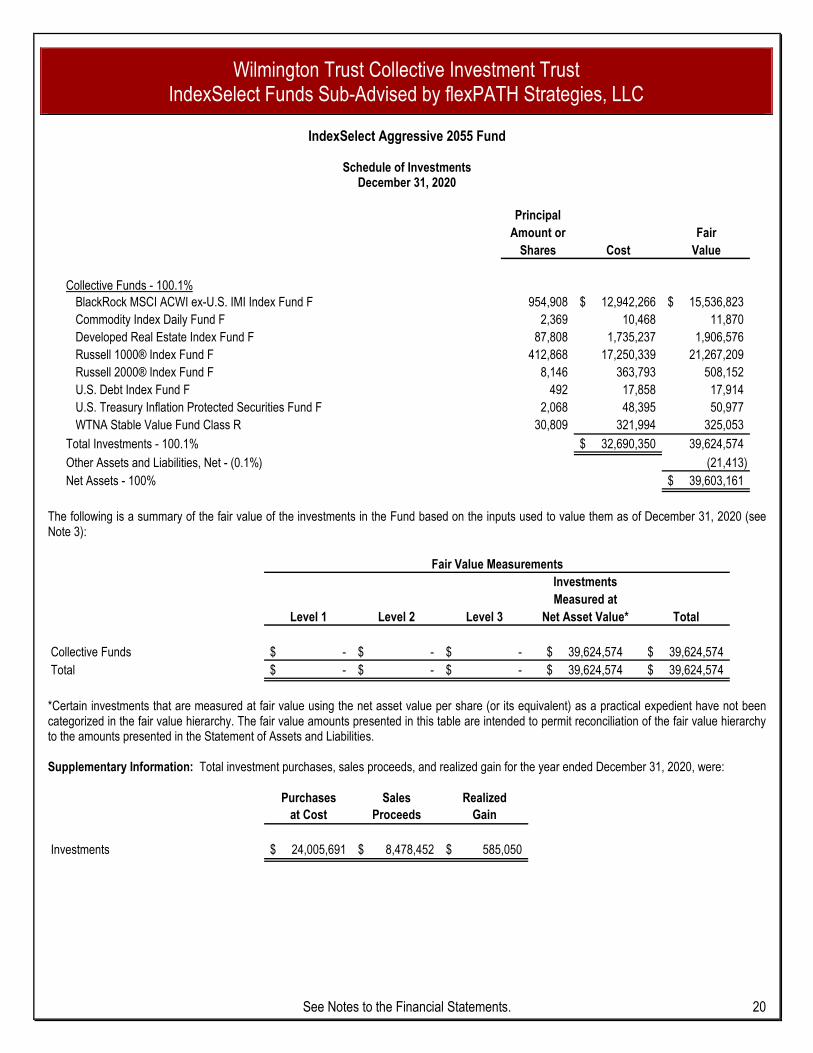
IndexSelect Aggressive 2055 Fund
Schedule of Investments December 31, 2020
Principal
Amount or FairShares Cost Value
Collective Funds - 100.1%BlackRock MSCI ACWI ex-U.S. IMI Index Fund F 954,908 12,942,266$ 15,536,823$ Commodity Index Daily Fund F 2,369 10,468 11,870 Developed Real Estate Index Fund F 87,808 1,735,237 1,906,576 Russell 1000® Index Fund F 412,868 17,250,339 21,267,209 Russell 2000® Index Fund F 8,146 363,793 508,152 U.S. Debt Index Fund F 492 17,858 17,914 U.S. Treasury Inflation Protected Securities Fund F 2,068 48,395 50,977 WTNA Stable Value Fund Class R 30,809 321,994 325,053
Total Investments - 100.1% 32,690,350$ 39,624,574 Other Assets and Liabilities, Net - (0.1%) (21,413) Net Assets - 100% 39,603,161$
The following is a summary of the fair value of the investments in the Fund based on the inputs used to value them as of December 31, 2020 (see Note 3):
InvestmentsMeasured at
Level 1 Level 2 Level 3 Net Asset Value* Total
Collective Funds -$ -$ -$ 39,624,574$ 39,624,574$ Total -$ -$ -$ 39,624,574$ 39,624,574$
Fair Value Measurements
*Certain investments that are measured at fair value using the net asset value per share (or its equivalent) as a practical expedient have not been categorized in the fair value hierarchy. The fair value amounts presented in this table are intended to permit reconciliation of the fair value hierarchy to the amounts presented in the Statement of Assets and Liabilities. Supplementary Information: Total investment purchases, sales proceeds, and realized gain for the year ended December 31, 2020, were:
Purchases Sales Realizedat Cost Proceeds Gain
Investments 24,005,691$ 8,478,452$ 585,050$

Wilmington Trust Collective Investment Trust IndexSelect Funds Sub-Advised by flexPATH Strategies, LLC
See Notes to the Financial Statements. 21
AssetsInvestments in securities, at fair value (cost $32,690,350) 39,624,574$ Receivable for fund units sold 385,809 Total assets 40,010,383
Liabilities and Net AssetsPayable for investment securities purchased 230,153 Payable for fund units redeemed 155,656 Accrued expenses 21,413 Total liabilities 407,222 Net assets 39,603,161$
ExpensesTrustee, management and service provider fees 37,933$ Professional services and other operating expenses 11,257 Total expenses 49,190 Net investment loss (49,190)
Net realized gain on:Investments 585,050
Net change in unrealized appreciation on:Investments 5,474,905 Net realized and unrealized gain on investments 6,059,955 Net increase in net assets resulting from operations 6,010,765$
IndexSelect Aggressive 2055 Fund
Statement of OperationsFor the year ended December 31, 2020
Statement of Assets and LiabilitiesDecember 31, 2020

Wilmington Trust Collective Investment Trust IndexSelect Funds Sub-Advised by flexPATH Strategies, LLC
See Notes to the Financial Statements. 22
Increase in net assets resulting from operationsNet investment loss (49,190)$ Net realized gain on investments 585,050 Net change in unrealized appreciation on investments 5,474,905 Net increase in net assets resulting from operations 6,010,765
Fund unit transactionsProceeds from units issuedClass I 14,256,508 Class I1 5,210,983 Class R 84,274 Class R6 2,602,432 Total proceeds from units issued 22,154,197
Value of units redeemedClass I (3,438,549) Class I1 (2,338,480) Class R (36,279) Class R6 (778,494) Total value of units redeemed (6,591,802)
Increase in net assets resulting from fund unit transactions 15,562,395
Increase in net assets 21,573,160
Net assets, beginning of year 18,030,001 Net assets, end of year 39,603,161$
Statement of Changes in Net AssetsFor the year ended December 31, 2020
IndexSelect Aggressive 2055 Fund

Wilmington Trust Collective Investment Trust IndexSelect Funds Sub-Advised by flexPATH Strategies, LLC
See Notes to the Financial Statements. 23
Per Unit Operating Performance Class I Class I1 Class R Class R6Net asset value, beginning of year 13.26$ 13.25$ 13.01$ 13.20$ Income from investment operations:
Net investment loss (1) (0.02) (0.03) (0.12) (0.02) Net realized and unrealized gain on investments (1) 2.04 2.05 1.98 2.05
Total income from investment operations 2.02 2.02 1.86 2.03 Net asset value, end of year 15.28$ 15.27$ 14.87$ 15.23$
Total Return 15.23% 15.25% 14.30% 15.38%
Supplemental DataRatio to average net assets:
Expenses 0.16% 0.21% 0.96% 0.13%Net investment loss (0.16%) (0.21%) (0.96%) (0.13%)
Fund Unit ActivityUnits, beginning of year 828,156 379,756 12,257 140,660 Issued 1,117,027 410,381 6,822 213,467 Redeemed (266,465) (185,873) (2,851) (59,904) Units, end of year 1,678,718 604,264 16,228 294,223 (1) Based on average units outstanding.
Financial HighlightsFor the year ended December 31, 2020
IndexSelect Aggressive 2055 Fund

Wilmington Trust Collective Investment Trust IndexSelect Funds Sub-Advised by flexPATH Strategies, LLC
See Notes to the Financial Statements. 24
IndexSelect Moderate Retirement Fund
Schedule of Investments December 31, 2020
Principal
Amount or FairShares Cost Value
Collective Funds - 100.0%BlackRock MSCI ACWI ex-U.S. IMI Index Fund F 2,908,288 38,438,407$ 47,319,298$ Commodity Index Daily Fund F 1,205,279 5,412,907 6,038,088 Developed Real Estate Index Fund F 278,631 5,247,832 6,049,902 Russell 1000® Index Fund F 1,582,500 64,928,521 81,515,992 Russell 2000® Index Fund F 191,354 8,281,887 11,936,071 U.S. Debt Index Fund F 256,104 9,297,676 9,330,178 U.S. Treasury Inflation Protected Securities Fund F 894,866 20,475,757 22,058,003 WTNA Stable Value Fund Class R 18,633,736 193,702,267 196,598,953
Total Investments - 100.0% 345,785,254$ 380,846,485 Other Assets and Liabilities, Net - (0.0%) (178,051) Net Assets - 100% 380,668,434$
The following is a summary of the fair value of the investments in the Fund based on the inputs used to value them as of December 31, 2020 (see Note 3):
InvestmentsMeasured at
Level 1 Level 2 Level 3 Net Asset Value* Total
Collective Funds -$ -$ -$ 380,846,485$ 380,846,485$ Total -$ -$ -$ 380,846,485$ 380,846,485$
Fair Value Measurements
*Certain investments that are measured at fair value using the net asset value per share (or its equivalent) as a practical expedient have not been categorized in the fair value hierarchy. The fair value amounts presented in this table are intended to permit reconciliation of the fair value hierarchy to the amounts presented in the Statement of Assets and Liabilities. Supplementary Information: Total investment purchases, sales proceeds, and realized gain for the year ended December 31, 2020, were:
Purchases Sales Realizedat Cost Proceeds Gain
Investments 276,390,495$ 156,705,263$ 8,857,039$
Wilmington Trust Collective Investment Trust IndexSelect Funds Sub-Advised by flexPATH Strategies, LLC
See Notes to the Financial Statements. 25
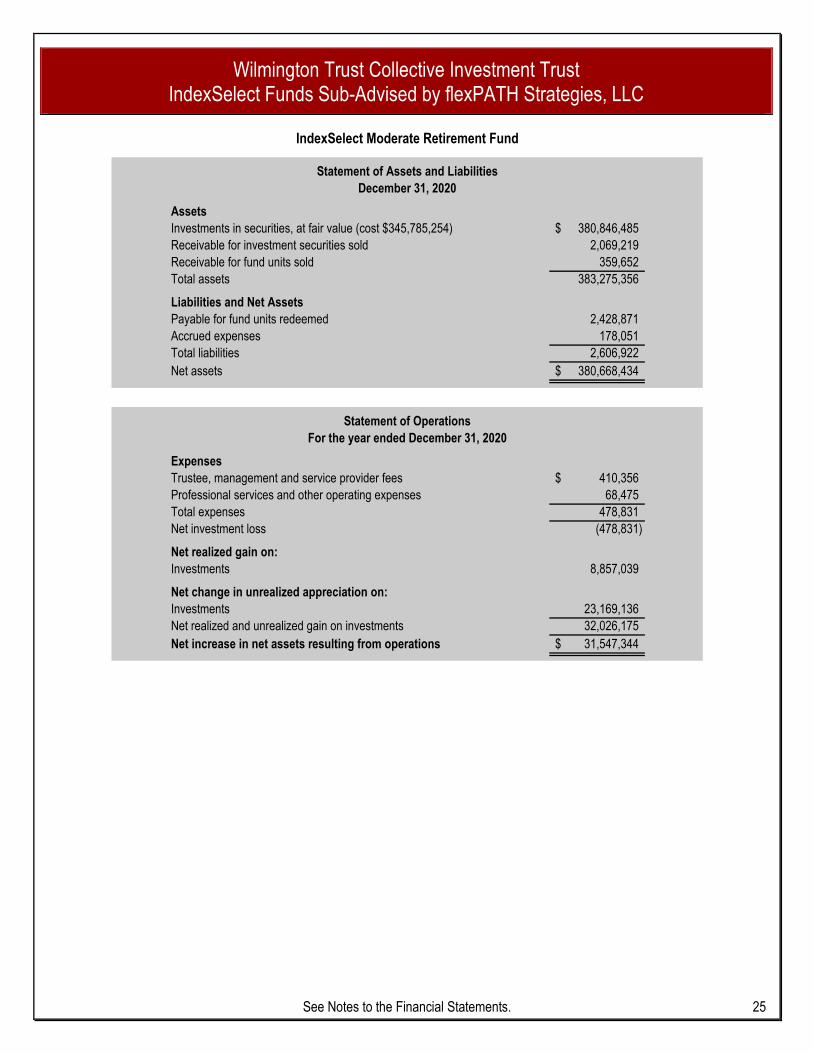
AssetsInvestments in securities, at fair value (cost $345,785,254) 380,846,485$ Receivable for investment securities sold 2,069,219 Receivable for fund units sold 359,652 Total assets 383,275,356
Liabilities and Net AssetsPayable for fund units redeemed 2,428,871 Accrued expenses 178,051 Total liabilities 2,606,922 Net assets 380,668,434$
ExpensesTrustee, management and service provider fees 410,356$ Professional services and other operating expenses 68,475 Total expenses 478,831 Net investment loss (478,831)
Net realized gain on:Investments 8,857,039
Net change in unrealized appreciation on:Investments 23,169,136 Net realized and unrealized gain on investments 32,026,175 Net increase in net assets resulting from operations 31,547,344$
IndexSelect Moderate Retirement Fund
Statement of OperationsFor the year ended December 31, 2020
Statement of Assets and LiabilitiesDecember 31, 2020

Wilmington Trust Collective Investment Trust IndexSelect Funds Sub-Advised by flexPATH Strategies, LLC
See Notes to the Financial Statements. 26
Increase in net assets resulting from operationsNet investment loss (478,831)$ Net realized gain on investments 8,857,039 Net change in unrealized appreciation on investments 23,169,136 Net increase in net assets resulting from operations 31,547,344
Fund unit transactionsProceeds from units issuedClass F 11,535 Class I 133,306,832 Class I1 7,069,339 Class R 1,770,699 Class R6 49,889,106 Total proceeds from units issued 192,047,511
Value of units redeemedClass F (18,296) Class I (50,658,433) Class I1 (3,392,483) Class R (5,311,709) Class R6 (12,574,517) Total value of units redeemed (71,955,438)
Increase in net assets resulting from fund unit transactions 120,092,073
Increase in net assets 151,639,417
Net assets, beginning of year 229,029,017 Net assets, end of year 380,668,434$
Statement of Changes in Net AssetsFor the year ended December 31, 2020
IndexSelect Moderate Retirement Fund
Wilmington Trust Collective Investment Trust IndexSelect Funds Sub-Advised by flexPATH Strategies, LLC
See Notes to the Financial Statements. 27
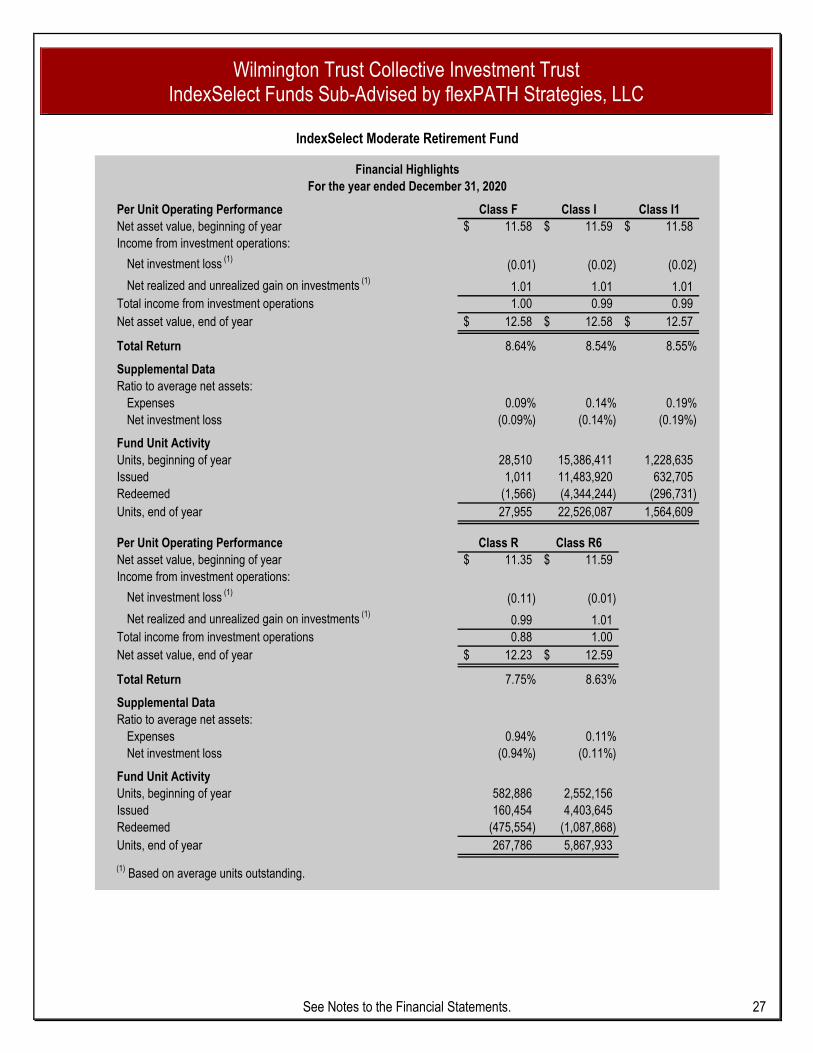
Per Unit Operating Performance Class F Class I Class I1Net asset value, beginning of year 11.58$ 11.59$ 11.58$ Income from investment operations:
Net investment loss (1) (0.01) (0.02) (0.02) Net realized and unrealized gain on investments (1) 1.01 1.01 1.01
Total income from investment operations 1.00 0.99 0.99 Net asset value, end of year 12.58$ 12.58$ 12.57$
Total Return 8.64% 8.54% 8.55%
Supplemental DataRatio to average net assets:
Expenses 0.09% 0.14% 0.19%Net investment loss (0.09%) (0.14%) (0.19%)
Fund Unit ActivityUnits, beginning of year 28,510 15,386,411 1,228,635 Issued 1,011 11,483,920 632,705 Redeemed (1,566) (4,344,244) (296,731) Units, end of year 27,955 22,526,087 1,564,609
Per Unit Operating Performance Class R Class R6Net asset value, beginning of year 11.35$ 11.59$ Income from investment operations:
Net investment loss (1) (0.11) (0.01) Net realized and unrealized gain on investments (1) 0.99 1.01
Total income from investment operations 0.88 1.00 Net asset value, end of year 12.23$ 12.59$
Total Return 7.75% 8.63%
Supplemental DataRatio to average net assets:
Expenses 0.94% 0.11%Net investment loss (0.94%) (0.11%)
Fund Unit ActivityUnits, beginning of year 582,886 2,552,156 Issued 160,454 4,403,645 Redeemed (475,554) (1,087,868) Units, end of year 267,786 5,867,933 (1) Based on average units outstanding.
Financial HighlightsFor the year ended December 31, 2020
IndexSelect Moderate Retirement Fund

Wilmington Trust Collective Investment Trust IndexSelect Funds Sub-Advised by flexPATH Strategies, LLC
See Notes to the Financial Statements. 28
IndexSelect Moderate 2025 Fund
Schedule of Investments December 31, 2020
Principal
Amount or FairShares Cost Value
Collective Funds - 100.0%BlackRock MSCI ACWI ex-U.S. IMI Index Fund F 10,518,892 139,256,883$ 171,147,628$ Commodity Index Daily Fund F 2,791,976 12,615,216 13,986,961 Developed Real Estate Index Fund F 1,064,443 20,471,604 23,112,220 Russell 1000® Index Fund F 5,276,820 215,736,273 271,813,762 Russell 2000® Index Fund F 432,167 19,114,679 26,957,187 U.S. Debt Index Fund F 519,277 18,848,933 18,917,900 U.S. Treasury Inflation Protected Securities Fund F 2,073,773 47,512,001 51,117,468 WTNA Stable Value Fund Class R 38,427,860 400,028,655 405,440,824
Total Investments - 100.0% 873,584,244$ 982,493,950 Other Assets and Liabilities, Net - (0.0%) (481,194) Net Assets - 100% 982,012,756$
The following is a summary of the fair value of the investments in the Fund based on the inputs used to value them as of December 31, 2020 (see Note 3):
InvestmentsMeasured at
Level 1 Level 2 Level 3 Net Asset Value* Total
Collective Funds -$ -$ -$ 982,493,950$ 982,493,950$ Total -$ -$ -$ 982,493,950$ 982,493,950$
Fair Value Measurements
*Certain investments that are measured at fair value using the net asset value per share (or its equivalent) as a practical expedient have not been categorized in the fair value hierarchy. The fair value amounts presented in this table are intended to permit reconciliation of the fair value hierarchy to the amounts presented in the Statement of Assets and Liabilities. Supplementary Information: Total investment purchases, sales proceeds, and realized gain for the year ended December 31, 2020, were:
Purchases Sales Realizedat Cost Proceeds Gain
Investments 676,131,861$ 357,363,744$ 20,785,755$

Wilmington Trust Collective Investment Trust IndexSelect Funds Sub-Advised by flexPATH Strategies, LLC
See Notes to the Financial Statements. 29
AssetsInvestments in securities, at fair value (cost $873,584,244) 982,493,950$ Receivable for investment securities sold 5,473,362 Receivable for fund units sold 420,935 Total assets 988,388,247
Liabilities and Net AssetsPayable for fund units redeemed 5,894,297 Accrued expenses 481,194 Total liabilities 6,375,491 Net assets 982,012,756$
ExpensesTrustee, management and service provider fees 1,100,357$ Professional services and other operating expenses 203,018 Total expenses 1,303,375 Net investment loss (1,303,375)
Net realized gain on:Investments 20,785,755
Net change in unrealized appreciation on:Investments 71,290,639 Net realized and unrealized gain on investments 92,076,394 Net increase in net assets resulting from operations 90,773,019$
IndexSelect Moderate 2025 Fund
Statement of OperationsFor the year ended December 31, 2020
Statement of Assets and LiabilitiesDecember 31, 2020

Wilmington Trust Collective Investment Trust IndexSelect Funds Sub-Advised by flexPATH Strategies, LLC
See Notes to the Financial Statements. 30
Increase in net assets resulting from operationsNet investment loss (1,303,375)$ Net realized gain on investments 20,785,755 Net change in unrealized appreciation on investments 71,290,639 Net increase in net assets resulting from operations 90,773,019
Fund unit transactionsProceeds from units issuedClass F 43,585 Class I 303,117,980 Class I1 24,312,582 Class R 11,153,592 Class R6 115,967,042 Total proceeds from units issued 454,594,781
Value of units redeemedClass F (10,259) Class I (74,345,036) Class I1 (12,105,189) Class R (17,857,645) Class R6 (30,396,525) Total value of units redeemed (134,714,654)
Increase in net assets resulting from fund unit transactions 319,880,127
Increase in net assets 410,653,146
Net assets, beginning of year 571,359,610 Net assets, end of year 982,012,756$
Statement of Changes in Net AssetsFor the year ended December 31, 2020
IndexSelect Moderate 2025 Fund

Wilmington Trust Collective Investment Trust IndexSelect Funds Sub-Advised by flexPATH Strategies, LLC
See Notes to the Financial Statements. 31
Per Unit Operating Performance Class F Class I Class I1Net asset value, beginning of year 12.08$ 12.09$ 12.07$ Income from investment operations:
Net investment loss (1) (0.01) (0.02) (0.02) Net realized and unrealized gain on investments (1) 1.17 1.18 1.17
Total income from investment operations 1.16 1.16 1.15 Net asset value, end of year 13.24$ 13.25$ 13.22$
Total Return 9.60% 9.59% 9.53%
Supplemental DataRatio to average net assets:
Expenses 0.09% 0.14% 0.19%Net investment loss (0.09%) (0.14%) (0.19%)
Fund Unit ActivityUnits, beginning of year 120,023 33,446,914 3,483,188 Issued 3,717 25,329,808 2,111,160 Redeemed (840) (6,197,524) (1,036,866) Units, end of year 122,900 52,579,198 4,557,482
Per Unit Operating Performance Class R Class R6Net asset value, beginning of year 11.82$ 12.08$ Income from investment operations:
Net investment loss (1) (0.11) (0.01) Net realized and unrealized gain on investments (1) 1.15 1.17
Total income from investment operations 1.04 1.16 Net asset value, end of year 12.86$ 13.24$
Total Return 8.80% 9.60%
Supplemental DataRatio to average net assets:
Expenses 0.95% 0.11%Net investment loss (0.95%) (0.11%)
Fund Unit ActivityUnits, beginning of year 1,951,791 8,325,739 Issued 971,479 9,825,328 Redeemed (1,544,377) (2,596,512) Units, end of year 1,378,893 15,554,555 (1) Based on average units outstanding.
Financial HighlightsFor the year ended December 31, 2020
IndexSelect Moderate 2025 Fund

Wilmington Trust Collective Investment Trust IndexSelect Funds Sub-Advised by flexPATH Strategies, LLC
See Notes to the Financial Statements. 32
IndexSelect Moderate 2035 Fund
Schedule of Investments December 31, 2020
Principal
Amount or FairShares Cost Value
Collective Funds - 100.1%BlackRock MSCI ACWI ex-U.S. IMI Index Fund F 17,348,917 232,904,402$ 282,275,556$ Commodity Index Daily Fund F 1,822,975 8,223,238 9,132,559 Developed Real Estate Index Fund F 1,661,304 32,805,556 36,071,862 Russell 1000® Index Fund F 7,917,859 323,886,941 407,856,043 Russell 2000® Index Fund F 322,075 14,653,865 20,090,000 U.S. Debt Index Fund F 299,535 10,870,296 10,912,435 U.S. Treasury Inflation Protected Securities Fund F 1,357,338 31,364,089 33,457,712 WTNA Stable Value Fund Class R 19,408,256 202,472,317 204,770,672
Total Investments - 100.1% 857,180,704$ 1,004,566,839 Other Assets and Liabilities, Net - (0.1%) (509,727) Net Assets - 100% 1,004,057,112$
The following is a summary of the fair value of the investments in the Fund based on the inputs used to value them as of December 31, 2020 (see Note 3):
InvestmentsMeasured at
Level 1 Level 2 Level 3 Net Asset Value* Total
Collective Funds -$ -$ -$ 1,004,566,839$ 1,004,566,839$ Total -$ -$ -$ 1,004,566,839$ 1,004,566,839$
Fair Value Measurements
*Certain investments that are measured at fair value using the net asset value per share (or its equivalent) as a practical expedient have not been categorized in the fair value hierarchy. The fair value amounts presented in this table are intended to permit reconciliation of the fair value hierarchy to the amounts presented in the Statement of Assets and Liabilities. Supplementary Information: Total investment purchases, sales proceeds, and realized gain for the year ended December 31, 2020, were:
Purchases Sales Realizedat Cost Proceeds Gain
Investments 615,200,140$ 274,082,004$ 19,933,391$

Wilmington Trust Collective Investment Trust IndexSelect Funds Sub-Advised by flexPATH Strategies, LLC
See Notes to the Financial Statements. 33
AssetsInvestments in securities, at fair value (cost $857,180,704) 1,004,566,839$ Receivable for fund units sold 1,040,281 Receivable for investment securities sold 238,955 Total assets 1,005,846,075
Liabilities and Net AssetsPayable for fund units redeemed 1,279,236 Accrued expenses 509,727 Total liabilities 1,788,963 Net assets 1,004,057,112$
ExpensesTrustee, management and service provider fees 1,069,223$ Professional services and other operating expenses 254,908 Total expenses 1,324,131 Net investment loss (1,324,131)
Net realized gain on:Investments 19,933,391
Net change in unrealized appreciation on:Investments 100,997,373 Net realized and unrealized gain on investments 120,930,764 Net increase in net assets resulting from operations 119,606,633$
IndexSelect Moderate 2035 Fund
Statement of OperationsFor the year ended December 31, 2020
Statement of Assets and LiabilitiesDecember 31, 2020

Wilmington Trust Collective Investment Trust IndexSelect Funds Sub-Advised by flexPATH Strategies, LLC
See Notes to the Financial Statements. 34
Increase in net assets resulting from operationsNet investment loss (1,324,131)$ Net realized gain on investments 19,933,391 Net change in unrealized appreciation on investments 100,997,373 Net increase in net assets resulting from operations 119,606,633
Fund unit transactionsProceeds from units issuedClass F 19,164 Class I 298,556,365 Class I1 40,457,538 Class R 12,873,544 Class R6 116,632,345 Total proceeds from units issued 468,538,956
Value of units redeemedClass F (329,201) Class I (73,550,649) Class I1 (11,217,242) Class R (19,234,039) Class R6 (21,987,756) Total value of units redeemed (126,318,887)
Increase in net assets resulting from fund unit transactions 342,220,069
Increase in net assets 461,826,702
Net assets, beginning of year 542,230,410 Net assets, end of year 1,004,057,112$
Statement of Changes in Net AssetsFor the year ended December 31, 2020
IndexSelect Moderate 2035 Fund

Wilmington Trust Collective Investment Trust IndexSelect Funds Sub-Advised by flexPATH Strategies, LLC
See Notes to the Financial Statements. 35
Per Unit Operating Performance Class F Class I Class I1Net asset value, beginning of year 12.68$ 12.69$ 12.68$ Income from investment operations:
Net investment loss (1) (0.01) (0.02) (0.03) Net realized and unrealized gain on investments (1) 1.58 1.58 1.58
Total income from investment operations 1.57 1.56 1.55 Net asset value, end of year 14.25$ 14.25$ 14.23$
Total Return 12.38% 12.29% 12.22%
Supplemental DataRatio to average net assets:
Expenses 0.10% 0.15% 0.20%Net investment loss (0.10%) (0.15%) (0.20%)
Fund Unit ActivityUnits, beginning of year 22,883 29,520,879 3,496,650 Issued 1,590 23,982,379 3,361,427 Redeemed (23,266) (5,950,919) (900,835) Units, end of year 1,207 47,552,339 5,957,242
Per Unit Operating Performance Class R Class R6Net asset value, beginning of year 12.42$ 12.70$ Income from investment operations:
Net investment loss (1) (0.12) (0.02) Net realized and unrealized gain on investments (1) 1.54 1.58
Total income from investment operations 1.42 1.56 Net asset value, end of year 13.84$ 14.26$
Total Return 11.43% 12.28%
Supplemental DataRatio to average net assets:
Expenses 0.95% 0.12%Net investment loss (0.95%) (0.12%)
Fund Unit ActivityUnits, beginning of year 1,720,468 7,990,094 Issued 1,085,266 9,585,708 Redeemed (1,616,896) (1,804,996) Units, end of year 1,188,838 15,770,806 (1) Based on average units outstanding.
Financial HighlightsFor the year ended December 31, 2020
IndexSelect Moderate 2035 Fund

Wilmington Trust Collective Investment Trust IndexSelect Funds Sub-Advised by flexPATH Strategies, LLC
See Notes to the Financial Statements. 36
IndexSelect Moderate 2045 Fund
Schedule of Investments December 31, 2020
Principal
Amount or FairShares Cost Value
Collective Funds - 100.1%BlackRock MSCI ACWI ex-U.S. IMI Index Fund F 14,827,181 200,276,310$ 241,245,660$ Commodity Index Daily Fund F 388,084 1,741,050 1,944,182 Developed Real Estate Index Fund F 1,372,812 27,633,598 29,807,836 Russell 1000® Index Fund F 6,478,981 263,030,224 333,738,159 Russell 2000® Index Fund F 149,213 6,887,552 9,307,402 U.S. Debt Index Fund F 43,104 1,563,520 1,570,340 U.S. Treasury Inflation Protected Securities Fund F 287,533 6,686,890 7,087,534 WTNA Stable Value Fund Class R 2,923,070 30,542,030 30,840,434
Total Investments - 100.1% 538,361,174$ 655,541,547 Other Assets and Liabilities, Net - (0.1%) (348,602) Net Assets - 100% 655,192,945$
The following is a summary of the fair value of the investments in the Fund based on the inputs used to value them as of December 31, 2020 (see Note 3):
InvestmentsMeasured at
Level 1 Level 2 Level 3 Net Asset Value* Total
Collective Funds -$ -$ -$ 655,541,547$ 655,541,547$ Total -$ -$ -$ 655,541,547$ 655,541,547$
Fair Value Measurements
*Certain investments that are measured at fair value using the net asset value per share (or its equivalent) as a practical expedient have not been categorized in the fair value hierarchy. The fair value amounts presented in this table are intended to permit reconciliation of the fair value hierarchy to the amounts presented in the Statement of Assets and Liabilities. Supplementary Information: Total investment purchases, sales proceeds, and realized gain for the year ended December 31, 2020, were:
Purchases Sales Realizedat Cost Proceeds Gain
Investments 333,674,143$ 118,506,395$ 10,419,225$

Wilmington Trust Collective Investment Trust IndexSelect Funds Sub-Advised by flexPATH Strategies, LLC
See Notes to the Financial Statements. 37
AssetsInvestments in securities, at fair value (cost $538,361,174) 655,541,547$ Receivable for investment securities sold 2,879,152 Receivable for fund units sold 186,996 Total assets 658,607,695
Liabilities and Net AssetsPayable for fund units redeemed 3,066,148 Accrued expenses 348,602 Total liabilities 3,414,750 Net assets 655,192,945$
ExpensesTrustee, management and service provider fees 699,296$ Professional services and other operating expenses 190,542 Total expenses 889,838 Net investment loss (889,838)
Net realized gain on:Investments 10,419,225
Net change in unrealized appreciation on:Investments 82,738,425 Net realized and unrealized gain on investments 93,157,650 Net increase in net assets resulting from operations 92,267,812$
IndexSelect Moderate 2045 Fund
Statement of OperationsFor the year ended December 31, 2020
Statement of Assets and LiabilitiesDecember 31, 2020

Wilmington Trust Collective Investment Trust IndexSelect Funds Sub-Advised by flexPATH Strategies, LLC
See Notes to the Financial Statements. 38
Increase in net assets resulting from operationsNet investment loss (889,838)$ Net realized gain on investments 10,419,225 Net change in unrealized appreciation on investments 82,738,425 Net increase in net assets resulting from operations 92,267,812
Fund unit transactionsProceeds from units issuedClass F 1,121 Class I 172,488,454 Class I1 30,852,614 Class R 9,144,606 Class R6 65,593,968 Total proceeds from units issued 278,080,763
Value of units redeemedClass F (249) Class I (31,122,031) Class I1 (6,042,192) Class R (13,169,996) Class R6 (11,845,200) Total value of units redeemed (62,179,668)
Increase in net assets resulting from fund unit transactions 215,901,095
Increase in net assets 308,168,907
Net assets, beginning of year 347,024,038 Net assets, end of year 655,192,945$
Statement of Changes in Net AssetsFor the year ended December 31, 2020
IndexSelect Moderate 2045 Fund

Wilmington Trust Collective Investment Trust IndexSelect Funds Sub-Advised by flexPATH Strategies, LLC
See Notes to the Financial Statements. 39
Per Unit Operating Performance Class F Class I Class I1Net asset value, beginning of year 13.14$ 13.15$ 13.13$ Income from investment operations:
Net investment loss (1) (0.00) (0.02) (0.03) Net realized and unrealized gain on investments (1) 1.93 1.93 1.94
Total income from investment operations 1.93 1.91 1.91 Net asset value, end of year 15.07$ 15.06$ 15.04$
Total Return 14.69% 14.52% 14.55%
Supplemental DataRatio to average net assets:
Expenses 0.00% 0.16% 0.21%Net investment loss (0.00%) (0.16%) (0.21%)
Fund Unit ActivityUnits, beginning of year 28 18,457,186 2,073,535 Issued 90 13,499,067 2,499,160 Redeemed (20) (2,375,322) (489,475) Units, end of year 98 29,580,931 4,083,220
Per Unit Operating Performance Class R Class R6Net asset value, beginning of year 12.87$ 13.15$ Income from investment operations:
Net investment loss (1) (0.12) (0.02) Net realized and unrealized gain on investments (1) 1.87 1.92
Total income from investment operations 1.75 1.90 Net asset value, end of year 14.62$ 15.05$
Total Return 13.60% 14.45%
Supplemental DataRatio to average net assets:
Expenses 0.96% 0.13%Net investment loss (0.96%) (0.13%)
Fund Unit ActivityUnits, beginning of year 1,173,438 4,715,684 Issued 756,824 5,240,435 Redeemed (1,070,556) (935,903) Units, end of year 859,706 9,020,216 (1) Based on average units outstanding.
Financial HighlightsFor the year ended December 31, 2020
IndexSelect Moderate 2045 Fund
Wilmington Trust Collective Investment Trust IndexSelect Funds Sub-Advised by flexPATH Strategies, LLC
See Notes to the Financial Statements. 40
IndexSelect Moderate 2055 Fund
Schedule of Investments December 31, 2020
Principal
Amount or FairShares Cost Value
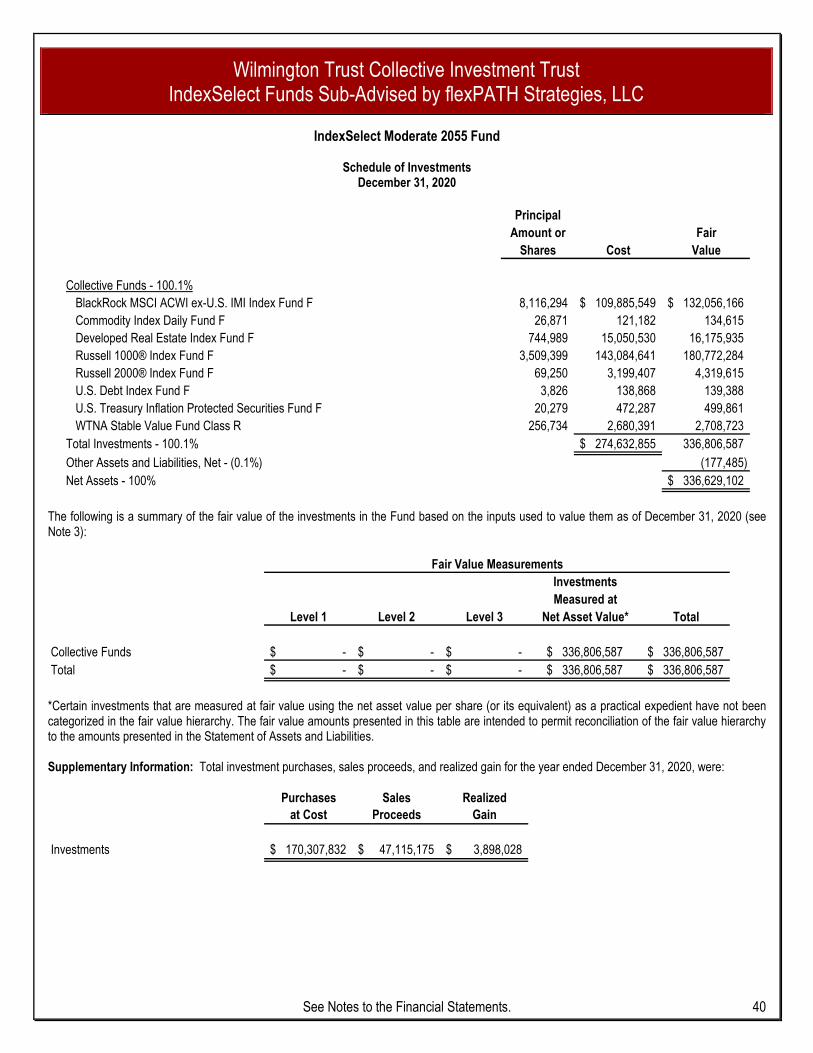
Collective Funds - 100.1%BlackRock MSCI ACWI ex-U.S. IMI Index Fund F 8,116,294 109,885,549$ 132,056,166$ Commodity Index Daily Fund F 26,871 121,182 134,615 Developed Real Estate Index Fund F 744,989 15,050,530 16,175,935 Russell 1000® Index Fund F 3,509,399 143,084,641 180,772,284 Russell 2000® Index Fund F 69,250 3,199,407 4,319,615 U.S. Debt Index Fund F 3,826 138,868 139,388 U.S. Treasury Inflation Protected Securities Fund F 20,279 472,287 499,861 WTNA Stable Value Fund Class R 256,734 2,680,391 2,708,723
Total Investments - 100.1% 274,632,855$ 336,806,587 Other Assets and Liabilities, Net - (0.1%) (177,485) Net Assets - 100% 336,629,102$
The following is a summary of the fair value of the investments in the Fund based on the inputs used to value them as of December 31, 2020 (see Note 3):
InvestmentsMeasured at
Level 1 Level 2 Level 3 Net Asset Value* Total
Collective Funds -$ -$ -$ 336,806,587$ 336,806,587$ Total -$ -$ -$ 336,806,587$ 336,806,587$
Fair Value Measurements
*Certain investments that are measured at fair value using the net asset value per share (or its equivalent) as a practical expedient have not been categorized in the fair value hierarchy. The fair value amounts presented in this table are intended to permit reconciliation of the fair value hierarchy to the amounts presented in the Statement of Assets and Liabilities. Supplementary Information: Total investment purchases, sales proceeds, and realized gain for the year ended December 31, 2020, were:
Purchases Sales Realizedat Cost Proceeds Gain
Investments 170,307,832$ 47,115,175$ 3,898,028$

Wilmington Trust Collective Investment Trust IndexSelect Funds Sub-Advised by flexPATH Strategies, LLC
See Notes to the Financial Statements. 41
AssetsInvestments in securities, at fair value (cost $274,632,855) 336,806,587$ Receivable for fund units sold 361,620 Total assets 337,168,207
Liabilities and Net AssetsPayable for fund units redeemed 255,451 Payable for investment securities purchased 106,169 Accrued expenses 177,485 Total liabilities 539,105 Net assets 336,629,102$
ExpensesTrustee, management and service provider fees 340,762$ Professional services and other operating expenses 96,380 Total expenses 437,142 Net investment loss (437,142)
Net realized gain on:Investments 3,898,028
Net change in unrealized appreciation on:Investments 45,379,397 Net realized and unrealized gain on investments 49,277,425 Net increase in net assets resulting from operations 48,840,283$
IndexSelect Moderate 2055 Fund
Statement of OperationsFor the year ended December 31, 2020
Statement of Assets and LiabilitiesDecember 31, 2020

Wilmington Trust Collective Investment Trust IndexSelect Funds Sub-Advised by flexPATH Strategies, LLC
See Notes to the Financial Statements. 42
Increase in net assets resulting from operationsNet investment loss (437,142)$ Net realized gain on investments 3,898,028 Net change in unrealized appreciation on investments 45,379,397 Net increase in net assets resulting from operations 48,840,283
Fund unit transactionsProceeds from units issuedClass F 6,770 Class I 90,720,860 Class I1 19,804,559 Class R 5,052,402 Class R6 37,070,494 Total proceeds from units issued 152,655,085
Value of units redeemedClass F (3,327) Class I (12,720,948) Class I1 (2,601,523) Class R (6,520,613) Class R6 (7,267,761) Total value of units redeemed (29,114,172)
Increase in net assets resulting from fund unit transactions 123,540,913
Increase in net assets 172,381,196
Net assets, beginning of year 164,247,906 Net assets, end of year 336,629,102$
Statement of Changes in Net AssetsFor the year ended December 31, 2020
IndexSelect Moderate 2055 Fund
Wilmington Trust Collective Investment Trust IndexSelect Funds Sub-Advised by flexPATH Strategies, LLC
See Notes to the Financial Statements. 43
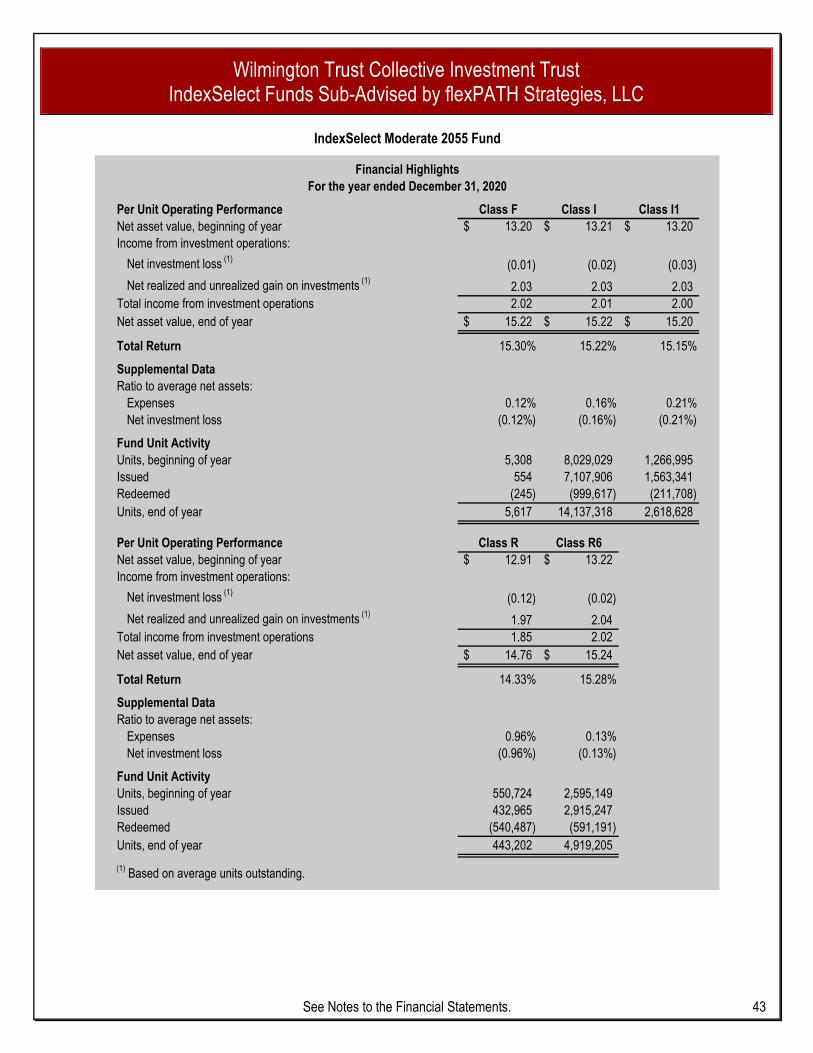
Per Unit Operating Performance Class F Class I Class I1Net asset value, beginning of year 13.20$ 13.21$ 13.20$ Income from investment operations:
Net investment loss (1) (0.01) (0.02) (0.03) Net realized and unrealized gain on investments (1) 2.03 2.03 2.03
Total income from investment operations 2.02 2.01 2.00 Net asset value, end of year 15.22$ 15.22$ 15.20$
Total Return 15.30% 15.22% 15.15%
Supplemental DataRatio to average net assets:
Expenses 0.12% 0.16% 0.21%Net investment loss (0.12%) (0.16%) (0.21%)
Fund Unit ActivityUnits, beginning of year 5,308 8,029,029 1,266,995 Issued 554 7,107,906 1,563,341 Redeemed (245) (999,617) (211,708) Units, end of year 5,617 14,137,318 2,618,628
Per Unit Operating Performance Class R Class R6Net asset value, beginning of year 12.91$ 13.22$ Income from investment operations:
Net investment loss (1) (0.12) (0.02) Net realized and unrealized gain on investments (1) 1.97 2.04
Total income from investment operations 1.85 2.02 Net asset value, end of year 14.76$ 15.24$
Total Return 14.33% 15.28%
Supplemental DataRatio to average net assets:
Expenses 0.96% 0.13%Net investment loss (0.96%) (0.13%)
Fund Unit ActivityUnits, beginning of year 550,724 2,595,149 Issued 432,965 2,915,247 Redeemed (540,487) (591,191) Units, end of year 443,202 4,919,205 (1) Based on average units outstanding.
Financial HighlightsFor the year ended December 31, 2020
IndexSelect Moderate 2055 Fund

Wilmington Trust Collective Investment Trust IndexSelect Funds Sub-Advised by flexPATH Strategies, LLC
See Notes to the Financial Statements. 44
IndexSelect Conservative Retirement Fund
Schedule of Investments December 31, 2020
Principal
Amount or FairShares Cost Value
Collective Funds - 100.0%BlackRock MSCI ACWI ex-U.S. IMI Index Fund F 219,634 2,895,608$ 3,573,559$ Commodity Index Daily Fund F 165,652 739,865 829,868 Developed Real Estate Index Fund F 38,314 717,674 831,915 Russell 1000® Index Fund F 147,168 5,985,914 7,580,755 Russell 2000® Index Fund F 25,525 1,115,164 1,592,153 U.S. Debt Index Fund F 44,011 1,600,021 1,603,378 U.S. Treasury Inflation Protected Securities Fund F 122,922 2,819,869 3,029,973 WTNA Stable Value Fund Class R 2,727,951 28,370,934 28,781,779
Total Investments - 100.0% 44,245,049$ 47,823,380 Other Assets and Liabilities, Net - (0.0%) (20,471) Net Assets - 100% 47,802,909$
The following is a summary of the fair value of the investments in the Fund based on the inputs used to value them as of December 31, 2020 (see Note 3):
InvestmentsMeasured at
Level 1 Level 2 Level 3 Net Asset Value* Total
Collective Funds -$ -$ -$ 47,823,380$ 47,823,380$ Total -$ -$ -$ 47,823,380$ 47,823,380$
Fair Value Measurements
*Certain investments that are measured at fair value using the net asset value per share (or its equivalent) as a practical expedient have not been categorized in the fair value hierarchy. The fair value amounts presented in this table are intended to permit reconciliation of the fair value hierarchy to the amounts presented in the Statement of Assets and Liabilities. Concentration of Ownership: As of December 31, 2020, the Fund had two unitholders holding 10% or more of the outstanding units of the Fund, and aggregated to 38.9% of the Fund's total units outstanding. Supplementary Information: Total investment purchases, sales proceeds, and realized gain for the year ended December 31, 2020, were:
Purchases Sales Realizedat Cost Proceeds Gain
Investments 39,580,415$ 20,011,286$ 707,361$
Wilmington Trust Collective Investment Trust IndexSelect Funds Sub-Advised by flexPATH Strategies, LLC
See Notes to the Financial Statements. 45
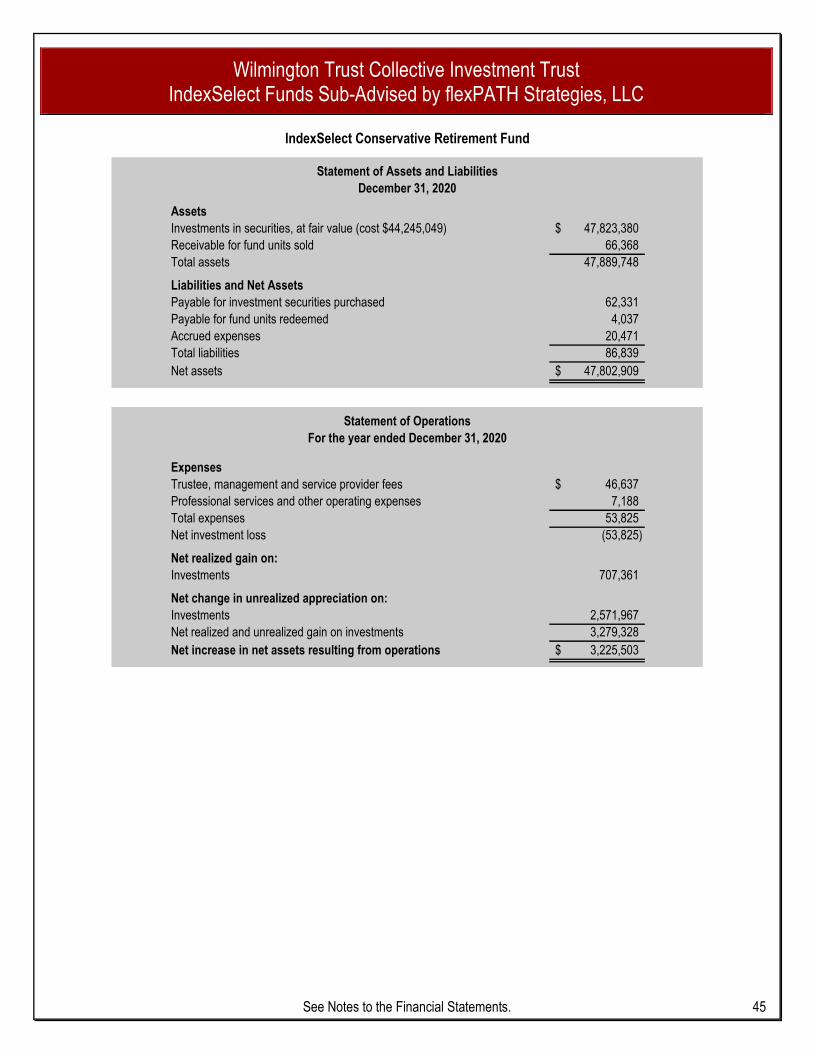
AssetsInvestments in securities, at fair value (cost $44,245,049) 47,823,380$ Receivable for fund units sold 66,368 Total assets 47,889,748
Liabilities and Net AssetsPayable for investment securities purchased 62,331 Payable for fund units redeemed 4,037 Accrued expenses 20,471 Total liabilities 86,839 Net assets 47,802,909$
ExpensesTrustee, management and service provider fees 46,637$ Professional services and other operating expenses 7,188 Total expenses 53,825 Net investment loss (53,825)
Net realized gain on:Investments 707,361
Net change in unrealized appreciation on:Investments 2,571,967 Net realized and unrealized gain on investments 3,279,328 Net increase in net assets resulting from operations 3,225,503$
IndexSelect Conservative Retirement Fund
Statement of OperationsFor the year ended December 31, 2020
Statement of Assets and LiabilitiesDecember 31, 2020
Wilmington Trust Collective Investment Trust IndexSelect Funds Sub-Advised by flexPATH Strategies, LLC
See Notes to the Financial Statements. 46
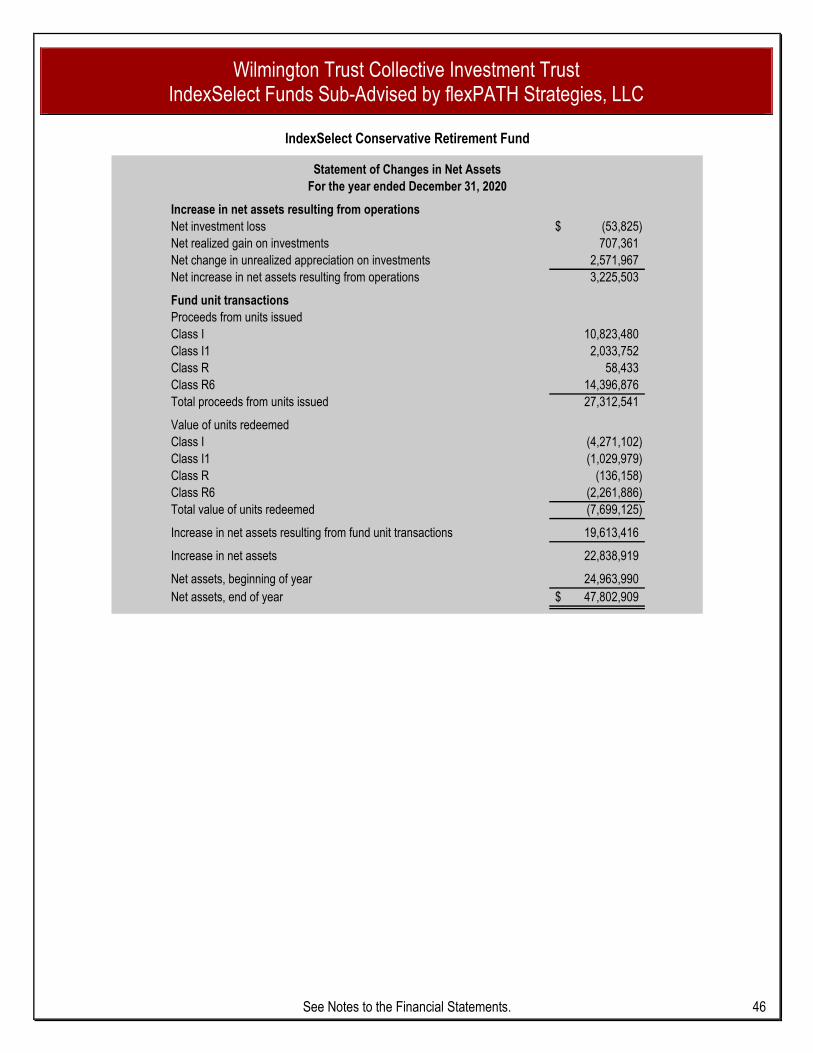
Increase in net assets resulting from operationsNet investment loss (53,825)$ Net realized gain on investments 707,361 Net change in unrealized appreciation on investments 2,571,967 Net increase in net assets resulting from operations 3,225,503
Fund unit transactionsProceeds from units issuedClass I 10,823,480 Class I1 2,033,752 Class R 58,433 Class R6 14,396,876 Total proceeds from units issued 27,312,541
Value of units redeemedClass I (4,271,102) Class I1 (1,029,979) Class R (136,158) Class R6 (2,261,886) Total value of units redeemed (7,699,125)
Increase in net assets resulting from fund unit transactions 19,613,416
Increase in net assets 22,838,919
Net assets, beginning of year 24,963,990 Net assets, end of year 47,802,909$
Statement of Changes in Net AssetsFor the year ended December 31, 2020
IndexSelect Conservative Retirement Fund

Wilmington Trust Collective Investment Trust IndexSelect Funds Sub-Advised by flexPATH Strategies, LLC
See Notes to the Financial Statements. 47
Per Unit Operating Performance Class I Class I1 Class R Class R6Net asset value, beginning of year 11.23$ 11.23$ 11.04$ 11.23$ Income from investment operations:
Net investment loss (1) (0.02) (0.02) (0.10) (0.01) Net realized and unrealized gain on investments (1) 0.81 0.81 0.79 0.81
Total income from investment operations 0.79 0.79 0.69 0.80 Net asset value, end of year 12.02$ 12.02$ 11.73$ 12.03$
Total Return 7.03% 7.03% 6.25% 7.12%
Supplemental DataRatio to average net assets:
Expenses 0.14% 0.19% 0.94% 0.10%Net investment loss (0.14%) (0.19%) (0.94%) (0.10%)
Fund Unit ActivityUnits, beginning of year 1,022,141 262,920 39,494 899,680 Issued 970,120 186,490 5,395 1,274,267 Redeemed (380,772) (90,792) (11,951) (201,099) Units, end of year 1,611,489 358,618 32,938 1,972,848 (1) Based on average units outstanding.
Financial HighlightsFor the year ended December 31, 2020
IndexSelect Conservative Retirement Fund

Wilmington Trust Collective Investment Trust IndexSelect Funds Sub-Advised by flexPATH Strategies, LLC
See Notes to the Financial Statements. 48
IndexSelect Conservative 2025 Fund
Schedule of Investments December 31, 2020
Principal
Amount or FairShares Cost Value
Collective Funds - 100.0%BlackRock MSCI ACWI ex-U.S. IMI Index Fund F 407,974 5,711,946$ 6,637,936$ Commodity Index Daily Fund F 209,514 965,621 1,049,600 Developed Real Estate Index Fund F 48,157 932,634 1,045,628 Russell 1000® Index Fund F 236,118 10,348,531 12,162,626 Russell 2000® Index Fund F 32,417 1,581,698 2,022,049 U.S. Debt Index Fund F 56,746 2,063,369 2,067,325 U.S. Treasury Inflation Protected Securities Fund F 155,226 3,624,904 3,826,243 WTNA Stable Value Fund Class R 3,239,936 33,841,199 34,183,608
Total Investments - 100.0% 59,069,902$ 62,995,015 Other Assets and Liabilities, Net - (0.0%) (22,662) Net Assets - 100% 62,972,353$
The following is a summary of the fair value of the investments in the Fund based on the inputs used to value them as of December 31, 2020 (see Note 3):
InvestmentsMeasured at
Level 1 Level 2 Level 3 Net Asset Value* Total
Collective Funds -$ -$ -$ 62,995,015$ 62,995,015$ Total -$ -$ -$ 62,995,015$ 62,995,015$
Fair Value Measurements
*Certain investments that are measured at fair value using the net asset value per share (or its equivalent) as a practical expedient have not been categorized in the fair value hierarchy. The fair value amounts presented in this table are intended to permit reconciliation of the fair value hierarchy to the amounts presented in the Statement of Assets and Liabilities. Concentration of Ownership: As of December 31, 2020, the Fund had two unitholders holding 10% or more of the outstanding units of the Fund, and aggregated to 36.8% of the Fund's total units outstanding. Supplementary Information: Total investment purchases, sales proceeds, and realized gain for the year ended December 31, 2020, were:
Purchases Sales Realizedat Cost Proceeds Gain
Investments 63,423,961$ 32,897,207$ 399,042$
Wilmington Trust Collective Investment Trust IndexSelect Funds Sub-Advised by flexPATH Strategies, LLC
See Notes to the Financial Statements. 49
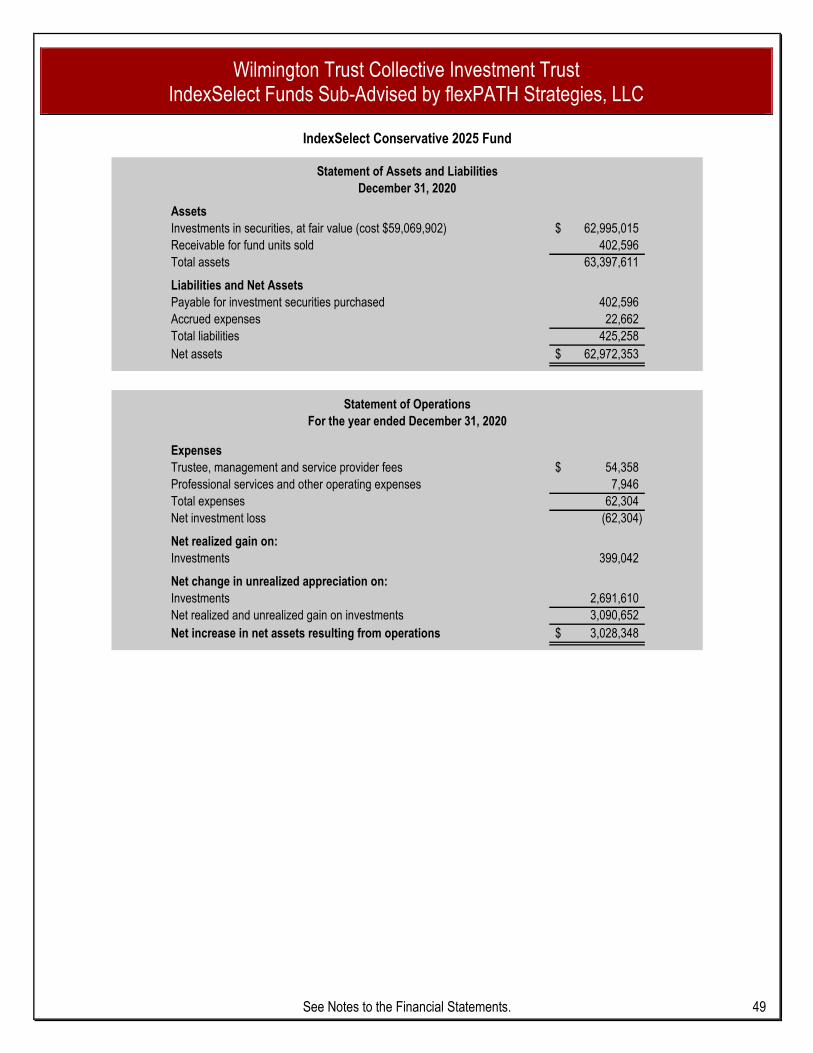
AssetsInvestments in securities, at fair value (cost $59,069,902) 62,995,015$ Receivable for fund units sold 402,596 Total assets 63,397,611
Liabilities and Net AssetsPayable for investment securities purchased 402,596 Accrued expenses 22,662 Total liabilities 425,258 Net assets 62,972,353$
ExpensesTrustee, management and service provider fees 54,358$ Professional services and other operating expenses 7,946 Total expenses 62,304 Net investment loss (62,304)
Net realized gain on:Investments 399,042
Net change in unrealized appreciation on:Investments 2,691,610 Net realized and unrealized gain on investments 3,090,652 Net increase in net assets resulting from operations 3,028,348$
IndexSelect Conservative 2025 Fund
Statement of OperationsFor the year ended December 31, 2020
Statement of Assets and LiabilitiesDecember 31, 2020

Wilmington Trust Collective Investment Trust IndexSelect Funds Sub-Advised by flexPATH Strategies, LLC
See Notes to the Financial Statements. 50
Increase in net assets resulting from operationsNet investment loss (62,304)$ Net realized gain on investments 399,042 Net change in unrealized appreciation on investments 2,691,610 Net increase in net assets resulting from operations 3,028,348
Fund unit transactionsProceeds from units issuedClass I 18,750,291 Class I1 3,648,336 Class R 394,799 Class R6 18,557,769 Total proceeds from units issued 41,351,195
Value of units redeemedClass I (8,850,133) Class I1 (568,006) Class R (538,494) Class R6 (813,313) Total value of units redeemed (10,769,946)
Increase in net assets resulting from fund unit transactions 30,581,249
Increase in net assets 33,609,597
Net assets, beginning of year 29,362,756 Net assets, end of year 62,972,353$
Statement of Changes in Net AssetsFor the year ended December 31, 2020
IndexSelect Conservative 2025 Fund
Wilmington Trust Collective Investment Trust IndexSelect Funds Sub-Advised by flexPATH Strategies, LLC
See Notes to the Financial Statements. 51
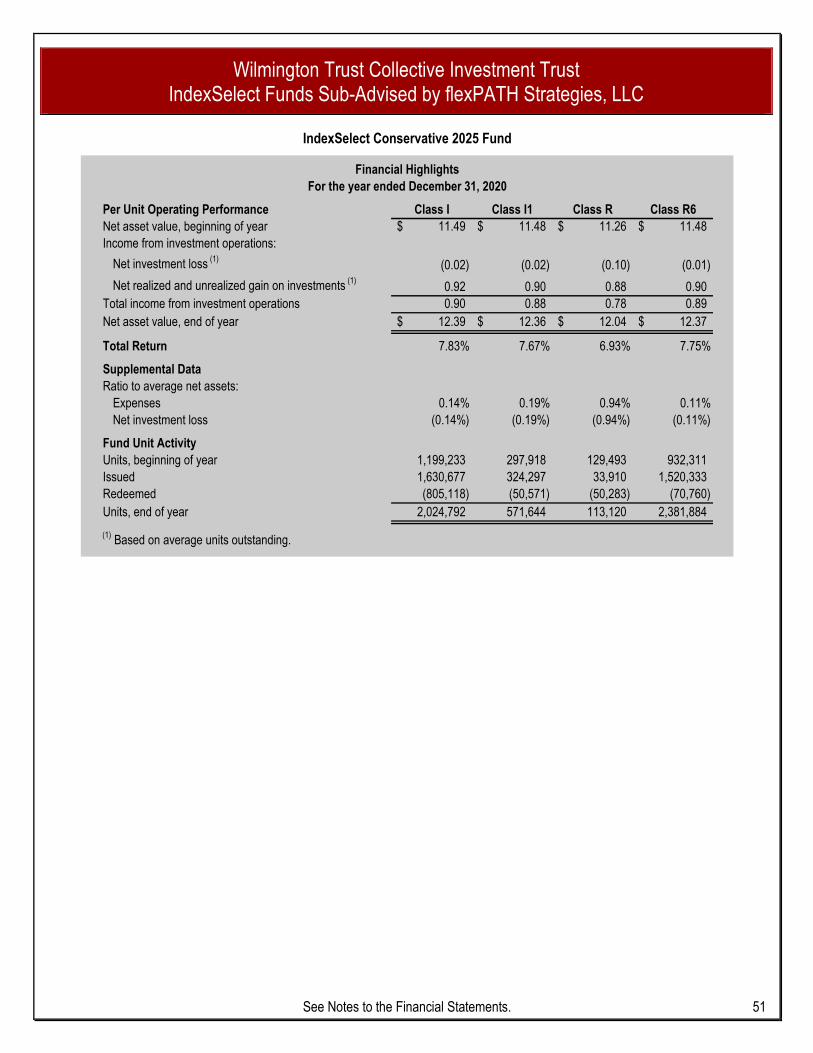
Per Unit Operating Performance Class I Class I1 Class R Class R6Net asset value, beginning of year 11.49$ 11.48$ 11.26$ 11.48$ Income from investment operations:
Net investment loss (1) (0.02) (0.02) (0.10) (0.01) Net realized and unrealized gain on investments (1) 0.92 0.90 0.88 0.90
Total income from investment operations 0.90 0.88 0.78 0.89 Net asset value, end of year 12.39$ 12.36$ 12.04$ 12.37$
Total Return 7.83% 7.67% 6.93% 7.75%
Supplemental DataRatio to average net assets:
Expenses 0.14% 0.19% 0.94% 0.11%Net investment loss (0.14%) (0.19%) (0.94%) (0.11%)
Fund Unit ActivityUnits, beginning of year 1,199,233 297,918 129,493 932,311 Issued 1,630,677 324,297 33,910 1,520,333 Redeemed (805,118) (50,571) (50,283) (70,760) Units, end of year 2,024,792 571,644 113,120 2,381,884 (1) Based on average units outstanding.
Financial HighlightsFor the year ended December 31, 2020
IndexSelect Conservative 2025 Fund

Wilmington Trust Collective Investment Trust IndexSelect Funds Sub-Advised by flexPATH Strategies, LLC
See Notes to the Financial Statements. 52
IndexSelect Conservative 2035 Fund
Schedule of Investments December 31, 2020
Principal
Amount or FairShares Cost Value
Collective Funds - 100.0%BlackRock MSCI ACWI ex-U.S. IMI Index Fund F 829,173 10,959,735$ 13,491,059$ Commodity Index Daily Fund F 201,659 895,704 1,010,250 Developed Real Estate Index Fund F 85,104 1,639,452 1,847,851 Russell 1000® Index Fund F 412,134 17,063,001 21,229,392 Russell 2000® Index Fund F 31,917 1,443,614 1,990,902 U.S. Debt Index Fund F 46,845 1,703,146 1,706,627 U.S. Treasury Inflation Protected Securities Fund F 149,919 3,483,767 3,695,429 WTNA Stable Value Fund Class R 2,768,758 28,901,634 29,212,334
Total Investments - 100.0% 66,090,053$ 74,183,844 Other Assets and Liabilities, Net - (0.0%) (34,822) Net Assets - 100% 74,149,022$
The following is a summary of the fair value of the investments in the Fund based on the inputs used to value them as of December 31, 2020 (see Note 3):
InvestmentsMeasured at
Level 1 Level 2 Level 3 Net Asset Value* Total
Collective Funds -$ -$ -$ 74,183,844$ 74,183,844$ Total -$ -$ -$ 74,183,844$ 74,183,844$
Fair Value Measurements
*Certain investments that are measured at fair value using the net asset value per share (or its equivalent) as a practical expedient have not been categorized in the fair value hierarchy. The fair value amounts presented in this table are intended to permit reconciliation of the fair value hierarchy to the amounts presented in the Statement of Assets and Liabilities. Concentration of Ownership: As of December 31, 2020, the Fund had one unitholder holding 10% or more of the outstanding units of the Fund, and aggregated to 33.8% of the Fund's total units outstanding. Supplementary Information: Total investment purchases, sales proceeds, and realized gain for the year ended December 31, 2020, were:
Purchases Sales Realizedat Cost Proceeds Gain
Investments 69,468,173$ 32,362,197$ 826,772$

Wilmington Trust Collective Investment Trust IndexSelect Funds Sub-Advised by flexPATH Strategies, LLC
See Notes to the Financial Statements. 53
AssetsInvestments in securities, at fair value (cost $66,090,053) 74,183,844$ Receivable for fund units sold 156,692 Total assets 74,340,536
Liabilities and Net AssetsPayable for investment securities purchased 91,964 Payable for fund units redeemed 64,728 Accrued expenses 34,822 Total liabilities 191,514 Net assets 74,149,022$
ExpensesTrustee, management and service provider fees 74,366$ Professional services and other operating expenses 14,844 Total expenses 89,210 Net investment loss (89,210)
Net realized gain on:Investments 826,772
Net change in unrealized appreciation on:Investments 6,254,436 Net realized and unrealized gain on investments 7,081,208 Net increase in net assets resulting from operations 6,991,998$
IndexSelect Conservative 2035 Fund
Statement of OperationsFor the year ended December 31, 2020
Statement of Assets and LiabilitiesDecember 31, 2020

Wilmington Trust Collective Investment Trust IndexSelect Funds Sub-Advised by flexPATH Strategies, LLC
See Notes to the Financial Statements. 54
Increase in net assets resulting from operationsNet investment loss (89,210)$ Net realized gain on investments 826,772 Net change in unrealized appreciation on investments 6,254,436 Net increase in net assets resulting from operations 6,991,998
Fund unit transactionsProceeds from units issuedClass I 9,075,171 Class I1 2,926,064 Class R 145,950 Class R6 37,691,075 Total proceeds from units issued 49,838,260
Value of units redeemedClass I (4,429,505) Class I1 (1,240,357) Class R (307,083) Class R6 (6,685,094) Total value of units redeemed (12,662,039)
Increase in net assets resulting from fund unit transactions 37,176,221
Increase in net assets 44,168,219
Net assets, beginning of year 29,980,803 Net assets, end of year 74,149,022$
Statement of Changes in Net AssetsFor the year ended December 31, 2020
IndexSelect Conservative 2035 Fund

Wilmington Trust Collective Investment Trust IndexSelect Funds Sub-Advised by flexPATH Strategies, LLC
See Notes to the Financial Statements. 55
Per Unit Operating Performance Class I Class I1 Class R Class R6Net asset value, beginning of year 11.94$ 11.93$ 11.71$ 11.96$ Income from investment operations:
Net investment loss (1) (0.02) (0.02) (0.11) (0.01) Net realized and unrealized gain on investments (1) 1.18 1.17 1.14 1.16
Total income from investment operations 1.16 1.15 1.03 1.15 Net asset value, end of year 13.10$ 13.08$ 12.74$ 13.11$
Total Return 9.72% 9.64% 8.80% 9.62%
Supplemental DataRatio to average net assets:
Expenses 0.14% 0.19% 0.95% 0.11%Net investment loss (0.14%) (0.19%) (0.95%) (0.11%)
Fund Unit ActivityUnits, beginning of year 1,641,757 426,226 124,598 320,166 Issued 768,485 249,251 12,636 3,202,191 Redeemed (375,395) (110,684) (25,012) (572,680) Units, end of year 2,034,847 564,793 112,222 2,949,677 (1) Based on average units outstanding.
Financial HighlightsFor the year ended December 31, 2020
IndexSelect Conservative 2035 Fund

Wilmington Trust Collective Investment Trust IndexSelect Funds Sub-Advised by flexPATH Strategies, LLC
See Notes to the Financial Statements. 56
IndexSelect Conservative 2045 Fund
Schedule of Investments December 31, 2020
Principal
Amount or FairShares Cost Value
Collective Funds - 100.0%BlackRock MSCI ACWI ex-U.S. IMI Index Fund F 927,799 12,406,073$ 15,095,756$ Commodity Index Daily Fund F 84,766 376,367 424,654 Developed Real Estate Index Fund F 90,085 1,763,229 1,956,024 Russell 1000® Index Fund F 421,761 17,714,916 21,725,278 Russell 2000® Index Fund F 16,382 754,986 1,021,877 U.S. Debt Index Fund F 16,875 613,543 614,769 U.S. Treasury Inflation Protected Securities Fund F 62,742 1,471,238 1,546,549 WTNA Stable Value Fund Class R 962,272 10,058,986 10,152,642
Total Investments - 100.0% 45,159,338$ 52,537,549 Other Assets and Liabilities, Net - (0.0%) (25,938) Net Assets - 100% 52,511,611$
The following is a summary of the fair value of the investments in the Fund based on the inputs used to value them as of December 31, 2020 (see Note 3):
InvestmentsMeasured at
Level 1 Level 2 Level 3 Net Asset Value* Total
Collective Funds -$ -$ -$ 52,537,549$ 52,537,549$ Total -$ -$ -$ 52,537,549$ 52,537,549$
Fair Value Measurements
*Certain investments that are measured at fair value using the net asset value per share (or its equivalent) as a practical expedient have not been categorized in the fair value hierarchy. The fair value amounts presented in this table are intended to permit reconciliation of the fair value hierarchy to the amounts presented in the Statement of Assets and Liabilities. Concentration of Ownership: As of December 31, 2020, the Fund had one unitholder holding 10% or more of the outstanding units of the Fund, and aggregated to 37.4% of the Fund's total units outstanding. Supplementary Information: Total investment purchases, sales proceeds, and realized gain for the year ended December 31, 2020, were:
Purchases Sales Realizedat Cost Proceeds Gain
Investments 47,847,122$ 20,992,263$ 435,581$

Wilmington Trust Collective Investment Trust IndexSelect Funds Sub-Advised by flexPATH Strategies, LLC
See Notes to the Financial Statements. 57
AssetsInvestments in securities, at fair value (cost $45,159,338) 52,537,549$ Receivable for fund units sold 82,540 Total assets 52,620,089
Liabilities and Net AssetsPayable for investment securities purchased 54,502 Payable for fund units redeemed 28,038 Accrued expenses 25,938 Total liabilities 108,478 Net assets 52,511,611$
ExpensesTrustee, management and service provider fees 51,025$ Professional services and other operating expenses 13,068 Total expenses 64,093 Net investment loss (64,093)
Net realized gain on:Investments 435,581
Net change in unrealized appreciation on:Investments 5,794,021 Net realized and unrealized gain on investments 6,229,602 Net increase in net assets resulting from operations 6,165,509$
IndexSelect Conservative 2045 Fund
Statement of OperationsFor the year ended December 31, 2020
Statement of Assets and LiabilitiesDecember 31, 2020

Wilmington Trust Collective Investment Trust IndexSelect Funds Sub-Advised by flexPATH Strategies, LLC
See Notes to the Financial Statements. 58
Increase in net assets resulting from operationsNet investment loss (64,093)$ Net realized gain on investments 435,581 Net change in unrealized appreciation on investments 5,794,021 Net increase in net assets resulting from operations 6,165,509
Fund unit transactionsProceeds from units issuedClass I 7,380,911 Class I1 1,097,248 Class R 325,516 Class R6 29,016,227 Total proceeds from units issued 37,819,902
Value of units redeemedClass I (3,022,374) Class I1 (645,916) Class R (502,585) Class R6 (6,743,799) Total value of units redeemed (10,914,674)
Increase in net assets resulting from fund unit transactions 26,905,228
Increase in net assets 33,070,737
Net assets, beginning of year 19,440,874 Net assets, end of year 52,511,611$
Statement of Changes in Net AssetsFor the year ended December 31, 2020
IndexSelect Conservative 2045 Fund

Wilmington Trust Collective Investment Trust IndexSelect Funds Sub-Advised by flexPATH Strategies, LLC
See Notes to the Financial Statements. 59
Per Unit Operating Performance Class I Class I1 Class R Class R6Net asset value, beginning of year 12.82$ 12.82$ 12.72$ 12.83$ Income from investment operations:
Net investment loss (1) (0.02) (0.03) (0.12) (0.02) Net realized and unrealized gain on investments (1) 1.58 1.58 1.56 1.59
Total income from investment operations 1.56 1.55 1.44 1.57 Net asset value, end of year 14.38$ 14.37$ 14.16$ 14.40$
Total Return 12.17% 12.09% 11.32% 12.24%
Supplemental DataRatio to average net assets:
Expenses 0.15% 0.20% 0.95% 0.12%Net investment loss (0.15%) (0.20%) (0.95%) (0.12%)
Fund Unit ActivityUnits, beginning of year 878,661 385,676 87,112 165,766 Issued 576,450 90,991 27,520 2,342,143 Redeemed (250,082) (55,167) (40,352) (557,620) Units, end of year 1,205,029 421,500 74,280 1,950,289 (1) Based on average units outstanding.
Financial HighlightsFor the year ended December 31, 2020
IndexSelect Conservative 2045 Fund

Wilmington Trust Collective Investment Trust IndexSelect Funds Sub-Advised by flexPATH Strategies, LLC
See Notes to the Financial Statements. 60
IndexSelect Conservative 2055 Fund
Schedule of Investments December 31, 2020
Principal
Amount or FairShares Cost Value
Collective Funds - 100.1%BlackRock MSCI ACWI ex-U.S. IMI Index Fund F 627,886 8,458,468$ 10,216,028$ Commodity Index Daily Fund F 5,744 25,326 28,774 Developed Real Estate Index Fund F 57,445 1,143,448 1,247,295 Russell 1000® Index Fund F 272,112 11,383,155 14,016,732 Russell 2000® Index Fund F 5,552 256,172 346,337 U.S. Debt Index Fund F 649 23,613 23,660 U.S. Treasury Inflation Protected Securities Fund F 4,522 106,463 111,461 WTNA Stable Value Fund Class R 39,354 411,697 415,207
Total Investments - 100.1% 21,808,342$ 26,405,494 Other Assets and Liabilities, Net - (0.1%) (13,418) Net Assets - 100% 26,392,076$
The following is a summary of the fair value of the investments in the Fund based on the inputs used to value them as of December 31, 2020 (see Note 3):
InvestmentsMeasured at
Level 1 Level 2 Level 3 Net Asset Value* Total
Collective Funds -$ -$ -$ 26,405,494$ 26,405,494$ Total -$ -$ -$ 26,405,494$ 26,405,494$
Fair Value Measurements
*Certain investments that are measured at fair value using the net asset value per share (or its equivalent) as a practical expedient have not been categorized in the fair value hierarchy. The fair value amounts presented in this table are intended to permit reconciliation of the fair value hierarchy to the amounts presented in the Statement of Assets and Liabilities. Concentration of Ownership: As of December 31, 2020, the Fund had two unitholders holding 10% or more of the outstanding units of the Fund, and aggregated to 55.8% of the Fund's total units outstanding. Supplementary Information: Total investment purchases, sales proceeds, and realized gain for the year ended December 31, 2020, were:
Purchases Sales Realizedat Cost Proceeds Gain
Investments 20,575,898$ 7,116,330$ 54,718$

Wilmington Trust Collective Investment Trust IndexSelect Funds Sub-Advised by flexPATH Strategies, LLC
See Notes to the Financial Statements. 61
AssetsInvestments in securities, at fair value (cost $21,808,342) 26,405,494$ Receivable for fund units sold 103,494 Total assets 26,508,988
Liabilities and Net AssetsPayable for investment securities purchased 103,489 Payable for fund units redeemed 5 Accrued expenses 13,418 Total liabilities 116,912 Net assets 26,392,076$
ExpensesTrustee, management and service provider fees 24,399$ Professional services and other operating expenses 7,544 Total expenses 31,943 Net investment loss (31,943)
Net realized gain on:Investments 54,718
Net change in unrealized appreciation on:Investments 3,837,842 Net realized and unrealized gain on investments 3,892,560 Net increase in net assets resulting from operations 3,860,617$
IndexSelect Conservative 2055 Fund
Statement of OperationsFor the year ended December 31, 2020
Statement of Assets and LiabilitiesDecember 31, 2020

Wilmington Trust Collective Investment Trust IndexSelect Funds Sub-Advised by flexPATH Strategies, LLC
See Notes to the Financial Statements. 62
Increase in net assets resulting from operationsNet investment loss (31,943)$ Net realized gain on investments 54,718 Net change in unrealized appreciation on investments 3,837,842 Net increase in net assets resulting from operations 3,860,617
Fund unit transactionsProceeds from units issuedClass I 2,980,114 Class I1 901,919 Class R 148,952 Class R6 14,262,999 Total proceeds from units issued 18,293,984
Value of units redeemedClass I (1,195,275) Class I1 (471,696) Class R (166,964) Class R6 (2,976,309) Total value of units redeemed (4,810,244)
Increase in net assets resulting from fund unit transactions 13,483,740
Increase in net assets 17,344,357
Net assets, beginning of year 9,047,719 Net assets, end of year 26,392,076$
Statement of Changes in Net AssetsFor the year ended December 31, 2020
IndexSelect Conservative 2055 Fund

Wilmington Trust Collective Investment Trust IndexSelect Funds Sub-Advised by flexPATH Strategies, LLC
See Notes to the Financial Statements. 63
Per Unit Operating Performance Class I Class I1 Class R Class R6Net asset value, beginning of year 12.93$ 12.91$ 12.67$ 12.92$ Income from investment operations:
Net investment loss (1) (0.02) (0.03) (0.12) (0.02) Net realized and unrealized gain on investments (1) 1.96 1.97 1.88 1.97
Total income from investment operations 1.94 1.94 1.76 1.95 Net asset value, end of year 14.87$ 14.85$ 14.43$ 14.87$
Total Return 15.00% 15.03% 13.89% 15.09%
Supplemental DataRatio to average net assets:
Expenses 0.16% 0.21% 0.96% 0.13%Net investment loss (0.16%) (0.21%) (0.96%) (0.13%)
Fund Unit ActivityUnits, beginning of year 381,051 271,330 29,165 19,179 Issued 244,801 74,037 12,066 1,153,756 Redeemed (103,181) (38,943) (15,848) (251,624) Units, end of year 522,671 306,424 25,383 921,311 (1) Based on average units outstanding.
Financial HighlightsFor the year ended December 31, 2020
IndexSelect Conservative 2055 Fund

Wilmington Trust Collective Investment Trust
IndexSelect Funds Sub-Advised by flexPATH Strategies, LLC
Notes to the Financial Statements
December 31, 2020
64
Note 1 – Organization Wilmington Trust Collective Investment Trust (the "Trust") is intended to constitute an exempt trust under Section 501(a) of the Internal Revenue Code of 1986, as amended (the "Code"), and a group trust within the meaning of Rev. Rul. 81-100, as clarified and amended. The Trust is exempt from registration under the Investment Company Act of 1940, as amended, and the Securities Act of 1933, as amended. Wilmington Trust, N.A. ("WTNA" or the "Trustee") serves as the Trustee of the Trust. The Trustee is responsible for maintaining and administering the Trust and its various funds (the "Funds" – see Fund Index) and also serves as the investment manager (the "Investment Manager") to the Funds. M&T Bank Corporation is the ultimate parent of the Trustee. State Street Bank and Trust Company provides custody, transfer agency, and accounting services for the Funds. The purpose of the Trust is to allow collective investments by plan sponsors of retirement plans which qualify for exemption from federal income taxation pursuant to Section 501(a) of the Code, by reason of qualifying under Section 401(a) of the Code; tax-exempt governmental plans under Section 414(d) or Section 818(a)(6) of the Code; eligible deferred compensation plans under Section 457(b) of the Code established by a government employer; group trusts or separate accounts consisting solely of assets of the foregoing; and other investors eligible for participation in the Trust. The Trust consists of separate funds with differing investment objectives, which are available for investment by participating plans. An eligible plan may join the Trust, subject to the Trustee's acceptance, and become a participating plan by executing participation documents specified by the Trustee. Not all funds within the Trust are presented herein. WTNA has engaged flexPATH Strategies, LLC ("flexPATH" or the "Sub-Advisor") to provide investment advice and recommendations with respect to investment of the Funds' assets. While the Trustee generally relies on the Sub-Advisor to manage the Funds' assets, the Trustee maintains ultimate fiduciary authority over the management of and investments made in each Fund. The Sub-Advisor is engaged pursuant to a sub-advisor agreement. Note 2 – Significant Accounting Policies The financial statements have been prepared in conformity with accounting principles generally accepted in the United States of America ("U.S. GAAP"). The Funds are investment companies and follow the accounting and reporting guidance in Financial Accounting Standards Board Accounting Standards Codification Topic No. 946. Net Asset Value ("NAV") – Units of each fee class of each Fund are valued each day on which the New York Stock Exchange ("NYSE") is open for trading in accordance with the valuation procedures established by the Trustee. The NAV per unit is calculated as of the close of trading on the NYSE (generally, 4:00 p.m. U.S. Eastern time). The NAV per unit is computed by dividing the total fair value of the assets of a Fund, less its liabilities, by the total number of units outstanding at the time of such computation. Investment income earned is reinvested in the Fund and included in the determination of unit values.
Wilmington Trust Collective Investment Trust
IndexSelect Funds Sub-Advised by flexPATH Strategies, LLC
Notes to the Financial Statements (continued)
December 31, 2020
65
Fund Unit Transactions – The Funds sell new units and repurchase outstanding units on a daily basis. Unit purchases and redemptions are transacted at the NAV per fee class of the Funds determined as of the close of business each day. A summary of the Fund unit activity for each Fund is included with its Financial Highlights. The Funds require the plan sponsors to provide advance written notice of five business days for plan sponsor directed withdrawals which will exceed $1 million or 10% of the assets invested in each Fund. Investment Valuation – Investments are valued at their current fair value determined as follows:
Investments in Collective Funds – Some Funds hold investments in units of other funds within the Trust or similar funds for which other unrelated entities are trustee. The Trustee or an unrelated trustee estimates the fair value of investments in collective funds that have calculated net asset value per unit in accordance with the specialized accounting guidance for investment companies. Accordingly, as a practical expedient, investments in other such funds are valued at their net asset value as reported by the investee funds. The Funds have the ability to redeem their investments in the collective funds at net asset value without restrictions. Where one fund invests in another fund within the Trust, the Trustee fee allocated to the investment by such investee fund is waived.
When the valuation method described above is not reflective of fair value, investments are valued at fair value following procedures and/or guidelines determined by or under the direction of the valuation committee established by the Trustee. In light of the judgment involved in fair value decisions, there can be no assurance that a fair value assigned to a particular investment is accurate. Cash and Cash Equivalents – The Funds consider all highly liquid instruments with original maturities of three months or less at the acquisition date to be cash equivalents. Investment Transactions and Investment Income – The Funds record security transactions on a trade date basis. Dividend income is recorded on the ex-dividend date. Net realized gains and losses on investments are determined by the first-in, first-out method. Interest income and expenses are recorded daily on the accrual basis. Fee Classes and Allocations – Most of the Funds offer multiple fee classes. Not all fee classes are available for investment by all plans. Each class is allocated expenses on the basis of expense loads assigned to that class. Income, expenses (other than expenses attributable to a specific class), and realized and unrealized gains or losses on investments are allocated to each fee class based on the units outstanding for the fee class in proportion to the total outstanding units. Use of Estimates – The preparation of financial statements in conformity with U.S. GAAP requires management to make estimates and assumptions that affect the amounts reported in the financial statements and accompanying notes. Actual results could differ from those estimates. Guarantees and Indemnifications – Under the Funds' organizational documents, each trustee, officer, employee and agent of the Trust is indemnified, to the extent permitted by law, against certain liabilities that may arise in the performance of their duties to the Funds.

Wilmington Trust Collective Investment Trust
IndexSelect Funds Sub-Advised by flexPATH Strategies, LLC
Notes to the Financial Statements (continued)
December 31, 2020
66
Additionally, in the normal course of business, the Funds enter into contracts that contain a variety of indemnification clauses. The Funds' maximum exposure under these arrangements is unknown as this would involve future claims that may be made against the Funds that have not yet occurred. However, none of the Funds has had prior claims or losses pursuant to these contracts and the Trustee believes the risk of loss to be remote. Income Tax Status – The Trust has received a determination from the Internal Revenue Service that the Trust is exempt from federal income taxation under Section 501(a) of the Code. Accordingly, no federal income tax provision is required. Subsequent Events – The Trustee has evaluated the effect of subsequent events on the Funds' financial statements through April 30, 2021, which is the date the financial statements were available to be issued, and has determined that there are no material subsequent events, except as noted below, that would require disclosure or adjustment in the Funds' financial statements through this date. During 2021, the Trustee is expected to engage The Northern Trust Company as the Custodian of the Funds. The Northern Trust Company will also provide transfer agent, recordkeeping and accounting services. Note 3 – Fair Value Measurements Fair value is defined as the price a fund would receive to sell an asset or pay to transfer a liability in an orderly transaction between market participants at the measurement date. Various inputs are used in determining the fair value of the Funds' investments. The Trustee has performed an analysis of the significance and character of these inputs to the fair value determination. These inputs are summarized in the three broad levels listed below:
• Level 1 – Quoted prices in active markets for identical investments.
• Level 2 – Other significant observable inputs (including quoted prices for similar investments, interest rates, credit risk, and others).
• Level 3 – Significant unobservable inputs (including the Trustee's own assumptions in determining the fair value of investments).
The inputs or methodology used for valuing investments are not necessarily an indication of the risk associated with investing in those investments. The aggregate fair value of the investments in each Fund, by input level used as of December 31, 2020, is included following each Fund's Schedule of Investments.
Wilmington Trust Collective Investment Trust
IndexSelect Funds Sub-Advised by flexPATH Strategies, LLC
Notes to the Financial Statements (continued)
December 31, 2020
67
Note 4 – Fees and Expenses Trustee, Management and Service Provider Fees All asset-based fees are based upon the net assets as determined at the end of each preceding business day as set forth in the table below (in basis points). Except as otherwise noted, all asset-based fees are paid from the assets of the Funds.
Management Fee
Fee Class Trustee
Fee Sub-Advisor
Fee Investment
Consultant Fee Management Services Fee
Service Provider Fee
IndexSelect Series Class F 4 0 3.3 0 0 IndexSelect Series Class I 4 5 3.3 0 0 IndexSelect Series Class I1 4 0 3.3 10 0 IndexSelect Series Class R 4 5 3.3 0 80 IndexSelect Series Class R6 3 3.75 2.3 0 0
Trustee Fee – The Trustee receives an annual fee for trustee and administrative services provided to each Fund. Trustee fees are based upon the average daily value of the Fund and are accrued daily, paid quarterly in arrears and charged against the assets invested in the Fund. Sub-Advisor Fee – flexPATH is compensated for its investment advisory and consultant services provided to each Fund. The Investment Consultant Fee includes a fee for services of the manager of the underlying funds used in the IndexSelect Series. These fees are based upon the average daily value of the Fund and are accrued daily, paid quarterly in arrears and charged against the assets invested in the Fund. Management Fee – BlackRock Financial Management, Inc. is compensated for its Glidepath services provided to each Fund. These fees are based upon the average daily value of the Fund and are accrued daily, paid quarterly in arrears and charged against the assets invested in the Fund. Service Provider Fee – Service provider fees, if any, are used to compensate other service providers to each Fund, including brokers and financial intermediaries and other parties providing services to retirement plans participating in the Fund. Service provider fees may also be paid to plan service providers, such as third-party administrators and recordkeepers that provide sub-transfer agency, recordkeeping and other administrative services to participating plans invested in the Fund. Operating Expenses – In addition to the fees described above, each Fund bears expenses related to its operation, including, but not limited to, audit, custody, tax and legal services. Expenses incurred in connection with the investment and reinvestment of Fund assets, including, without limitation, transfer agency fees, brokerage commission and other expenses, are also charged against the Fund.
Wilmington Trust Collective Investment Trust
IndexSelect Funds Sub-Advised by flexPATH Strategies, LLC
Notes to the Financial Statements (continued)
December 31, 2020
68
When assets of a Fund are invested in other investment vehicles, such as other collective funds or Exchange-Traded Funds, those investment vehicles will incur fees and expenses, which will be reflected in the operating results and value of the Fund's investment in such investment vehicle, and are separate and distinct from the fees and expenses of the Fund described above. Note 5 – Related Party Transactions The Trustee is a national bank that provides trust and custodial services for tax-advantaged retirement plans as well as trust and investment services to business pension and retirement plans. The Trustee is responsible for managing the Trust's investment and business affairs. Note 6 – Risks Associated with Investing in the Funds The Funds invest in Underlying Funds. In the normal course of business, the Underlying Funds trade financial instruments and enter into financial transactions where risk of potential loss exists due to changes in the fair value of the investments. The Funds' risks are closely associated with the risks of the securities and other investments held by the Underlying Funds, and the ability of the Funds to meet their investment objectives likewise depends on the ability of the Underlying Funds to meet their objectives. Investment in the Underlying Funds may subject the Funds to higher costs than owning the underlying securities directly because of their management fees and administrative costs. The principal risks associated with investing in the Underlying Funds are:
• Credit and Counterparty. The issuer or guarantor of a fixed income security, counterparty to an OTC derivatives contract, or other borrower may not be able to make timely principal, interest, or settlement payments on an obligation. In this event, the issuer of a fixed income security may have its credit rating downgraded or defaulted, which may reduce the potential for income and value of the Fund.
• Equity Securities. The value of equity securities, which include common, preferred, and convertible
preferred stocks, will fluctuate based on changes in their issuers' financial conditions, as well as overall market and economic conditions, and can decline in the event of deteriorating issuer, market, or economic conditions.
• Fixed Income Securities. The value of fixed income or debt securities may be susceptible to general
movements in the bond market and are subject to interest rate and credit risk.
• Foreign Securities. Investments in foreign securities may be subject to increased volatility as the value of these securities can change more rapidly and extremely than the value of U.S. securities. Factors that increase the risk of investing in foreign securities include but are not limited to the following: less public information about issuers of non-U.S. securities; less governmental regulation and supervision over the issuance and trading of securities, the unavailability of financial information regarding the non-U.S. issuer or the difficulty of interpreting financial information prepared under non-U.S. accounting standards, less liquidity, the imposition of withholding and other taxes, and adverse political, social or diplomatic developments. In addition, foreign securities are subject to increased costs because there are generally
Wilmington Trust Collective Investment Trust
IndexSelect Funds Sub-Advised by flexPATH Strategies, LLC
Notes to the Financial Statements (continued)
December 31, 2020
69
higher commission rates on transactions, transfer taxes, higher custodial costs, and the potential for foreign tax charges on dividend and interest payments. Many foreign markets are relatively small, and securities issued in less-developed countries face the risks of nationalization, expropriation or confiscatory taxation, and adverse changes in investment or exchange control regulations, including suspension of the ability to transfer currency from a country. Economic, political, social, or diplomatic developments can also negatively impact performance.
• Guaranteed Investment Contract. Guaranteed investment contracts, commonly referred to as GICs, are
issued by insurance companies and other financial institutions. The "guarantee" refers to the guarantee by the issuers of specific rates of return for stated periods of time and is based on the claims-paying ability (solvency) of the issuer. The Fund may also use synthetic GICs, which are wrapped by third-party banks, insurance companies and other financial institutions; the Fund relies on the credit of the wrap issuer. Funds holding GICs may impose plan-level redemption restrictions and conditions.
• Issuer. A stake in any individual security is subject to the risk that the issuer of that security performs poorly,
resulting in a decline in the security's value. Issuer-related declines may be caused by poor management decisions, competitive pressures, technological breakthroughs, reliance on suppliers, labor problems or shortages, corporate restructurings, fraudulent disclosures, or other factors. Additionally, certain issuers may be more sensitive to adverse issuer, political, regulatory, market, or economic developments.
• Market/Market Volatility. The market value of the Fund's securities may fall rapidly or unpredictably because
of changing economic, political, or market conditions, which may reduce the value of the Fund.
• Non-Diversification. A non-diversified fund may have an increased potential for loss because it includes a relatively small number of investments. Movements in the prices of the individual investments may have a magnified effect on a non-diversified portfolio. Any sale of the Fund's large positions could adversely affect stock prices if those positions represent a significant part of a company's outstanding stock.
• Small Cap. Concentrating assets in small-capitalization stocks may subject the Fund to the risk that those
stocks underperform other capitalizations or the market as a whole. Smaller, less-seasoned companies may be subject to increased liquidity risk compared with mid- and large-cap companies.
• Stable Value/Stability. There is no guarantee the Fund will achieve its objective and be able to maintain a
stable income without principal volatility. This classic definition of investment risk is greatly mitigated in stable value investing from the use of book value investment contracts. The volatility of the underlying fixed income securities has little impact on contract crediting rates, assuming the overall duration of the portfolio is managed consistently.
• Target Date. Target date funds, also known as lifecycle funds, shift their asset allocation to become increasingly conservative as the target retirement year approaches. Still, investment in target date funds may lose value near, at, or after the target retirement date, and there is no guarantee they will provide adequate income at retirement.