wimax deployment considerations
DESCRIPTION
TRANSCRIPT
WiMAX Deployment Considerations for Fixed Wireless Access in the
2.5 GHz and 3.5 GHz Licensed Bands
June, 2005
Copyright 2005 WiMAX Forum “WiMAX Forum™” and "WiMAX Forum CERTIFIED™“ are registered trademarks of the WiMAX Forum™.

________________________________________________________________________
Copyright 2005 WiMAX Forum “WiMAX Forum™” and "WiMAX Forum CERTIFIED™“ are registered trademarks of the WiMAX Forum™.
Page 2 of 21
WiMAX Deployment Considerations for Fixed Wireless Access in the 2.5 GHz and 3.5 GHz Licensed Bands
Introduction This paper addresses some of the deployment considerations for a wireless metropolitan area network based on the IEEE 802.16-2004 Air Interface Standard, commonly referred to as WiMAX. This paper will focus on deployments using licensed spectrum in the 2.5 GHz and 3.5 GHz frequency bands. With support for COFDM1, deployments in these bands are especially interesting in today’s wireless access market since they offer the potential for achieving ubiquitous coverage for high speed access over an entire metropolitan area with adequate range and capacity for a cost-effective access network. In addition to presenting a detailed view of base station channel capacity versus range, specific deployment examples will be analyzed to the relationship between base station infrastructure costs and available spectrum in both frequency bands. The impact on channel capacity and range when deploying with indoor self-installable customer terminals will also be discussed.
Licensed Spectrum for Wireless MANs Although both the 3.5 GHz Band and the 2.5 GHz Band are not universally available worldwide for fixed wireless access, at least one the two bands is available in most every major country. 3.5 GHz Band: The “3.5 GHz” band is available as a licensed band in many countries outside the United States for fixed broadband wireless access. Although the regulations for deployment and specific allocations vary considerably country by country, this band is undoubtedly the most used spectrum for wireless metropolitan area networks (MANs) today. Typical characteristics for the 3.5 GHz band based on a limited country by country survey are:
• Total available spectrum - Varies country by country but generally about 200 MHz between 3.4 GHz and 3.8 GHz
• Services allowed - Fixed access is usually specified 1 COFDM: Coded Orthogonal Frequency Division Multiplex, a modulation scheme that divides a single digital signal across multiple signal carriers simultaneously. Initial WiMAX products will use 256 carriers.

________________________________________________________________________
Copyright 2005 WiMAX Forum “WiMAX Forum™” and "WiMAX Forum CERTIFIED™“ are registered trademarks of the WiMAX Forum™.
Page 3 of 21
• FDD or TDD - This is mixed, some countries specify FDD only while others allow either FDD or TDD
• Spectrum per license - Varies from 2 x 5 MHz to 2 x 56 MHz • License aggregation - Some countries allow license aggregation operators
to gain access to more spectrum, others do not allow aggregation
2.5 GHz Band: This band is allocated for fixed microwave services in many countries including the United States. Although many of these countries have rules which do not support two-way services it is expected that this will change as WiMAX equipment becomes more readily available worldwide and operators lobby for more licensed spectrum for both fixed and mobile broadband services. In the United States the FCC modified the rules for this band in 1998 to allow two-way services and in mid-2004, announced a realignment of the channel plan. With these rule modifications, this band is now well suited to a WiMAX-based deployment and makes up for the fact that the 3.5 GHz band is not available for wireless access in the United States. The following details for the 2.5 GHz band is based on the most recent FCC rules.
• Total available spectrum - Total of 195 MHz, including guard-bands and MDS channels, between 2.495 GHz and 2.690 GHz
• Services allowed - Fixed two-way or broadcast • FDD or TDD - Both TDD and FDD are allowed • Spectrum per license - 22.5 MHz per license, a 16.5 MHz block paired
with a 6 MHz block, a total of 8 licenses • License aggregation - Operators can acquire multiple licenses in one
geographical area to increase spectrum holdings
Radio Characteristics Two WiMAX equipment solutions have been selected for analysis. In the 2.5 GHz band, a time division duplex (TDD) solution with a 5 MHz channel bandwidth will be used and in the 3.5 GHz band a frequency division duplex (FDD) solution with dual 3.5MHz bandwidth channels will be used. These are not the only WiMAX equipment solutions that are expected to be available in these two bands but they are representative and serve the purposes intended for this paper. Other expected solutions include a TDD solution for the 3.5 GHZ band with a 7 MHz channel bandwidth and over a period of time, different channel bandwidths will be made available in both bands to provide operators with more deployment options. WiMAX-compliant equipment will also be available in other frequency bands. 5.8 GHz products for example, are anticipated at about the same time as 3.5 GHz and 2.5 GHz products.

________________________________________________________________________
Copyright 2005 WiMAX Forum “WiMAX Forum™” and "WiMAX Forum CERTIFIED™“ are registered trademarks of the WiMAX Forum™.
Page 4 of 21
Table 1 provides a summary of the key downlink radio characteristics that are used for the range and capacity estimates that follow in later sections of this paper. The system gain in table 1 is typical of med-performance WiMAX-compliant equipment solutions that are expected to be offered by vendors in the coming months. For the 2.5 GHz TDD solution, a downlink/uplink traffic split of 60/40 is assumed to reflect what is expected to be a typical traffic pattern for data-centric services. This makes the effective downlink (DL) channel bandwidth 3 MHz and the effective uplink (UL) channel bandwidth 3 MHz and the effective uplink (UL) channel bandwidth 2 MHz. With the same asymmetric traffic split in the FDD case, the 3.5 MHz uplink channel would not be fully utilized. The DL system gain for indoor self-installable CPE units is approximately 6 dB lower than the system gain for outdoor CPEs, primarily due to the difference in antenna gain. There is also additional path loss with indoor CPEs due to wall penetrations and non-optimal installation locations that will typically be off bore-sight to the base station antenna. This excess path loss is estimated to be about 15 dB. The propagation model that is used to predict the range is based on contributions to the IEEE 802.16 Broadband Wireless Access Working Group by Erceg, et al2 . The proposed propagation models cover three terrain categories; “A”, “B”, and “C”. “Category A”, being the highest path loss category, is used in this paper to predict propagation characteristics in urban environments and “Category C”, the lowest path loss terrain category, is used propagation predictions in rural environments. The intermediate path loss condition, “Category B”, is assumed for suburban environment range predictions. Treating these terrain categories as urban, suburban, and rural respectively is a suitable assumption for the purposes of this paper, but in practice each environment must be assessed on its’ specific characteristics. It would not be unusual for example, to encounter a rural area with a hilly terrain, extensive trees, and varied building heights making it a candidate for a high-loss propagation condition; “Category A”, rather than “Category C”. Additionally, some urban areas in smaller cities with low and similar building heights may qualify for an intermediate loss condition, “Category B”.
Attribute 2.5 GHz Band 3.5 GHz Band
Duplexing TDD FDD Channel Bandwidth 5 MHz 2 x 3.5 MHz Adaptive Modulation BPSK, QPSK, 16QAM, 64QAM (COFDM-256) Nominal System Gain for Outdoor CPEs 163 dB at BPSK 164 dB at BPSK
2 Erceg, et al, “Channel Models for Fixed Wireless Applications”, IEEE 802.16 Broadband Wireless Access Working Group, February 23, 2001.

________________________________________________________________________
Copyright 2005 WiMAX Forum “WiMAX Forum™” and "WiMAX Forum CERTIFIED™“ are registered trademarks of the WiMAX Forum™.
Page 5 of 21
Attribute 2.5 GHz Band 3.5 GHz Band
Nominal System Gain for Indoor Self-Installable CPEs
157 dB at BPSK 158 dB at BPSK
Excess Path Loss for Indoor CPEs 15 dB
TDD DL/UL Traffic Split 60/40 n/a
Propagation Conditions Urban, Suburban, and Rural 100% of end-user terminals are non lone-of-sight (NLOS)
Table 1: Relevant Radio Parameters
The use of adaptive modulation and adaptive coding enables each end-user link to dynamically adapt to the propagation path conditions for that particular link. When received signal levels are low, as would be the case for users more distant from the base station, the link automatically throttles down to a more robust, but less efficient, modulation scheme. Since each modulation scheme has a different modulation efficiency the effective channel capacity can only be determined by knowing what modulation and coding scheme is being used for each end-user link sharing that particular channel. This is readily done if it is assumed that the active subscribers on any given channel are uniformly distributed over the coverage area for that channel and additionally that each end-user is under the same conditions, i.e. all outdoor CPEs and all non-LOS. In a later section in this paper we will also look at the impact of a mixed deployment comprised of both indoor and outdoor CPEs. Deployments can be range-limited or capacity-limited. In a range-limited case, if a uniform distribution of active subscribers with outdoor CPEs is assumed, more than 60% of active users will be operating at either QPSK or BPSK with only 15% operating at 64QAM. This is illustrated in the 90-degree sector shown in figure 1. The range estimates shown in figure 1 apply to a 3.5 GHz deployment in a rural environment with all outdoor, non-LOS CPEs. With the distribution of users as shown, the effective downlink channel capacity (net user data rate) for a range-limited deployment is 3.8 Mbps as compared to 9.7 Mbps for a capacity-limited case with all end-users operating at 64QAM. Assuming that all end-users are non-LOS is, in many respects, a worse case situation. From a practical standpoint, it is reasonable to expect that some outdoor installations will be within line-of-sight or near-LOS to the base station antenna. Since the 64QAM range for LOS or near-LOS exceeds that of BPSK for non-LOS, in practice, some distant end-users will actually be operating at 64QAM instead of BPSK and thus raise the effective downlink channel capacity from the 3.8 Mbps shown. Another factor not taken into account in figure 1 is an allowance for co-channel interference (CCI) from adjacent cells

________________________________________________________________________
Copyright 2005 WiMAX Forum “WiMAX Forum™” and "WiMAX Forum CERTIFIED™“ are registered trademarks of the WiMAX Forum™.
Page 6 of 21
which, in a multi-cellular network, is an added consideration. Excessive interference will also cause the affected link to move to a more robust but less efficient modulation thus reducing the effective channel capacity. Predictions for LOS, near-LOS, and CCI can often be accomplished through the use of available RF planning tools along with high resolution 3-D terrain models. However since these two effects tend to offset one another, the approach used in figure 1 for estimating channel capacity represents a very adequate first order estimate for effective downlink channel capacity. For fixed services, due to license assignments with limited spectrum, most deployments will be capacity-limited rather than range-limited. Exceptions would be very low density rural areas, particularly those that could be classified as terrains with high propagation loss.
BPSK
64QAM
16QAM
QPSK
5.2 km 2.0 km 3.0 km 4.4 kmNon-LOS Range for Rural Deployment – 3.5 GHz FDD
~15% ~18% ~39% ~28%
Effective channel capacity at
maximum range = 3.8 Mbps
Figure 1: Typical Subscriber Density for a 3.5 GHz Rural Deployment
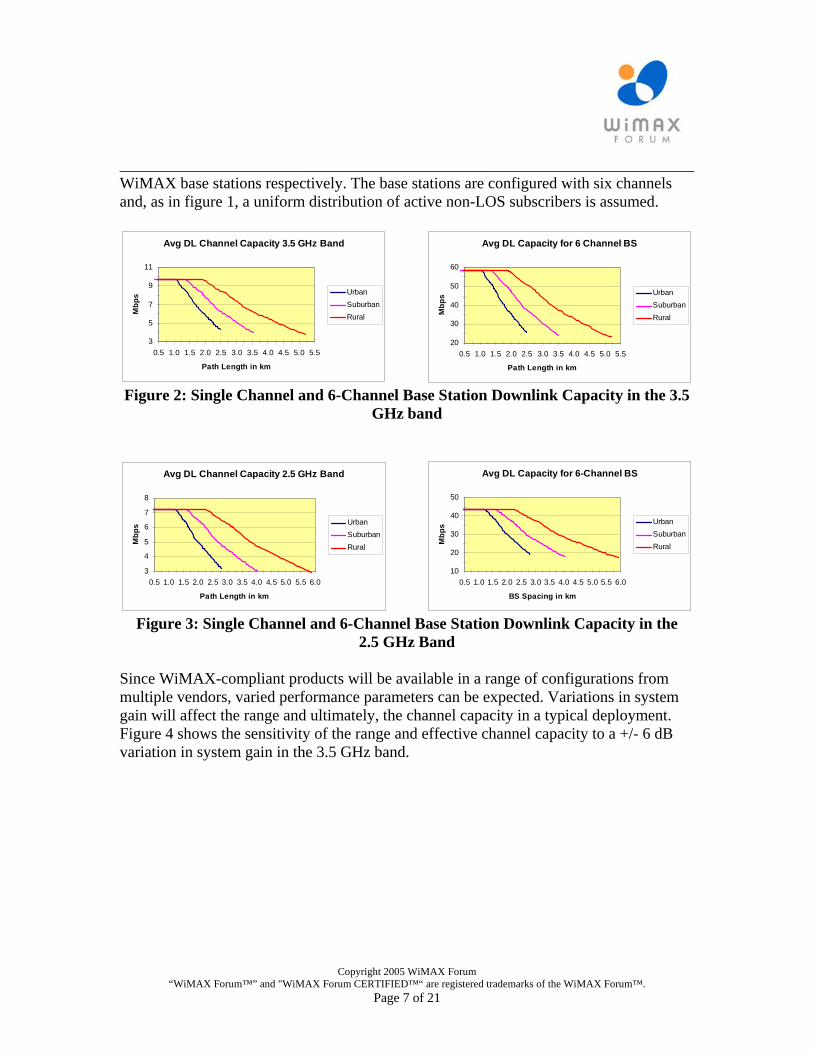
The graphs in figures 2 and 3 provide a more quantitative view of the average downlink channel capacity and the downlink base station capacity for 3.5 GHz and 2.5 GHz
________________________________________________________________________
Copyright 2005 WiMAX Forum “WiMAX Forum™” and "WiMAX Forum CERTIFIED™“ are registered trademarks of the WiMAX Forum™.
Page 7 of 21
WiMAX base stations respectively. The base stations are configured with six channels and, as in figure 1, a uniform distribution of active non-LOS subscribers is assumed.
Avg DL Channel Capacity 3.5 GHz Band
3
5
7
9
11
0.5 1.0 1.5 2.0 2.5 3.0 3.5 4.0 4.5 5.0 5.5
Path Length in km
Mbp
s UrbanSuburbanRural
Avg DL Capacity for 6 Channel BS
20
30
40
50
60
0.5 1.0 1.5 2.0 2.5 3.0 3.5 4.0 4.5 5.0 5.5
Path Length in km
Mbp
s UrbanSuburbanRural
Figure 2: Single Channel and 6-Channel Base Station Downlink Capacity in the 3.5 GHz band
Avg DL Channel Capacity 2.5 GHz Band
3
4
5
6
7
8
0.5 1.0 1.5 2.0 2.5 3.0 3.5 4.0 4.5 5.0 5.5 6.0
Path Length in km
Mbp
s UrbanSuburbanRural
Avg DL Capacity for 6-Channel BS
10
20
30
40
50
0.5 1.0 1.5 2.0 2.5 3.0 3.5 4.0 4.5 5.0 5.5 6.0
BS Spacing in km
Mbp
s UrbanSuburbanRural
Figure 3: Single Channel and 6-Channel Base Station Downlink Capacity in the 2.5 GHz Band
Since WiMAX-compliant products will be available in a range of configurations from multiple vendors, varied performance parameters can be expected. Variations in system gain will affect the range and ultimately, the channel capacity in a typical deployment. Figure 4 shows the sensitivity of the range and effective channel capacity to a +/- 6 dB variation in system gain in the 3.5 GHz band.

________________________________________________________________________
Copyright 2005 WiMAX Forum “WiMAX Forum™” and "WiMAX Forum CERTIFIED™“ are registered trademarks of the WiMAX Forum™.
Page 8 of 21
0.01.02.03.04.05.06.07.08.0
-8 -6 -4 -2 0 2 4 6 8
Relative System Gain in dB
Max
imum
Ran
ge in
km
RuralSuburbanUrban
5.0
6.0
7.0
8.0
9.0
10.0
-8 -6 -4 -2 0 2 4 6 8
Relative System Gain in dB
Avg
DL
Cha
nnel
Cap
acity
M
bps
Urban at 1.5 km
Suburban at 2 km
Rural at 3 km
Max ChannelCapacity
0.01.02.03.04.05.06.07.08.0
-8 -6 -4 -2 0 2 4 6 8
Relative System Gain in dB
Max
imum
Ran
ge in
km
RuralSuburbanUrban
5.0
6.0
7.0
8.0
9.0
10.0
-8 -6 -4 -2 0 2 4 6 8
Relative System Gain in dB
Avg
DL
Cha
nnel
Cap
acity
M
bps
Urban at 1.5 km
Suburban at 2 km
Rural at 3 km
Max ChannelCapacity
Figure 4: Range and Capacity Variation with System Gain in the 3.5 GHz Band
Matching Data Density Requirements to Base Station Capacity For capacity-limited deployment scenarios it is necessary to deploy base stations with a base station to base station spacing sufficient to match the expected density of end-customers. Data density is an excellent metric for matching base station capacity to market requirements. Demographic information, including population, households, and businesses per sq-km or per sq-mile, is readily available from a variety of sources for most metropolitan areas. With this information and the expected services to be offered along with the expected market penetration, data density requirements are easily calculated. This 6-step process is summarized in figure 5.
Figure 5: Determining Market Driven Capacity Requirements
With a fixed wireless network it is also important to project market requirements several years into the future and deploy base stations in accordance to what those projections dictate. Unlike mobile networks in which end-users are equipped with handsets having omni-directional antennas, fixed networks are deployed with a combination of indoor, self-installable CPEs and professionally mounted outdoor units with fixed narrow beam antennas at the subscriber sites carefully aligned for maximum signal strength. The need to insert additional base stations within the coverage area to increase network capacity will, in most cases, necessitate costly truck-rolls to re-align outdoor-mounted subscriber antennas.
1.Target Market
Segment
3.Services
to be Offered
4.Expected Market
Take Rate
5.Expected Number
of Customers
6.Required
Data Density
Mbps per sq-km
2.Area
Demo-graphics

________________________________________________________________________
Copyright 2005 WiMAX Forum “WiMAX Forum™” and "WiMAX Forum CERTIFIED™“ are registered trademarks of the WiMAX Forum™.
Page 9 of 21
The assumed market segments and services to be offered for the following examples are summarized in table 2 and these values are used to generate the graphs shown in figure 6.
Customer Type Service Description Overbooking Factor
Residential 384 kbps Average 20:1
Residential VOIP (20% of users) 128 kbps Average 4:1
SME Premium (25%) 1.0 Mbps CIR, 5 Mbps PIR 1:1 (CIR)
SME Regular (75%) 0.5 Mbps CIR, 1 Mbps PIR 1:1 (CIR)
Table 2: Metrics Used to Calculate Market Data Rate Requirements
0
1
2
3
0 200 400 600 800 1,000
HH per sq-km
Req
uire
d Da
ta D
ensi
ty
10%5%2%
SuburbanRural
0
1
2
3
4
0 25 50 75 100
SME per sq-km
Requ
ired
Dat
a De
nsity
5%2%1%
RuralSuburban
0
35
810
13
1518
20
0 100 200 300 400 500 600
SME per sq-km
Requ
ired
Dat
a De
nsity
5%2%1%
PenetrationRural
SuburbanUrban
0
5
10
15
20
25
30
0 2,000 4,000 6,000 8,000 10,000
HH per sq-km
Requ
ired
Dat
a De
nsity
10%5%2%
RuralSuburban
Urban
Penetration
Figure 6: Data Density Requirements Based on Demographics Expected Residential and/or SME Market Penetration
If other services or market segments are to be included such as video on demand, hot spot backhaul, nomadic services, etc, these would have to be included in the subscriber mix. Adding a hot spot backhaul link for example, is roughly comparable to an additional business customer. For nomadic applications an estimate can be made as to the number of users that are likely to be in the same geographical area during peak busy hour periods and the required data density increased accordingly. A more thorough analysis when

________________________________________________________________________
Copyright 2005 WiMAX Forum “WiMAX Forum™” and "WiMAX Forum CERTIFIED™“ are registered trademarks of the WiMAX Forum™.
Page 10 of 21
these additional services are added might also include an estimate of traffic patterns. For example, the peak period for nomadic customers might be during daytime business hours and the peak period for residential users early morning and evening hours. In some areas therefore, it may be quite possible to satisfy multiple market segments and applications without significantly increasing base station capacity. Table 3 represents a typical range of data density requirements for an urban, suburban, and rural environment for an average metropolitan area based on the service definitions in table 2.
Urban Suburban Rural
Residential Density Penetration
4,000 to 8,000 5 to 10%
800 to 1,500 5 to 10%
200 to 600 5 to 10%
SME Density Penetration
400 to 600 2 to 5%
50 to 100 2 to 5%
10 to 30 2 to 5%
Data Density Range 10 to 40 Mbps/km2 2 to 7 Mbps/km2 0.5 to 2 Mbps/km2
Table 3: Typical Data Rate Requirements for an Average Metropolitan Area
The resulting data density for various base station configurations in the 2.5 and 3.5 GHz bands as a function of base station spacing is shown in the following two figures. Figure 7 is for an urban area deployment and includes both a 4-channel and an 8-channel base station configuration. Figure 8 shows the data density for a suburban and rural area with a 4-channel and 3-channel base station configuration respectively. The 2.5 GHz TDD plot in the following figures assumes a 60/40 downlink to uplink traffic split. In practice, with time division duplexing, this split will often be adjusted to match average traffic conditions, which will generally favor the downlink direction. The vertical dotted lines in the graphs in figures 7 and 8 represents the base station spacing requirements necessary to match the maximum of the data density requirements shown in table 3. The value in having more spectrum is evident in figure 7 showing that with 8 channels the base station spacing is approximately 40% greater than a deployment with 4 channels to achieve the same 40 Mbps per sq-km data density. The spectrum requirements that are shown in the tables included in figures 7 and 8 assume a cell frequency re-use factor of 1. If propagation and deployment conditions were such that a high potential for co-channel interference, a more conservative cell re-use factor of 2 could be used. This would double the spectrum requirements from those

________________________________________________________________________
Copyright 2005 WiMAX Forum “WiMAX Forum™” and "WiMAX Forum CERTIFIED™“ are registered trademarks of the WiMAX Forum™.
Page 11 of 21
values shown in the tables. This could be a likely scenario when, in a capacity-limited case, the base station capacity is such that all subscribers are operating at 64QAM or 16QAM.
Band Duplex Channels Spectrum Required Terrain Condition
2.5 GHz TDD 4 20 MHz Urban NLOS3.5 GHz FDD 4 28 MHz Urban NLOS
BS DL Data Density
0
10
20
30
40
50
0.5 1.0 1.5 2.0
BS Spacing in km
Mbp
s/sq
-km 3.5 GHz FDD
2.5 GHz TDD
Band Duplex Channels Spectrum Required Terrain Condition
2.5 GHz TDD 8 40 MHz Urban NLOS
3.5 GHz FDD 8 56 MHz Urban NLOS
BS DL Data Density
0
10
20
30
40
50
1.0 1.5 2.0 2.5
BS Spacing in km
Mbp
s/sq
-km 3.5 GHz FDD
2.5 GHz TDD
Band Duplex Channels Spectrum Required Terrain Condition
2.5 GHz TDD 4 20 MHz Urban NLOS3.5 GHz FDD 4 28 MHz Urban NLOS
BS DL Data Density
0
10
20
30
40
50
0.5 1.0 1.5 2.0
BS Spacing in km
Mbp
s/sq
-km 3.5 GHz FDD
2.5 GHz TDD
Band Duplex Channels Spectrum Required Terrain Condition
2.5 GHz TDD 8 40 MHz Urban NLOS
3.5 GHz FDD 8 56 MHz Urban NLOS
BS DL Data Density
0
10
20
30
40
50
1.0 1.5 2.0 2.5
BS Spacing in km
Mbp
s/sq
-km 3.5 GHz FDD
2.5 GHz TDD
Figure 7: Average Base Station DL Data Density for 4 and 8 Channel Base Station Configurations in an Urban Environment
Band Duplex Channels Spectrum Required Terrain Condition Band Duplex Channels Spectrum Required Terrain Condition
2.5 GHz TDD 4 20 MHz Suburban NLOS 2.5 GHz TDD 3 15 MHz Rural NLOS3.5 GHz FDD 4 28 MHz Suburban NLOS 3.5 GHz FDD 3 21 MHz Rural NLOS
BS DL Data Density
0
2
4
6
8
10
2.0 3.0 4.0 5.0
BS Spacing in km
Mbp
s/sq
-km 2.5 GHz TDD
3.5 GHz FDD
BS DL Data Density
0.00.51.01.52.02.53.0
3.5 4.5 5.5 6.5 7.5 8.5 9.5
BS Spacing in km
Mbp
s/sq
-km 2.5 GHz TDD
3.5 GHz FDD
Figure 8: Average Base Station DL Data Density in a Suburban and Rural
Environment Assuming 4 and 3 Channel Base Station Configurations Respectively Deployment Examples with Outdoor CPEs In this section we will look at some hypothetical WiMAX base station deployment examples in both bands assuming all outdoor CPEs in each of the three demographic areas; urban, suburban, and rural. The demographics and anticipated number of residential and SME customers for these examples are summarized in table 4 along with the data density that will be required to serve the anticipated number of end-customers or

________________________________________________________________________
Copyright 2005 WiMAX Forum “WiMAX Forum™” and "WiMAX Forum CERTIFIED™“ are registered trademarks of the WiMAX Forum™.
Page 12 of 21
subscribers. A cell frequency re-use factor of 1 is assumed for all of the following examples to determine the amount of spectrum required.
Urban Suburban Rural
Geographical Area to be Covered 60 sq-km 120 sq-km 200 sq-km
Expected Number of Residential Customers 30,000 20,000 5,000
Expected Number of SME Customers 1,500 500 150
Required Data Density 29 Mbps/km2 5.9 Mbps/km2 1.0 Mbps/km2
Table 4: Demographics for Deployment Examples
The base station infrastructure cost per customer is a good metric for providing a quantitative comparison between the various deployment options used to achieve the required data density. The base station capital expense (CAPEX) has two major components, a “fixed” component and a “variable” component. The fixed portion includes all the elements required to acquire and prepare the base station prior to the installation of any WiMAX equipment. This includes site acquisition, civil works, backhaul interface equipment, antenna masts, etc. There can be a great deal of variability in the fixed costs depending on the region and on the installation. The costs can be quite low when WiMAX equipment is installed on existing towers located at or near an existing fiber node for a backhaul connection and quite high in other cases. For these examples, the fixed base station CAPEX component is assumed to range between $15K and $75K per base station. The variable CAPEX component is the WiMAX point-to-multipoint equipment which is closely related to the base station capacity. The WiMAX equipment cost will vary from vendor to vendor and will vary in accordance with specific equipment features. This cost is also expected to decrease over time as the technology matures and volumes grow. In the following examples the variable base station cost is assumed to range between $5K and $10K per channel to cover equipment and installation cost. Urban Environment Example: Figure 9 summarizes the results for an urban area deployment showing the number of WiMAX base stations and channels per base station required to meet the data density requirements in each of the two frequency bands. As one would expect, there is value in having more spectrum available since, in general, due to the relatively high base station fixed costs it is more economical to deploy fewer high capacity base stations as opposed to a larger number of low capacity base stations. If the added spectrum has to be acquired through an auction process however, some of this

________________________________________________________________________
Copyright 2005 WiMAX Forum “WiMAX Forum™” and "WiMAX Forum CERTIFIED™“ are registered trademarks of the WiMAX Forum™.
Page 13 of 21
infrastructure cost benefit will be offset by higher spectrum license fees and should be taken into account for a more accurate cost comparison.
WiMAX Base Station Equipment 5.0$ to 10.0$ per ChannelBase Station Civil Works, Backhaul, etc. 15.0$ to 75.0$ per Base StationCoverage Area = 60 sq-km Data Density = 29 Mbps/sq-km
2.5 GHz Urban Deployment
$-
$50
$100
$150
$200
$250
$300
40 30 20 15
8 6 4 3
31 42 65 93
Bas
e S
tatio
n C
AP
EX/S
ubsc
riber
High Fxd, Low VarAvg Fxd, Avg VarLow Fxd, High Var
# of Base Stations
Channels/BS
Required Spectrum MHz
WiMAX Base Station Equipment 5.0$ to 10.0$ per ChannelBase Station Civil Works, Backhaul, etc. 15.0$ to 75.0$ per Base StationCoverage Area = 60 sq-km Data Density = 29 Mbps/sq-km
3.5 GHz Urban Deployment
$-$20$40$60$80
$100$120$140$160$180$200
56 42 28 21
8 6 4 3
26 31 48 63
Bas
e S
tatio
n C
AP
EX/S
ubsc
riber
High Fxd, Low VarAvg Fxd, Avg VarLow Fxd, High Var
# of Base Stations
Channels/BS
Required Spectrum MHz
WiMAX Base Station Equipment 5.0$ to 10.0$ per ChannelBase Station Civil Works, Backhaul, etc. 15.0$ to 75.0$ per Base StationCoverage Area = 60 sq-km Data Density = 29 Mbps/sq-km
2.5 GHz Urban Deployment
$-
$50
$100
$150
$200
$250
$300
40 30 20 15
8 6 4 3
31 42 65 93
Bas
e S
tatio
n C
AP
EX/S
ubsc
riber
High Fxd, Low VarAvg Fxd, Avg VarLow Fxd, High Var
# of Base Stations
Channels/BS
Required Spectrum MHz
WiMAX Base Station Equipment 5.0$ to 10.0$ per ChannelBase Station Civil Works, Backhaul, etc. 15.0$ to 75.0$ per Base StationCoverage Area = 60 sq-km Data Density = 29 Mbps/sq-km
3.5 GHz Urban Deployment
$-$20$40$60$80
$100$120$140$160$180$200
56 42 28 21
8 6 4 3
26 31 48 63
Bas
e S
tatio
n C
AP
EX/S
ubsc
riber
High Fxd, Low VarAvg Fxd, Avg VarLow Fxd, High Var
# of Base Stations
Channels/BS
Required Spectrum MHz
Figure 9: Urban Deployment Examples
Suburban Environment Examples: The suburban area examples are summarized in figure 10 and show the same general trends as in the urban examples. The CAPEX per subscriber is lower than the urban case due to the relative mix of residential and business customers. In both the urban and suburban examples, when the base station fixed costs are low, there is little or no cost penalty for deploying a greater number of base stations.
WiMAX Base Station Equipment 5.0$ to 10.0$ per ChannelBase Station Civil Works, Backhaul, etc. 15.0$ to 75.0$ per Base StationCoverage Area = 120 sq-km Data Density = 5.9 Mbps/sq-km
2.5 GHz Suburban Deployment
$-
$20
$40
$60
$80
$100
$120
$140
$160
45 30 20 15
9 6 4 3
14 17 26 33
Bas
e S
tatio
n C
AP
EX
/Sub
scrib
er
High Fxd, Low VarAvg Fxd, Avg VarLow Fxd, High Var
# of Base Stations
Channels/BS
Required Spectrum MHz
WiMAX Base Station Equipment 5.0$ to 10.0$ per ChannelBase Station Civil Works, Backhaul, etc. 15.0$ to 75.0$ per Base StationCoverage Area = 120 sq-km Data Density = 5.9 Mbps/sq-km
3.5 GHz Suburban Deployment
$-
$20
$40
$60
$80
$100
$120
$140
$160
56 42 28 21
8 6 4 3
11 14 20 25
Bas
e S
tatio
n C
AP
EX
/Sub
scrib
er
High Fxd, Low VarAvg Fxd, Avg VarLow Fxd, High Var
# of Base Stations
Channels/BS
Required Spectrum MHz
WiMAX Base Station Equipment 5.0$ to 10.0$ per ChannelBase Station Civil Works, Backhaul, etc. 15.0$ to 75.0$ per Base StationCoverage Area = 120 sq-km Data Density = 5.9 Mbps/sq-km
2.5 GHz Suburban Deployment
$-
$20
$40
$60
$80
$100
$120
$140
$160
45 30 20 15
9 6 4 3
14 17 26 33
Bas
e S
tatio
n C
AP
EX
/Sub
scrib
er
High Fxd, Low VarAvg Fxd, Avg VarLow Fxd, High Var
# of Base Stations
Channels/BS
Required Spectrum MHz
WiMAX Base Station Equipment 5.0$ to 10.0$ per ChannelBase Station Civil Works, Backhaul, etc. 15.0$ to 75.0$ per Base StationCoverage Area = 120 sq-km Data Density = 5.9 Mbps/sq-km
3.5 GHz Suburban Deployment
$-
$20
$40
$60
$80
$100
$120
$140
$160
56 42 28 21
8 6 4 3
11 14 20 25
Bas
e S
tatio
n C
AP
EX
/Sub
scrib
er
High Fxd, Low VarAvg Fxd, Avg VarLow Fxd, High Var
# of Base Stations
Channels/BS
Required Spectrum MHz
Figure 10: Suburban Deployment Examples
Rural Environment Examples: Figure 11 includes a summary of the deployment alternatives analyzed for a typical rural area deployment. As expected, with fewer

________________________________________________________________________
Copyright 2005 WiMAX Forum “WiMAX Forum™” and "WiMAX Forum CERTIFIED™“ are registered trademarks of the WiMAX Forum™.
Page 14 of 21
customers per base station, the CAPEX per subscriber is considerable higher than either the suburban or urban area examples.
WiMAX Base Station Equipment 5.0$ to 10.0$ per ChannelBase Station Civil Works, Backhaul, etc. 15.0$ to 75.0$ per Base StationCoverage Area = 200 sq-km Data Density = 1.0 Mbps/sq-km
2.5 GHz Rural Deployment
$-
$20
$40
$60
$80
$100
$120
$140
$160
$180
$200
30 20 15
6 4 3
7 9 11
Bas
e S
tatio
n C
AP
EX/
Sub
scrib
er
High Fxd, Low VarAvg Fxd, Avg VarLow Fxd, High Var
Required Spectrum MHz
Channels/BS
# of Base Stations
WiMAX Base Station Equipment 5.0$ to 10.0$ per ChannelBase Station Civil Works, Backhaul, etc. 15.0$ to 75.0$ per Base StationCoverage Area = 200 sq-km Data Density = 1.0 Mbps/sq-km
3.5 GHz Rural Deployment
$-
$20
$40
$60
$80
$100
$120
$140
$160
$180
42 28 21
6 4 3
6 8 9
Bas
e S
tatio
n C
AP
EX
/Sub
scrib
er
High Fxd, Low VarAvg Fxd, Avg VarLow Fxd, High Var
Required Spectrum MHz
Channels/BS
# of Base Stations
WiMAX Base Station Equipment 5.0$ to 10.0$ per ChannelBase Station Civil Works, Backhaul, etc. 15.0$ to 75.0$ per Base StationCoverage Area = 200 sq-km Data Density = 1.0 Mbps/sq-km
2.5 GHz Rural Deployment
$-
$20
$40
$60
$80
$100
$120
$140
$160
$180
$200
30 20 15
6 4 3
7 9 11
Bas
e S
tatio
n C
AP
EX/
Sub
scrib
er
High Fxd, Low VarAvg Fxd, Avg VarLow Fxd, High Var
Required Spectrum MHz
Channels/BS
# of Base Stations
WiMAX Base Station Equipment 5.0$ to 10.0$ per ChannelBase Station Civil Works, Backhaul, etc. 15.0$ to 75.0$ per Base StationCoverage Area = 200 sq-km Data Density = 1.0 Mbps/sq-km
3.5 GHz Rural Deployment
$-
$20
$40
$60
$80
$100
$120
$140
$160
$180
42 28 21
6 4 3
6 8 9
Bas
e S
tatio
n C
AP
EX
/Sub
scrib
er
High Fxd, Low VarAvg Fxd, Avg VarLow Fxd, High Var
Required Spectrum MHz
Channels/BS
# of Base Stations
Figure 11: Rural Deployment Example Deployment Examples with Self-Installable Indoor CPEs The long term goal of most operators for fixed wireless access is to deploy with all indoor, self-installable CPEs. The ability to self-install eliminates the need for a truck-roll and the fully integrated indoor units will be less expensive than the hardened outdoor CPE units. The lower CPE cost also increases the likelihood that customers will purchase their own CPE. This not only further reduces CAPEX for the operator but has a tendency to reduce churn as well. To gain a more quantitative understanding of the benefits however, the capacity and range impact of indoor CPEs on the base station infrastructure cost must also be taken into account. In a 3.5 GHz range-limited case approximately 7% of users can be supported with indoor CPEs in a rural environment as shown in figure 12. This percentage is approximately 10% and 12% in suburban and urban propagation environments respectively. Since approximately 60% of the indoor CPEs will be operating at a lower modulation efficiency than 64QAM, the effective channel capacity at maximum range is reduced from 3.8 Mbps to 3.4 Mbps. These comparisons are summarized for all three propagation environments in table 5.

________________________________________________________________________
Copyright 2005 WiMAX Forum “WiMAX Forum™” and "WiMAX Forum CERTIFIED™“ are registered trademarks of the WiMAX Forum™.
Page 15 of 21
BPSK
64QAM
16QAM
QPSK
NLOS Range for Rural Deployment, outdoor CPEs, 3.5 GHz FDD
~8%
~18% ~38% ~29%
Effective channel capacity at
maximum range = 3.4 Mbps
Indoor CPEs
1.4 km, Max range for indoor CPEs in rural environment
~7%
5.2 km 2.0 km 3.0 km 4.4 km
Figure 12: Distribution with Indoor CPEs for a 3.5 GHz Rural Area Deployment
Urban Suburban Rural Frequency Band 3.5 GHz Maximum non-LOS Range 2.5 km 3.5 km 5.2 km % Indoor Self-Installable CPEs ~12% ~10% ~7% Channel Capacity at Maximum Range 3.6 Mbps 3.4 Mbps 3.4 Mbps
Channel Capacity at Maximum Range with 100% Outdoor CPEs 4.3 Mbps 4.0 Mbps 3.8 Mbps
Channel Capacity Reduction 16% 14% 11%
Table 5: Impact of Indoor CPEs on Channel Capacity
The left-hand graph in figure 13 provides a more detailed view of the downlink channel capacity as a function of range for all three environments. The right-hand graph shows an urban area comparison for a single base station channel comprised of both indoor and outdoor CPEs compared with a channel comprised entirely of outdoor CPEs.

________________________________________________________________________
Copyright 2005 WiMAX Forum “WiMAX Forum™” and "WiMAX Forum CERTIFIED™“ are registered trademarks of the WiMAX Forum™.
Page 16 of 21
Avg DL Channel Capacity
3456789
10
0.0 1.0 2.0 3.0 4.0 5.0
Path Length in km
Mbp
s UrbanSuburbanRural
Avg DL Channel Capacity-Urban
3456789
10
0.2 0.6 1.0 1.4 1.8 2.2 2.6
Path Length in km
Mbp
s All Outdoor CPEsWith Indoor CPEs
Avg DL Channel Capacity
3456789
10
0.0 1.0 2.0 3.0 4.0 5.0
Path Length in km
Mbp
s UrbanSuburbanRural
Avg DL Channel Capacity-Urban
3456789
10
0.2 0.6 1.0 1.4 1.8 2.2 2.6
Path Length in km
Mbp
s All Outdoor CPEsWith Indoor CPEs
Figure 13: Downlink Base Station Channel Capacity with Indoor CPEs in the 3.5 GHz Band
Table 6 provides a summary of the demographics that will be used in the following examples to better quantify the trade-offs and the impact of deploying with indoor CPEs in the 3.5 GHz band. The coverage areas and anticipated residential customers are identical to those used in the previous examples. The SME customers, who will generally be deployed with outdoor CPEs, are ignored for this case to simplify the analysis.
Urban Suburban Rural
Frequency Band 3.5 GHz Geographical Area to be Covered 60 sq-km 120 sq-km 200 sq-km
Expected Number of Residential Customers 30,000 20,000 5,000
Required Data Density 10 Mbps/km2 3.2 Mbps/km2 0.5 Mbps/km2
Table 6: Demographics for Deployment with Indoor CPEs
Figure 14 shows the data density plots for deployments with all outdoor CPEs as compared to a mixed deployment with both indoor and outdoor CPEs. The vertical dashed lines show the base station spacing comparisons between the two approaches to match the data density requirements indicated in table 6.

________________________________________________________________________
Copyright 2005 WiMAX Forum “WiMAX Forum™” and "WiMAX Forum CERTIFIED™“ are registered trademarks of the WiMAX Forum™.
Page 17 of 21
6-Channel BS Data Density-Urban
0
10
20
30
40
1.0 1.5 2.0 2.5 3.0
BS Spacing in km
Mbp
s/sq
-km
All Outdoor CPEsWith Indoor CPEs
4-Channel BS Data Density-Suburban
0
2
4
6
8
10
1.5 2.0 2.5 3.0 3.5
BS Spacing in km
Mbp
s/sq
-km
All Outdoor CPEsWith Indoor CPEs
3-Channel BS Data Density-Rural
0.0
0.5
1.0
1.5
5.0 5.5 6.0 6.5 7.0
BS Spacing in km
Mbp
s/sq
-km
All Outdoor CPEsWith Indoor CPEs
Figure 14: Downlink Base Station Data Density with Indoor CPEs in the 3.5 GHz Band
The trade-offs, using the same metric that was used in the previous examples, are summarized in figure 15 for the three different deployment scenarios. For each deployment environment, case 1 assumes all outdoor CPEs. Case 2 is for a mixed deployment of indoor and outdoor CPEs in which the base station spacing is adjusted to regain the capacity necessary to achieve the desired data density for that particular environment and case 4 shows the base station infrastructure required to support 100% indoor CPEs for each environment. Case 3 is for an intermediate level of indoor CPE support. In both the urban and suburban examples the added base station infrastructure cost is more than off-set by the expected $200 to $300 per CPE savings that will be realized when taking into account both equipment cost and installation expense for outdoor CPE terminals. An added benefit in cases 3 and 4 is the resulting data density which is higher than the minimum required for the anticipated market. This excess base station capacity can be used to offer other enhanced services or to address additional market segments. In the rural area deployment, with a 3-channel base station the fixed base station CAPEX plays a larger role. If the base station fixed cost is at the low end of the range, a deployment to support all indoor CPEs can still be cost-effective, particularly in view of the added data density that can potentially be used to generate additional revenue streams. If base station fixed costs are at the higher end of the range however, it may be difficult

________________________________________________________________________
Copyright 2005 WiMAX Forum “WiMAX Forum™” and "WiMAX Forum CERTIFIED™“ are registered trademarks of the WiMAX Forum™.
Page 18 of 21
to economically justify a base station infrastructure to support more than 40-50% indoor self-installable CPEs.
WiMAX Base Station Equipment 5.0$ to 10.0$ per ChannelBase Station Civil Works, Backhaul, etc. 15.0$ to 75.0$ per Base Station
20,000 Residential customers over a Suburban coverage area of 120 sq-km
3.5 GHz Suburban Deployment
$-$20$40$60$80
$100$120$140$160$180$200
Case 1 Case 2 Case 3 Case 4
0% 42% 70% 100%
4 4 4 4
13 16 26 37
3.2 3.2 4.9 4.9
Base
Sta
tion
CAP
EX/
Subs
crib
er
High Fxd, Low VarAvg Fxd, Avg VarLow Fxd, High Var
# of Base Stations
Channels/BS
% Indoor CPEs
Data Density
WiMAX Base Station Equipment 5.0$ to 10.0$ per ChannelBase Station Civil Works, Backhaul, etc. 15.0$ to 75.0$ per Base Station
5,000 Residential customers over a Rural coverage area of 200 sq-km
3.5 GHz Rural Deployment
$-$100$200$300$400$500$600$700$800
Case 1 Case 2 Case 3 Case 4
0% 16% 50% 100%
3 3 3 3
6 7 21 40
0.5 0.5 2.0 2.3
Base
Sta
tion
CAP
EX/
Subs
crib
er
High Fxd, Low VarAvg Fxd, Avg VarLow Fxd, High Var
# of Base Stations
Channels/BS
% Indoor CPEs
Data Density
WiMAX Base Station Equipment 5.0$ to 10.0$ per ChannelBase Station Civil Works, Backhaul, etc. 15.0$ to 75.0$ per Base Station
30,000 Residential customers over an Urban coverage area of 60 sq-km
3.5 GHz Urban Deployment
$-$20$40$60$80
$100$120
Case 1 Case 2 Case 3 Case 4
0% 55% 75% 100%
6 6 6 6
12 17 23 30
10.0 10.0 12.5 12.6
Bas
e St
atio
n C
AP
EX/
Sub
scrib
er
High Fxd, Low VarAvg Fxd, Avg VarLow Fxd, High Var
# of Base Stations
Channels/BS
% Indoor CPEs
Data Density
WiMAX Base Station Equipment 5.0$ to 10.0$ per ChannelBase Station Civil Works, Backhaul, etc. 15.0$ to 75.0$ per Base Station
30,000 Residential customers over an Urban coverage area of 60 sq-km
3.5 GHz Urban Deployment
$-$20$40$60$80
$100$120
Case 1 Case 2 Case 3 Case 4
0% 55% 75% 100%
6 6 6 6
12 17 23 30
10.0 10.0 12.5 12.6
Bas
e St
atio
n C
AP
EX/
Sub
scrib
er
High Fxd, Low VarAvg Fxd, Avg VarLow Fxd, High Var
# of Base Stations
Channels/BS
% Indoor CPEs
Data Density
Figure 15: 3.5 GHz Deployment Scenarios with Indoor CPEs Deployment for Coverage All of the deployment examples to this point have been capacity-limited with the desired base station capacity determined by projected market requirements based on services offered, demographics and projected market penetration. Another deployment scenario is to deploy the minimum number of base stations necessary to get ubiquitous coverage over a particular area at the outset and only add additional capacity as the need arises to serve a growing number of customers. The added capacity can be achieved by adding base station channels, to the already deployed base stations assuming sufficient spectrum is available, or by inserting additional base stations if the spectrum is not available.

________________________________________________________________________
Copyright 2005 WiMAX Forum “WiMAX Forum™” and "WiMAX Forum CERTIFIED™“ are registered trademarks of the WiMAX Forum™.
Page 19 of 21
Deploying for coverage without regard for projected capacity requirements is a viable deployment strategy where the market requirements are uncertain and hence difficult to accurately quantify. For example, this would certainly be a reasonable deployment approach for an operator wanting to provide ubiquitous outdoor internet access for nomadic customers over a wide geographical area. When the initial network is operational the operator will be in a better position to assess and predict traffic patterns, customer acceptance, and market penetration expectations. For this deployment example an urban environment of 60 sq-km is assumed with the goal of providing a minimum of 128 kbps to each nomadic customer that is connected to the network at any given time. It is also assumed that the connected customers are uniformly distributed over the coverage area. The 60 sq-km urban area can be covered by three base stations in the 2.5 GHz band. In figure 16, the metric used for comparisons in this deployment example is the base station CAPEX per Mbps per sq-km. Cases 1, 2, and 3 in figure 16 show the result of adding channels to the three base stations whereas, case 4 assumes that additional base stations are inserted to ultimately double the capacity thus growing the number of simultaneously supportable nomadic customers from 360 to 720. As expected, with a non-zero fixed cost per base station the more economical approach is to add channels rather than base stations. That is, of course, if the additional spectrum required can be acquired at a reasonable cost.
WiMAX Base Station Equipment 5.0$ to 10.0$ per ChannelBase Station Civil Works, Backhaul, etc. 15.0$ to 75.0$ per Base StationProvides ubiquitous coverage for nomadic customers over an area of 60 sq-km
2.5 GHz Urban Deployment
$-$20$40$60$80
$100$120
Case 1 Case 2 Case 3 Case 4
15 20 30 15
3 4 6 3
3 3 3 6
0.7 1.0 1.5 1.5
360 480 720 720
Bas
e S
tatio
n C
AP
EX
/Mbp
s/sq
-km
High Fxd, Low VarAvg Fxd, Avg VarLow Fxd, High Var
# of Base Stations
Channels/BS
Required Spectrum MHz
Nomadic Customers
Data Density Mbps/sqkm
Figure 16: Range Limited Urban Deployment
________________________________________________________________________
Copyright 2005 WiMAX Forum “WiMAX Forum™” and "WiMAX Forum CERTIFIED™“ are registered trademarks of the WiMAX Forum™.
Page 20 of 21
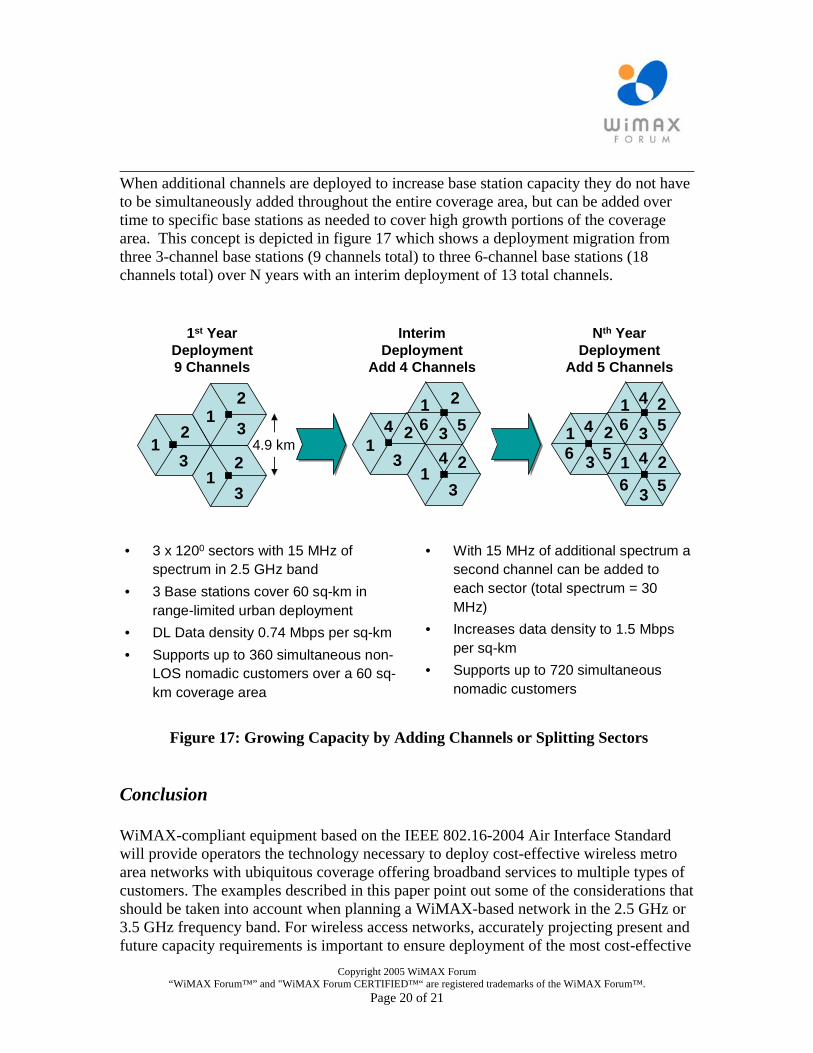
When additional channels are deployed to increase base station capacity they do not have to be simultaneously added throughout the entire coverage area, but can be added over time to specific base stations as needed to cover high growth portions of the coverage area. This concept is depicted in figure 17 which shows a deployment migration from three 3-channel base stations (9 channels total) to three 6-channel base stations (18 channels total) over N years with an interim deployment of 13 total channels.
1st Year Deployment9 Channels
Nth Year Deployment
Add 5 Channels
• 3 x 1200 sectors with 15 MHz of spectrum in 2.5 GHz band
• 3 Base stations cover 60 sq-km in range-limited urban deployment
• DL Data density 0.74 Mbps per sq-km• Supports up to 360 simultaneous non-
LOS nomadic customers over a 60 sq-km coverage area
4.9 km
• With 15 MHz of additional spectrum a second channel can be added to each sector (total spectrum = 30 MHz)
• Increases data density to 1.5 Mbps per sq-km
• Supports up to 720 simultaneous nomadic customers
12
3
13
2
3
21
1 2
3
456
1 4562
34
562
3
11
23
41
562
34 2
31
Interim Deployment
Add 4 Channels
Figure 17: Growing Capacity by Adding Channels or Splitting Sectors
Conclusion WiMAX-compliant equipment based on the IEEE 802.16-2004 Air Interface Standard will provide operators the technology necessary to deploy cost-effective wireless metro area networks with ubiquitous coverage offering broadband services to multiple types of customers. The examples described in this paper point out some of the considerations that should be taken into account when planning a WiMAX-based network in the 2.5 GHz or 3.5 GHz frequency band. For wireless access networks, accurately projecting present and future capacity requirements is important to ensure deployment of the most cost-effective

________________________________________________________________________
Copyright 2005 WiMAX Forum “WiMAX Forum™” and "WiMAX Forum CERTIFIED™“ are registered trademarks of the WiMAX Forum™.
Page 21 of 21
base station infrastructure, particularly in areas where fixed base station costs are expected to be high. The minimum amount of spectrum for a cost-effective deployment varies with the demographics, the targeted market segment, the services being offered, and the cell frequency re-use factor. It is clear, from the examples analyzed in this paper, that from an economic point of view, having more spectrum is generally better than having less spectrum.