wind design for low-profile solar photovoltaic arrays on ... · solar arrays in relation to seismic...
TRANSCRIPT
STRUCTURAL ENGINEERS ASSOCIATION OF CALIFORNIA
WIND DESIGN FOR LOW-PROFILE SOLAR PHOTOVOLTAIC ARRAYS ON FLAT ROOFS
Prepared by SEAOC Solar Photovoltaic Systems Committee Report SEAOC PV2-2012 August 2012

STRUCTURAL ENGINEERS ASSOCIATION OF CALIFORNIA
Wind Design for Low-Profile Solar Photovoltaic Arrays on Flat Roofs Report SEAOC PV2-2012
August 2012 Page ii
Board of Directors, 2011-2012
Douglas Hohbach, President*Jim Amundson, President Elect* Janah Risha, Secretary Bradley Lowe, Treasurer* Stephen Pelham, Past President* Don Schinske, Executive Director*
*Executive Committee
Kelly Cobeen, Director Jeff Crosier, Director* Diane Gould, Director Grace Kang, Director Zubaid Karim, Director Joe LaBrie, Director Peter Lee, Director Jeffrey Marchant, Director Michael West, Director
Disclaimer
Documents produced by the Structural Engineers Association of California (SEAOC) are published as part of our association’s educational program. While the information presented in the document is believed to be correct, neither SEAOC nor its Board, committees, writers, editors, or individuals who have contributed to this document make any warranty, expressed or implied, or assume any legal liability or responsibility for the use, application of, and/or reference to opinions, findings, conclusions, or recommendations expressed herein. The material presented in this document should not be used or relied upon for any specific application without competent examination and verification of its accuracy, suitability, and applicability by qualified professionals. Users of information from this document assume all liability arising from such use.
Structural Engineers Association of California © 2012 SEAOC All rights reserved. This document or any part thereof may not be reproduced in any form without the written permission of the Structural Engineers Association of California.
STRUCTURAL ENGINEERS ASSOCIATION OF CALIFORNIA 1020 12th Street, Suite 303
Sacramento, CA 95814 Phone: (916) 447-1198
Fax: (916) 444-1501 Email: [email protected] http://www.seaoc.org

STRUCTURAL ENGINEERS ASSOCIATION OF CALIFORNIA
Wind Design for Low-Profile Solar Photovoltaic Arrays on Flat Roofs Report SEAOC PV2-2012
August 2012 Page iii
Wind Design for Low-Profile Solar Photovoltaic Arrays on Flat Roofs
These guidelines were written by the SEAOC Solar Photovoltaic Systems Committee, a subcommittee of the SEAOC Wind Committee.
SEAOC Solar Photovoltaic Systems Committee
Voting Members Ron LaPlante (Chair) DSA Joe Maffei (Vice Chair) Rutherford & Chekene Joe Cain, SolarCity James S. Lai, S.E. Ken Luttrell, CYS Structural Engineering Shane Noel, KPFF Consulting Engineers, Inc. G.R. Searer, Wiss, Janney, Elstner Associates, Inc. Norm Scheel, Norman Scheel Structural Engineer Mason Walters, Forell/Elsesser Engineers Rob Ward, SunLink
Associate MembersDavid Banks, Cermak Peterka, and Peterson Steve Bauer, Unirac Geoff Bomba, Forell/Elsesser Engineers Pete Fischer, DSA Ajay Friesen, SunPower Mark Gies, PanelClaw Rick Hanson, SolarCity John Harvey, Buehler & Buehler Gregory Kopp, University of Western Ontario Jonathan Lam, Los Angeles County Coleen O’Brien, BEW Engineers Tim Reinhold, Institute for Business & Home Safety Adam Saidel, Unirac Don Scott, PCS Structural Solutions Karl Telleen, Rutherford & Chekene Philip Yin, City of Long Beach Osama Younan, City of Los Angeles
SEAOC Wind Committee 2011-2012
Ken Luttrell (Chair), CYS Structural EngineeringStephen Kerr, Josephson-Werdowatz & Associates, Inc. Scott Markle, Los Angeles World Airports Brent Nuttall, Nabih Youssef & Associates James S. Lai, S.E.
Dick Phillips, S.E.James Sadler, Jasco Pacific Inc Norm Scheel, Norman Scheel Structural Engineer G.R. Searer, Wiss, Janney, Elstner Associates, Inc.

STRUCTURAL ENGINEERS ASSOCIATION OF CALIFORNIA
Wind Design for Low-Profile Solar Photovoltaic Arrays on Flat Roofs Report SEAOC PV2-2012
August 2012 Page iv
Preface and Acknowledgements This document was developed by the Structural Engineering Association of California’s (SEAOC) Solar Photovoltaic Systems Committee (PV committee), a subcommittee of the SEAOC Wind Committee. The PV committee was formed in September 2011 on the initiative of building code officials, structural engineers, and solar industry representatives. The principal goal in forming the committee was to address the lack of clarity and specific requirements in applying structural building code provisions to solar photovoltaic systems. The committee began its work with discussions that led to identi-fying (a) the types PV support systems that were most prevalent and most in need of clarification regarding their structural design, and (b) the key structural engineering issues in the design of such arrays.
The structural engineering issues identified in these dis-cussions included:
The question of acceptability of unattached rooftop solar arrays in relation to seismic design requirements and objectives;
The question of applicability of component and cladding wind loads to many solar array types;
Recommendations and necessary requirements for wind-tunnel testing of solar arrays (testing which is typically done for a type of PV support system rather than a specific site location and installation);
The question of applicability of code minimum wind loads to solar arrays designed based on wind-tunnel test results; and
The potential development of code wind loads specifically applicable to solar arrays.
While there is a growth of solar installations of several types, including residential and ground-mounted installations, many of the engineering issues identified were most relevant to low-profile photovoltaic installations on commercial flat roofs. The committee chose to direct its initial efforts on such systems, considering both seismic and wind structural design issues. The work of the committee then focused on the production of two reports: Report PV1-2012, addressing seismic-structural design, and Report PV2-2012, addressing wind design. Joe Maffei directed the development of the PV1 report and Ron LaPlante directed the development of the PV2 report. It is our hope and that of SEAOC that these documents
provide valuable information to ASCE-7 and other standards writing groups.
The PV committee intends to continue its work on the timely issues related to the structural design of solar installations. Future activities may include updates to the PV1 and PV2 reports and new efforts addressing quality assurance and roof live load issues. Comments on the documents can be sent by e-mail to [email protected] and [email protected].
We would like to express our appreciation to the SEAOC Board, the SEAOC SSC committee, chaired by Kevin Moore, and the SEAOC Wind Committee, chaired by Ken Lutrell, who oversaw and supported the work of the PV Committee. In particular for Report PV2, we would like to thank Dr. David Banks from Cermak Peterka Petersen (CPP) and Dr. Gregory Kopp from The University of Western Ontario for their invaluable contribution on the development of the wind loads figure from wind tunnel test data. Also, thanks to David Carpenter and David Banks from CPP for use of CPP figures and write-up on the wind flow characteristics on flat roofs. Special thanks to Karl Telleen from Rutherford & Chekene and Adam Saidel from Unirac for their efforts in developing the example problem in the Appendix and to Paul Rooney from DSA for drawing Figure 29.9-1 countless times.
We also are grateful to the SEAOC Seismology Committee, chaired by Geoff Bomba, for their thoughtful review of the PV1 report; their comments improved the document. Finally, we express our gratitude and appreciation to the members of the PV Committee, who dedicated their time—in more than twenty online meetings and in reviews of numerous drafts—to shaping the two reports that are now completed. The committee members brought diverse backgrounds and perspectives to the discussion, and the resulting works reflect a range of knowledge and understanding that is much greater than could come from any one individual. In directing this effort, we deeply grateful for all that we have learned, and for the good will and dedication of so many contributors who came together to produce these documents.
Sincerely, Ron LaPlante and Joe Maffei August 2012

STRUCTURAL ENGINEERS ASSOCIATION OF CALIFORNIA
Wind Design for Low-Profile Solar Photovoltaic Arrays on Flat Roofs August 2012 Report SEAOC PV2-2012 Page 5
Table of Contents Section page Disclaimer 2 Committee Members 3 Preface and Acknowledgements 4 1. Abstract 6 2. Introduction 6 3. Prescriptive GCrn Values for Solar Arrays Mounted on Flat Roofs 6
3.1. Proposed Code Changes 6 3.2. Commentary 10
3.2.1. Procedure to Using Wind Load Figure 10 3.2.2. Wind Flow Characteristics on Roofs 10 3.2.3. Development of Wind Loading Figure Based on ASCE 7 11
3.2.3.1. General 11 3.2.3.2. Roof Wind Zones 12 3.2.3.3. Building Edge and Parapet Effects 12 3.2.3.4. Nominal Net Pressure Coefficient, (GCrn)nom 13 3.2.3.5. Shielding within an Array 13 3.2.3.6. Design of Roof Supporting Solar Array 14
4. Effective Wind Area 14 5. Wind Tunnel Test per ASCE 7 15 References 17 Appendix A: Example Calculation
STRUCTURAL ENGINEERS ASSOCIATION OF CALIFORNIA
Wind Design for Low-Profile Solar Photovoltaic Arrays on Flat Roofs August 2012 Report SEAOC PV2-2012 Page 6
1. Abstract: The design wind loads for solar photovoltaic arrays on flat roof low-rise buildings are not covered by the prescriptive methods contained in ASCE 7 Minimum Design Loads for Buildings and Other Structures. This report describes the wind flow characteristics of rooftop solar photovoltaic (PV) arrays and the development of this information into a figure similar to that used in the prescriptive methods contained in ASCE 7 using the same design methodology. The report also addresses requirements for wind tunnel studies, effective wind area computation, and the wind loads on the roof itself.
2. Introduction: In the absence of detailed guidance from ASCE 7 for wind loads on photovoltaic arrays on flat roof low-rise buildings, designers often attempt to use a hybrid approach of the ASCE 7 components and cladding tables for enclosed buildings and main force resisting system tables for open structures, or they use the wind tunnel procedure of ASCE 7. The hybrid approach can lead to unconservative results, particularly when considering the size of the edge and corner roof zones. The wind tunnel procedure can be costly and time consuming, particularly for small or single-use projects. Furthermore, there are no code-based index values for the wind pressure coefficient GCrn with which to compare those developed from wind tunnel studies. The solar industry and code enforcement agencies are in need of a prescriptive method similar to that provided in ASCE 7. Recognizing that the solar industry and code enforcement agencies are in need of these design provisions, SEAOC formed the Solar PV committee to develop this report and provide these interim guidelines. This report describes the wind flow characteristics for solar photovoltaic panels on flat roofs and provides a figure similar to that used in the prescriptive methods contained in ASCE 7, using the same design methodology to generate GCrn values that are consistent with the design equations contained in ASCE 7. The intent is for this method to be used with either ASCE 7-05 or ASCE 7-10; where necessary, this report provides a distinction in applicability between the two standards. ICC AC 428 “Acceptance Criteria for Modular Framing Systems Used to Support Photovoltaic (PV) Modules” may be used to determine the wind loads for freestanding ground-mounted systems and flush-mounted systems. Freestanding ground-mounted systems are stand-alone systems and may use the open buildings prescriptive method contained in ASCE 7; this procedure is not applicable to rooftop installations on buildings. Flush-mounted systems are installed parallel to the roof surface of a building, within 2 to 10 inches of the roof surface, and may use the enclosed building components and cladding prescriptive method contained in ASCE 7.
The focus of this report is on low-profile photovoltaic arrays on flat or low-slope roofs of low-rise buildings, and not on ground-mounted systems or roof-mounted systems on other roof shapes (e.g. hip, gable, saw-tooth, etc.). Proposed changes to ASCE 7-10 include: adding Section 29.9 to address solar arrays on flat roofs modifying Table 29.1-1 to include solar arrays adding Figure 29.9-1 to determine pressure coefficients for
solar arrays adding a definition of Effective Wind Area for solar arrays adding Section 31.6 to address wind tunnel testing of solar
arrays
Throughout this document, where ASCE 7-10 changes are being proposed, the existing unmodified language in ASCE 7-10 is italicized, whereas the proposed changes are italicized and underlined. Following each proposed code change, the report typically includes a commentary providing background information.
3. Prescriptive GCrn Values for Solar Arrays Mounted on Flat Roofs
This section presents code language and a figure similar to that used in the prescriptive methods contained in ASCE 7 for wind loads on low-profile rooftop solar photovoltaic arrays installed on flat roofs.
3.1. Proposed Code Changes The following code language and figure provide an ASCE 7 based prescriptive method for determining the GCrn values and wind loads for solar photovoltaic panels installed on flat roofs. This method is applicable to the conditions illustrated in the figure with corresponding limitations. No extrapolation beyond the limitations shown shall be made. The equations and methodology in ASCE 7 for determining the velocity pressures and associated site coefficients shall be used with the GCrn values shown herein. The proposed code language uses the term “panel” to mean a planar assembly of solar photovoltaic (PV) modules. The term PV “modules” refers to manufactured, environmentally protected units of solar cells that form the basic unit of solar photovoltaic arrays. This terminology is consistent with Section 690 of the 2011 National Electrical Code. The following is the proposed code language corresponding to ASCE 7-10. The figure references both ASCE 7-05 and ASCE 7-10 sections where applicable.
STRUCTURAL ENGINEERS ASSOCIATION OF CALIFORNIA
Wind Design for Low-Profile Solar Photovoltaic Arrays on Flat Roofs August 2012 Report SEAOC PV2-2012 Page 7
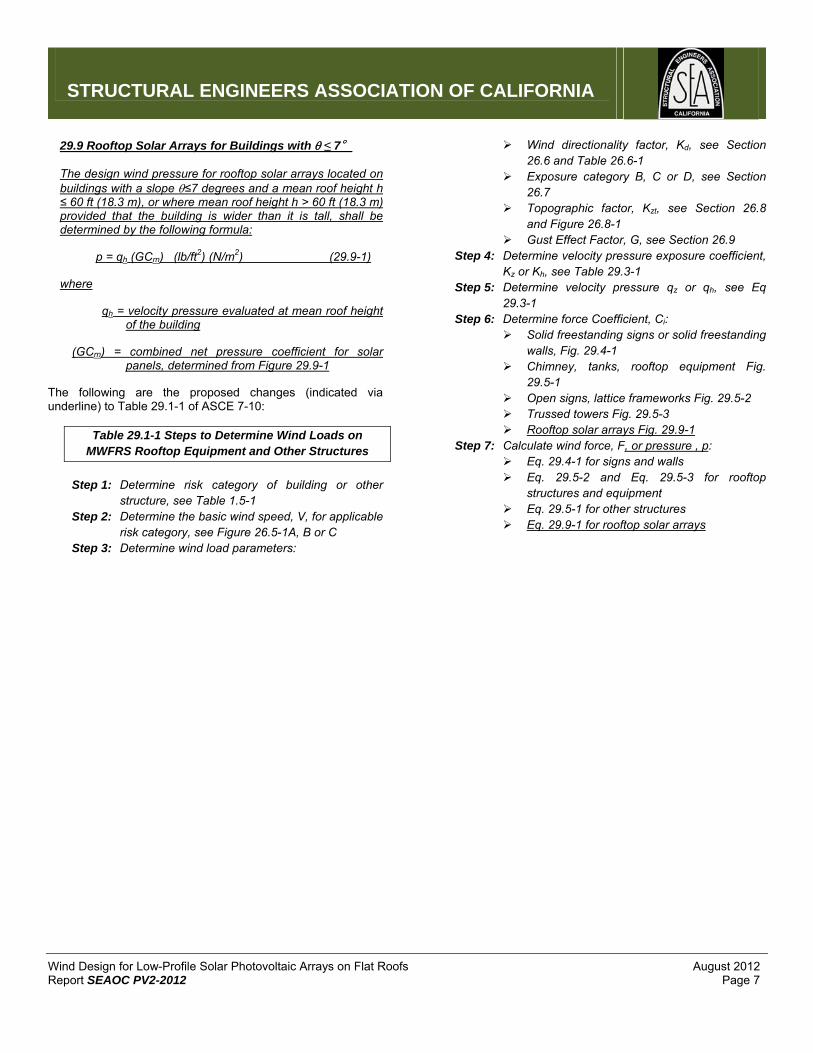
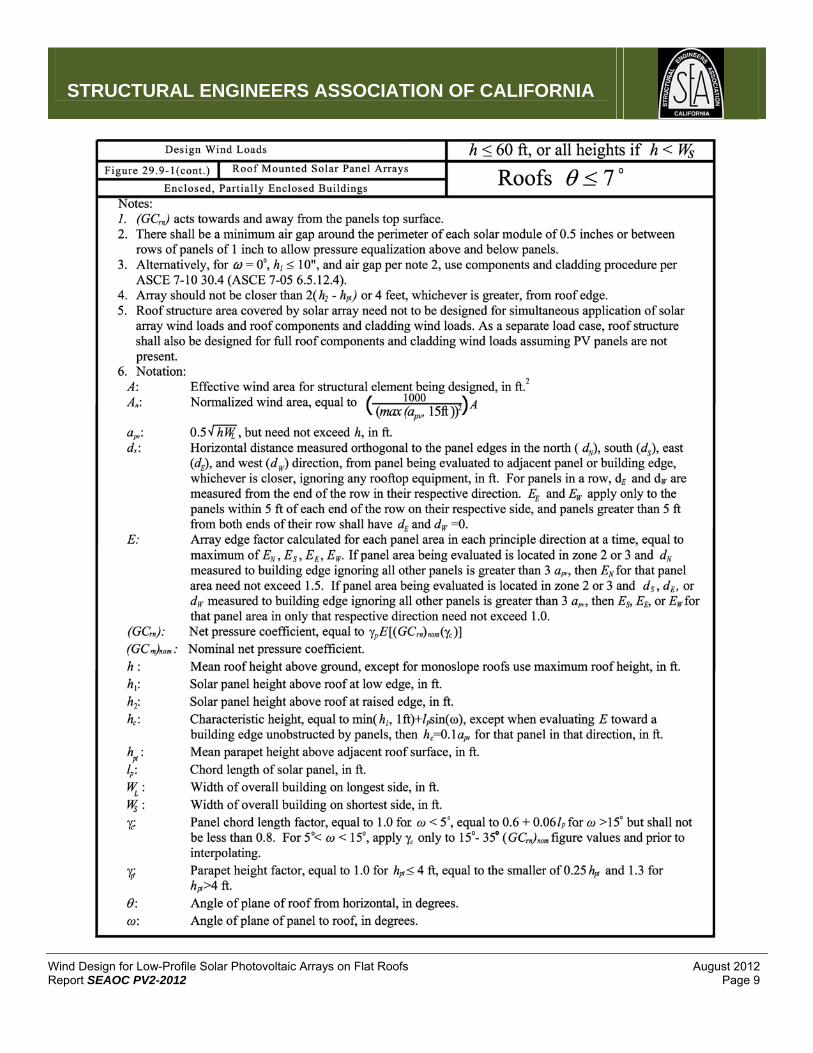
29.9 Rooftop Solar Arrays for Buildings with ≤ 7°
The design wind pressure for rooftop solar arrays located on buildings with a slope ≤7 degrees and a mean roof height h ≤ 60 ft (18.3 m), or where mean roof height h > 60 ft (18.3 m) provided that the building is wider than it is tall, shall be determined by the following formula:
p = qh (GCrn) (lb/ft2) (N/m2) (29.9-1)
where
qh = velocity pressure evaluated at mean roof height of the building
(GCrn) = combined net pressure coefficient for solar panels, determined from Figure 29.9-1
The following are the proposed changes (indicated via underline) to Table 29.1-1 of ASCE 7-10:
Table 29.1-1 Steps to Determine Wind Loads on MWFRS Rooftop Equipment and Other Structures
Step 1: Determine risk category of building or other
structure, see Table 1.5-1 Step 2: Determine the basic wind speed, V, for applicable
risk category, see Figure 26.5-1A, B or C Step 3: Determine wind load parameters:
Wind directionality factor, Kd, see Section 26.6 and Table 26.6-1
Exposure category B, C or D, see Section 26.7
Topographic factor, Kzt, see Section 26.8 and Figure 26.8-1
Gust Effect Factor, G, see Section 26.9 Step 4: Determine velocity pressure exposure coefficient,
Kz or Kh, see Table 29.3-1 Step 5: Determine velocity pressure qz or qh, see Eq
29.3-1 Step 6: Determine force Coefficient, Ci:
Solid freestanding signs or solid freestanding walls, Fig. 29.4-1
Chimney, tanks, rooftop equipment Fig. 29.5-1
Open signs, lattice frameworks Fig. 29.5-2 Trussed towers Fig. 29.5-3 Rooftop solar arrays Fig. 29.9-1
Step 7: Calculate wind force, F, or pressure , p: Eq. 29.4-1 for signs and walls Eq. 29.5-2 and Eq. 29.5-3 for rooftop
structures and equipment Eq. 29.5-1 for other structures Eq. 29.9-1 for rooftop solar arrays
STRUCTURAL ENGINEERS ASSOCIATION OF CALIFORNIA
Wind Design for Low-Profile Solar Photovoltaic Arrays on Flat Roofs August 2012 Report SEAOC PV2-2012 Page 8
STRUCTURAL ENGINEERS ASSOCIATION OF CALIFORNIA
Wind Design for Low-Profile Solar Photovoltaic Arrays on Flat Roofs August 2012 Report SEAOC PV2-2012 Page 9
STRUCTURAL ENGINEERS ASSOCIATION OF CALIFORNIA
Wind Design for Low-Profile Solar Photovoltaic Arrays on Flat Roofs August 2012 Report SEAOC PV2-2012 Page 10
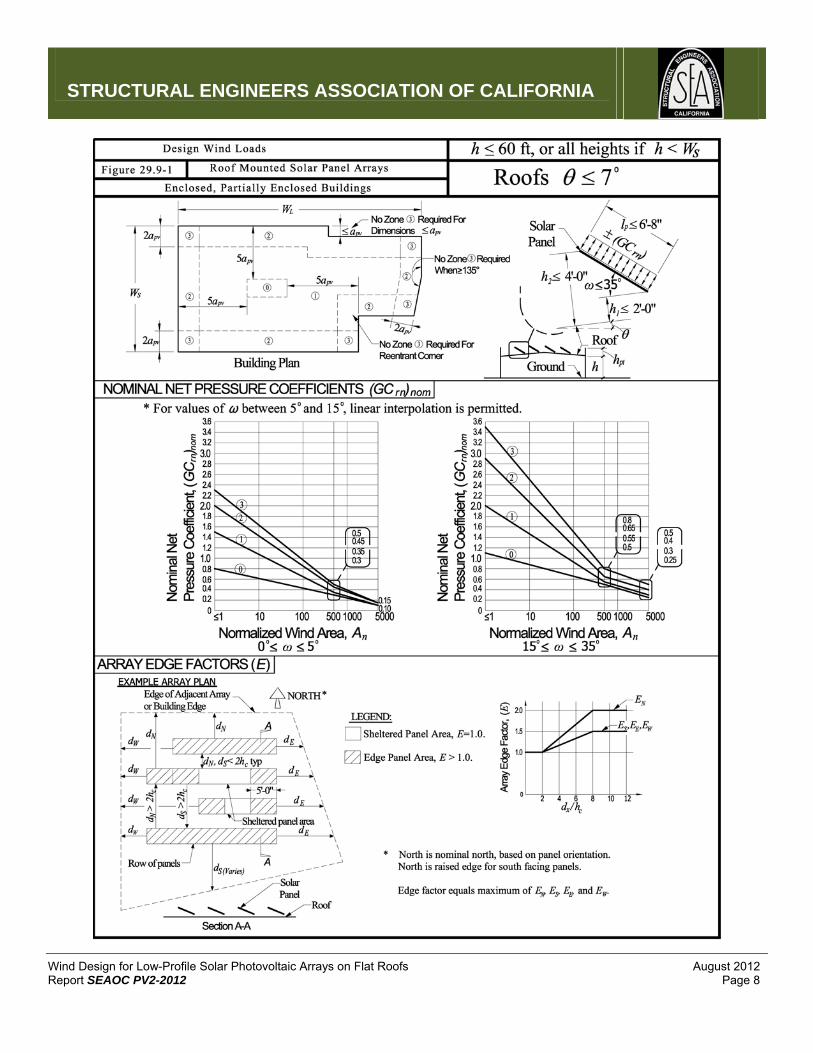
3.2. Commentary 3.2.1. Procedure for Using Figure 29.9-1 In order to simplify the use of the figure, the following is a step by step procedure. Step 1: Confirm applicability of the figure to the solar
installation and building. Step 2: For panels parallel to the roof surface and height
above roof less than 10 inches, the alternate procedure using components and cladding procedure per Note 3 is an option.
Step 3: Confirm that layout provides minimum distance from roof edge per Note 4.
Step 4: Compute apv for the building. Step 5: Determine roof zones with respect to solar array
layout. Step 6: Determine effective wind area for each element
being evaluated. Step 7: Compute (GCrn)nom from applicable chart. Step 8: If using 15 to 35 degree chart, apply chord length
adjustment factor, c. Step 9: For tilt angles between 5 and 15 degrees,
interpolate for tilt angle. Step 10: Apply edge factors to edge rows, sides, and all
rows where space between rows exceeds 2*hc. Step 11: Apply parapet height factor, p. Step 12: Calculate GCrn using p, E, and c*(GCrn)nom. Step 13: Go to ASCE 7-10 Table 29.1-1 to complete
calculation. An example calculation has been performed on a typical solar photovoltaic array and provided in Appendix A to further clarify the use of the figure.
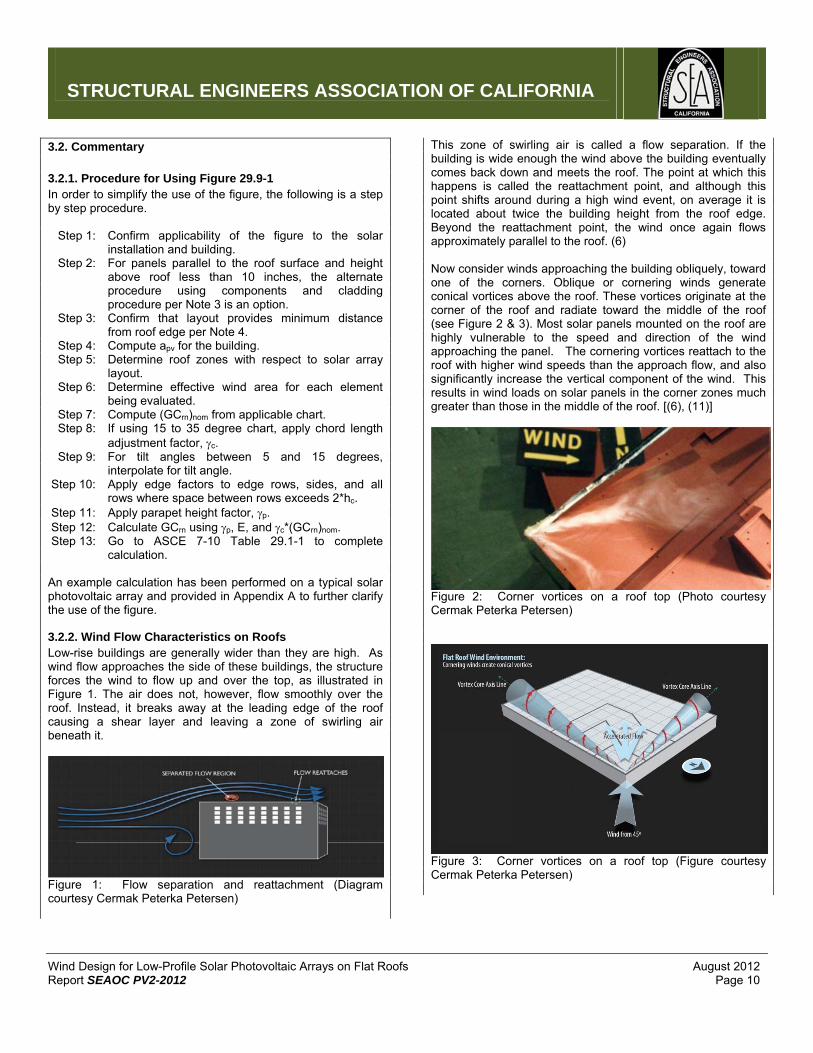
3.2.2. Wind Flow Characteristics on Roofs Low-rise buildings are generally wider than they are high. As wind flow approaches the side of these buildings, the structure forces the wind to flow up and over the top, as illustrated in Figure 1. The air does not, however, flow smoothly over the roof. Instead, it breaks away at the leading edge of the roof causing a shear layer and leaving a zone of swirling air beneath it.
Figure 1: Flow separation and reattachment (Diagram courtesy Cermak Peterka Petersen)
This zone of swirling air is called a flow separation. If the building is wide enough the wind above the building eventually comes back down and meets the roof. The point at which this happens is called the reattachment point, and although this point shifts around during a high wind event, on average it is located about twice the building height from the roof edge. Beyond the reattachment point, the wind once again flows approximately parallel to the roof. (6) Now consider winds approaching the building obliquely, toward one of the corners. Oblique or cornering winds generate conical vortices above the roof. These vortices originate at the corner of the roof and radiate toward the middle of the roof (see Figure 2 & 3). Most solar panels mounted on the roof are highly vulnerable to the speed and direction of the wind approaching the panel. The cornering vortices reattach to the roof with higher wind speeds than the approach flow, and also significantly increase the vertical component of the wind. This results in wind loads on solar panels in the corner zones much greater than those in the middle of the roof. [(6), (11)]
Figure 2: Corner vortices on a roof top (Photo courtesy Cermak Peterka Petersen)
Figure 3: Corner vortices on a roof top (Figure courtesy Cermak Peterka Petersen)
STRUCTURAL ENGINEERS ASSOCIATION OF CALIFORNIA
Wind Design for Low-Profile Solar Photovoltaic Arrays on Flat Roofs August 2012 Report SEAOC PV2-2012 Page 11
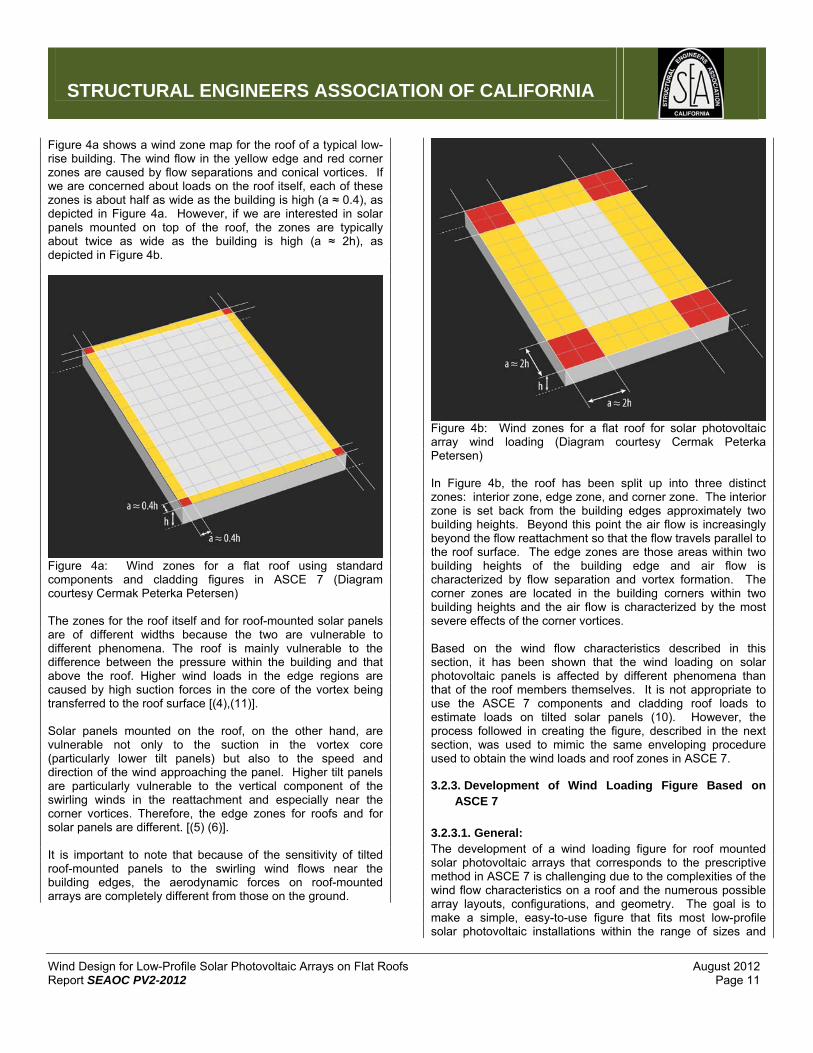
Figure 4a shows a wind zone map for the roof of a typical low-rise building. The wind flow in the yellow edge and red corner zones are caused by flow separations and conical vortices. If we are concerned about loads on the roof itself, each of these zones is about half as wide as the building is high (a ≈ 0.4), as depicted in Figure 4a. However, if we are interested in solar panels mounted on top of the roof, the zones are typically about twice as wide as the building is high (a ≈ 2h), as depicted in Figure 4b.
Figure 4a: Wind zones for a flat roof using standard components and cladding figures in ASCE 7 (Diagram courtesy Cermak Peterka Petersen) The zones for the roof itself and for roof-mounted solar panels are of different widths because the two are vulnerable to different phenomena. The roof is mainly vulnerable to the difference between the pressure within the building and that above the roof. Higher wind loads in the edge regions are caused by high suction forces in the core of the vortex being transferred to the roof surface [(4),(11)]. Solar panels mounted on the roof, on the other hand, are vulnerable not only to the suction in the vortex core (particularly lower tilt panels) but also to the speed and direction of the wind approaching the panel. Higher tilt panels are particularly vulnerable to the vertical component of the swirling winds in the reattachment and especially near the corner vortices. Therefore, the edge zones for roofs and for solar panels are different. [(5) (6)]. It is important to note that because of the sensitivity of tilted roof-mounted panels to the swirling wind flows near the building edges, the aerodynamic forces on roof-mounted arrays are completely different from those on the ground.
Figure 4b: Wind zones for a flat roof for solar photovoltaic array wind loading (Diagram courtesy Cermak Peterka Petersen) In Figure 4b, the roof has been split up into three distinct zones: interior zone, edge zone, and corner zone. The interior zone is set back from the building edges approximately two building heights. Beyond this point the air flow is increasingly beyond the flow reattachment so that the flow travels parallel to the roof surface. The edge zones are those areas within two building heights of the building edge and air flow is characterized by flow separation and vortex formation. The corner zones are located in the building corners within two building heights and the air flow is characterized by the most severe effects of the corner vortices. Based on the wind flow characteristics described in this section, it has been shown that the wind loading on solar photovoltaic panels is affected by different phenomena than that of the roof members themselves. It is not appropriate to use the ASCE 7 components and cladding roof loads to estimate loads on tilted solar panels (10). However, the process followed in creating the figure, described in the next section, was used to mimic the same enveloping procedure used to obtain the wind loads and roof zones in ASCE 7.
3.2.3. Development of Wind Loading Figure Based on ASCE 7
3.2.3.1. General: The development of a wind loading figure for roof mounted solar photovoltaic arrays that corresponds to the prescriptive method in ASCE 7 is challenging due to the complexities of the wind flow characteristics on a roof and the numerous possible array layouts, configurations, and geometry. The goal is to make a simple, easy-to-use figure that fits most low-profile solar photovoltaic installations within the range of sizes and
STRUCTURAL ENGINEERS ASSOCIATION OF CALIFORNIA
Wind Design for Low-Profile Solar Photovoltaic Arrays on Flat Roofs August 2012 Report SEAOC PV2-2012 Page 12
configurations most commonly used. Care was taken to not expand the range of application; otherwise the values in the figure could become overly conservative for lower profile systems. With this caveat in mind and considering the range of wind tunnel data available, it was determined that the maximum height above the roof surface (h2) for the solar panels should be limited to 4 feet and the panel chord length (lp) should be limited to 6 feet 8 inches. Wind tunnel data show that increasing the overall height above the roof or panel chord length increases the wind loads, so the wind load values from the figure should not be applied to higher profile or larger chord length systems. Likewise, the height of the gap between the panels and the roof surface (h1) should not exceed 2 feet, otherwise the wind flow under the panels can cause excessive uplift, beyond that covered in the figure. For roof-mounted solar photovoltaic installations that do not fall within the parameters of the wind loading figure or footnotes contain therein, wind tunnel testing in accordance with Section 5 is necessary to determine the pressure coefficients.
A reduction factor, c, is included in the figure to reduce the wind loads for shorter chord lengths. The reduction factor scales down linearly from a factor of 1 to 0.8 for chords 6 feet 8 inches long to 3 feet 4 inches, respectively. This factor only applies to the higher tilt angle (15 to 35 degrees) (GCrn)nom curves since change in chord length has little effect at low tilt angles (less than 5 degrees). If interpolating between 5 and 15 degrees, the reduction factor must be applied to the higher tilt angle (GCrn)nom curves prior to interpolating. The intent of the figure is to be applied to low-rise buildings, which are buildings less than or equal to 60 feet high. However, the behavior and physics of the wind flow contained herein can also be applied to buildings of any height provided the building is at least as wide as it is tall. The normalized wind area will account for increase wind loads of larger buildings as described in Section 3.2.3.4
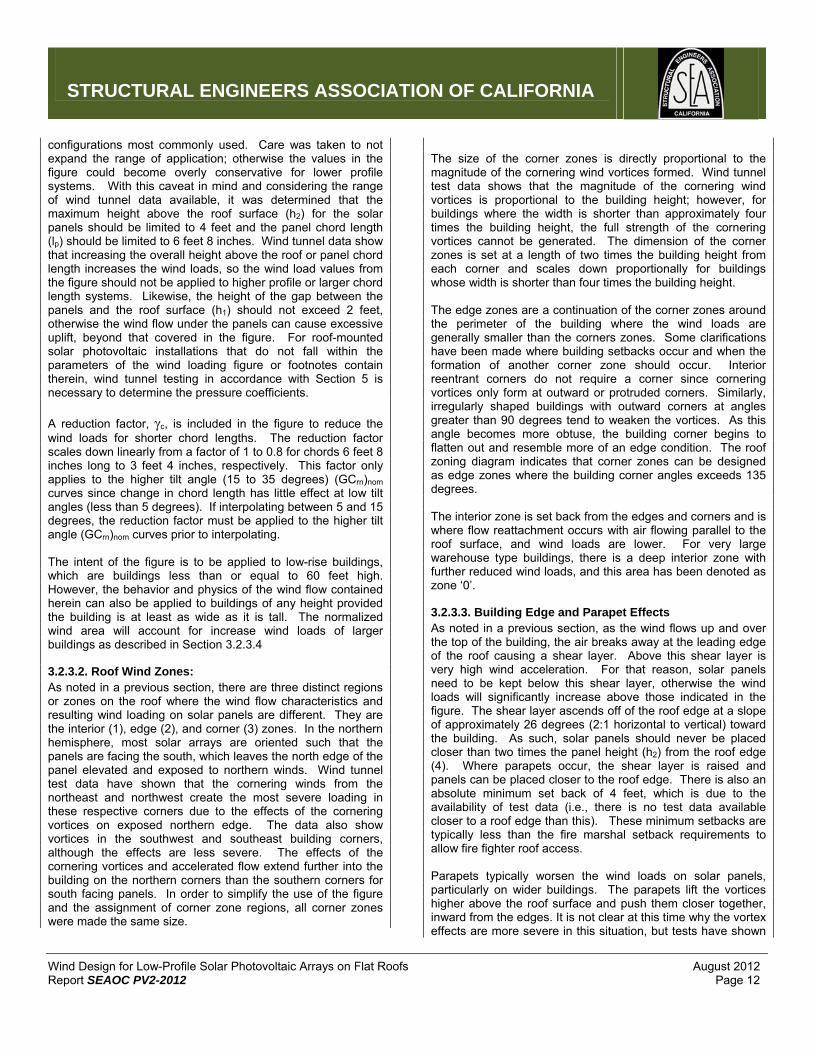
3.2.3.2. Roof Wind Zones: As noted in a previous section, there are three distinct regions or zones on the roof where the wind flow characteristics and resulting wind loading on solar panels are different. They are the interior (1), edge (2), and corner (3) zones. In the northern hemisphere, most solar arrays are oriented such that the panels are facing the south, which leaves the north edge of the panel elevated and exposed to northern winds. Wind tunnel test data have shown that the cornering winds from the northeast and northwest create the most severe loading in these respective corners due to the effects of the cornering vortices on exposed northern edge. The data also show vortices in the southwest and southeast building corners, although the effects are less severe. The effects of the cornering vortices and accelerated flow extend further into the building on the northern corners than the southern corners for south facing panels. In order to simplify the use of the figure and the assignment of corner zone regions, all corner zones were made the same size.
The size of the corner zones is directly proportional to the magnitude of the cornering wind vortices formed. Wind tunnel test data shows that the magnitude of the cornering wind vortices is proportional to the building height; however, for buildings where the width is shorter than approximately four times the building height, the full strength of the cornering vortices cannot be generated. The dimension of the corner zones is set at a length of two times the building height from each corner and scales down proportionally for buildings whose width is shorter than four times the building height. The edge zones are a continuation of the corner zones around the perimeter of the building where the wind loads are generally smaller than the corners zones. Some clarifications have been made where building setbacks occur and when the formation of another corner zone should occur. Interior reentrant corners do not require a corner since cornering vortices only form at outward or protruded corners. Similarly, irregularly shaped buildings with outward corners at angles greater than 90 degrees tend to weaken the vortices. As this angle becomes more obtuse, the building corner begins to flatten out and resemble more of an edge condition. The roof zoning diagram indicates that corner zones can be designed as edge zones where the building corner angles exceeds 135 degrees. The interior zone is set back from the edges and corners and is where flow reattachment occurs with air flowing parallel to the roof surface, and wind loads are lower. For very large warehouse type buildings, there is a deep interior zone with further reduced wind loads, and this area has been denoted as zone ‘0’.
3.2.3.3. Building Edge and Parapet Effects As noted in a previous section, as the wind flows up and over the top of the building, the air breaks away at the leading edge of the roof causing a shear layer. Above this shear layer is very high wind acceleration. For that reason, solar panels need to be kept below this shear layer, otherwise the wind loads will significantly increase above those indicated in the figure. The shear layer ascends off of the roof edge at a slope of approximately 26 degrees (2:1 horizontal to vertical) toward the building. As such, solar panels should never be placed closer than two times the panel height (h2) from the roof edge (4). Where parapets occur, the shear layer is raised and panels can be placed closer to the roof edge. There is also an absolute minimum set back of 4 feet, which is due to the availability of test data (i.e., there is no test data available closer to a roof edge than this). These minimum setbacks are typically less than the fire marshal setback requirements to allow fire fighter roof access. Parapets typically worsen the wind loads on solar panels, particularly on wider buildings. The parapets lift the vortices higher above the roof surface and push them closer together, inward from the edges. It is not clear at this time why the vortex effects are more severe in this situation, but tests have shown
STRUCTURAL ENGINEERS ASSOCIATION OF CALIFORNIA
Wind Design for Low-Profile Solar Photovoltaic Arrays on Flat Roofs August 2012 Report SEAOC PV2-2012 Page 13
that this can result in wind loads that are 50% greater than in the absence of a parapet, particularly for unprotected tilted panels. (4). As such, the figure limits the parapet height to 4 feet unless the (GCrn)nom values are increased by a 1.3 factor.
3.2.3.4. Nominal Net Pressure Coefficient, (GCrn)nom The nominal net pressure coefficient (GCrn)nom curves were generated based on wind tunnel test data within the range of parameters allowed by the figure. These curves were created based on the same methodology as those shown in ASCE 7 for components and cladding. The nomenclature used in the figure is intended to be the same as that used for rooftop structures in ASCE 7-10 Chapter 29, where GCrn applies to net pressure coefficient. The net pressure coefficients shown in the design curves of the figure are denoted (GCrn)nom since these values are nominal values that generally are applicable to sheltered panels and need to be adjusted for array edge conditions, parapet size, and solar panel length. One important difference in this figure from those in ASCE 7 is that the effective wind area on the horizontal axis is changed to normalized wind area. This represents a shift in methodology from that in ASCE 7. The wind tunnel test data indicates that larger buildings have larger (GCrn)nom values than smaller buildings. When enveloping data to create these curves, it is quite apparent that taller low-rise buildings skew the (GCrn)nom curves higher when compared to lower low-rise buildings. This effect is not currently addressed in ASCE 7 components and cladding figures. In order to not over-penalize shorter or smaller buildings, the use of a normalized wind area is used. The normalized wind area is approximately equal to the effective wind area for 33-foot high buildings. For shorter buildings, the normalized wind area will be larger than the effective wind area, thereby sliding to the right on the figure and reducing the (GCrn)nom values or wind load. Taller buildings have the opposite effect. A lower limit on the height of the building used in computing the normalized wind area has been set at 15 feet, otherwise the calculated wind loads become lower than the data supports. The ASCE 7 components and cladding GCp curves all max out and remain constant at effective wind areas less than 10 square feet. When using normalized wind area, the GCp
values cannot be capped since the factor of 10 is not an absolute area; it is a factor. Taller buildings will use the normalized wind area values in the 1 to 10 range for much of the components and cladding loads. Therefore (GCrn)nom values are instead capped at normalized wind areas of less than 1. The (GCrn)nom curves in the figure cover the range of panel tilt angles from 0 degree to 35 degrees since this is the practical range of inclination for typical installations. For panels parallel to the roof surface, ICC AC 428 can be utilized which allows the panels to be designed as components and cladding in accordance with the ASCE 7 figures. The wind tunnel data available cover panel tilt angles up to 30 degrees, and since
the change in wind loads on the steeper panel tilt angles is small, the extrapolation to 35 degrees is rational. The wind tunnel data indicate that the (GCrn)nom values are not linearly related to the panel tilt angle over the full tilt angle range. The data indicate that there is a relatively small change in (GCrn)nom values for the lower tilt panels in the 1- to 5-degree range. Then there is a rapid increase in (GCrn)nom values from 5 to 15 degrees. There is again a relatively small change in (GCrn)nom values for higher tilt panels in the 15- to 35-degree range, because, for the higher tilt angles, upstream panels create turbulence which increases the wind loads on all downstream panels (9). Thus, the figure was created with two (GCrn)nom curves to address this phenomenon; a (GCrn)nom curve for low tilt panels in the 0- to 5-degree range and another for high tilt panels in the 15- to 35-degree range. For panel tilt angles in the 5- to 15-degree range, interpolation is permitted. The (GCrn)nom curves are shown for each of the distinct roof zones previously noted. Based on the wind tunnel data, the values for zones 2 and 3 are approximately 1.3 and 1.5 times higher than zone 1 wind loads, respectively. At small and very large effective wind areas, these factors diverge from these constants as illustrated in the (GCrn)nom curves. The (GCrn)nom data has been typically rounded to the nearest tenth to allow easier extraction of the data off of the curves. (GCrn)nom values are for both positive and negative values. Wind tunnel test data shows similar positive and negative pressures for solar panels, which is very different than typical roof member design wind loads.
3.2.3.5. Shielding within an Array Solar panels are typically installed in large arrays with closely spaced rows. When the wind traveling above the roof surface approaches the array, the wind generally travels up and over the array. As the wind accelerates over the first panel at the array edge, it causes a large wind load on this edge panel. As the wind continues across the array, it tries to reattach to the roof, but if the panels are in closely spaced rows, the wind cannot fully recover and it rolls over the top of the remaining downwind panels in a turbulent manner. Wind tunnel tests have shown that the edge panels can have wind loads in excess of two times that of closely spaced shielded panels. A typical array consists of closely spaced panel rows that are sheltered by perimeter edge panel areas that have increased loading. In the development of the figure, the (GCrn)nom curves were chosen for sheltered panel areas since this represents the typical condition in large arrays. To account for the higher loading at the perimeter edge panel areas, an array edge increase factor needs to be applied. As noted earlier, most solar arrays in the northern hemisphere are oriented such that the panels are facing south, which leaves the north edge of the panel elevated and exposed to northern winds. As such, the edge effects on the northern edge row are significantly higher than that on the southern edge row and east and west sides of
STRUCTURAL ENGINEERS ASSOCIATION OF CALIFORNIA
Wind Design for Low-Profile Solar Photovoltaic Arrays on Flat Roofs August 2012 Report SEAOC PV2-2012 Page 14
the array. The figure has two different edge factors to account for this phenomenon. In order to take full advantage of the shielding effect between panel rows, the space between rows needs to be less than twice the panel characteristic height (hc). As the space between rows increases, the wind loads on the panels increase. The same phenomenon occurs where there are open spaces on the roof between adjacent arrays. As the open space between panels approaches approximately 8 times the panel characteristic height (hc), all sheltering has fully dissipated and practically full reattachment of the wind to the roof surface occurs. As such, the edge factors in the figure increase linearly as spacing increases from 2 panel characteristic heights to 8 panel characteristic heights. As noted in a previous section, the shear layer of wind coming up and over the edge of a building takes a long distance to reattach to the building roof surface. This begins to occur at approximately 80 percent of the building wall height, including the parapet. As a result, when edge panels are placed in this region, where flow reattachment has not occurred, the edge increase factor is less than the maximum value. To address this issue, hc is set equal to 0.1*apv for a panel when evaluating the array edge factor toward a building edge unobstructed by panels. For the same panel, hc used for the other directions, not toward a building edge unobstructed by panels, is a function of the adjacent panel heights above the roof. The array edge factors have a maximum cap of 2.0 when evaluating the north direction, and 1.5 when evaluating the south, east, and west directions. The array edge factors are further capped at 1.5 and 1.0, respectively, where panels are located more 3*apv from the building edge in the direction being evaluated and when they are located in roof zones 2 or 3. Since roof zones 2 and 3 extend 2*apv from the building edge, this condition occurs on panels that are located in roof zone 2 or 3 on the opposite side of the building in the direction being evaluated. This lower cap is placed on the array edge factor to address an unnecessary compounding effect of factors that occurs when a panel is being penalized for both array edge effects and building edge effects when, in the direction being analyzed, the panel is far from building edge effects. This lower cap only applies to the array edge factor evaluation in the direction that is greater than 3*apv from the building edge. Rooftop equipment, such as HVAC units, penthouses, and other roof objects can provide some sheltering benefits to solar arrays located directly downwind of the object, however, due to varied wind flow directions, the regions around edges of the units can have accelerated wind flow. (11) Due to the uncertainty in the wind direction and impact these objects have on the solar arrays, it is indicated in the figure to ignore these objects and design the surrounding panels as edge panels with the edge increase factor calculated as if the objects do not exist. This results in the panels adjacent to rooftop objects being designed for higher wind loads to account for the accelerated wind flow.
3.2.3.6. Design of Roof Supporting Solar Array Wind tunnel studies have shown that the wind loads on rooftop solar arrays need not be applied simultaneously to the roof components and cladding wind loads. These design checks should be carried out separately. Where a portion of the span of a roof member is covered by a solar array and the remainder is not covered, then the roof member should be designed with the solar array wind load on the covered portion with simultaneous application of roof components and cladding load on the uncovered portion. In a separate load case, the member should also be checked for typical components and cladding wind loads assuming that the photovoltaic panels are not present. For installations of new panels on existing buildings, this separate load case to check the capacity of the existing roof structure to resist the roof components and cladding wind loads applied over the entire roof area (i.e. assuming that the solar panels are not present) is not required. A note has been added to Figure 29.9-1 to address these roof design issues. Wind tunnel studies have shown that mechanically attached flush-mounted solar panels will not increase the wind load on the roof structure itself. The roof load remains roughly the same, with some fraction acting on the panels.
4. Effective Wind Area The following is proposed code language to amend ASCE 7-10 Section 26.2 (ASCE 7-05 Section 6.2) by adding the definition of effective wind area for roof mounted solar arrays.
EFFECTIVE WIND AREA, A for solar arrays: The area used to determine GCrn per Figure 29.9-1 is equal to the tributary area for the structural element being considered, except that the width of the effective wind area need not be less than one-third its length. For a fastener attaching solar modules, the effective wind area shall not be greater than the area tributary to the individual fastener.
Commentary: The definition of effective wind area for solar arrays is similar to that for components and cladding. As with components and cladding, the width of the effective wind area need not be less than one-third its length (which is typically equal to the span of the framing element being considered). The induced wind pressure is calculated per Figure 29.9-1 using this effective wind area, and the wind pressure is then applied over the actual area tributary to the element. Effective wind area is equal to tributary area except in cases where the exception is invoked that the width of the effective wind area need not be less than one-third its length. In such cases the effective wind area will be larger than the tributary area. The use of effective wind area in wind design is based on the phenomenon that the highest wind pressures come from instantaneous gust effects that are concentrated on small
STRUCTURAL ENGINEERS ASSOCIATION OF CALIFORNIA
Wind Design for Low-Profile Solar Photovoltaic Arrays on Flat Roofs August 2012 Report SEAOC PV2-2012 Page 15
areas. Larger areas have lower design pressure because wind pressures over the entire area do not peak at the same time (13). The concentrated pressures from gusts tend to be circular or elliptical in shape and are very unlikely to occur in an elongated shape directly over the span of a long framing member. Thus if the tributary area of a member is more elongated than a 3:1 ratio of length to width, the effective wind area can be increased to that corresponding to a width equal to 1/3 the length of the effective wind area. Further discussion is provided in Section 9.2.3 of (13). Tributary area for a spanning structural member of a solar array depends on the span length of that member times the perpendicular distances to adjacent parallel members. For a support point or fastener, tributary area depends on the span of members framing into that support point. Tributary area (and effective wind area) can depend on the characteristics of the solar array support system and the load path. For a roof bearing system having different load paths for upward, downward, and lateral forces, the appropriate effective wind area for each direction of forces is used. If the support system for the solar array has adequate strength and interconnectedness to span across a support or ballast point that is subject to yielding or uplift, the tributary area (and effective wind area) can be correspondingly increased, provided that strengths are not governed by brittle failure and that the deformation of the array is evaluated and does not result in adverse performance. See the “Load-sharing and more detailed calculations” section near the end of the example in Appendix A which illustrates this approach. The requirements and commentary above differ from the provision of IBC 2012 (14) Section 1509.7.1, which states, “Rooftop mounted photovoltaic systems shall be designed … using an effective wind area based on the dimensions of a single unit frame.” It is the consensus opinion of the SEAOC Solar Photovoltaic Systems Committee that this provision is not appropriate for many types of systems and parts of solar arrays. The provision can be un-conservative for a fastener with tributary area less than a “single unit frame” and is overly conservative for elements of a solar array, such as main supports or members that have a tributary area of several solar modules. The provision may also be overly conservative if applied to a framing member of a building supporting multiple attachments from a solar array.
5. Wind Tunnel Tests per ASCE 7 The following is proposed code language to address specific issues related to wind tunnel studies applied to roof mounted solar panels. The proposed code language is adapted from ASCE 7-10 Section 31.2, but is equally applicable to ASCE 7-05 and is denoted as such in parentheses where applicable.
31.6 WIND TUNNEL PROCEDURE FOR ROOF MOUNTED SOLAR PANELS 31.6.1 Wind Tunnel Model When using the wind tunnel procedure to develop generalizable wind loads for rooftop solar photovoltaic arrays, the wind tunnel model shall include to scale the array configuration and layouts placed on the roof of a building that properly models the rooftop wind flow environment in accordance with ASCE 7-10 Section 31.2 (ASCE 7-05 Section 6.6.2), and in accordance with the requirements in ASCE 49, “Wind Tunnel Testing for Buildings and Other Structures” (3). The model shall include various building features that affect the wind flow environment on the roof. The testing and instrumentation shall be designed to determine the wind load effects in different roof zones (corner, edge, center, etc.). Modeling site-specific buildings is not necessary; rather generic models with buildings large enough in plan area to capture the wind flow environment over different roof zones may be used. The wind tunnel testing shall use an arrangement of pressure taps or other instrumentation methodology that is sufficient to establish design wind forces on solar panels and the variation of such forces as a function of effective wind area. Wind tunnel results shall not be extrapolated to other panel geometry, panel inclination angle, panel row spacing, panel elevation above roof surface, or other roof shape types (e.g. gable, hip, barrel, flat, etc.) that were not part of the wind tunnel study. For moderate changes in panel angle, row spacing, or other parameters, reasonable interpolation between two or more tests is permitted. The limitations of any wind tunnel study, such as the range of array and building geometry parameters that were tested, shall be clearly reported along with the results. The wind tunnel results shall provide wind demands for the design of each structural element of the PV support system, such as by providing design wind pressures as a function of effective wind area. 31.6.2 Minimum Design Wind Loads for Rooftop Solar Panels For solar photovoltaic systems that meet the limitations and geometry requirements of Figure 29.9-1, the minimum design wind load based on a wind tunnel study shall be 50% of the values resulting from Figure 29.9-1. For solar photovoltaic systems that exceed the limitations and geometry requirements of Figure 29.9-1, the minimum design wind load based on a wind tunnel study shall be 65% of the values resulting from Figure 29.9-1. The minimum design wind force based on a wind tunnel study for roof mounted solar panel systems need not comply with the
STRUCTURAL ENGINEERS ASSOCIATION OF CALIFORNIA
Wind Design for Low-Profile Solar Photovoltaic Arrays on Flat Roofs August 2012 Report SEAOC PV2-2012 Page 16
minimum net pressure of 16 psf per ASCE 7-10 Section 30.2.2 (10 psf per ASCE 7-05 Section 6.1.4.2). 31.6.3 Peer Review Requirements for Wind Tunnel Studies of Roof Mounted Solar Panels Wind load values lower than the minimums indicated in Section 31.6.2 may be used when an independent peer review is performed in accordance with this section. The independent peer review is an objective, technical review by knowledgeable reviewer(s) experienced in performing wind tunnel studies on buildings and similar systems, in properly simulated atmospheric boundary layers. The minimum qualifications for the peer reviewer shall be as follows:
The peer reviewer shall be independent from the wind tunnel laboratory that performed the study and prepared the report and shall bear no conflict of interest.
The peer reviewer shall have technical expertise in the application of wind tunnel studies on buildings similar to that being reviewed.
The peer reviewer shall have experience in performing or evaluating boundary layer wind tunnel studies and shall be familiar with the technical issues and regulations governing the wind tunnel procedure in ASCE 7 as it is applied to systems similar to solar photovoltaic arrays that use generalized wind tunnel data for design.
The peer reviewer shall review the wind tunnel report, including, but not limited to, data collection methods, data analysis, boundary layer modeling, array and building modeling, resulting wind loads and their relationship to effective wind area, conversion of data into GCrn values, and conditions of applicability of results to different buildings types, array geometry, etc. The peer reviewer shall prepare a written report to the client. Such report should include, at a minimum, statements regarding the following:
Scope of peer review with limitations defined. The status of the wind tunnel study at time of review. Conformance of the wind tunnel study with the
requirements of ASCE 7-10 Section 31.2 (ASCE 7-05 Section 6.6.2).
Presentation of the conclusions of the reviewer identifying any areas that need further review, investigation and/or clarification.
Recommendations. Whether, in the reviewer’s opinion, the wind loads
derived from the wind tunnel study are in conformance with ASCE 7 for the intended use(s).
Commentary: The wind tunnel provisions in ASCE 7 prescribe the test conditions for developing wind loads for a specific building located at a specific site. Typically this is done by modeling the surrounding buildings and topography and its effect on a specific building. When applying the wind tunnel procedure for solar panel installations, a different approach is necessary. For solar panel installations, it is necessary to model a generic building with the solar array on the roof of a scaled building, then generate GCrn pressure coefficients that are applicable to any site, a wide range of building sizes, and varied array layout. This can be challenging since there is little literature on using the wind tunnel provisions to obtain generalized data, and ASCE 7 and ASCE 49 do not fully clarify the parameters and approach necessary to do this. The approach needs to be similar to that used to develop the GCp figures in ASCE 7 by modeling generic buildings with various features to capture a wide range of effects. References (8) and (10) provide guidance on how to apply the wind tunnel procedure to obtain generalized wind design parameters for solar arrays. In order for the results of a wind tunnel study to be applicable to a wide range of installation conditions, the building model must to be large enough to generate the proper wind flow environment on the roof. Typically this is done with 1:25 to 1:50 scale building models that are at approximately four times the model height in length to capture cornering vortices and flow reattachment that governs roof zoning, as the roof zoning indicated in ASCE 7 for components and cladding is not applicable to tilted solar arrays on flat roofs. The wind tunnel study should also provide recommendations for setback distances from larger rooftop equipment, penthouses, clerestories and other building features. The minimum components and cladding wind load pressures indicated in ASCE 7 are primarily applicable to the building envelope and are not entirely applicable to rooftop solar arrays. The limitations contained herein are to establish the lower bound wind pressures for wind tunnel studies of conditions similar to those addressed by Figure 29.9-1. The values of 50% and 65% were chosen considering the factor of safety included in the ASCE 7 design methodology, whereas, if a wind tunnel study were erroneous in some way that was not captured or identified, then these thresholds should be in a range to prevent a gross under-design. These thresholds are in the same range as those indicated in ASCE 7-10 31.4.3. Solar panels systems that have aerodynamic devices or more efficient profiles can have wind tunnel based wind loads less than the lower bound thresholds indicated. In order to use these lower values, a peer review is required. The peer reviewer qualifications and requirements are included herein to promote consistencies among the various jurisdictions and so once a peer review is performed, it could be accepted by multiple enforcement agencies so as not to require a peer review for every submittal. It should be noted that if the scope of applicability of a particular project exceeds that contained in
STRUCTURAL ENGINEERS ASSOCIATION OF CALIFORNIA
Wind Design for Low-Profile Solar Photovoltaic Arrays on Flat Roofs August 2012 Report SEAOC PV2-2012 Page 17
the wind tunnel study or peer review, a particular enforcement agency may require further peer review. The peer reviewer qualifications are intended to be those of a wind tunnel expert familiar with wind tunnel testing of buildings and the applicability of the ASCE 7 provisions to determine generalized wind design coefficients for roof mounted solar arrays. A source for peer reviewers is the American Association for Wind Engineering’s (AAWE) boundary layer wind tunnels list (http://www.aawe.org/info/wind_tunnels.php). The following is a summary of the AAWE list with other known boundary layer wind tunnels added. This is not a comprehensive list, but is provided as an aid. Cermak Peterka Petersen (CPP), Inc. Colorado State University Concordia University, Montreal Force Technology I.F.I. Institute Rowan, Williams, Davies & Irwin (RWDI) Texas Tech University of California, Davis University of Iowa University of Maryland University of Minnesota University of Washington University of Western Ontario Other sources of peer reviewers are the ASCE “Wind Loads on Solar Collectors Subcommittee” or the voting members of the ASCE 7 “Subcommittee on Wind Loads”. References (1) American Society of Civil Engineers, “Minimum design
loads for buildings and other structures.” ASCE7-05, 2006. (2) American Society of Civil Engineers, “Minimum design
loads for buildings and other structures.” ASCE7-10, 2010. (3) American Society of Civil Engineers, “Wind Tunnel Testing
for Buildings and Other Structures.” ASCE 49-07, 2012.
(4) Banks, D. “How to Calculate Wind Loads on Roof Mounted Solar Panels in the US” Cermak Peterka Petersen (CPP)
(5) Banks, D. “How Wind Load Studies will Impact the Solar Industry” WREF Proceedings, 2012
(6) Carpenter, D. “Solar modules on flat roofs – why worry about wind?” Cermak Peterka Petersen (CPP)
(7) International Code Council Evaluation Service AC 428 “Acceptance Criteria for Modular Framing Systems Used to Support Photovoltaic (PV) Modules.” ICC-ES AC 428, 2011
(8) Kopp, G., Maffei, J., Tilley, C. “Rooftop Solar Arrays and Wind Loading: A Primer on Using Wind Tunnel Testing as a Basis for Code Compliant Design per ASCE 7”, Boundary Layer Wind Tunnel Laboratory, The University of Western Ontario, Faculty of Engineering, 2011
(9) Kopp, G., Farquhar, S., Morrison, M., “Aerodynamic mechanisms for wind loads on tilted, roof--‐mounted, solar arrays”, Journal of Wind Engineering & Industrial Aerodynamics (manuscript under review), 2011
(10) Kopp, G., Banks, D. “Use of the Wind Tunnel Test Method for Obtaining Design Wind Loads on Roof-Mounted Solar Arrays”, Journal of Structural Engineering, 2012
(11) O’Brien, C., Banks, D. “Wind Load Analysis for Commercial Roof-Mounted Arrays”, Solar Professional, 2012
(12) Maffei, J., Telleen, K. Schellenberg, A., Ward, R., and Kopp, G.A. “Wind design of solar arrays on low-slope roofs.” Submitted to Journal of Structural Engineering, 2012
(13) Structural Engineers Association of Washington, “SEAW Commentary on Wind Code Provisions”, SEAW/ATC 60, 2004
(14) International Code Council, “International Building Code“, IBC, 2012.
(15) National Fire Protection Association, 2011 National Electrical Code, NFPA 70, 2011

STRUCTURAL ENGINEERS ASSOCIATION OF CALIFORNIA
Wind Design for Low-Profile Solar Photovoltaic Arrays on Flat Roofs August 2012 Report SEAOC PV2 Page 18
Appendix A: EXAMPLE WIND LOAD PROBLEMS: WIND LOADS ON LOW-PROFILE SOLAR PHOTOVOLTAIC SYSTEMS ON FLAT ROOFS
20 PV Support System Framing (Above Roof) 2 Attachment of PV Support System to Roof
110 Example Calculation Number 1.0 Example Calculation for Module Fasteners
Risk Category: Example Calculation for PV Support System Framing Wind Exposure Category: C Example Calculation for Attachment to Roof PV Panel inter-row spacing: 2 ft or 4 ft (ASCE 7-10) Example Calculation for Ballasted Array
Example Calculations Part I: Wind loads for designing fasteners of PV modules to support systems Given Figures 1 and 2 with the site specifications above, determine the maximum wind load on each PV module fastener to the supporting racking system. Each module is connected at four locations (Figure 2). Assume all module fasteners are the same.
1/32” 1’ ApproxAlldim.in feetFigure 1
X 10 10 Skylight AHU 5 10 Air Handling Unit O 4 4 Exhaust Fan
Figure 2
N
STRUCTURAL ENGINEERS ASSOCIATION OF CALIFORNIA
Wind Design for Low-Profile Solar Photovoltaic Arrays on Flat Roofs August 2012 Report SEAOC PV2 Page 19
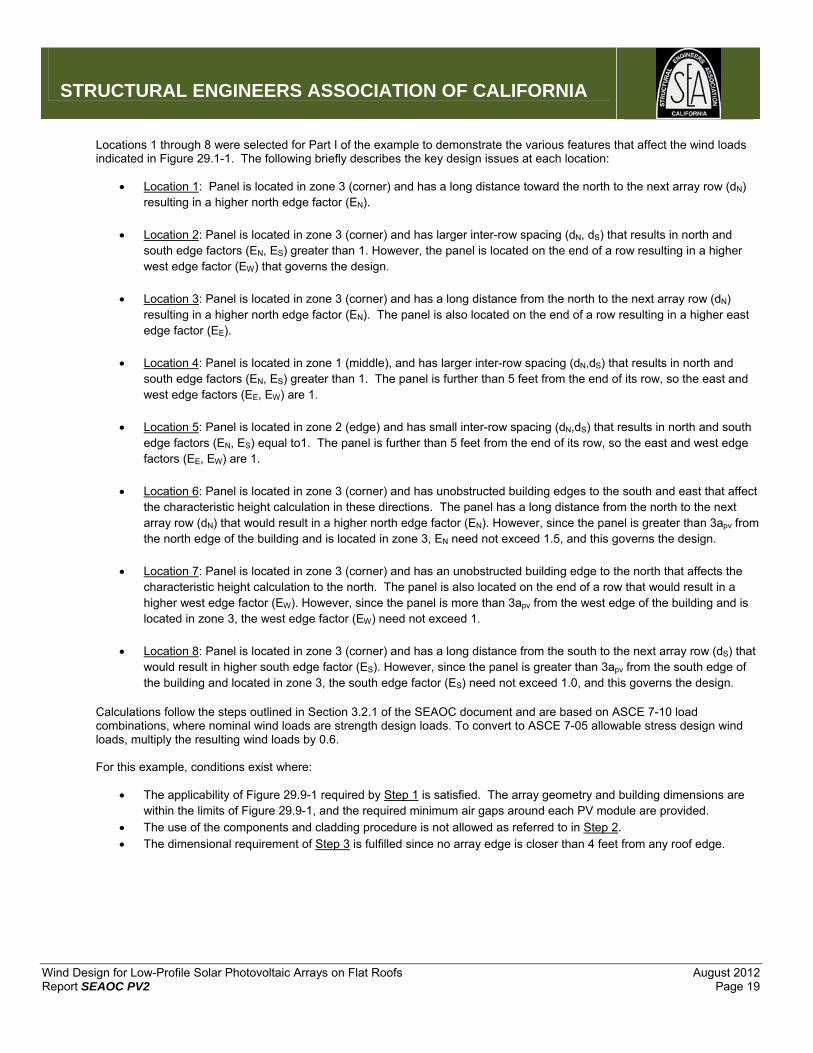
Locations 1 through 8 were selected for Part I of the example to demonstrate the various features that affect the wind loads indicated in Figure 29.1-1. The following briefly describes the key design issues at each location:
Location 1: Panel is located in zone 3 (corner) and has a long distance toward the north to the next array row (dN) resulting in a higher north edge factor (EN).
Location 2: Panel is located in zone 3 (corner) and has larger inter-row spacing (dN, dS) that results in north and south edge factors (EN, ES) greater than 1. However, the panel is located on the end of a row resulting in a higher west edge factor (EW) that governs the design.
Location 3: Panel is located in zone 3 (corner) and has a long distance from the north to the next array row (dN) resulting in a higher north edge factor (EN). The panel is also located on the end of a row resulting in a higher east edge factor (EE).
Location 4: Panel is located in zone 1 (middle), and has larger inter-row spacing (dN,dS) that results in north and south edge factors (EN, ES) greater than 1. The panel is further than 5 feet from the end of its row, so the east and west edge factors (EE, EW) are 1.
Location 5: Panel is located in zone 2 (edge) and has small inter-row spacing (dN,dS) that results in north and south edge factors (EN, ES) equal to1. The panel is further than 5 feet from the end of its row, so the east and west edge factors (EE, EW) are 1.
Location 6: Panel is located in zone 3 (corner) and has unobstructed building edges to the south and east that affect the characteristic height calculation in these directions. The panel has a long distance from the north to the next array row (dN) that would result in a higher north edge factor (EN). However, since the panel is greater than 3apv from the north edge of the building and is located in zone 3, EN need not exceed 1.5, and this governs the design.
Location 7: Panel is located in zone 3 (corner) and has an unobstructed building edge to the north that affects the characteristic height calculation to the north. The panel is also located on the end of a row that would result in a higher west edge factor (EW). However, since the panel is more than 3apv from the west edge of the building and is located in zone 3, the west edge factor (EW) need not exceed 1.
Location 8: Panel is located in zone 3 (corner) and has a long distance from the south to the next array row (dS) that would result in higher south edge factor (ES). However, since the panel is greater than 3apv from the south edge of the building and located in zone 3, the south edge factor (ES) need not exceed 1.0, and this governs the design.
Calculations follow the steps outlined in Section 3.2.1 of the SEAOC document and are based on ASCE 7-10 load combinations, where nominal wind loads are strength design loads. To convert to ASCE 7-05 allowable stress design wind loads, multiply the resulting wind loads by 0.6. For this example, conditions exist where:
The applicability of Figure 29.9-1 required by Step 1 is satisfied. The array geometry and building dimensions are within the limits of Figure 29.9-1, and the required minimum air gaps around each PV module are provided.
The use of the components and cladding procedure is not allowed as referred to in Step 2. The dimensional requirement of Step 3 is fulfilled since no array edge is closer than 4 feet from any roof edge.

STRUCTURAL ENGINEERS ASSOCIATION OF CALIFORNIA
Wind Design for Low-Profile Solar Photovoltaic Arrays on Flat Roofs August 2012 Report SEAOC PV2 Page 20
Step 4: Determine apv 0.5 but need not exceed h
0.5 20 182 30 Since is not to exceed , ,
Step 5: Determine Roof Zones: (See Figure 3 below)
: Roof Zone 2 and 3 setback (indicated by dotted lines in Figure 3).
Panels located beyond setback are in Roof Zone 1.
Roof Zone 0 is not applicable to this application since no condition exists where a setback is > .
Note that Roof Zone 3 does not exist at the obtuse angle along the west roof edge since it is greater than 135°, nor does it exist at the reentrant roof corner along the east roof edge since reentrant corner is less than apv.
Figure 3
1/32” 1’
N

STRUCTURAL ENGINEERS ASSOCIATION OF CALIFORNIA
Wind Design for Low-Profile Solar Photovoltaic Arrays on Flat Roofs August 2012 Report SEAOC PV2 Page 21
Step 6: Effective Wind Area ( ) of a module fastener:
14
14
5.0 2.5
.
For application to the charts in Figure 29.9-1, calculate the Normalized Wind Area :
,
A 3.1
. Step 7: Compute from applicable chart in Figure 29.9-1:
Determine values at 7.75 in both charts in Figure 29.9-1 and then use linear interpolation to find each value at 10°:
Table 1: at An = 7.75, by Roof Zone and Interpolated for 10°
Roof Zone 0° 5° 15° 35° 15° 35° * Step 9: interpolated for 10°
(See calculations in Table 2) 1 1.12 1.52 1.37 1.25
2 1.49 2.16 1.94 1.72
3 1.71 2.61 2.35 2.03
* Step 8: Find chord length adjustment factor ( for use as the multiplication factor for 15° 35° chart in Figure 29.9-1 before interpolating: 0.6 0.06 0.6 0.06 5 where 0.8 1.0 ; .
Table 2: To aid in the interpolation of the above values, the following are the equations for charts in Figure 29.9-1:
Roof Zone
3 2 1 0**
0° 5° 1-500 0.6669log 2.300 0.5743log 2.000 0.4261log 1.500 0.1853log 0.800
0° 5° 500-5000 0.3500log 1.445 0.3000log 1.260 0.2500log 1.025 0.2000log 0.840
15° 35° 1-500 1.0004log 3.500 0.8337log 2.900 0.5372log 2.000 0.2223log 1.100
15° 35° 500-5000 0.3000log 1.610 0.2500log 1.325 0.2500log 1.225 0.2500log 1.175 ** Roof Zone 0 equations do not apply to this example but can be used for reference in other applicable projects. Step 10: Determine Edge Factors (E ):
min , 1 sin
min 0.5 , 1 5 sin 10°
. except when evaluating a panel toward a building edge unobstructed by panels, then…
0.1 0.1 20
. when evaluating toward a building edge unobstructed by panels.
(Continued in Table 3 on next page)

STRUCTURAL ENGINEERS ASSOCIATION OF CALIFORNIA
Wind Design for Low-Profile Solar Photovoltaic Arrays on Flat Roofs August 2012 Report SEAOC PV2 Page 22
* d X
(UO
) is
the
unob
stru
cted
dis
tanc
e to
bui
ldin
g ed
ge in
the
resp
ectiv
e di
rect
ion.
Tab
le 3
: E
dg
e F
acto
rs f
or
8 P
V P
anel
Lo
cati
on
s
, , ,
2 1.5 2
1.15
1 1.5
1.21
1
1 1.5 1 1 1 1 1 1
2 3& ∗ 3 , , 1.0 ?
Y
N
Y
N
Y
Y
Y
N
,
0
10.2
2
0 0 0 0
10.4
4
0
,
(ft)
1.37
1.37
1.37
1.37
1.37
1.37
1.37
1.37
(f
t)
0 14
0 0 0 0
14.3
0
1 1 1.5 1 1
1.28
1 1
2 3& ∗ 3 , , 1.0 ?
N
Y
N
N
N
N
N
Y
,
0 0
10.4
4
0 0 5.4 0 0
,
(ft)
1.37
1.37
1.37
1.37
1.37
2
1.37
1.37
(f
t)
0 0
14.3
0 0
10.8
0 0
1
1.08
1
1.08
1
1.02
1 1
2 3& ∗ 3 , , 1.0 ?
Y
N
Y
N
N
N
Y
Y
,
1.46
2.92
1.46
2.92
1.46
2.25
1.46
13.8
7
,
(ft)
1.37
1.37
1.37
1.37
1.37
2
1.37
1.37
(ft)
2 4 2 4 2 4.5 2 19
2
1.15
2
1.15
1 1.5
1.21
1
2 3& ∗ 3 , , 1.5 ?
N
Y
N
N
Y
Y
N
N
,
13.8
7
2.92
13.8
7
2.92
1.46
6.57
3.25
1.46
,
(ft)
1.37
1.37
1.37
1.37
1.37
1.37
2
1.37
(ft)
19
4 19
4 2 9 6.5 2
Roof Zone 3 3 3 1 2 3 3 3
Location 1 2 3 4 5 6 7 8

STRUCTURAL ENGINEERS ASSOCIATION OF CALIFORNIA
Wind Design for Low-Profile Solar Photovoltaic Arrays on Flat Roofs August 2012 Report SEAOC PV2 Page 23
N
Nottoscale

STRUCTURAL ENGINEERS ASSOCIATION OF CALIFORNIA
Wind Design for Low-Profile Solar Photovoltaic Arrays on Flat Roofs August 2012 Report SEAOC PV2 Page 24
Step 11: Determine parapet height factor . Referring to Figure 29.9-1, Note 6: . since 4
(Step 12: The calculation of in contained within Table 4 below) To complete the calculation of the maximum wind load on each PV module fastener to the supporting racking system, first determine velocity pressure ( ):
0.00256 (ASCE 7-10, Equation 29.3-1)
0.9 (ASCE 7-10, Table 29.3-1 for Exposure C at 20 )
1.0
0.85 (ASCE 7-10, Table 26.6-1)
110
0.00256 0.9 1.0 0.85 110
. /
3.13 (Step 6) 1.0 (Step 9)0.9 (Step 8)
Problem 1 Solution: Table 4: Load (F) on each PV module fastener for locations 1-8:
Location Roof Zone Step 12:
( (lbs/ft2)
LRFD (ASD)
(lbs) - LRFD
1 2 3 2.03 4.06 96 57 301 2 1.5 3 2.03 3.05 72 43 225 3 2 3 2.03 4.06 96 57 301 4 1.15 1 1.25 1.44 34 20 106 5 1 2 1.72 1.72 41 24 128 6 1.5 3 2.03 3.05 72 43 225 7 1.21 3 2.03 2.46 58 34 182 8 1 3 2.03 2.03 48 28 150
(LRFD Pressures (p) for all panel areas are illustrated on the next page in Figure 5)

STRUCTURAL ENGINEERS ASSOCIATION OF CALIFORNIA
Wind Design for Low-Profile Solar Photovoltaic Arrays on Flat Roofs August 2012 Report SEAOC PV2 Page 25
N
Nottoscale

STRUCTURAL ENGINEERS ASSOCIATION OF CALIFORNIA
Wind Design for Low-Profile Solar Photovoltaic Arrays on Flat Roofs August 2012 Report SEAOC PV2 Page 26
Example calculations Part II: Wind Loads for designing structural elements of PV support systems, ballasts, and attachments to roof The following examples calculate design wind loads on PV panels for designing structural elements of the PV support system (in this case, beams above the roof) and ballasts or attachments of the PV support system to the roof. These elements have different effective wind areas, so the design wind pressures are different from those used for the design of module fasteners, calculated previously in Part I. Calculations follow the steps outlined in Section 3.2.1 of the SEAOC document and are based on ASCE 7-10, which uses strength design wind loads. To convert to ASCE 7-05 allowable stress design wind loads, multiply resulting wind loads by 0.6. Previous calculations It is assumed in these examples that calculations that do not depend on effective wind area (Steps 1 to 5, 8, 10, 11, and 13) have already been performed, as shown in the previous example calculations of wind forces on module fasteners to the PV support system. From Part I:
The solar arrays are within the dimensional and geometric limitations of applicability of Figure 29.9-1 (Steps 1 and 2).
The minimum required setback distance from the roof edge is satisfied (Step 3). apv = 20 ft. (Step 4) Roof zones are as shown in Figure 3 (Step 5). c = 0.9 (Step 8) Edge factors are as shown in Figure 4 (Step 10). p = 1.0 (Step 11) qh = 23.7 (Step 13)
PV support system description The PV support system in this example consists of two beams above the roof spanning east-west along each row of panels – one beam along the north edge of the modules, one along the south edge (Figure 2). Attachments between the beams and the roof are located at a regular spacing in the east-west direction. The spacing is different on different parts of the roof (Figure 1). Beams are continuous across attachments. For the PV support system in this example, the load path is from module fasteners to east-west spanning beams to regularly-spaced roof attachments. Other PV support systems (not shown in this example) may provide different load paths (such as north-south spanning elements) and load paths that are different for upward and downward forces (such as compression-only supports). For a given project, the engineer should evaluate the load path and structural characteristics of the particular PV support system being designed. One array in this example, located in the north-middle portion of the building (designated Location 9 in Figure 1), is a ballasted array (no attachments to the roof). Ballasts are located between rows of panels and along the north and south edges of the array. Ballasts are spaced at 2.5 ft. on center, such that each corner of each module is connected to a ballast, and each ballast is connected to four modules (if located between rows at the interior of the array), two modules (if located along the north, south, east, or west edges of the array), or one module if located at the array corner. Alternative designs with ballasts spaced at 5 ft. on center are also evaluated to show the effects of effective wind area, wind tunnel testing, and load-sharing on the design of ballasted systems. Locations of example calculations Example calculations are provided at the following locations (Figure 1), chosen to illustrate concepts:
Location 1: 5-ft. spacing of attachments, greatest wind pressures Location 2: 6-ft. spacing of attachments, different pressures on tributary modules Location 4: 10-ft. spacing of attachments, least wind pressures Location 6: 4-ft. spacing of attachments Location 7: 5-ft. spacing of attachments, cantilever beam condition Location 9: 2.5-ft. (and 5-ft.) spacing of ballasts
For project design, all worst-case locations on the array would need to be checked (not shown here).
STRUCTURAL ENGINEERS ASSOCIATION OF CALIFORNIA
Wind Design for Low-Profile Solar Photovoltaic Arrays on Flat Roofs August 2012 Report SEAOC PV2 Page 27
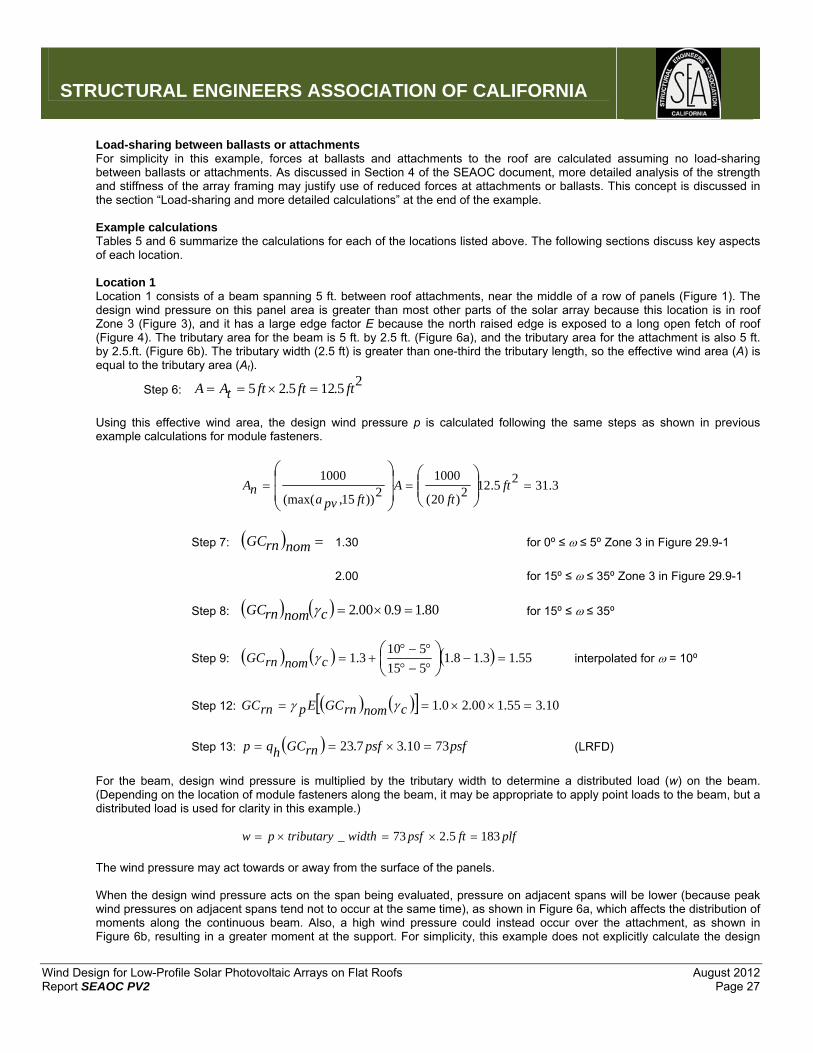
Load-sharing between ballasts or attachments For simplicity in this example, forces at ballasts and attachments to the roof are calculated assuming no load-sharing between ballasts or attachments. As discussed in Section 4 of the SEAOC document, more detailed analysis of the strength and stiffness of the array framing may justify use of reduced forces at attachments or ballasts. This concept is discussed in the section “Load-sharing and more detailed calculations” at the end of the example. Example calculations Tables 5 and 6 summarize the calculations for each of the locations listed above. The following sections discuss key aspects of each location. Location 1 Location 1 consists of a beam spanning 5 ft. between roof attachments, near the middle of a row of panels (Figure 1). The design wind pressure on this panel area is greater than most other parts of the solar array because this location is in roof Zone 3 (Figure 3), and it has a large edge factor E because the north raised edge is exposed to a long open fetch of roof (Figure 4). The tributary area for the beam is 5 ft. by 2.5 ft. (Figure 6a), and the tributary area for the attachment is also 5 ft. by 2.5.ft. (Figure 6b). The tributary width (2.5 ft) is greater than one-third the tributary length, so the effective wind area (A) is equal to the tributary area (At).
Step 6: 25.125.25 ftftfttAA
Using this effective wind area, the design wind pressure p is calculated following the same steps as shown in previous example calculations for module fasteners.
3.3125.122)20(
10002))15,(max(
1000
ft
ftA
ftpvanA
Step 7: nomrnGC 1.30 for 0⁰ ≤ ≤ 5⁰ Zone 3 in Figure 29.9-1
2.00 for 15⁰ ≤ ≤ 35⁰ Zone 3 in Figure 29.9-1
Step 8: 80.19.000.2 cnomrnGC for 15⁰ ≤ ≤ 35⁰
Step 9: 55.13.18.1515
5103.1
cnomrnGC interpolated for = 10⁰
Step 12: 10.355.100.20.1 cnomrnGCEprnGC
Step 13: psfpsfrnGChqp 7310.37.23 (LRFD)
For the beam, design wind pressure is multiplied by the tributary width to determine a distributed load (w) on the beam. (Depending on the location of module fasteners along the beam, it may be appropriate to apply point loads to the beam, but a distributed load is used for clarity in this example.) plfftpsfwidthtributarypw 1835.273_
The wind pressure may act towards or away from the surface of the panels. When the design wind pressure acts on the span being evaluated, pressure on adjacent spans will be lower (because peak wind pressures on adjacent spans tend not to occur at the same time), as shown in Figure 6a, which affects the distribution of moments along the continuous beam. Also, a high wind pressure could instead occur over the attachment, as shown in Figure 6b, resulting in a greater moment at the support. For simplicity, this example does not explicitly calculate the design
STRUCTURAL ENGINEERS ASSOCIATION OF CALIFORNIA
Wind Design for Low-Profile Solar Photovoltaic Arrays on Flat Roofs August 2012 Report SEAOC PV2 Page 28
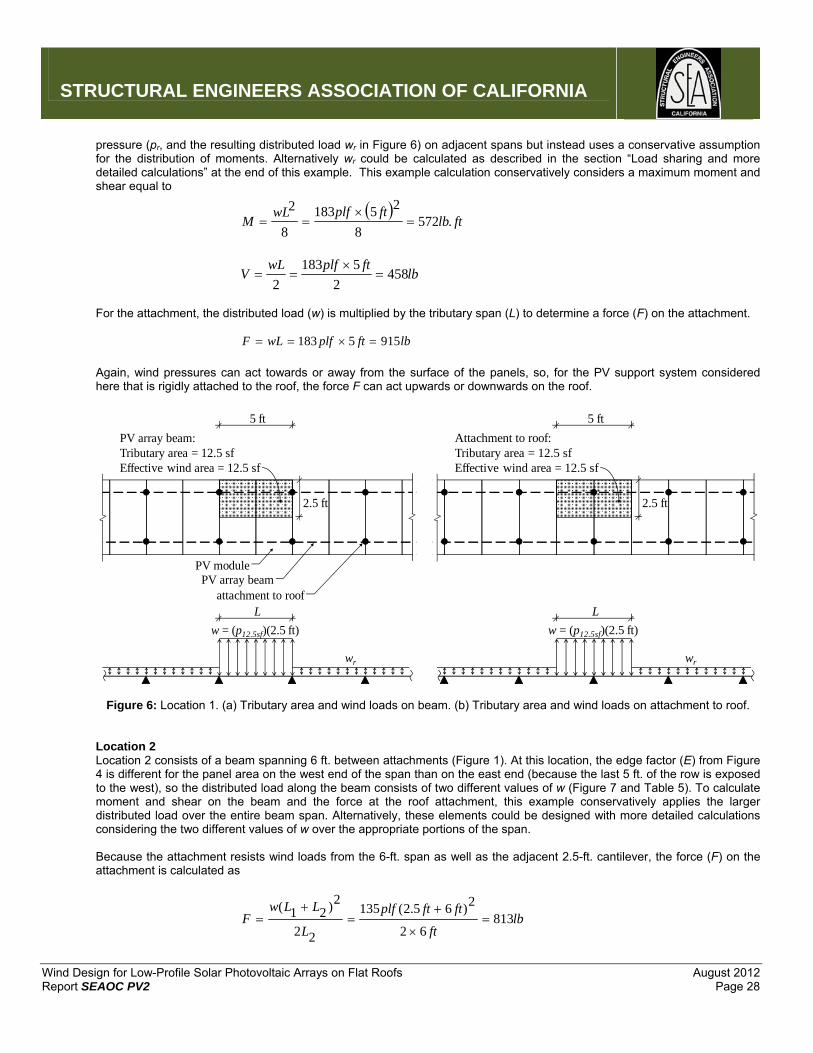
pressure (pr, and the resulting distributed load wr in Figure 6) on adjacent spans but instead uses a conservative assumption for the distribution of moments. Alternatively wr could be calculated as described in the section “Load sharing and more detailed calculations” at the end of this example. This example calculation conservatively considers a maximum moment and shear equal to
ftlbftplfwL
M .5728
25183
8
2
lbftplfwL
V 4582
5183
2
For the attachment, the distributed load (w) is multiplied by the tributary span (L) to determine a force (F) on the attachment. lbftplfwLF 9155183
Again, wind pressures can act towards or away from the surface of the panels, so, for the PV support system considered here that is rigidly attached to the roof, the force F can act upwards or downwards on the roof.
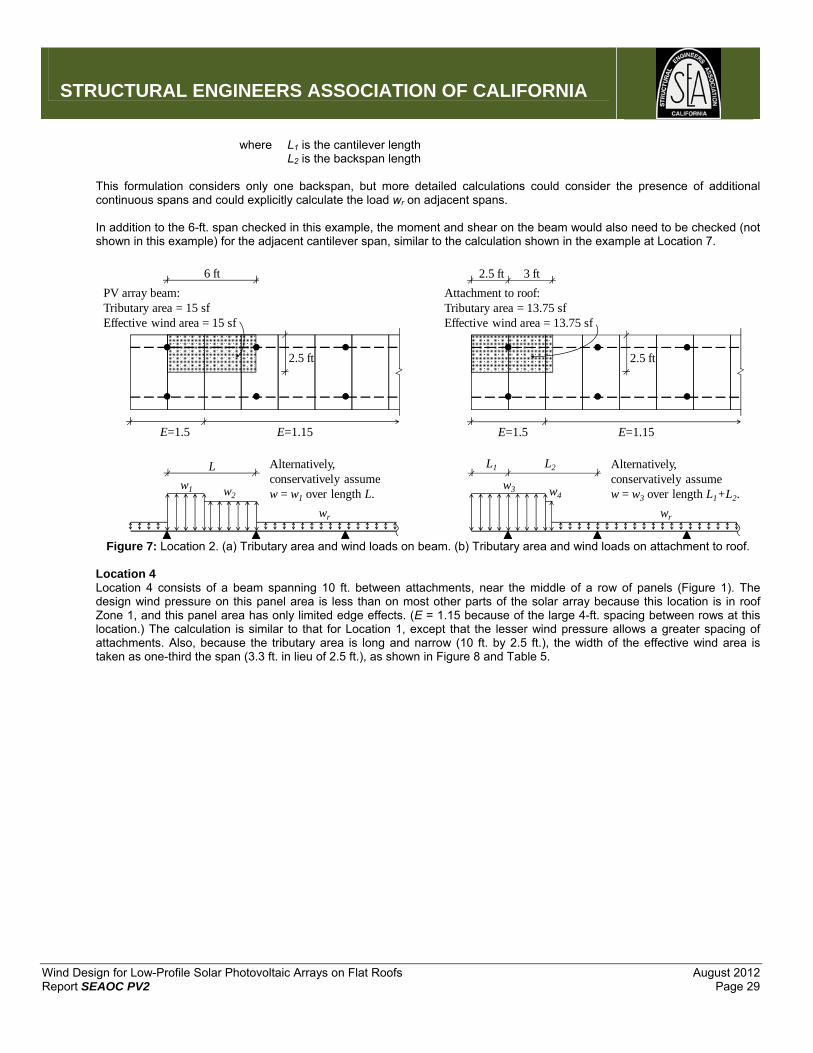
Figure 6: Location 1. (a) Tributary area and wind loads on beam. (b) Tributary area and wind loads on attachment to roof. Location 2 Location 2 consists of a beam spanning 6 ft. between attachments (Figure 1). At this location, the edge factor (E) from Figure 4 is different for the panel area on the west end of the span than on the east end (because the last 5 ft. of the row is exposed to the west), so the distributed load along the beam consists of two different values of w (Figure 7 and Table 5). To calculate moment and shear on the beam and the force at the roof attachment, this example conservatively applies the larger distributed load over the entire beam span. Alternatively, these elements could be designed with more detailed calculations considering the two different values of w over the appropriate portions of the span. Because the attachment resists wind loads from the 6-ft. span as well as the adjacent 2.5-ft. cantilever, the force (F) on the attachment is calculated as
lbft
ftftplf
L
LLwF 813
62
2)65.2(135
22
2)21(
5 ft
2.5 ft
PV array beam:Tributary area = 12.5 sfEffective wind area = 12.5 sf
w = (p12.5sf)(2.5 ft)
L
PV modulePV array beam
attachment to roof
wr
5 ft
2.5 ft
Attachment to roof:Tributary area = 12.5 sfEffective wind area = 12.5 sf
w = (p12.5sf)(2.5 ft)
L
wr
STRUCTURAL ENGINEERS ASSOCIATION OF CALIFORNIA
Wind Design for Low-Profile Solar Photovoltaic Arrays on Flat Roofs August 2012 Report SEAOC PV2 Page 29
where L1 is the cantilever length L2 is the backspan length This formulation considers only one backspan, but more detailed calculations could consider the presence of additional continuous spans and could explicitly calculate the load wr on adjacent spans. In addition to the 6-ft. span checked in this example, the moment and shear on the beam would also need to be checked (not shown in this example) for the adjacent cantilever span, similar to the calculation shown in the example at Location 7.
Figure 7: Location 2. (a) Tributary area and wind loads on beam. (b) Tributary area and wind loads on attachment to roof.
Location 4 Location 4 consists of a beam spanning 10 ft. between attachments, near the middle of a row of panels (Figure 1). The design wind pressure on this panel area is less than on most other parts of the solar array because this location is in roof Zone 1, and this panel area has only limited edge effects. (E = 1.15 because of the large 4-ft. spacing between rows at this location.) The calculation is similar to that for Location 1, except that the lesser wind pressure allows a greater spacing of attachments. Also, because the tributary area is long and narrow (10 ft. by 2.5 ft.), the width of the effective wind area is taken as one-third the span (3.3 ft. in lieu of 2.5 ft.), as shown in Figure 8 and Table 5.
6 ft
2.5 ft
PV array beam:Tributary area = 15 sfEffective wind area = 15 sf
w1
L
E=1.5 E=1.15
w2
Alternatively, conservatively assumew = w1 over length L.
wr
3 ft
2.5 ft
Attachment to roof:Tributary area = 13.75 sfEffective wind area = 13.75 sf
w3
L1
E=1.5 E=1.15
w4
L2
2.5 ft
Alternatively, conservatively assumew = w3 over length L1+L2.
wr
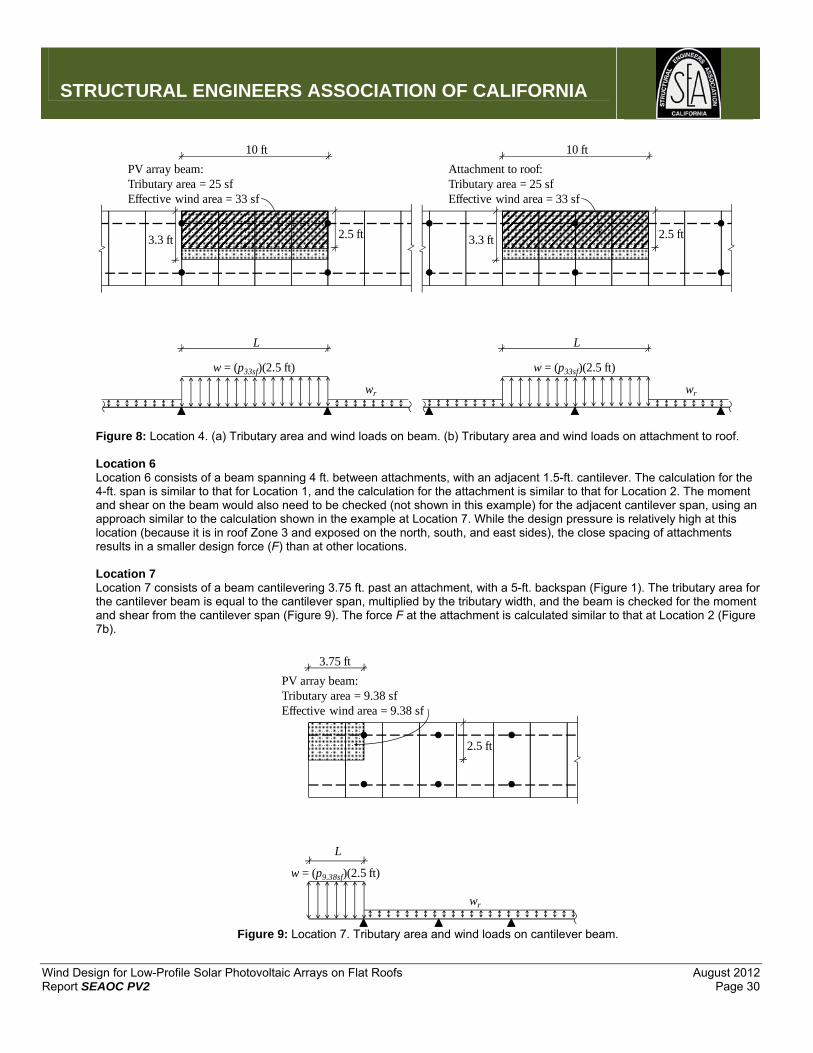
STRUCTURAL ENGINEERS ASSOCIATION OF CALIFORNIA
Wind Design for Low-Profile Solar Photovoltaic Arrays on Flat Roofs August 2012 Report SEAOC PV2 Page 30
Figure 8: Location 4. (a) Tributary area and wind loads on beam. (b) Tributary area and wind loads on attachment to roof.
Location 6 Location 6 consists of a beam spanning 4 ft. between attachments, with an adjacent 1.5-ft. cantilever. The calculation for the 4-ft. span is similar to that for Location 1, and the calculation for the attachment is similar to that for Location 2. The moment and shear on the beam would also need to be checked (not shown in this example) for the adjacent cantilever span, using an approach similar to the calculation shown in the example at Location 7. While the design pressure is relatively high at this location (because it is in roof Zone 3 and exposed on the north, south, and east sides), the close spacing of attachments results in a smaller design force (F) than at other locations. Location 7 Location 7 consists of a beam cantilevering 3.75 ft. past an attachment, with a 5-ft. backspan (Figure 1). The tributary area for the cantilever beam is equal to the cantilever span, multiplied by the tributary width, and the beam is checked for the moment and shear from the cantilever span (Figure 9). The force F at the attachment is calculated similar to that at Location 2 (Figure 7b).
Figure 9: Location 7. Tributary area and wind loads on cantilever beam.
10 ft
2.5 ft
PV array beam:Tributary area = 25 sfEffective wind area = 33 sf
3.3 ft
w = (p33sf)(2.5 ft)
L
wr
10 ft
2.5 ft
Attachment to roof:Tributary area = 25 sfEffective wind area = 33 sf
3.3 ft
w = (p33sf)(2.5 ft)
L
wr
3.75 ft
2.5 ft
PV array beam:Tributary area = 9.38 sfEffective wind area = 9.38 sf
L
w = (p9.38sf)(2.5 ft)
wr
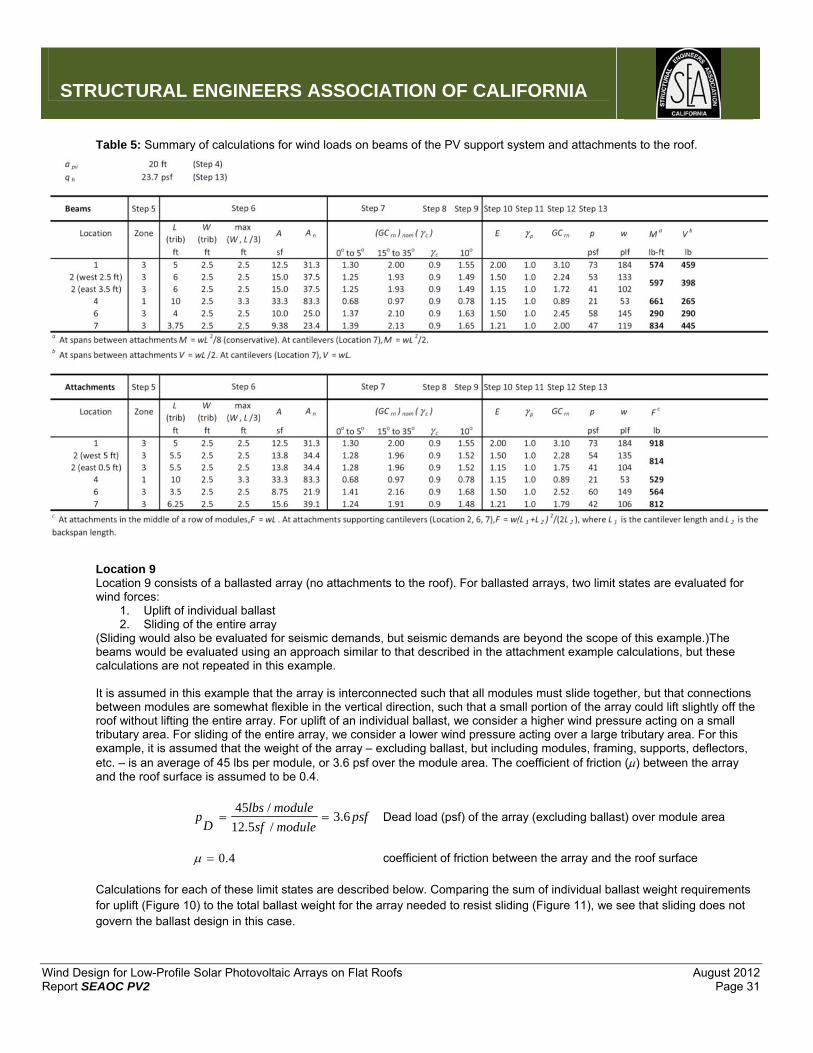
STRUCTURAL ENGINEERS ASSOCIATION OF CALIFORNIA
Wind Design for Low-Profile Solar Photovoltaic Arrays on Flat Roofs August 2012 Report SEAOC PV2 Page 31
Table 5: Summary of calculations for wind loads on beams of the PV support system and attachments to the roof.
Location 9 Location 9 consists of a ballasted array (no attachments to the roof). For ballasted arrays, two limit states are evaluated for wind forces:
1. Uplift of individual ballast 2. Sliding of the entire array
(Sliding would also be evaluated for seismic demands, but seismic demands are beyond the scope of this example.)The beams would be evaluated using an approach similar to that described in the attachment example calculations, but these calculations are not repeated in this example. It is assumed in this example that the array is interconnected such that all modules must slide together, but that connections between modules are somewhat flexible in the vertical direction, such that a small portion of the array could lift slightly off the roof without lifting the entire array. For uplift of an individual ballast, we consider a higher wind pressure acting on a small tributary area. For sliding of the entire array, we consider a lower wind pressure acting over a large tributary area. For this example, it is assumed that the weight of the array – excluding ballast, but including modules, framing, supports, deflectors, etc. – is an average of 45 lbs per module, or 3.6 psf over the module area. The coefficient of friction () between the array and the roof surface is assumed to be 0.4.
psfmodulesf
modulelbsD
p 6.3/5.12
/45 Dead load (psf) of the array (excluding ballast) over module area
4.0 coefficient of friction between the array and the roof surface
Calculations for each of these limit states are described below. Comparing the sum of individual ballast weight requirements for uplift (Figure 10) to the total ballast weight for the array needed to resist sliding (Figure 11), we see that sliding does not govern the ballast design in this case.
STRUCTURAL ENGINEERS ASSOCIATION OF CALIFORNIA
Wind Design for Low-Profile Solar Photovoltaic Arrays on Flat Roofs August 2012 Report SEAOC PV2 Page 32
1. Uplift of individual ballast For uplift of an individual ballast, the design wind pressure is based on the effective wind area corresponding to the tributary area to that ballast. As shown in Figures 10a and 10b, ballasts in this example have different tributary areas depending on the spacing between ballasts (2.5 ft in Figure 10a, 5 ft in Figure 10b) and whether they are located between rows of panels, along the edges of the array, or at the corners of the array. Based on these tributary areas, the design wind pressure (p) is calculated following the same steps as shown in previous example calculations. Similar to the attachment examples, the design wind pressure (p) is multiplied by the tributary area (At) to determine a force (F) on the ballast. The force (F) consists of a vertical component Fvert = Fcos() and a horizontal component Fhoriz = Fsin(), where is the tilt angle of the solar panels. (It is also assumed for simplicity in this example that the roof surface is not sloped. On a sloped roof, the roof slope would need to be considered in calculating Fvert, Fhoriz, and the components of the ballast weight on the roof surface.) For each ballast, the required weight is equal to the vertical component of wind force (Fvert) to that ballast, reduced by the dead load (excluding ballast) of the array tributary to that ballast, using the load combinations in the governing building code. Using strength design per the load combinations of ASCE 7-10 Section 2.3.2(6):
Required ballast weight at a given location = 9.0
9.0 tADpvertF (LRFD)
Using allowable stress design per the load combinations of ASCE 7-10 Section 2.4.1(7), the load factors of 0.6 cancel because they are the same for dead load and wind:
Required ballast weight at a given location = tADpvertF (ASD)
where At is the tributary area (sf) to the ballast being evaluated
Table 6 summarizes these calculations, and Figures 10a and 10b show the required ballast weight at each location, assuming no wind tunnel testing and no load-sharing between ballasts. Figure 10c shows example designs with reduced ballast weight, assuming that wind tunnel testing is used to justify reduced design wind pressures and that structural analysis demonstrates adequate strength and stiffness to enable load-sharing between ballasts; these examples are discussed at the end of this section. ASD load combinations result in less required ballast weight than LRFD, so the ASD values are used in the design for this example. 2. Sliding of the entire array For sliding, the design wind pressure is based on the effective wind area of the entire array (Figure 11). (It is assumed in this example that the array is interconnected such that all modules must slide together. For arrays where this is not the case, sliding should be checked for each separate part of the array, using the design wind pressure corresponding to the effective wind area for that part.) Based on this effective wind area, a design wind pressure (p) is calculated using the same steps as in previous examples, and the forces F, Fvert, and Fhoriz are calculated using the pressure (p) multiplied by the tributary area (At) of the entire array. The total ballast weight of the entire array must be adequate to resist (by friction) the horizontal component of wind force (Fhoriz) on the entire array, in combination with the vertical component (Fvert) on the entire array (which reduces the normal force), using the load combinations in the governing building code.

STRUCTURAL ENGINEERS ASSOCIATION OF CALIFORNIA
Wind Design for Low-Profile Solar Photovoltaic Arrays on Flat Roofs August 2012 Report SEAOC PV2 Page 33
Using strength design per the load combinations of ASCE 7-10 Section 2.3.2(6):
Total ballast weight for entire array > 9.0
9.0 tADpvertFhorizF
(LRFD)
Using allowable stress design per the load combinations of ASCE 7-10 Section 2.4.1(7), the load factors of 0.6 again cancel because they are the same for dead load and wind:
Total ballast weight for entire array > tADpvertFhorizF
(ASD)
where At is the tributary area (sf) of the entire array
Table 6 summarizes these calculations. As mentioned above, the sum of individual ballast weight requirements for uplift (Figure 10) is greater than the total ballast weight for the array needed to resist sliding (Figure 11), so sliding does not govern the ballast design in this case. Discussion The required ballast weight shown in Figures 10a and 10b is high, demonstrating that fully-ballasted arrays may not be feasible in all conditions, depending on the wind climate, the aerodynamic and structural properties of the array, and the location of the array on the roof. In the example with 5-ft spacing (Figure 10b), the total ballast weight is decreased somewhat because the effective wind area to each ballast is greater than for the 2.5-ft spacing, but the resulting ballast weight would still be impractical for most buildings. For this reason, fully-ballasted systems are typically designed using wind tunnel testing to justify lower design wind pressures than those from Figure 29.9-1. Whereas Figure 29.9-1 is based on a conservative envelope of potential PV support systems, favorable aerodynamic properties of a particular PV support system can result in lower wind pressures. Figure 10c shows an example design assuming that appropriate wind tunnel testing of a particular PV support system demonstrates that design wind pressures can be reduced by 50% compared to Figure 29.9-1. This example using wind tunnel studies requires the same calculations and approach as described for Figures 10a and 10b – checking uplift of individual ballast with appropriate tributary area, and sliding of the entire array – except that the design wind pressures are reduced. Also, for arrays with a robust structural framework, more detailed structural analysis can demonstrate that the PV support system has adequate strength and stiffness to enable load-sharing between ballasts. This type of structural analysis is described in the next section. The two alternative designs in Figure 10c show reduced ballast weight based on assumed wind tunnel testing (left side of Figure 10c) as well as further reductions from structural analysis (right side of Figure 10c). Comparing Figure 10c with Figure 11, we see that for this example, sliding still does not govern the ballast design when wind tunnel testing is used, but the required ballast for sliding and uplift are much closer when a robust structural framework enables load-sharing between ballasts.
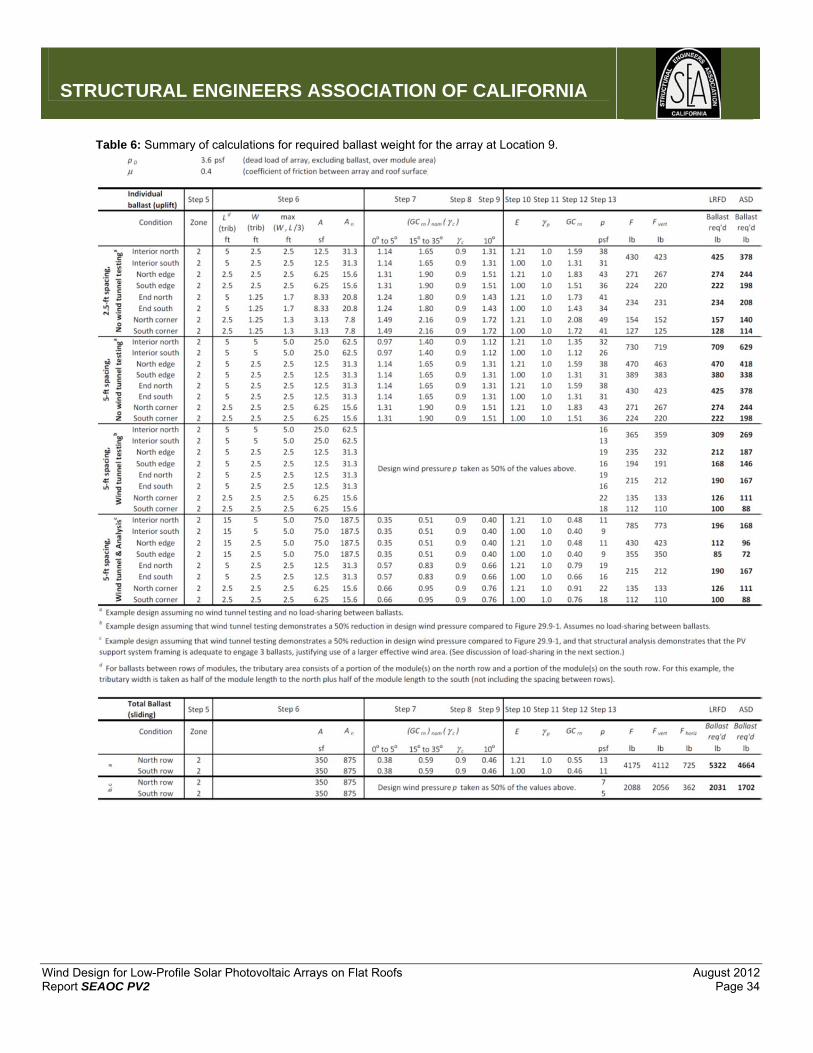
STRUCTURAL ENGINEERS ASSOCIATION OF CALIFORNIA
Wind Design for Low-Profile Solar Photovoltaic Arrays on Flat Roofs August 2012 Report SEAOC PV2 Page 34
Table 6: Summary of calculations for required ballast weight for the array at Location 9.

STRUCTURAL ENGINEERS ASSOCIATION OF CALIFORNIA
Wind Design for Low-Profile Solar Photovoltaic Arrays on Flat Roofs August 2012 Report SEAOC PV2 Page 35
(a) Ballast design with 2.5 ft spacing, assuming no wind tunnel testing and no load-sharing between ballasts. The resulting
ballast weights would be impractical for most buildings, so fully-ballasted systems are typically used with wind tunnel testing, structural analysis to demonstrate load-sharing, or less-severe wind conditions. See discussion.
(b) Ballast design with 5 ft spacing and PV system framing spanning east-west between ballasts. Total required ballast weight
is decreased because the effective wind area to each ballast is greater, but still impractical. See caption (a).
(c) Ballast designs assuming that wind tunnel testing demonstrates a 50% reduction in design pressure compared to Figure
29.9-1. Left: Assuming no load-sharing between ballasts. Right: Assuming structural analysis demonstrates that the PV system framing is adequate to engage 3 ballasts. (See discussion of load-sharing in next section.)
Figure 10: Location 9, considering four different designs. For checking uplift of individual ballast, use the effective wind area
corresponding to the tributary area to that ballast. Resulting required ballast weight (lb) indicated at each location.
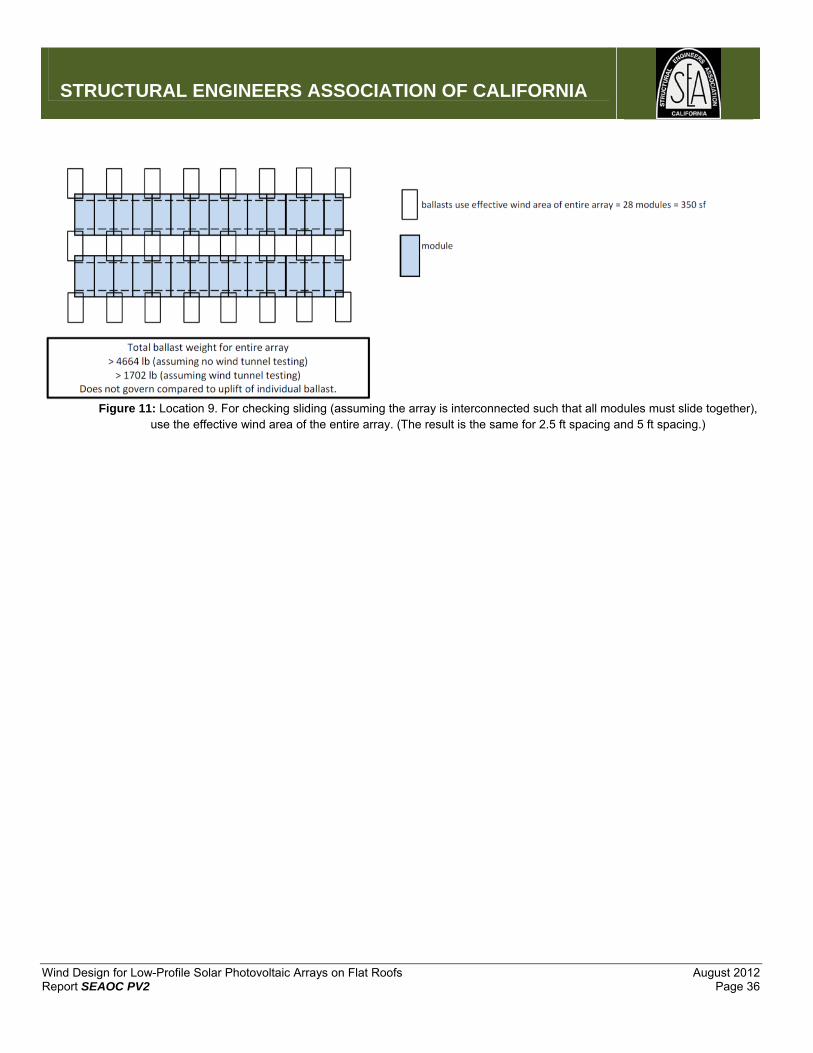
STRUCTURAL ENGINEERS ASSOCIATION OF CALIFORNIA
Wind Design for Low-Profile Solar Photovoltaic Arrays on Flat Roofs August 2012 Report SEAOC PV2 Page 36
Figure 11: Location 9. For checking sliding (assuming the array is interconnected such that all modules must slide together),
use the effective wind area of the entire array. (The result is the same for 2.5 ft spacing and 5 ft spacing.)
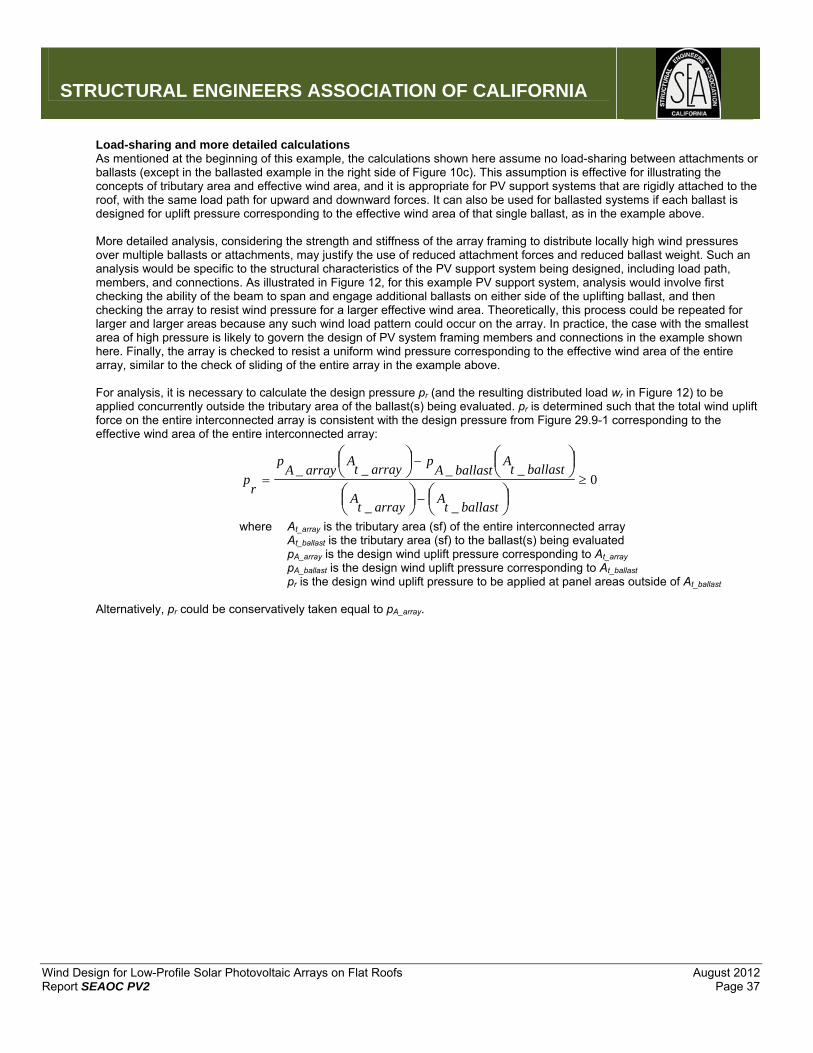
STRUCTURAL ENGINEERS ASSOCIATION OF CALIFORNIA
Wind Design for Low-Profile Solar Photovoltaic Arrays on Flat Roofs August 2012 Report SEAOC PV2 Page 37
Load-sharing and more detailed calculations As mentioned at the beginning of this example, the calculations shown here assume no load-sharing between attachments or ballasts (except in the ballasted example in the right side of Figure 10c). This assumption is effective for illustrating the concepts of tributary area and effective wind area, and it is appropriate for PV support systems that are rigidly attached to the roof, with the same load path for upward and downward forces. It can also be used for ballasted systems if each ballast is designed for uplift pressure corresponding to the effective wind area of that single ballast, as in the example above. More detailed analysis, considering the strength and stiffness of the array framing to distribute locally high wind pressures over multiple ballasts or attachments, may justify the use of reduced attachment forces and reduced ballast weight. Such an analysis would be specific to the structural characteristics of the PV support system being designed, including load path, members, and connections. As illustrated in Figure 12, for this example PV support system, analysis would involve first checking the ability of the beam to span and engage additional ballasts on either side of the uplifting ballast, and then checking the array to resist wind pressure for a larger effective wind area. Theoretically, this process could be repeated for larger and larger areas because any such wind load pattern could occur on the array. In practice, the case with the smallest area of high pressure is likely to govern the design of PV system framing members and connections in the example shown here. Finally, the array is checked to resist a uniform wind pressure corresponding to the effective wind area of the entire array, similar to the check of sliding of the entire array in the example above. For analysis, it is necessary to calculate the design pressure pr (and the resulting distributed load wr in Figure 12) to be applied concurrently outside the tributary area of the ballast(s) being evaluated. pr is determined such that the total wind uplift force on the entire interconnected array is consistent with the design pressure from Figure 29.9-1 corresponding to the effective wind area of the entire interconnected array:
0
__
____
ballasttA
arraytA
ballasttA
ballastAp
arraytA
arrayAp
rp
where At_array is the tributary area (sf) of the entire interconnected array At_ballast is the tributary area (sf) to the ballast(s) being evaluated pA_array is the design wind uplift pressure corresponding to At_array
pA_ballast is the design wind uplift pressure corresponding to At_ballast pr is the design wind uplift pressure to be applied at panel areas outside of At_ballast Alternatively, pr could be conservatively taken equal to pA_array.

STRUCTURAL ENGINEERS ASSOCIATION OF CALIFORNIA
Wind Design for Low-Profile Solar Photovoltaic Arrays on Flat Roofs August 2012 Report SEAOC PV2 Page 38
For this example PV support system, which consists of continuous framing in the east-west direction but no north-south framing, At_array is equal to length of the row multiplied by 2.5 ft. The array framing should have adequate stiffness so that the uplift displacement necessary to engage adjacent ballasts would not adversely affect the aerodynamics of the array.
*Note that effective wind area for three ballasts may be further increased such that width = 1/3 length: 15 ft. x 5 ft. = 75 sf
1) Check the load case with wind pressure corresponding to the tributary area of one ballast. If the ballast uplifts, check the
beam to span and engage additional ballasts on either side of the uplifting ballast:
2) Check the load case with wind pressure corresponding to the cumulative tributary area of the engaged ballasts (3 ballasts in this example):
3) Check the load case with uniform wind pressure corresponding to the effective wind area of the entire interconnected array (similar to the check of sliding of the entire array described in the example above):
Figure 12: More detailed analysis to evaluate load-sharing between supports.
5 ft
2.5 ft
Ballast: Tributary area= 12.5 sf for one ballast= 37.7 sf for three ballasts
ballast
5 ft5 ft
w1 = (p12.5sf)(2.5 ft)
wr1
w2 = (p75sf)(2.5 ft) wr2
wA_array = (pA_array)(2.5 ft)