wind energy in south australia - resa · trust power snowtown stage 1 2008 98.7 mw 47 $220 m agl...
TRANSCRIPT

www.invest.sa.gov.auwww.invest.sa.gov.au
January 2013
WIND ENERGY IN SOUTH AUSTRALIADeveloped in
association with Renewables SA

SOUTH AUSTRALIA - AUSTRALIA’S WIND PROVINCE
2
HISTORY
• In the past 8 years wind energy generation has increased from virtually negligible levels to approximately 28% of South Australia’s total annual electricity production in 2011/12.
• South Australia was the first jurisdiction in Australia to introduce dedicated planning guidelines for wind farms in 2003, to facilitate effective development.
• In October 2012, South Australia confirmed its position as Australian investment destination of choice via the release of “Land Use Planning Reforms”. The Reforms continue to support wind farm developments 1km from dwellings, compared with 2km in other states.
• South Australia’s land use planning system is regarded by wind farm developers as clear and efficient when compared to other states.
• South Australia achieved its Renewable Energy Target of 20% in 2011,three years in advance. A new target of 33% has been set by 2020.
KEY FACTS
$3 billionInvested in wind Invested in wind Invested in wind Invested in wind ggggenerationenerationenerationeneration
15 Wind FarmsFully operationalFully operationalFully operationalFully operational
1,203 MWInstalled capacityInstalled capacityInstalled capacityInstalled capacity
48%Of Australia’s installed wind capacityOf Australia’s installed wind capacityOf Australia’s installed wind capacityOf Australia’s installed wind capacity
World Class ResourceExcellent potentialExcellent potentialExcellent potentialExcellent potential
Regulatory EnvironmentCertain and transparentCertain and transparentCertain and transparentCertain and transparent
Destination of choiceNational best practice land planningNational best practice land planningNational best practice land planningNational best practice land planning
Sparse populationMinimal community impactMinimal community impactMinimal community impactMinimal community impact
Source: Renewables SA

CHANGES IN ELECTRICITY OUTPUT BY FUEL IN SA
3
FUEL TRANSITION PROCESS
• The structural shift in Wind Energy generation, from 1% to 28% demonstrates South Australia’s commitment to support Renewable Energy development.
• South Australia’s electricity source has traditionally been coal and gas, this mix has changed to the extent that in 2011/12 wind generation overtook coal.
Wind Wind Wind Wind 102 102 102 102 GWhGWhGWhGWh 1111%%%%
GAS GAS GAS GAS 5,915 5,915 5,915 5,915 GWhGWhGWhGWh 57%57%57%57%
COAL COAL COAL COAL 4,415 4,415 4,415 4,415 GWhGWhGWhGWh 42%42%42%42%
2003-04
WindWindWindWind3,570 3,570 3,570 3,570 GWhGWhGWhGWh 28%28%28%28%
GAS GAS GAS GAS 6,349 6,349 6,349 6,349 GwhGwhGwhGwh 49%49%49%49%
Coal Coal Coal Coal 3,007 3,007 3,007 3,007 GWhGWhGWhGWh 23%23%23%23%
2011-12
Source: Renewables SA

GLOBAL LEADERS IN WIND ENERGY GENERATION
4
GLOBAL BENCHMARK
• South Australia is a leader in a global context with the second highest market penetration of wind generation capacity per capita in the world, second only to Denmark.
• There are currently 15 operational wind farms in the State with installed capacity of 1,202.6 MW. Eight companies have invested $2.79 billion in capital expenditure in operating projects to date.
• In addition to the existing capacity, there are a further 7 sites approved and 3 under consideration. When these 10 additional sites proceed, the States installed capacity will increase to a forecast total of 3,469.6 MW
STATE POLICY COMMITMENT
• South Australia is also a leader in national Wind Power generation with 48% of Australia’s installed capacity.
• To encourage more investment, the South Australian Government has offered a 100% payroll tax rebate for labour associated with direct, on-site construction of new renewable energy projects. The rebate is up to $1 million per wind project, up until 30 June 2014.
678
553
450
348 333 320
232
135 121 111 107 102
-
100
200
300
400
500
600
700
800
Installed wind capacity (kW) per 1000 people
Global Wind Capacity per capita (kW)
1,203
432 409
282
142
12 -
200
400
600
800
1,000
1,200
1,400
SA VIC WA NSW TAS QLD
Installed Capacity (MW)
Wind Installed Capacity (April 2012)
Source: Renewables SA

RENEWABLE ENERGY TARGETS & CARBON TAX
5
CARBON PRICING SCHEME (2012)
• On July 2012, a carbon price of $23 a tonne was enacted which will be indexed for the following two years. From 1 July 2015, the carbon price will be set by the Australian and European markets.
• The carbon price provides an economy wide price signal to sectors covered by the scheme, including stationary energy.
• The carbon price and RET are complementary schemes which operate in unison to reduce the cost gap between renewable and conventional generation sources. Federal modelling shows the carbon price in isolation will not be able to drive fundamental changes to investment in the electricity generation sector until 2020-30.
NATIONAL RENEWABLE CERTIFICATE SCHEME (2001)
• The current financial support for large-scale renewable energy projects, comes from the Federal Government’s Renewable Energy (electricity) Target scheme.
• The scheme places a legal liability on wholesale purchasers of electricity to proportionally contribute to 41,000 gigawatt hours (GWh) of renewable energy per year by 2020 (20% target).
• This creates an obligation for retailers and wholesale users of electricity to surrender certificates (Large scale Generation Certificates, LGCs) equivalent to a percentage of their consumption. The prices of certificates are set in market trading between liable parties (wholesale purchasers of electricity such as electricity retailers) and producers of certificates. Generators need to be registered with the Clean Energy Regulator, who oversees the implementation of the scheme.
• The 2013 percentage is 10.42% or 19,088 GWh. -
10,000
20,000
30,000
40,000
50,000
2011 2012 2013 2014 2015 2016 2017 2018 2019 2020 2021 2022 2023
Gigawatthour (GWh)
Renewable Energy Target Generation (GWh)
Source: Clean Energy Regulator

ACCESSING GOVERNMENT SUPPORT
6
FUNDING INITIATIVES
The Governments ‘Clean Energy Future Plan’ includes the following policies:
AUSTRALIAN RENEWABLE ENERGY AGENCY (ARENA)
• On July 2011, a $3.2 billion package was announced to support the establishment of ARENA. There is currently $2.2 billion uncommitted as at November 2012.
• Funding assistance is available for:
– research, development, demonstration, deployment and commercialisation of renewable energy and related technologies.
– storage and sharing of knowledge and information about renewable energy technologies.
• Objective is to improve the competitiveness of renewable energy technologies and increasing the supply of renewable energy in Australia.
CLEAN ENERGY FINANCE CORPORATION (CEFC)
• In July 2013, a $10 billion fund will provide finance to Australia’s clean energy sector using financial products and structures.
• CEFC will not provide grants but rather are intended to be commercially oriented, and to make a return at the Federal government bond rate on investments.
• Objective is to overcome capital market barriers that hinder the financing, commercialisation and deployment of renewable energy, energy efficiency and low emissions technologies.
Source: Renewables SA

ABUNDANT WIND RESOURCES
7
WHY SOUTH AUSTRALIA
• Connection to National Electricity Market (NEM).
• Proven commitment and enviable track record.
• Open, agile and committed government.
• High level of community permission.
• Automotive and Defence industries have built a high quality manufacturing and construction base.
• Limited interconnection and peaky demand profile is a challenge for high renewables penetration but also makes SA a great test-bed for deployment.
Meters per second
Mean wind speed at 80m above ground level
BEST UNDEVELOPED WIND RESOURCE IN AUSTRALIA
• On the Eyre Peninsula, there are 4 wind zones with speeds of over 8 metres a second and >38% capacity factors.
• Potential to support over 10,000 MW of wind generation.
• This region has the potential to become the largest renewable energy province in Australia that could participate in the National Electricity Market.
South Australian Eyre Peninsula Wind Province
Source: Renewables SA

SOUTH AUSTRALIA’S WIND PRODUCTION
8
COMPANY LOCATION DATE CAPACITY TURBINES CAPEX
Transfield Services Starfish Hill 2003 34.5 MW 23 $65 m
AGL Energy Wattle Point 2005 90.8 MW 55 $180 m
Infigen Energy Lake Bonney Stage 1 2005 80.5 MW 46 $158 m
International Power Canunda 2005 46.0 MW 23 $93 m
Meridian Mount Millar 2006 70.0 MW 35 $98 m
AGL EnergyHallett Hill Stage 1 (Brown Hill)
2007 94.5 MW 45 $233 m
Energy Australia Cathedral Rocks 2007 66.0 MW 33 $160 m
Infigen Energy Lake Bonney Stage 2 2008 159.0 MW 53 $400 m
Trust Power Snowtown Stage 1 2008 98.7 MW 47 $220 m
AGL Energy Hallett Hill Stage 2 2009 71.4 MW 34 $189 m
Energy Australia Waterloo Stage 1 2010 111.0 MW 37 $300 m
Infigen Energy Lake Bonney Stage 3 2010 39.0 MW 13 $98 m
Pacific Hydro Clements Gap 2010 56.7 MW 27 $135 m
AGL EnergyHallett Hill Stage 4 (North Brown Hill)
2011 132.0 MW 63 $333 m
AGL EnergyHallett Hill Stage 5 (The Bluff)
2012 52.5 MW 25 $130 m
Total 1,202.6 MW 559 $2.79 b
OPERATING
Source: Renewables SA

SOUTH AUSTRALIA’S WIND DEVELOPMENT PROJECTS
9
DEVELOPMENT APPPROVAL - APPROVED
COMPANY LOCATION CAPACITY
AGL Energy Barn Hill 130.0 MW
Infigen Energy Woakwine 450.0 MW
International Power Willogoleche 72.0 MW
Investec Hornsdale Stage 1 315.0 MW
Pacific Hydro Carmody's Hill 140.0 MW
Trust Power Snowtown Stage 2 270.0 MW
Wind Prospect Green Point 50.0 MW
Total 1,427 MW
COMPANY LOCATION CAPACITY
Energy Australia Stony Gap 123 MW
Pacific Hydro Keyneton 105 MW
Suzlon Ceres 612 MW
Total 840 MW
DEVELOPMENT APPPROVAL - SUBMITTED
Source: Renewables SA
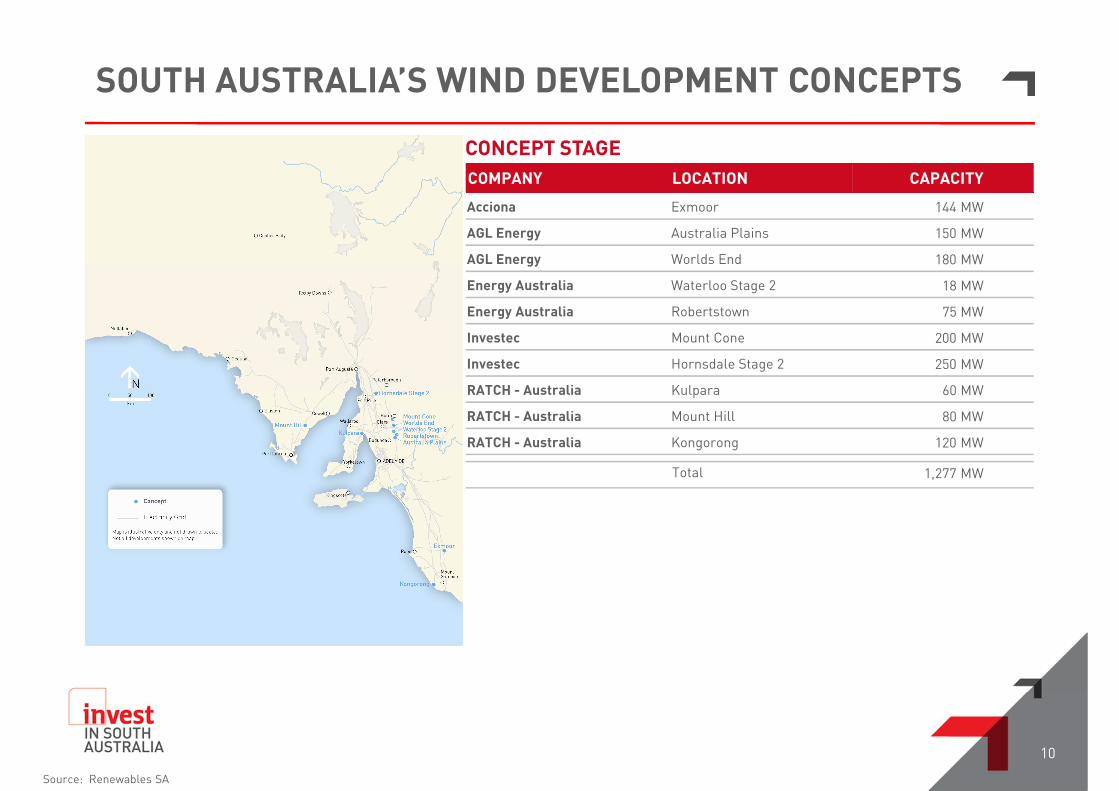
SOUTH AUSTRALIA’S WIND DEVELOPMENT CONCEPTS
10
CONCEPT STAGE
COMPANY LOCATION CAPACITY
Acciona Exmoor 144 MW
AGL Energy Australia Plains 150 MW
AGL Energy Worlds End 180 MW
Energy Australia Waterloo Stage 2 18 MW
Energy Australia Robertstown 75 MW
Investec Mount Cone 200 MW
Investec Hornsdale Stage 2 250 MW
RATCH - Australia Kulpara 60 MW
RATCH - Australia Mount Hill 80 MW
RATCH - Australia Kongorong 120 MW
Total 1,277 MW
Source: Renewables SA

LICENCING AND CONNECTION APPROVALS
11
Approximately 12 months to obtain a “Connection agreement” following a formal enquiry
APPLICATION PROCESS
Approximately 8 - 18 months to obtain a “Development Approval”
Approximately 2 months to obtain a South Australian Generation Licence
Approximately 2 months to register with the Australian Energy Market Operator
ElectraNet -Connection to ‘transmission system’ (High voltage)SA Power Networks -Connection to ‘distribution system’ (Low voltage)
ORGANISATION PURPOSE
Local Council provides a single entry point to obtain planning approval. They consult with all stakeholders, including the EPA, landholders & the community.
The ‘Essential Services Commission of South Australia’ issue licences which permit the generation of electricity.
Registering with the ‘Australian Energy Market Operator’ enables participation in the markets or trading activities conducted by AEMO. i.e. National Electricity Market
NETWORK PROVIDER
LOCAL COUNCIL
ESCOSA AEMO
NETWORK PROVIDER LOCAL COUNCIL ESCOSA AEMO(UTILITY) (MUNICIPALITY) (STATE) (FEDERAL)
Source: Renewables SA
PROJECT BANKABILITY
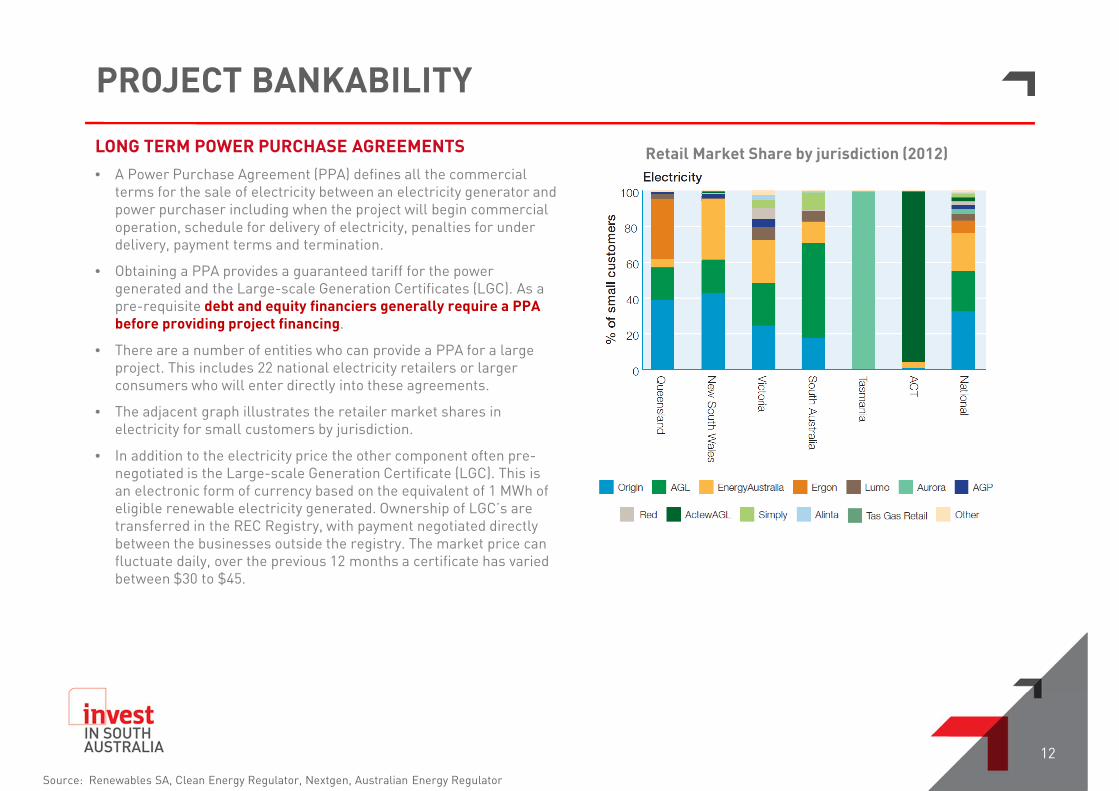
LONG TERM POWER PURCHASE AGREEMENTS
• A Power Purchase Agreement (PPA) defines all the commercial terms for the sale of electricity between an electricity generator and power purchaser including when the project will begin commercial operation, schedule for delivery of electricity, penalties for under delivery, payment terms and termination.
• Obtaining a PPA provides a guaranteed tariff for the power generated and the Large-scale Generation Certificates (LGC). As a pre-requisite debt and equity financiers generally require a PPA before providing project financing.
• There are a number of entities who can provide a PPA for a large project. This includes 22 national electricity retailers or larger consumers who will enter directly into these agreements.
• The adjacent graph illustrates the retailer market shares in electricity for small customers by jurisdiction.
• In addition to the electricity price the other component often pre-negotiated is the Large-scale Generation Certificate (LGC). This is an electronic form of currency based on the equivalent of 1 MWh of eligible renewable electricity generated. Ownership of LGC’s are transferred in the REC Registry, with payment negotiated directly between the businesses outside the registry. The market price can fluctuate daily, over the previous 12 months a certificate has varied between $30 to $45.
Source: Renewables SA, Clean Energy Regulator, Nextgen, Australian Energy Regulator
12
Retail Market Share by jurisdiction (2012)

TRANSMISSION INFRASTRUCTURE
13
NATIONAL ELECTRICITY MARKET
• Five states participate in the Australian National Electricity Market (NEM). They are joined as a national market via high voltage transmission lines called “Interconnectors”. They allow states to import electricity when demand is higher than can be met from local generation or when the price of electricity in an adjoining region is low enough to displace local supply.
• The NEM is a wholesale pool where generators bid capacity to be physically dispatched. Generators submit the volume of electricity they are prepared to produce for a specified price every five minutes, with prices settled every half hour.
• Regional Reference Node – the regional electricity spot price is set at these locations.
• Regulated Interconnector - eligible to receive a fixed annual revenue set by the Australian Competition and Consumer Commission (ACCC) and based on the value of the asset, regardless of actual usage. Revenue is collected as part of the network charges and is included in the accounts of electricity end-users.
• Market Network Service Provider - derive revenue by trading in the spot market.
Source: Renewables SA
TRANSMISSION INFRASTRUCTURE
14
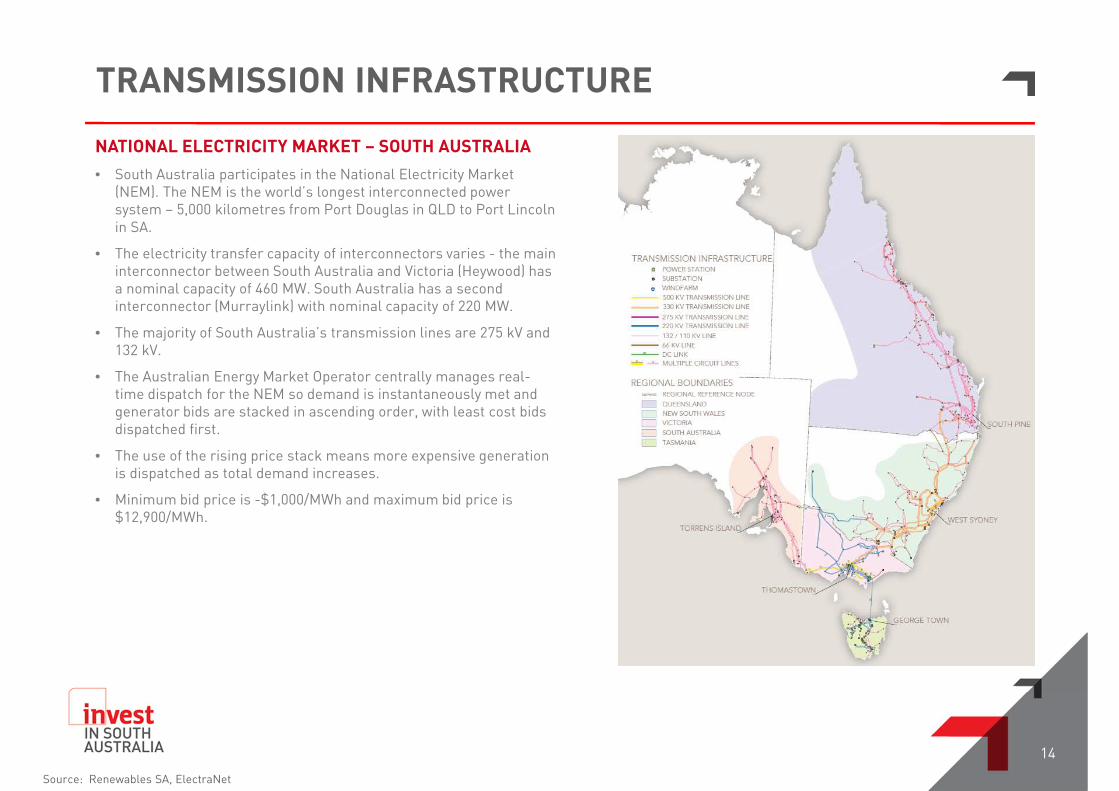
NATIONAL ELECTRICITY MARKET – SOUTH AUSTRALIA
• South Australia participates in the National Electricity Market (NEM). The NEM is the world’s longest interconnected power system – 5,000 kilometres from Port Douglas in QLD to Port Lincoln in SA.
• The electricity transfer capacity of interconnectors varies - the main interconnector between South Australia and Victoria (Heywood) has a nominal capacity of 460 MW. South Australia has a second interconnector (Murraylink) with nominal capacity of 220 MW.
• The majority of South Australia’s transmission lines are 275 kV and 132 kV.
• The Australian Energy Market Operator centrally manages real-time dispatch for the NEM so demand is instantaneously met and generator bids are stacked in ascending order, with least cost bids dispatched first.
• The use of the rising price stack means more expensive generation is dispatched as total demand increases.
• Minimum bid price is -$1,000/MWh and maximum bid price is $12,900/MWh.
Source: Renewables SA, ElectraNet

UNLOCKING WIND ENERGY IN SOUTH AUSTRALIA
15
GREEN GRID
• Eyre Peninsula has long been recognised for its significant wind energy resources. This potential can be realised by additional investment in electricity transmission.
• To encourage additional wind generation in this region, a “Green Grid” initiative has been proposed on the Eyre Peninsula, supported by a system of upgrades in South Australia and to Heywood in Victoria as part of the NEM.
• In the Green Grid Study, WorleyParsons partnered with financial firm Macquarie Capital Advisors and legal firm Baker & McKenzie to examine the business case for large scale grid investment to unlock the renewable energy potential of the Eyre Peninsula.
• The proposed configuration would allow for high capacity transmission to unlock 2,000MW of wind generation from two wind zones in Stage 1. The Stage 2 extension would unlock up to a further 2,000MW of wind generation.
• The Eyre Peninsula Green Grid would consist of a 500 kV network established allowing an average maximum of 1,000 MW, with a tolerance to accommodate almost double this amount on occasions of very high generation.
• Currently, the highest rated lines in the existing system are 275 kV in South Australia.
FUNDING REQUIREMENTS
NetworkIndicative Cost (2,000 MW)
Funded by
Eyre Peninsula Extensions $613 mFunded by consumers subject to passing a regulatory “investment” test
SA system & interconnector upgrades $840 m Funded by a developer
Source: Renewables SA, ElectraNet

WHY INVEST IN SOUTH AUSTRALIA
16
SOUTH AUSTRALIA’S COMMITMENT TO WIND
RESOURCES
• The Eyre Peninsula is Australia’s best undeveloped wind resource.
• There are many other identified highly prospective wind zones.
• Speeds of over 8 metres a second and >38% capacity factors.
HISTORY
• Proven commitment to renewable energy targets.
• 48% of Australia’s installed wind capacity.
• Established manufacturing base.
INFRASTRUCTURE
• Participation in the National Electricity Network – the world’s longest interconnected power system.
• ElectraNet has connected more wind generators to the network than any other transmission network provider in Australia.
PLANNING
• First jurisdiction in Australia to introduce specific planning guidelines for wind farms.
• Best practice planning system approval process in Australia.

www.invest.sa.gov.au
Published January 2013
The information contained in this presentation has been compiled by the Department for Manufacturing, Innovation, Trade, Resources and Energy (DMITRE) and originates from a variety of sources. Although all reasonable care has been taken in the preparation and compilation of the information, it has been provided in good faith for general information only and does not purport to be professional advice. No warranty, express or implied, is given as to the completeness, correctness, accuracy, reliability or currency of the materials.
DMITRE and the Crown in the right of the State of South Australia does not accept responsibility for and will not be held liable to any recipient of the information for any loss or damage however caused (including negligence) which may be directly or indirectly suffered as a consequence of use of these materials. DMITRE reserves the right to update, amend or supplement the information from time to time at its discretion.
18