wind farm collision risk for birds - department of the ... · pdf filewind farm collision risk...
TRANSCRIPT

Wind farm collision risk for birds
Cumulative risks for threatened and migratory species
Prepared for the Australian Government Department of the Environment and Heritage by Biosis Research Pty Ltd
Images: Dave WattsSwift Parrot White-bellied Sea-Eagle Orange-bellied Parrot Tasmanian Wedge-tailed Eagle

Introduction Assessing the impact of wind farm technology on native Australian birds has, to date, generally focused on the impact any individual wind farm may have on a protected species. This method of assessment, however, may only provide part of the broader picture where a bird species has a wide distribution, may fly over long distances, and be subject to the impacts of collisions at multiple wind farms. In 2005, Biosis Research Pty Ltd was contracted by the Australian Government to develop a means of modelling the predicted cumulative risks posed to birds from collisions with turbines at multiple wind farms. Cumulative risk modelling was then undertaken for four endangered species of birds: the Orange-bellied Parrot, the Tasmanian Wedge-tailed Eagle, the Swift Parrot and the Australian population of the White-bellied Sea-eagle. The risk of collision for a number of other birds and a bat species was also modelled, focusing on wind farm developments in Gippsland, Victoria. The study centres on threatened and migratory species under the Environment Protection and Biodiversity Conservation Act 1999. It provides an overview of the cumulative models that have been developed and an explanation of the rationale that underlies these processes. The capacities and limitations of the modelling are also outlined, as well as some recommendations provided to improve the knowledge base required to make the modelling process more widely applicable. This document incorporates 6 individual reports:
• An overview of the modelling of cumulative risks posed by multiple wind farms;
• Modelled cumulative impacts on the Orange-bellied Parrot; • Modelled cumulative impacts on the Tasmanian Wedge-tailed Eagle; • Modelled cumulative impacts on the Swift Parrot; • Modelled cumulative impacts on the White-bellied Sea-eagle; and • Risk level to select species listed under the EPBC Act of collision at
wind farms in Gippsland, Victoria.

Impacts of avian collisions with wind power turbines: an overview of the modelling of cumulative risks posed by multiple wind farms January 2006 Ian Smales

Report for Department of Environment and Heritage Impacts of avian collisions with wind power turbines: an overview of the modelling of cumulative risks posed by multiple wind farms January 2006 Ian Smales Project no. 5182
BIOSIS R E S E A R C H
Biosis Research Pty. Ltd. This document is and shall remain the property of Biosis Research Pty Ltd. The document may only be used for the purposes for which it was commissioned and in accordance with the Terms of the Engagement for the commission. Unauthorised use of this document in any form whatsoever is prohibited.
BIOSIS RESEARCH Pty. Ltd. A.B.N. 65 006 175 097 Natural & Cultural Heritage Consultants
Ballarat: 449 Doveton Street north, Ballarat VIC 3354 Ph: (03) 5331 7000 Fax: (03) 5331 7033 email: [email protected]
Melbourne: 38 Bertie Street Port Melbourne 3207 Ph: (03) 9646 9499 Fax: (03) 9646 9242 email: [email protected]

Overview of cumulative risk modelling for avian collisions at multiple wind farms – February 2006
B I O S I S R E S E A R C H Acknowledgments & Abbreviations III
ACKNOWLEDGEMENTS
Biosis Research wishes to acknowledge the contribution of the following people and organisations in preparation of this overview: Department of the Environment & Heritage, Canberra • Wayne Furler • Alex Rankin SymboliX • Dr. Stuart Muir Biosis Research Pty. Ltd. • Dr. Charles Meredith • Dr. Bob Baird
School of Botany, University of Melbourne. • Dr. Michael McCarthy – for providing the basis of the background to risk assessment.

Overview of cumulative risk modelling for avian collisions at multiple wind farms – February 2006
B I O S I S R E S E A R C H Contents IV
CONTENTS ACKNOWLEDGEMENTS ......................................................................................................... III CONTENTS ............................................................................................................................... IV 1.0 INTRODUCTION.......................................................................................................... 5 2.0 BACKGROUND TO MODELLING AS A TOOL IN RISK ASSESSMENT................. 6 3.0 RISK TO BIRDS AND BATS OF COLLISIONS WITH WIND TURBINES................. 7 4.0 COLLISION RISK MODELLING FOR INDIVIDUAL WIND FARMS .......................... 9 5.0 CUMULATIVE COLLISION RISK MODELLING FOR MULTIPLE WIND FARMS .. 12 6.0 CRITICAL IMPACT DETERMINATION FOR THREATENED TAXA....................... 15 7.0 CAPACITIES AND LIMITATIONS OF CUMULATIVE COLLISION RISK MODELLING.............................................................................................................. 16 8.0 RECOMMENDATIONS ............................................................................................. 19
8.1 Bird utilisation of wind farm sites .......................................................................... 19 8.2 Turbine avoidance behaviour by birds.................................................................. 20

Overview of cumulative risk modelling for avian collisions at multiple wind farms – February 2006
B I O S I S R E S E A R C H Introduction 5
1.0 INTRODUCTION In Australia, assessments of the risk of bird and bat collisions with wind powered electricity turbines have been made for individual wind farms as part of the evaluation of new proposals for wind farms by regulatory agencies. However, assessment of the impacts of an individual wind farm may provide only a small part of the story where a significant bird or bat species has a wide distribution, or may move long distances, and can be subject to the impacts of collisions at multiple wind farms. During 2005, Biosis Research was contracted by the Australian Government Department of Environment and Heritage to develop methodologies for modelling of the predicted cumulative risks posed to birds of collisions with turbines at multiple wind farms. Cumulative risk modelling was then undertaken for four birds, the Orange-bellied Parrot, Tasmanian Wedge-tailed Eagle, Swift Parrot and the Australian population of the White-bellied Sea-eagle (Smales 2005a, b; Smales and Muir 2005; Smales et al. 2005). The present document provides an overview of the cumulative models we have developed, along with the rationale underlying the processes. In addition, the capacities and limitations of this modelling are outlined. Finally some recommendations are made with a view to improving the knowledge base required to make the process more widely applicable.

Overview of cumulative risk modelling for avian collisions at multiple wind farms – February 2006
B I O S I S R E S E A R C H Background to Modelling as a Tool in Risk Assessment 6
2.0 BACKGROUND TO MODELLING AS A TOOL IN RISK ASSESSMENT The fundamental objective of modelling of risk is to provide a rigorous process by which probability can be assessed in a manner that can be replicated. When making predictions of risk using a model, the rationale behind the predictions is explicitly stated in the mathematics of a model, which means that the logical consistency of the predictions can be easily evaluated. This is the case regardless of the type of model used. The only real alternative to the use of a model is the use of subjective judgement to predict risks. Compared to subjective judgement, the explicit nature of inputs and rigour entailed in modelling makes models more open to analysis, criticism or modification when new information becomes available. Although there may be assumptions used and some arbitrary choices made when deciding on the structure and parameters of a model, these choices are stated explicitly when using a model but this is difficult to do when making subjective judgements. The assumptions underlying a model can be tested. Models can be used to help design data collection strategies. They can also help to resolve and avoid inconsistencies, and the rigorous analysis of data can help to clarify thoughts. Models are often also valuable for their heuristic capacities, by focussing attention on the important processes and parameters when assessing risks (Brook et al., 2002). These benefits are difficult, if not impossible to achieve with subjective judgement. Another drawback of subjective judgement is that it may lead to biased predictions of risk, and the biases vary unpredictably among people (Tversky and Kahneman, 1974; Ayton and Wright, 1994; Gigerenzer and Hoffrage, 1995; Anderson, 1998). The predictions of models tend to be less biased (Brook et al. 2000, McCarthy et al. 2004). There are thus considerable benefits to be gained by employing a model when assessing risk.

Overview of cumulative risk modelling for avian collisions at multiple wind farms – February 2006
B I O S I S R E S E A R C H Risk to Birds and Bats of Collisions with Wind Turbines 7
3.0 RISK TO BIRDS AND BATS OF COLLISIONS WITH WIND TURBINES Modern wind powered electricity generators (wind turbines) consist of three essential structures: a tower, rotors and a nacelle. Turbines are usually arrayed in the landscape with little change to pre-existing land use and thus local populations of fauna are generally not expected to alter from the levels at which they existed prior to construction of a wind farm. Note that throughout this report we refer to ‘birds’ for simplicity, however much is equally applicable to a variety of bat species. The principal risk to birds believed to be posed by turbines, is the potential for individuals to be killed as a result of collision with moving rotors. In Australia the majority of recently built and currently proposed commercial wind farms, use turbines with rotor diameters in the range of 60 to 90 metres. Rotational speeds are generally in the order of 14 to 18 rpm. Thus the tips of turbine rotors are usually travelling at speeds of between 200 and 300 km/h. In the design of current wind farms, turbines are usually micro-sited in such a way as to maximise wind values and to minimise turbulence from topographic features and other turbines. In practice, this means that there are usually large and variable spaces between turbines. The rotors and nacelle of a turbine are moved in the horizontal plane around the fixed tower in order to face into the wind. The tower and nacelle are generally large, essentially stationary elements which we consider to present negligible collision risk to birds. Clearly a risk of collision with rotors exists only when a bird is in flight within the rotor-swept-area, or may be affected by turbulence caused by rotors. Flight behaviours, including the heights at which birds fly, vary considerably between species. Many birds rarely, if ever, reach rotor-swept height, while others do so routinely and some frequently fly above that height. It is also the case that different types of flight, such as hovering, circling, vertical and horizontal flights made by different species of birds, and by birds engaged in different activities, may pose quite different risks of collision. Variations in visibility due to time of day or night and weather conditions are also likely to be influential in altering risk. For example, although little data are available, it seems likely that most collisions that do occur may be the result of a bird being struck by a rotor it did not see, rather than of a bird failing to avoid a visible turbine.
Significant bird mortality due to collisions with wind turbines is obviously not desirable and it is the intent of both the power generation industry and regulators representing the community to minimise it as far as possible. It should be noted, however, that in addition to windfarms, there are numerous other anthropogenic causes of fauna mortality, the great majority of which are entirely unquantified. Of primary concern is the potential for windfarms to impact on populations of threatened birds and bats. Predictions of collision risk for those listed species are of principal interest in the decision-making process relating to the approval of

Overview of cumulative risk modelling for avian collisions at multiple wind farms – February 2006
B I O S I S R E S E A R C H Risk to Birds and Bats of Collisions with Wind Turbines 8
new wind farms in Australia. To that end, collision risk modelling for some species has now been undertaken for a number of individual wind farm proposals. However, assessment of the risk posed by individual wind farm proposals is of limited value if undertaken in isolation, when there are multiple new proposals across the range of some threatened or listed species. As part of this study, Biosis Research has now developed approaches to permit modelling of the cumulative risk that may be posed to key species by multiple wind farms. This document provides an outline of these cumulative modelling approaches and their underlying rationale.

Overview of cumulative risk modelling for avian collisions at multiple wind farms – February 2006
B I O S I S R E S E A R C H Collision Risk Modelling for Individual Wind Farms 9
4.0 COLLISION RISK MODELLING FOR INDIVIDUAL WIND FARMS Modelling of cumulative risk is founded on the modelling of collision risk that is posed by individual wind farms. It requires initial modelling of risk for each wind farm within the range of the species of interest. For that purpose we have used the Biosis Research Deterministic Avian Collision Risk Assessment Model which is designed to determine the risk of bird-strike at individual wind farms. No other wind farm avian collision risk model currently exists in Australia, and the Biosis Research model is more advanced than those that have been used overseas. The Biosis Research model has been developed in the context of Australian birds and has been tested on a range of wind farm proposals in Australia. The model has also been subject to independent peer review by Uniquest Pty. Ltd. (University of Queensland) (Pople 2005). The model has been constantly updated and improved over the last five years and now constitutes a unique and powerful tool for assessing the potential impacts of wind farms on birds. The model is the proprietary software of Biosis Research Pty. Ltd. In usual practice, the model requires data on the site utilisation rates for each species being modelled, as collected during Point Count surveys on the site of a wind farm. These data provide inputs to the model that help characterise the activities of birds that might be at risk of collision with turbines. In the case where a species is believed to utilise a wind farm site, but data are not available because the species is not recorded during site surveys, or where data are too few and thus do not provide a reliable basis for extrapolation, a well informed scenario can be used. The risk assessment modelling takes into account a combination of variables that are specific to a particular wind farm and its site, as well as relevant characteristics of bird species of concern that may occur in the vicinity. They include the following: • The numbers of flights each bird species may make below rotor height, and
for which just the lower portion of the turbine towers present a collision risk.
• The numbers of bird flights that may occur at heights within the zone swept by the turbine rotors, and for which the moving rotor blades present a collision risk.
• The numbers of movements-at-risk of collision. Usually this parameter is based upon the data recorded for each species during timed Point Count surveys, which are then extrapolated to determine an estimated number of movements-at-risk for each species for an entire year. Account is also taken of whether particular bird species are year-round residents or annual migrants that may be either seasonally resident or simply pass through the site.
• The mean area (m2 per turbine) of the tower, nacelle and stationary rotor blades of a wind generator that present a risk to birds. A

Overview of cumulative risk modelling for avian collisions at multiple wind farms – February 2006
B I O S I S R E S E A R C H Collision Risk Modelling for Individual Wind Farms 10
multidirectional model can be used which allows for birds to move toward a turbine from any direction, or a unidirectional model can be used where bird flights are strongly directional, such as when birds are travelling along a topographic feature or are on migration. Thus the mean area presented by a turbine is determined to be between the maximum (where the direction of the bird is perpendicular to the plane of the rotor sweep) and the minimum (where the direction of the bird is parallel to the plane of the rotor sweep). The mean presented area is normally determined from turbine manufacturer’s specifications provided for individual turbine makes and models.
• The additional area (m2 per turbine) presented by the movement of rotors during the potential flight of a bird through a turbine. This is determined according to the rotational speed of the turbine blades and the length and flight speed of the bird species in question. For instance in the case of a Vestas V90 turbine and a White-bellied Sea-eagle, the rotors are approximately 43 metres long and rotate at 16.1 rpm. The average length of the bird is 800 mm and it is assigned a flight speed of 60 km/h.
• A calculation, based on the layout and total number of turbines proposed for a wind farm, of the number of turbines likely to be encountered by a bird in any one flight. This differs according to whether turbines are aligned in a linear or a clustered array on the landscape.
Numerous values for all of the above parameters, form inputs to the model for each wind farm for which a collision risk is modelled.
This initial process of modelling for individual wind farms is a critical first-step in the cumulative modelling process because of the very wide distribution of existing and proposed wind farms across the country, and the consequent differences between their designs and layouts and the habitats, diversity and behaviour of the various bird species found in these areas. All these factors mean that the risk posed to birds varies considerably between individual wind farms. The model also incorporates a measure of the estimated rate at which different species of birds might actively avoid collisions with wind turbines. For example, a 95% avoidance rate means that in one of every twenty flights a bird will take no action to avoid an obstacle in its path, while a 99% avoidance rate means that in one of every one hundred flights a bird will take no action to avoid such an obstacle. Modelled predictions of collision risk are determined for whatever avoidance rates are considered to be appropriate for a particular species, and these are often prescribed by regulatory authorities. In the model, a collision is assumed to result in death of a bird. It is also an important prerequisite that the number of birds comprising the population that interacts with each wind farm is either known or can be estimated. Results of the collision risk of a species are expressed in terms of the annual proportion of the species’ population at a particular site that are predicted to survive encounters with wind turbines. In demographic terms this is the

Overview of cumulative risk modelling for avian collisions at multiple wind farms – February 2006
B I O S I S R E S E A R C H Collision Risk Modelling for Individual Wind Farms 11
annual survivorship rate. The annual mortality rate is the simple inverse of annual survivorship rate.

Overview of cumulative risk modelling for avian collisions at multiple wind farms – February 2006
B I O S I S R E S E A R C H Cumulative Collision Risk Modelling for Multiple Wind Farms 12
5.0 CUMULATIVE COLLISION RISK MODELLING FOR MULTIPLE WIND FARMS As indicated previously, the Biosis Research Deterministic Avian Collision Risk Assessment Model was modified as part of this study to create a Multi-site Risk Assessment Model, enabling the assessment of cumulative risk posed by multiple wind farms. At present relatively few wind farms are operational in Australia. However a much larger number are in various stages of planning. For the purposes of modelling of cumulative impacts of turbine collisions on threatened bird species, we have included each existing or proposed wind farm for which sufficient information was available, across the distributional range of the species in question. This process involves the initial modelling of each wind farm, and results for each have been presented. This approach permits the cumulative model predictions to be adjusted at any time in the future to account for changes in the number, size (or other specifications) of planned wind farms. Note, however, that the cumulative model predictions provided to-date (Smales 2005a, b; Smales and Muir 2005; Smales et al. 2005) evaluate the total cumulative impact of all current and proposed wind farms, and therefore present a ‘worst-case’ scenario in which all of those wind farms for which planning had commenced in early 2005 are modelled as having a simultaneous impact. In essence, the process of determining a predicted cumulative impact on a threatened or listed species involves combining the multiple impacts predicted for all of the relevant individual wind farms. However, some key differences between the ways in which different birds use their distributional ranges must be recognised and accounted for in the cumulative process. In species that are sedentary through the course of their lives, the risk of colliding with turbines exists only for the portion(s) of the overall population whose home ranges coincide with wind farms. Thus, for example, adult Wedge-tailed Eagles Aquila audax in temperate south-eastern Australia generally reside permanently within quite stable home ranges (albeit that juveniles and subadults may be dispersive or more mobile). Accordingly, only those adult Wedge-tailed Eagles whose home ranges intersect with a wind farm, or farms, are at risk of collision. This means that the great majority of the adult population that is located elsewhere is at no risk at all. Species that migrate seasonally from one part of their distributional range to another present a different situation for modelling purposes. Most of these species vacate one area, such as their breeding range, entirely for part of the year and take up seasonal residence elsewhere. Some of these species may migrate along quite narrow flyways and, outside of the breeding season, may move about within a non-breeding range. For such species it is possible that large portions, or even the entire population, might pass through multiple wind farm sites in the course of an annual migratory cycle. The Orange-bellied Parrot Neophema chrysogaster and Swift Parrot Lathamus discolour are examples of such migrants.

Overview of cumulative risk modelling for avian collisions at multiple wind farms – February 2006
B I O S I S R E S E A R C H Cumulative Collision Risk Modelling for Multiple Wind Farms 13
As part of this study, Biosis Research developed an approach to cumulative modelling for both sedentary and migratory species. Other less predictable behaviour relating to the usage of habitats within a species’ distributional range (such as nomadism) is a feature of some Australian birds, however, such behaviour does not occur in any of the species modelled as part of this cumulative risk assessment. For sedentary, year-round resident species, the cumulative impact of collisions at wind farms on the entire species is simply the sum of the impact experienced by those parts of the population that are at risk of collisions. Thus, for modelling purposes, we first determined the annual survivorship rate for each species in question for each wind farm within that species’ range. From those rates, we then calculated the mean survivorship rate for the portion of the population interacting with all existing and proposed wind farms. The mean is weighted according to the relative numbers of birds resident at the different wind farm sites. The cumulative impact of wind farm collisions on the entire population of the species was then found by multiplying the survivorship rate for the portion of the population at risk of collisions by the background annual survivorship rate affecting the entire population in the absence of any turbine collisions. The measure of cumulative impact is the difference between the newly derived rate and the background survivorship rate for the species. For a migratory species, all or part of the population may encounter a number of wind farms during the course of its annual cycle. Accordingly, the cumulative impact of windfarms on that species is derived by assessing the probability of birds surviving their encounters with one wind farm after another, for as many wind farms as it is believed they might pass through within their distributional range. The survivorship rate for each wind farm provides a measure of the proportion of the population that survives annual encounters with that particular farm, and thus has the potential to encounter further wind farms within the species range. The cumulative species survivorship rate, for all wind farms in the species range, is thus the product of the survivorship rates of all relevant wind farms multiplied together. If a species’ population is segmented into various geographic portions during parts of the migration cycle, or only portions of the population will encounter particular wind farms, then this process may be applied only to the relevant portion(s) of the population and to applicable wind farms. Similarly, a population of a migratory species may encounter wind farms during only a portion of its annual migratory cycle. The effect of turbine collisions will then be a seasonal one. For calculating this effect in terms of an annual survivorship rate, the process is no different from calculating it for the seasonal variations in survivorship that affect populations due to natural seasonal variables of climate, breeding and non-breeding behaviours, fluctuations in predator and prey numbers, and the like. However, it is important to determine the seasonal duration of the collision effect and factor it appropriately into the annual survivorship rate.

Overview of cumulative risk modelling for avian collisions at multiple wind farms – February 2006
B I O S I S R E S E A R C H Cumulative Collision Risk Modelling for Multiple Wind Farms 14
As for sedentary species, the cumulative population survivorship rate as affected by collisions at wind farms is multiplied by the background annual survivorship rate that effects the entire population in the absence of any turbine collisions. The measure of cumulative impact is the difference between the newly derived rate and the background survivorship rate for the species. It is assumed that impacts of collision caused by an established wind farm on a bird population will function as a constant over time, provided the characteristics of the wind farms do not change. For this reason we use demographic rates (annual survivorship or mortality) to quantify impacts, because they are independent of population size and can be applied to determine the number of birds predicted to be killed, or to survive, for any given population size. Thus if the population size of the species in question alters over time then the number of birds killed would be expected to change proportional to the relevant survivorship rate. This is appropriate since wind farms being built now have operational life expectancies of about twenty years and bird populations may fluctuate over those timeframes. Where current population estimates are available (e.g. Orange-bellied Parrot, Tasmanian Wedge-tailed Eagle) the predicted altered survivorship rate due to collision with turbines has been converted into an expected mean number of annual mortalities for the current size of the population.

Overview of cumulative risk modelling for avian collisions at multiple wind farms – February 2006
B I O S I S R E S E A R C H Critical Impact Determination for Threatened Taxa 15
6.0 CRITICAL IMPACT DETERMINATION FOR THREATENED TAXA The objective of this element of the assessment is to determine the level at which the predicted cumulative effect of collision is likely to cause a ‘significant’ impact on the population of the particular species being assessed. Simplistically, the objective is to provide information for a particular species from which a threshold risk can be determined, below which the predicted cumulative impact of collisions with wind turbines could be considered ‘acceptable’ and above which the impact could be considered to be ‘unacceptable’. A meaningful way to accomplish this is to determine the level of impact on the population that would significantly increase the probability of extinction risk for the population. Population Viability Analysis (PVA) (Schaffer 1981) was used as part of this study as it is a widely accepted modelling tool used for this kind of analysis. The PVA program VORTEX 9.51 (Lacy 2005) was used to examine the degree of increased extinction risk posed to birds resulting from increased mortality due to collisions with wind turbines, as predicted by our modelling of the cumulative effects of wind farms across the species’ range. The VORTEX model used is an individualistic, stochastic model, accounting for life-stages and various mortality risks. It has been possible to undertake this analysis only for species for which comprehensive census data and demographic values are available. Population and demographic values resulting from long-term investigations of subject species were used for inputs to the PVA model. In the absence of empirical data about actual impacts on the species, any evaluation of what constitutes a critical level of impact on an endangered or listed species, is necessarily subjective and arbitrary. Nevertheless, for the purposes of this study, the approach was adopted whereby scenarios in the PVA model were re-run, increasing the environmental mortality each time. This approach allowed us to determine where the cumulative effects of turbine collisions began to have a measurable and significant effect on extinction probability. Thus our critical impact evaluation is quantified in terms of changes to extinction risk that the cumulative effects of wind turbine collisions might have on a particular species’ population.

Overview of cumulative risk modelling for avian collisions at multiple wind farms – February 2006
B I O S I S R E S E A R C H Capacities and Limitations of Cumulative Collision Risk Modelling 16
7.0 CAPACITIES AND LIMITATIONS OF CUMULATIVE COLLISION RISK MODELLING The cumulative risk model is considered to be a sophisticated and powerful tool that it is very capable of providing appropriate assessments of the collision risk for particular species associated with multiple wind turbines at different sites. For sedentary bird species there is a clear value in making determinations about the potential impact of turbine collisions at the population level, rather than assessing individual wind farms in isolation. This situation is even more applicable for migratory species, where large portions of the species population may encounter multiple wind farms. The results of cumulative impact modelling for sedentary species can be generated and interpreted in a relatively straightforward way, as impacts can generally be expected to be felt by local segments of the population-at-large. The cumulative model is, however, of perhaps greater value in assessing cumulative risk for migrant species, whose entire populations may move very widely and the evaluation of the risk is somewhat less intuitive than it is for sedentary species. The main limitation in the modelling approach relates to the quality and quantity of data available for use as inputs to the model. Principally, this limitation relates to data on bird behaviour and characteristics rather than on that for wind farms or turbines, for which engineering specifications generally provide the values required for modelling. Available data relating to bird behaviour and life cycle characteristics are generally much poorer. Wherever good data are available, such as the comprehensive values for Orange-bellied Parrot population parameters provided by the Orange-bellied Parrot Recovery Team, they have been used. However, this situation is not the case for most parameters for the majority of threatened or listed species and empirical data, at the fine level of detail required for modelling purposes, are simply not available. Accordingly, assumptions are typically required to be made for almost all variables relating to birds - including population numbers, numbers of movements they make, heights and speeds at which they fly, and the timing and likelihood that species might inhabit or visit a particular site. Investigation of bird usage of proposed wind farm sites is generally a pre-requisite to the approval process for these developments, however, comprehensive bird utilisation data, spanning a full range of seasonal and climatic variables, are available for very few wind farm sites in Australia. For most proposed wind farms no data have been collected at all. Other than a single short investigation at one wind farm (Meredith et al. 2002), no comprehensive investigation of bird or bat avoidance behaviour has been made at any wind farm in Australia. Thus for the great majority of wind farms included in this study informed assumptions are required to be used as inputs to modelling process. This is not a limitation of cumulative modelling per se but must be acknowledged. Also, this situation is not likely to improve significantly in the short-term.

Overview of cumulative risk modelling for avian collisions at multiple wind farms – February 2006
B I O S I S R E S E A R C H Capacities and Limitations of Cumulative Collision Risk Modelling 17
Uncommon species, or those that visit a region rarely, may easily be missed during site surveys. Furthermore, the level of our knowledge of bird distributions is not sufficiently detailed for us to be entirely certain how likely it is that some species will utilise a particular site. The collective ornithological knowledge within Australia is certainly not comprehensive enough at this time to provide reliable information about the frequency or numbers of a particular species that might use most sites where wind farms are proposed to be built. Given this limitation, there is usually no alternative but to make informed assumptions for modelling purposes. Obviously it is equally important to have good information about species population size and demographic characteristics in order to accurately quantify the level of impact windfarms may have on a particularly species. However, such detailed population data are available for relatively few Australian birds (Smales 2004), and even estimates of total population size are rarely based on comprehensive census data. Lack of information about actual, or even estimated, population size means that cumulative modelling is not feasible for many bird and bat species, regardless of whether they are listed or not. While this factor is not a limitation of the cumulative modelling process, it does limit its applicability to a broad range of species. It is somewhat ironic that the more reduced and concentrated a population becomes, the more accurately it can be counted and otherwise investigated. Thus quite precise population and demographic data are available for some particularly endangered species like the Orange-bellied Parrot, and have allowed those parameters of modelling to be undertaken with a relatively high degree of precision. In an independent review undertaken by Pople (2005) of the cumulative risk assessment modelling for the Orange-bellied Parrot , the modelling process itself was agreed to be sound. The main points raised, however, related to the assumptions used about aspects of the bird’s population and its utilisation of proposed windfarm sites. Clearly the accuracy of the assumptions used as inputs to the model will effect the accuracy of any predicted outcomes, and we have taken great care to ensure that any assumptions used are based on the best available information. Within the overall distributional range of most wide-ranging bird species, population density varies in accord with local variables in environmental resources. If a wind farm is situated in an area where a naturally high density of a bird species occurs, such as key breeding or feeding sites, then it is possible that mortalities due to collisions could create a local population ‘sink’ which could have a widespread impact on the species. In the modelling undertaken in this study, this aspect has been accounted for in the assumptions used in the scenarios developed for the various wind farms. However, in common with all bird data used as inputs, there is considerable potential to refine these assumptions if better data becomes available. A deterministic approach to modelling cumulative impacts has been used in our studies. Many of the parameters used in the model (such as natural changes in bird population sizes, annual variables in turbine operation due to weather, etc), will in reality be subject to natural stochastic variation. However, no data were

Overview of cumulative risk modelling for avian collisions at multiple wind farms – February 2006
B I O S I S R E S E A R C H Capacities and Limitations of Cumulative Collision Risk Modelling 18
available to provide a basis for estimating variables for such parameters. Therefore this study has we have been constrained to using single ‘average’ values as inputs which represent a measure of central tendency for the assumptions modelled. As a consequence, predicted outcomes are also expressed as single, representative values.

Overview of cumulative risk modelling for avian collisions at multiple wind farms – February 2006
B I O S I S R E S E A R C H Recommendations 19
8.0 RECOMMENDATIONS The greatest improvement in terms of modelling the impacts of wind-turbine collision risk to birds and bats (and as a consequence to modelling cumulative impacts on species), will come from better information about the utilisation of proposed wind farm sites and the behaviour of birds and bats when they are within the proximity of turbines.
8.1 Bird utilisation of wind farm sites It is recommended that emphasis be placed on improving the understanding of how key species utilise wind farm sites. Relevant information can be obtained from utilisation studies targeted at key species, which should be carried out at all proposed wind farm sites where initial investigations demonstrate the presence of key species, or where habitat for these species occurs. Key species/groups include: all threatened species for which little data presently exists, all species which are rarely recorded, all species which exist naturally at relatively low densities, waders and seabirds, species that are active during the hours of darkness, all bats, larger birds such as eagles, cranes, swans, geese and pelicans.
Currently data are too few for threatened species, all species that are rarely recorded, and all groups which exist naturally at relatively low densities, such raptors. Also, few data currently exist for some particular groups such as waders and seabirds at coastal locations. Little information has been collected about bird usage at night and some groups are certainly active during the hours of darkness. Usage by all bats is poorly understood. As a general rule, larger birds would appear likely to have higher risk of collisions, as eagles, cranes, swans, geese and pelicans frequently fly at rotor-swept-height. A combination of their large size and flight behaviours would appear to increase their probability of collision with wind turbines.

Overview of cumulative risk modelling for avian collisions at multiple wind farms – February 2006
B I O S I S R E S E A R C H Recommendations 20
8.2 Turbine avoidance behaviour by birds Little is currently known about real avoidance rates exhibited by different species – and this is a significant constraint to predictive modelling. This information can only be obtained by the accumulation of data from well designed investigations at operational wind farms, and will entail the observation of the behaviour of birds when they encounter turbines. It is strongly recommended that further study of this aspect be undertaken. Typically, at least three different avoidance rates are used in modelling collision risk for individual wind farms (as well as in this cumulative risk assessment). It is then left for a subjective judgement to be made about which rate is the most appropriate for a particular species. Predictive modelling of collision risks would be improved by removing this uncertainty. It would be valuable to pursue such research, both for its value to improvements in predictive modelling and because public perceptions about collisions may be considerably improved by the results obtained from soundly based research into this question.

Overview of cumulative risk modelling for avian collisions at multiple wind farms – February 2006
B I O S I S R E S E A R C H References 21
REFERENCES Anderson, J. L., 1998. Embracing
uncertainty: the interface of Bayesian statistics and cognitive psychology. online, URL.
Ayton, P., Wright, G., 1994. Subjective probability: what should we believe? In: Wright, G., Ayton, P. (Eds), Subjective Probability. Wiley, New York, pp. 163-184.
Brook, B.W., Burgman, M.A., Akçakaya, H.R., O’Grady, J.J., Frankham, R., 2002. Critiques of PVA ask the wrong questions: throwing the heuristic baby out with the numerical bath water. Conserv. Biol. 16, 262-263.
Brook, B.W., O’Grady, J.J., Chapman, A.P., Burgman, M.A., Akçakaya, H.R., Frankham, R., 2000. Predictive accuracy of population viability analysis in conservation biology. Nature 404, 385-387.
Gigerenzer, G., Hoffrage, U., 1995. How to improve Bayesian reasoning without instruction: frequency formats. Psychological Review 102, 684-704.
Lacy, B. 2005. http://www.vortex9.org/vortex.html
McCarthy, M.A., Keith, D., Tietjen, J., Burgman, M.A., Maunder, M., Master, L., Brook, B.W., Mace, G., Possingham, H.P., Medellin, R., Andelman, S., Regan, H., Regan, T.& Ruckelshaus, M., 2004. Comparing predictions of extinction risk using models and subjective judgement. Acta Oecologica. 26: 67 – 74.
Meredith, C., Venosta, M. and Ressom, R. 2002, Codrington Wind Farm Avian Avoidance Behaviour Report. Biosis Research report
Pople, T. 2005. Review of the Biosis modelling of the cumulative impacts of windfarms on the Orange-bellied Parrot. Report to Department of Environment and Heritage July 2005.
Schaffer, M. L. 1981. Minimum population sizes for species conservation. Bioscience 31: 131 – 134.
Smales, I. J. 2004. Population ecology of the Helmeted Honeyeater Lichenostomus melanops cassidix: long-term investigations of a threatened bird. MSc thesis. University of Melbourne.
Smales, I. 2005a. Modelled cumulative impacts on the Swift Parrot of wind farms across the species’ range in south-eastern Australia. Biosis Research report to Dept. of Environment and Heritage.
Smales, I. 2005b. Modelled cumulative impacts on the White-bellied Sea-eagle of wind farms across the species’ Australian range. Biosis Research report to Dept. of Environment and Heritage.
Smales, I. & Muir, S. 2005. Modelled cumulative impacts on the Tasmanian Wedge-tailed Eagle of wind farms across the species’ range. Biosis Research report to Dept. of Environment and Heritage.
Smales, I., Muir, S. & Meredith, C. 2005. Modelled cumulative impacts on the Orange-bellied Parrot of wind farms across the species’ range in south-eastern Australia. Biosis Research report to Dept. of Environment and Heritage.
Tversky, A. & Kahneman, D., 1974. Judgment under uncertainty: heuristics and biases. Science 185

Orange-bellied ParrotDave Watts

Modelled cumulative impacts on the Orange-bellied Parrot of wind farms across the species’ range in south-eastern Australia
December 2005
Ian Smales, Stuart Muir and Charles Meredith

Report forDepartment of Environment and Heritage
Modelled cumulative impacts on the Orange-bellied Parrot of wind farms across the species’ range in south-eastern Australia
December 2005
Ian Smales1, Stuart Muir2 and CharlesMeredith1
1 Biosis Research Pty. Ltd. 2 SymboliX
Project no. 4857
BIOSISR E S E A R C H
Biosis Research Pty. Ltd. This document is and shall remain the property of Biosis Research Pty Ltd. The document may only be used for the purposes for which it was commissioned and in accordance with the Terms of the Engagement for the commission. Unauthorised use of this document in any form whatsoever is prohibited.
BIOSIS RESEARCH Pty. Ltd. A.B.N. 65 006 175 097 Natural & Cultural Heritage Consultants
Ballarat: 449 Doveton Street north, Ballarat VIC 3354 Ph: (03) 5331 7000 Fax: (03) 5331 7033 email: [email protected]
Melbourne: 38 Bertie Street Port Melbourne 3207 Ph: (03) 9646 9499 Fax: (03) 9646 9242 email: [email protected]

Modelled cumulative impacts of wind farms on the Orange-bellied Parrot – December 2005
B I O S I S R E S E A R C H Acknowledgments & Abbreviations III
ACKNOWLEDGEMENTS
Biosis Research wishes to acknowledge the contribution of the following people and organisations in undertaking this study:
SymboliXDr Elizabeth Stark
Orange-bellied Parrot Recovery Team Mark Holdsworth – for generous provision of comprehensive census and demographic data for the Orange-bellied Parrot population
UniQuest Pty Ltd (University of Queensland) Dr Tony Pople – for review and valuable comments on an initial draft of the cumulative impacts assessment component of this report
Department of the Environment & Heritage, Canberra Wayne Furler Malcolm Forbes Nick Gascoigne Chris Murphy
Biosis Research Pty. Ltd. Dr Bob Baird
ABBREVIATIONS
DEH Department of the Environment & Heritage DPIWE Department of Primary Industries, Water and Environment,
Tasmania EPBC Act Environment Protection and Biodiversity Conservation Act 1999

Modelled cumulative impacts of wind farms on the Orange-bellied Parrot – December 2005
B I O S I S R E S E A R C H Contents IV
CONTENTS1.0 INTRODUCTION............................................................................................................ 6
1.1 Project Background ..................................................................................................... 6 1.1.1 Risk modelling.............................................................................................................. 7 1.1.2 Overview of Collision Risk Modelling for individual wind farms................................... 7 1.1.3 Presentation of results ................................................................................................. 91.1.4 Orange-bellied Parrot population size and dispersion............................................... 10 1.1.5 Orange-bellied Parrot migration................................................................................. 11
2.0 METHODS: CUMULATIVE IMPACTS MODELLING ................................................. 13 2.1 Mathematical approach to cumulative impacts modelling .................................... 13
2.2 Model inputs ............................................................................................................... 14
2.3 Parameters of wind farms ......................................................................................... 15 2.3.1 Turbines ..................................................................................................................... 15 2.3.2 Turbine number and configuration............................................................................. 18
2.4 Parameters of Orange-bellied Parrots ..................................................................... 18 2.4.1 Flight heights of Orange-bellied Parrots .................................................................... 18 2.4.2 Avoidance by Orange-bellied Parrots of wind turbines ............................................. 19 2.4.3 Modelling of Orange-bellied Parrot migration and population size............................ 20 2.4.4 Modelling of cumulative impacts relevant to subpopulations .................................... 28
3.0 RESULTS: CUMULATIVE IMPACTS MODELLING................................................... 29 3.1 Estimated impacts from modelling of individual wind farms................................ 29
3.2 Estimated cumulative impacts across the range of the Orange-bellied Parrot... 30 3.2.1 Impacts on Orange-bellied Parrot annual survivorship ............................................. 30 3.2.2 Predicted Orange-bellied Parrot mortalities............................................................... 32 3.2.3 Conclusion: Predicted Cumulative Impacts ............................................................... 34
4.0 METHODS: CRITICAL IMPACT LEVEL..................................................................... 35 4.1.1 Assumptions and inputs to the VORTEX PVA model................................................ 35 4.1.2 Incorporating the effects of wind farm collisions........................................................ 37 4.1.3 Finding a Critical Level of impact on the Orange-bellied Parrot ................................ 37
5.0 RESULTS AND DISCUSSION: PVA MODELLING OF CRITICAL IMPACT ASSESSMENT ......................................................................................................................... 39
5.1.1 Finding a Critical Level............................................................................................... 435.1.2 Caveats and Conclusions. ......................................................................................... 46
APPENDICES........................................................................................................................... 48 APPENDIX 1............................................................................................................................. 49
Cumulative Wind Farm Effects Modelling ....................................................................... 49
REFERENCES ......................................................................................................................... 55

Modelled cumulative impacts of wind farms on the Orange-bellied Parrot – December 2005
B I O S I S R E S E A R C H Contents V
Male Orange-bellied Parrot (photo I. Smales)

Modelled cumulative impacts of wind farms on the Orange-bellied Parrot – December 2005
B I O S I S R E S E A R C H Introduction 6
1.0 INTRODUCTION
1.1 Project Background
The Orange-bellied Parrot Neophema chrysogaster is listed as Endangered under provisions of the EPBC Act for threatened species. The species migrates annually between Tasmania and the coast of south-eastern mainland states of Australia. Current population estimates indicate that the population numbers fewer than 200 birds. The species range coincides with a number of recently constructed wind power generation facilities (wind farms) and more facilities are proposed. The wind farms may pose a risk of collision to the parrot as bird mortalities are known from wind farms in a variety of situations worldwide.
The project has two essential aims:
1. To predict, based upon the extant population of Orange-bellied Parrots, the potential cumulative impacts of collision risk posed by a number of wind farms across the range of the species distribution. The project utilises bird collision risk modelling to generate assessments of the cumulative risk to the endangered Orange-bellied Parrot posed by such collisions.
2. To determine a suitable assessment to provide an estimate of the level at which predicted collision is likely to present concerns for the Orange-bellied Parrot population. We term this ‘critical impact level’.
The cumulative modelling was undertaken for the species using the Biosis Research avian collision risk model. The assessment is based on existing and currently proposed wind farm sites.
Using data available for the Orange-bellied Parrot, the Biosis Research collision model is utilised to determine the bird strike risk for the parrot’s population from the wind farms in the following categories, as at 30th May 2005, within the species range:
(i) already constructed or approved;
(ii) referred under the Environment Protection and Biodiversity Conservation Act 1999 (EPBC Act) and:
. determined to be not a controlled action (NCA);
. determined to be not a controlled action manner specified (NCA-MS);
. approved under the EPBC Act; and

Modelled cumulative impacts of wind farms on the Orange-bellied Parrot – December 2005
B I O S I S R E S E A R C H Introduction 7
. proposed and currently being assessed for a determination under the EPBC Act.
1.1.1 Risk modelling
The fundamental objective of modelling of risk is to provide a rigorous process by which probability can be assessed in a manner that can be replicated.
When making predictions of risk, the rationale behind the predictions is explicitly stated in the mathematics of a model, which means that the logical consistency of the predictions can be easily evaluated. Compared to subjective judgement, this makes models more open to analysis, criticism and modification when new information becomes available. Although there may be assumptions used and some arbitrary choices when deciding on the structure and parameters of a model, these choices are stated explicitly when using a model but are difficult to disclose when making subjective judgements. Assessments based on subjective judgement can give the illusion that they are not scientifically rigorous (Burgman 2000), regardless of whether they are or not. The assumptions underlying a model can be tested. Models can be used to help design data collection strategies. They can help to resolve and avoid inconsistencies, and the rigorous analysis of data can help to clarify thoughts. Models are often most valuable for their heuristic capacities, by focussing attention on the important processes and parameters when assessing risks (Brook et al., 2002). These benefits are difficult, if not impossible to achieve with subjective judgement.
Biosis Research’s Avian Collision Risk Assessment Model is designed to determine the risk of birdstrike at individual wind farms. This model has been modified to create a Multi-site Risk Assessment Model, enabling the assessment of cumulative risk from multiple wind farms. No other windfarm avian collision risk model currently exists in Australia, and the Biosis Research model is more advanced than those that have been used overseas. The Biosis Research model has been developed in the context of Australian birds and has been tested on a range of wind farm proposals in Australia, and has been subject to independent peer review by Uniquest Pty. Ltd. (University of Queensland). It has been constantly updated and improved over the last five years and now constitutes a unique and powerful tool for assessing the potential impacts of wind farms on birds. The model is the proprietary software of Biosis Research Pty. Ltd.
1.1.2 Overview of Collision Risk Modelling for individual wind farms
In order to quantify levels of potential risk to birds of collision with turbines, Biosis Research Pty Ltd developed a detailed method for the assessment of deterministic collision risk, initially for the Woolnorth Wind Farm in Tasmania

Modelled cumulative impacts of wind farms on the Orange-bellied Parrot – December 2005
B I O S I S R E S E A R C H Introduction 8
(Meredith et al. 2000). This model has continued to be used for a variety of operating wind farms as further data has been obtained and has also been used to assess the potential impacts of wind farms at a number of further potential sites in Tasmania, Victoria, South Australia and recently in Fiji. It is applied here to determine levels of predicted risk to Orange-bellied Parrots from individual wind farms.
The model provides a measure of the potential risk at different rates at which birds might avoid collisions. For example, a 95% avoidance rate means that in one of every twenty flights a bird would hit an obstacle in its path. Clearly, birds have vastly better avoidance capacity than this and it is well established overseas that even collision-prone bird species avoid collisions with wind generators on most occasions (see Section 2.4.2, below).
In the modelling undertaken for the present project we divide the risk into two height zones according to components of wind turbine structures. These are:
1. the stationary tower below rotor height, and
2. the turbine components within the height area swept by turbine rotors
We consider that birds will avoid collision with the stationary tower below rotor height in all but the most exceptional circumstances and model for 99% avoidance rate in that height zone. For the zone within rotor-swept height (encompassing rotors, upper portion of tower and nacelle) we provide predictions for movements at risk for each of 95%, 98% and 99% avoidance rates.
In usual practice the model requires data on the utilisation rates of each species being modelled, as collected during Point Count surveys on-site. This data provides inputs to the model regarding activities of birds that might be at risk of collision with turbines. Where data is not available because a species is not recorded from a site, or where data are too few and is thus an unreliable basis for extrapolation, a well informed scenario can be used, as is the case for the present project. The risk assessment accounts for a combination of variables that are specific to the particular wind farm and to birds that inhabit the vicinity.
They include the following:
The numbers of flights for each bird species below rotor height, and for which just the lower portion of turbine towers present a collision risk.
The numbers of bird flights at heights within the zone swept by turbine rotors, and for which the upper portion of towers, nacelles and rotors present a collision risk.
The numbers of movements-at-risk of collision. Usually this parameter is

Modelled cumulative impacts of wind farms on the Orange-bellied Parrot – December 2005
B I O S I S R E S E A R C H Introduction 9
as recorded for each species during timed Point Counts, which are then extrapolated to determine an estimated number of movements-at-risk for each species for an entire year. Account is taken of whether particular bird species are year-round residents or annual migrants.
The mean area of tower (m2 per turbine), nacelle and stationary rotor blades of a wind generator that present a risk to birds. The multidirectional model used here allows for birds to move toward a turbine from any direction. Thus the mean area presented by a turbine is between the maximum (where the direction of the bird is perpendicular to the plane of the rotor sweep) and the minimum (where the direction of the bird is parallel to the plane of the rotor sweep). The mean presented area is determined from turbine specifications supplied to Biosis Research for individual turbine makes and models.
The additional area (m2 per turbine) presented by the movement of rotors during the potential flight of a bird through a turbine. This is determined according to the length and flight speed of the bird species in question. In the case of the Orange-bellied Parrot the bird’s length is set at 200 mm and its flight speed at 60 kmh.
A calculation, based on the total number of turbines proposed for the wind farm, of the number of turbines likely to be encountered by a bird in any one flight. This differs according to whether turbines form a linear or a clustered array on the landscape.
A value, or values, for each of the parameters above forms an input to the model for each wind farm for which collision risk is modelled.
1.1.3 Presentation of results
All collisions are assumed to result in death of a bird or birds. Results produced from modelling of the collision risk to Orange-bellied Parrots, of both individual wind farms and of the cumulative impacts of them all, are generally expressed here in terms of the annual proportion of the known population of the species that are predicted to survive encounters with wind turbines. On the basis of known demographic values for the current population of the species, including the numbers of birds known to exist and the annual mortality rate that is believed to be affecting the population in the absence of wind farm collisions, we also provide estimates of our predicted results in terms of the number of birds that might be affected annually.
Assessment of critical impact levels on the Orange-bellied Parrot population was undertaken using Population Viability Analysis (PVA) (Shaffer 1981). PVA outcomes are routinely measured in terms of increase or decrease in the

Modelled cumulative impacts of wind farms on the Orange-bellied Parrot – December 2005
B I O S I S R E S E A R C H Introduction 10
probability of extinction of the subject species. Thus our critical impact evaluation is quantified in terms of changes to extinction risk that the cumulative effects of wind turbine collisions might have on the Orange-bellied Parrot population.
1.1.4 Orange-bellied Parrot population size and dispersion
Population estimates for the entire known population of the Orange-bellied Parrot are based on detailed demographic data for the entire known population kindly supplied to us by Mark Holdsworth (Orange-bellied Parrot Recovery Team and DPIWE) (Table 1). The census data covers the period from the breeding season of 1998/99 to the breeding season of 2004/05. Estimates are based on re-sightings records of banded and unbanded adults and juveniles during the period from spring 1998 to autumn 2005 in the breeding range at Melaleuca, and a former natural breeding site at Birch’s Inlet, where birds have been reintroduced in recent years in Tasmania. A ratio of banded to unbanded birds for each year has been used to derive estimates, based on the sum of the two components over the seven years, for mean total size of the annual population minimum (immediate pre-breeding season in spring) and annual maximum (immediate post-breeding season). The annual maximum and minimum population sizes coincide with the autumn and spring migrations of Orange-bellied Parrots. Mean annual minimum (spring) population was 99 birds (SD = 10.22) and mean annual maximum (autumn) population was 200 birds (SD = 21.02).
Table 1 Annual minimum and maximum Orange-bellied Parrot population estimates based on
numbers of birds at commencement and conclusion of breeding seasons at Melaleuca and Birch’s Inlet
(data supplied by Orange-bellied Parrot Recovery Team Nov 2005)
Breedingseason
Estimatedannual total
population in spring (annual
minimumpopulation)
Estimatedannual total
population in autumn(annual
maximumpopulation)
Annual number of birds died
1998/99 83 184 102 1999/00 96 220 124 2000/01 107 171 64 2001/02 108 229 121 2002/03 110 212 103 2003/04 95 189 94 2004/05* 92 194 102
mean 99 200 101 SD 10.22 21.02 19.74

Modelled cumulative impacts of wind farms on the Orange-bellied Parrot – December 2005
B I O S I S R E S E A R C H Introduction 11
Note that these figures include an average of 32 (SD 9.48) Orange-bellied Parrots bred in captivity and released in spring of each of the six years since 1999 as part of the recovery effort for the species. Their mortality rate immediately after release in Tasmania has been substantially higher than that of the natural population. Thus the number of Orange-bellied Parrots that undertake the subsequent autumn migration to the mainland is believed to have generally been fewer than the maximum autumn mean of 200 birds comprising the entire population. Nonetheless, given that it is feasible that disappearance of some of those birds could be ascribed to migration rather than mortality, we used 200 as the average annual maximum in the population for the purposes of modelling.
Whilst the numbers of Orange-bellied Parrots comprising the breeding population and annual numbers of offspring are quite well known and appear to have remained relatively stable over recent years, the mainland distribution of the population during the non-breeding period remains largely unknown. The numbers of parrots reported as utilising the few well known regular locations on the mainland account for just a small fraction of the breeding population. In addition, the numbers of birds reported from those sites have declined over recent years. Clearly, a very significant portion of the population must be spending the winter period at sites that remain to be discovered.
1.1.5 Orange-bellied Parrot migration
The Orange-bellied Parrot migrates annually between its breeding range in south-west Tasmania and the coastal mainland of Victoria, South Australia and New South Wales. This annual process involves both regular migratory movements through a very large geographic range and variable periods of residence by portions of the population at different locations across the range.The timing of migratory movements is well known from annual arrival and departures dates from key locations. However, actual migratory movements have rarely been documented for a number of reasons, including the following:
the very few birds in the extant population,
the small numbers of ornithologists able to competently identify the species,
difficulties of terrain and access along much of the west coast of Tasmania,
the fact that part of the route is across Bass Strait,
a long distance of coastline in both Tasmania and the mainland along

Modelled cumulative impacts of wind farms on the Orange-bellied Parrot – December 2005
B I O S I S R E S E A R C H Introduction 12
which birds could depart or arrive,
uncertainty about the winter destination(s) of the majority of the population and,
the possibility some migration occurring at night.
It is known that the annual migration cycle commences after the breeding season, with parrots moving north from south-west Tasmania in March/April and birds appearing then in north-west Tasmania, adjacent islands and King Island. Shortly thereafter birds appear at locations along the coast of central and western Victoria and eastern South Australia. A very few individuals are reported in some years from coastal eastern Victoria and even southern NSW. A small portion of the known breeding population utilises traditional locations on the mainland during parts of each year whilst they are on the mainland. These locations include western Port Phillip Bay, especially near Point Wilson, Swan Island and nearby locations around Queenscliff and Lake Connewarre on the Bellarine Peninsula, and the Yambuk estuary in Victoria. In South Australia some birds have been sighted fairly routinely although not altogether predictably, from places like Carpenters Rocks, Picanninie Ponds and the coastal side of Canunda National Park. Occasional birds are reported from a host of other places along the coastline from west of Adelaide almost to Sydney.
The parrots disappear from most mainland locations during September and this coincides with birds appearing in south-western Tasmania. On this leg of the migration, birds are not generally reported from Bass Strait islands or north-western Tasmania and it is assumed that the southward migration proceeds rapidly, possibly taking only one or two days of travel.

Modelled cumulative impacts of wind farms on the Orange-bellied Parrot – December 2005
B I O S I S R E S E A R C H Methods: Cumulative Impacts Modelling 13
2.0 METHODS: CUMULATIVE IMPACTS MODELLING
Methods are presented here for the first aim of the project - to predict, based upon the extant population of Orange-bellied Parrots, the potential cumulative impacts of collision risk posed by a number of wind farms across the range of the species distribution.
The modelling outlined here assesses the potential risks to a bird population of collision with wind-driven electricity turbines. Other potential impacts, such as loss of habitat, increased disturbance, or other effects that may result from wind farms are not encompassed by this assessment.
2.1 Mathematical approach to cumulative impacts modelling
The mathematical approach to modelling of the potential cumulative impacts on bird populations used, along with its rationale, is provided in Appendix 1 (Cumulative Wind Farm Effects Modelling by Dr. Stuart Muir).
The Orange-bellied Parrot migrates annually between its breeding range in south-west Tasmania and the coastal mainland of Victoria, South Australia and New South Wales. This annual process involves both regular migratory movements through a very large geographic range and variable periods of residence by portions of the population at different locations across the range.Throughout the entire distributional range of the species are a number of current and proposed wind farms which may present a collision risk to the birds. The likelihood of the entire Orange-bellied Parrot population, or parts of it encountering and/or colliding with turbines is considered likely to differ according to a wide range of variables of particular wind farms and of the numbers and behaviours of the parrots. In essence, the approach taken here to modelling of potential cumulative impacts on the population has been as follows:
First, the possible impact of each wind farm on the Orange-bellied Parrot has been modelled on the basis of available information about that particular farm and an informed scenario of how part or all of the parrot’s population might interact with the wind farm annually. The impact is expressed as a mortality rate (annual probability of parrots being killed by the particular wind farm). The inverse of annual mortality is an annual survivorship rate (annual probability of parrots surviving encounters with the wind farm).
Given that parts, or all, of the population of a migratory species such as the Orange-bellied Parrot may encounter a number of wind farms during the course of its annual cycle, the cumulative effects are derived, in essence, by assessing

Modelled cumulative impacts of wind farms on the Orange-bellied Parrot – December 2005
B I O S I S R E S E A R C H Methods: Cumulative Impacts Modelling 14
the probability (P) of parrots surviving their encounters with one wind farm after another. The survivorship rate (S) of each wind farm provides a measure of the proportion of the population that survives annual encounters with that particular farm and thus has the potential to encounter another wind farm, and so forth sequentially through the geographic spread of wind farms within the range of the species. The probable population survivorship rate for multiple wind farms that may be encountered, is thus found by multiplying the survivorship rates of wind farms together. i.e the annual population survivorship of all wind farms within a particular range equates to = P(S1)P(S2)P(S3)….P(SN).
2.2 Model inputs
Inputs to the model have been determined to specifically assess the possible cumulative effects upon the Orange-bellied Parrot population posed by twenty-three existing and proposed wind farms, through the entire range of the species’ natural distribution. Specific attributes of each wind farm were provided by DEH and were augmented where required, from our own investigations.
Field investigations of the utilisation by birds of fifteen of the relevant wind farms have been undertaken previously by Biosis Research and of at least two additional sites by other workers. Results of all of those studies were checked to determine the known usage of each site by Orange-bellied Parrots. The species has been recorded at, or within close proximity to, only three of the wind farm sites (Studland Bay (Woolnorth Lot 2) in Tasmania and Nirranda South and Yambuk in Victoria) and those records are of only one or two birds at each of those locations. Orange-bellied Parrots have not been reported from any of the other sites, albeit they are known to occur quite close to some of them. As a consequence, modelling using actual utilisation rates for the species was not considered possible or reliable for any of the twenty-three sites. Thus scenarios to represent the interactions of Orange-bellied Parrots with each wind farm were used.
The specific scenario developed for each wind farm site was determined from knowledge of the size of the Orange-bellied Parrot population and its geographic and temporal use of its distributional range. Considerable gaps in knowledge of the species exist, particularly with regard to the whereabouts of the majority of the population outside of the annual breeding season, despite extensive efforts undertaken under the auspices of the Orange-bellied Parrot Recovery Team. Where assumptions were made in the absence of empirical information, we have used what we believe are valid judgements based on what is known. Parameters specific to each site were used to account for seasonal variation in the population of Orange-bellied Parrots and behaviours of parrots.
We have used a precautionary approach to input assumptions to modelling. For

Modelled cumulative impacts of wind farms on the Orange-bellied Parrot – December 2005
B I O S I S R E S E A R C H Methods: Cumulative Impacts Modelling 15
instance, Orange-bellied Parrots have not been recorded at twenty of the 23 wind farm sites under consideration despite active searching for them at most of the sites. One or two sightings of individuals have been made at the other three sites. Thus there is no informative empirical data about actual numbers or variation in numbers of birds that might reside at any site. However we have modelled on the basis that numbers of birds do spend time at the great majority of sites. The modelling here thus exceeds all actual experience. Similarly, we have modelled for birds to remain present within single mainland wind farm locations for six months - which is the longest possible duration in the annual cycle of the species that birds could remain at such a site - and longer than any birds have ever been recorded to remain at any winter location. We have intentionally adopted this approach in an attempt to err, if at all, on the basis of over- rather than underestimation of potential risks to the species.
2.3 Parameters of wind farms
Of the twenty-three wind farms considered here, eight are built and currently in operation (Breamlea, Codrington, King Island Huxley Hill Stage 1, King Island Huxley Hill Stage 2, Bluff Point (Woolnorth Lot 1), Lake Bonney Stage 1, Canunda, Toora (DEH data)). Yambuk is currently under construction and a further fourteen are not yet constructed but fall within categories (i) or (ii) of Section 1.1, above.
Key to the collision risk posed by a wind farm to Orange-bellied Parrots are both the specifications of turbines proposed to be used and configuration of turbines on the landscape.
2.3.1 Turbines
The model of turbine in use, or proposed to be used, at the various wind farms differ. The specific attributes of turbines are incorporated into the model since the different turbine types present different collision risks to birds. Differences are due to such things as the size (‘presented area’) of the structure that a bird might strike and such specifics as operational rotor speed and percentage of time that rotors are likely to turn, as dictated by variables of appropriate wind speed and maintenance downtime.
As far as we were able to determine, nine different models of turbine are currently in operation, or are proposed to be built at the twenty-three wind farms considered here. For three potential wind farms (Kongorong, Nirranda South and Jim’s Plain) we were not able to obtain a clear indication of the turbine type proposed to be used as it appeared that proponents have not yet determined which they might use. In those instances we modelled for a turbine type most

Modelled cumulative impacts of wind farms on the Orange-bellied Parrot – December 2005
B I O S I S R E S E A R C H Methods: Cumulative Impacts Modelling 16
likely to be used based on the total generating capacity planned for and from industry trends in the type of turbines being proposed. Table 2 provides information about turbines in use, or proposed for the twenty-three wind farms assessed here.
Table 2 Details of the twenty-three wind farms assessed.
Windfarm
EPBCreferralnumber(where
applicable)
POINT_X POINT_Y Number
ofturbines
Turbine model
Heemskirk 2002/678 145.121 -41.833 53 Vestas V90
Jim's Plain 2003/1162 144.838 -40.847 20 *Vestas V90
Studland Bay (Woolnorth Lot 2)
2000/12 144.925 -40.785 25 Vestas V90
Bluff Point (Woolnorth Lot 1)
2000/12 144.925 -40.785 37 Vestas V66 1.75MW
King Is. Huxley Hill Stage 1
143.893 -39.942 3 Nordex 0.25MW
King Is. Huxley Hill Stage 2
2002/570 143.893 -39.942 2 Vestas [V52 - 850] 0.85MW
Nirranda 2001/471 142.741 -38.524 28 NEG Micron 1.65MW
NirrandaSouth 2002/763 142.788 -38.561 40 * Vestas V66
Codrington 142.383 -38.174 14 AN Bonus 1.3MW
Yambuk 2000/18 141.625 -38.390 20 NEG Micron 1.65MW
Portland 3 Capescombined
2000/18 100 NEG Micron 1.65MW
Green Point 2001/529 140.883 -38.030 18 Vestas V90
Kongorong 2002/568 140.499 -37.939 20 *Vestas V90

Modelled cumulative impacts of wind farms on the Orange-bellied Parrot – December 2005
B I O S I S R E S E A R C H Methods: Cumulative Impacts Modelling 17
Windfarm
EPBCreferralnumber(where
applicable)
POINT_X POINT_Y Number
ofturbines
Turbine model
Canunda 2002/691 140.400 -37.767 23 Vestas V80 2.0MW
Lake Bonney Stage 1 2001/265 140.067 -37.417 46 Vestas V66 1.75MW
Lake Bonney Stage 2 2004/1630 140.359 -37.688 53 Vestas V90
Breamlea 144.602 -38.247 1 Westwind 60kW
Wonthaggi 2002/820 145.561 -38.614 6 REPower each turbine 2MW
Bald Hills 2002/730 145.946 -38.751 52 REPower each turbine 2MW
Dollar 2003/1110 146.166 -38.568 60 NEG Micron 1.65MW
Toora 146.407 -38.652 12 Vestas V66 1.75MW
* denotes number of turbines and turbine type used for modelling particular wind farm where manufacturer and
model of turbine not specified
Manufacturer’s specifications for wind turbine models were used to calculate attributes of each of the nine models. Sixteen dimensions for each turbine, in combination with rotor speed, were input to the model. The mean presented area [m2] of each turbine, that presents a collision risk to parrots, was calculated from specification data for both the static elements (tower and nacelle) and moving components (rotors) of each turbine structure.
The plane of a wind turbine rotor pivots in a 360 horizontal arc around the turbine tower in order to face into the wind direction. Hence, the area presenting a collision risk to a bird flying in a particular direction may vary from a maximum, in which the rotor plane is at 90 to the direction in which the bird is travelling, to a minimum in which the rotor plane is parallel with the travel direction of the bird.
To account for this variable, specifications for turbine types were used to calculate a mean area that each turbine presents to birds. The use of a mean turbine area is appropriate when the flights of birds are not correlated to any

Modelled cumulative impacts of wind farms on the Orange-bellied Parrot – December 2005
B I O S I S R E S E A R C H Methods: Cumulative Impacts Modelling 18
particular wind direction and it is thus assumed that a bird is equally likely to encounter a turbine from any direction. Strongly directional movements are made by Orange-bellied Parrots during their annual migrations, however the number of such flights is an extremely small proportion of the total number of flights made by the birds during the course of a year. For the modelling undertaken here, we are assuming that birds are resident in the vicinity of most wind farms for periods of some months during which their flights are multi-directional. Hence the use of a mean turbine area is the appropriate approach.
The area presented by a turbine does differ according to whether the rotors are stationary or are in motion. When turbines are operational and rotors are in motion, the area swept by the rotors during passage of a bird the size of an Orange-bellied Parrot is included in calculations of the presented area.
Turbine rotors do not turn when wind speed is too low (usually below about 4 m/sec) and are braked and feathered to prevent them from turning if it is too high (usually in excess of about 25m/sec), and during maintenance. During such times only the minimum area of each turbine presents a collision risk. To account for the difference in mean area presented by operational and non-operational turbines a percentage of downtime is an input to the model.
2.3.2 Turbine number and configuration
Two principal components of the collision risk represented by a particular wind farm are the number of turbines at the site and way in which they are positioned relative to each other in the landscape.
The number of turbines at each site is a simple parameter input to the model.
The layout of turbines relative to each other, in combination with the lengths and directions of flights that birds make, affects the number of turbines that a bird might be likely to encounter at the site. In relation to this, a linear array entailing a single row of turbines is quite different from a cluster of turbines. This factor is taken into account as a parameter input that can be varied according to the known layout array of each wind farm modelled.
2.4 Parameters of Orange-bellied Parrots
2.4.1 Flight heights of Orange-bellied Parrots
The height at which birds fly within a wind farm is clearly relevant to the likelihood of collision with turbines. This is due to the different heights of turbine components and of collision risks they present to birds. The moving

Modelled cumulative impacts of wind farms on the Orange-bellied Parrot – December 2005
B I O S I S R E S E A R C H Methods: Cumulative Impacts Modelling 19
rotors of a turbine are considered to present a greater risk than is the stationary tower. Whilst a variety of turbine types are involved in this assessment, the lowest point swept by rotors for the majority of them is approximately 33 metres above the ground. The largest turbines (Vestas V90) sweep up to approximately 123 metres above the ground. The height zone swept by rotors (in the case of Vesta V90 between 33 and 123 metres height) is considered to represent the zone of greatest danger to flying birds.
In studies of the utilisation of wind farm sites by birds through south-eastern Australia, we have consistently evaluated the height of each flight recorded during standard point counts. Very few data for Orange-bellied Parrots are available since the species has very rarely been recorded. However, a larger body of data has been obtained for the closely related Blue-winged Parrot Neophema chrysostoma. This indicates that Neophemas do fly within the rotor-swept-height at times although the very great majority of recorded flights are from below that zone. Flight behaviour, including height, is likely to vary according to the activity being undertaken. Parrots moving about a location in the course of routine foraging generally seem to do so at quite low heights whilst less frequent movements between sites, between feeding and roosting areas and on migration may be higher. We have assigned 25% of flights to the rotor-swept zone and 75% to the zone below rotor height. This is conservative when compared with our data for Blue-winged Parrots, in which a larger percentage of flights have generally been below rotor-swept height.
2.4.2 Avoidance by Orange-bellied Parrots of wind turbines
Note that in modelling of the cumulative impacts of collision, any collision caused by a bird striking, or being struck by, a turbine, is assumed to result in death of the bird.
The use of the term ‘avoidance’ here refers to how birds respond when they encounter a wind turbine, that is, the rate at which birds attempt to avoid colliding with the structures.
At the request of DEH, three avoidance rates are modelled: 95%, 98% and 99%. Given that static elements of a turbine (tower, nacelle, etc.) are stationary and highly visible, we take the approach of modelling the likely avoidance rate of the area presented by these parts as 99% in all scenarios. The three variable avoidance rates that are modelled relate to the area presented by moving turbine components (the area of rotors plus the area swept by rotors during the passage of a bird at a given flight speed). Complete lack of avoidance (0%) is behaviour that has not been observed in any study of bird interactions with wind turbines and would be analogous to birds flying blindly without responding to any objects within their environments. In should noted that 99% avoidance rate means that

Modelled cumulative impacts of wind farms on the Orange-bellied Parrot – December 2005
B I O S I S R E S E A R C H Methods: Cumulative Impacts Modelling 20
for every 100 flight made by a bird it will make one in which it takes no evasive action to avoid collision with a turbine. In real terms this equates to avoidance behaviour that is considerably lower than that shown by most birds in most circumstances. Absolute avoidance behaviour (100%) has been documented for some species and may be a reasonable approximation for many species in good conditions, but unlikely for some species in certain conditions.
It would seem likely that avoidance by a species with the flight characteristics of the Orange-bellied Parrot would generally be close to 100% in most conditions, but it may decrease in conditions of poor visibility, resulting in the average (mean) avoidance rate, being less than 100%. Migrating birds usually do not fly when visibility is reduced by fog or rain (Richardson 1998, Tulp et al. 1999). However, some individuals of some species do fly under these conditions and this can lead to increased collision risk. This occurs due to a decreased level of control individual birds have of their flight in very windy conditions or reduced visibility in fog/mist events (Richardson 1998). In respect of Orange-bellied Parrots specifically, there are no data, however, anecdotal evidence indicates that birds generally do not migrate in storm weather and the southward migration occurs in fine north-westerly weather conditions (Mark Holdsworth pers. comm.). This is consistent with migration behaviour as observed in birds generally (Richardson 1998). Overall, considering the range of species sampled in Australia and overseas, the consistency in avoidance rates and the absence of any documented cases lower then 95%, it is appropriate to assume that Orange-bellied Parrots will have avoidance rates in the 95%-100% range.
2.4.3 Modelling of Orange-bellied Parrot migration and population size
Records of Orange-bellied Parrots across the species’ range are strongly correlated with proximity to the coast. Virtually no records exist of the species further than five kilometres inland and by far the majority are within two kilometres of the coast. For the purposes of modelling, we have ‘confined’ the movements of parrots to a two-kilometre wide strip that is the length of the geographic range of the parrot and incorporates all of the relevant wind farms. In the model this does not mean that birds cannot interact with inland wind farms, but it artificially constrains the population to a strip of a width that appears to be realistic. This parameter of the model can thus only serve to overestimate risk to parrots by not ‘allowing’ them to fly outside of a zone which contains the wind farms.
The migration pattern and population dispersion of the Orange-bellied Parrot differ considerably according to geographic regions. For the purposes of modelling here they are considered according to the following regions:

Modelled cumulative impacts of wind farms on the Orange-bellied Parrot – December 2005
B I O S I S R E S E A R C H Methods: Cumulative Impacts Modelling 21
Region 1: South-western Tasmania, where no wind farms are proposed,
Region 2: West coastal Tasmania from Cape Sorell to Sandy Cape, where it is considered likely that the entire population migrates twice annually (autumn and spring) along the coastal strip. Currently, one wind farm is proposed and under assessment for this region.
Region 3: North-western Tasmania and western Bass Strait islands, through which the entire population is believed to pass twice annually on migration and in which a portion of the population is known to reside for some days or weeks during the northward, autumn migration. Three wind farms are operational and a further two are proposed (one listed as ‘Approved’ and one as ‘Approval not Required’ under EPBC Act) in this region.
Region 4: Coastal Victoria, eastern South Australia and southern NSW, where the entire population is believed to be dispersed during the non-breeding season.It is considered likely that birds migrating from Tasmania make their landfall somewhere in the vicinity of Cape Otway, from where portions of the population disperse to the east and to the west. Within this region, birds may be resident for variable periods at particular locations and movements may occur over parts or all of the mainland range. Throughout this region, five wind farms are operational, one is under construction and a further eleven are proposed (six listed as ‘Approved’, three as ‘Approval not Required’, and two currently being assessed under the EPBC Act).
Within these four regions a scenario was developed and modelled to ascertain a potential survivorship rate for Orange-bellied Parrots for each wind farm with which it was deemed likely that parrots might interact. A scenario was determined to reflect potential population size that might be resident in the vicinity of the particular wind farm, annual period during which it might be resident, number of annual migratory movements and numbers of parrots that might interact with the wind farm during those movements. The actual numbers of Orange-bellied Parrots and frequency of their movements for any given wind farm are unknown and, especially for the mainland, it is not clear to what extent the population might be segmented or alternatively how widely the total population ranges. Hence, we have estimated population sizes for each wind farm such that when summed they equal the total known population. Modelled assumptions about numbers of birds that might interact with any given wind farm were informed, where possible, by known usage of key locations by the species.
From the discussion above (Section 1.1.4) it is apparent that some aspects of the Orange-bellied Parrot’s migration and population size are quantifiable and can thus be modelled directly. However, a range of other aspects are not known and, for the purposes of modelling, require assumptions to be made.

Modelled cumulative impacts of wind farms on the Orange-bellied Parrot – December 2005
B I O S I S R E S E A R C H Methods: Cumulative Impacts Modelling 22
Movements by birds that are resident in the vicinity of wind farms for variable periods of time are modelled for the likelihood that they may be made in any compass direction (see Section 2.3.1, above), since actual usage patterns are not known for any of the sites.
Region 1
No consideration of Region 1 is required for the present modelling as no wind farms are proposed for the region.
Region 2
In Region 2 a single large wind farm, the Heemskirk Wind Farm, is proposed. For this region we have modelled on the assumption that the entire population may make two passes through the site of the wind farm, once on the autumn and once on the spring migration. Mean population estimates of the Orange-bellied Parrot population for the two migrations are 200 in autumn and 99 in spring (Section 1.1.4). Thus a mean value of 150 parrots was modelled as making the two flights through the wind farm.
Region 3
For Region 3 it is known that the entire population passes through the general area during both autumn and spring migrations. As for Region 2, allowance was made for a margin of overestimation of potential risk and thus a mean value of 150 parrots was modelled as making the two migratory movements through the region. Some or all of the population is known to spend a period of some days or weeks within the region during the course of the autumn migration only. Knowledge of the availability of habitat at all sites and records from detailed investigations of bird utilisation of the two Woolnorth sites, allowed some site-specific assumptions to be made.
The two operating wind farms on King Island are considered to be on habitat inappropriate for the species. In addition, records of regular occurrence, in which a portion of the parrot population usually spends some weeks in autumn on the island, are from elsewhere on the island. Hence, no potential impacts on the parrot are considered likely to be posed by the two wind farms and modelling was not undertaken for them.
During extensive field investigations at the Woolnorth Lot 1 site no Orange-bellied Parrots have been recorded and again the habitat seems unsuited to the species. No part of the population is believed to reside in the vicinity of the farm for any length of time. Nevertheless, it is possible that the entire population could pass directly through the site unnoticed during its migration. Hence we have modelled for the possibility of the entire population (mean of 150 birds)

Modelled cumulative impacts of wind farms on the Orange-bellied Parrot – December 2005
B I O S I S R E S E A R C H Methods: Cumulative Impacts Modelling 23
annually making two migratory passes through the site.
For both Studland Bay (Woolnorth Lot 2), which has been investigated on-site, and Jim’s Plain, where no studies have been undertaken, we have modelled for the possibility of one third of the population spending two weeks resident at the sites during autumn, one third of the population annually making two migratory passes through the sites and the remaining third bypassing the site altogether. The number of movements made by resident birds was set at two per day for two weeks, based on the concept that such birds might fly through the wind farm in question during daily flights to and from roost and foraging locations.
Region 4
In Region 4, the Dollar and Toora wind farms in South Gippsland are considered not to offer habitat suitable for the species and to be too far from suitable habitat to warrant modelling. Hence, no potential impacts on the parrot are considered likely to be posed by those farms and modelling was not undertaken for them.
No wind farm in this region occupies the entire coastal strip available to the species, but each encompasses a portion of that zone. Thus the number of parrots modelled as interacting with each wind farm, either during a period of residence locally or during migration through the area, has been estimated on the basis that part of the population will fly through the site and another part will bypass the wind farm.
A number of locations within this region do not directly offer suitable habitat and are geographically positioned such that it would seem unlikely that Orange-bellied Parrots would reside at the particular location for any length of time. In those instances we have modelled for the possibility of a portion of the population annually making two migratory passes through the site.
Various other sites are within close proximity of appropriate habitats where portions of the parrot’s population are recorded, but none are known to be inhabited themselves by long-term resident birds. In those cases we have modelled for the possibility that a portion of the population is resident close to the site for six months of the year. The number of movements made by such resident birds was set at two per day for an entire six months, based on the concept that such birds might fly through the wind farm in question during daily flights to and from roost and foraging locations. A further portion of the population is modelled as annually making two migratory passes through the site.
The numbers of parrots modelled as either resident or migrating through sites within Region 4 are based on the concept that the entire population migrating from Tasmania in autumn makes a landfall in the area between Cape Otway and

Modelled cumulative impacts of wind farms on the Orange-bellied Parrot – December 2005
B I O S I S R E S E A R C H Methods: Cumulative Impacts Modelling 24
the Bellarine Peninsula. We have assumed that half of the population then moves eastward along the coastline whilst the remaining half moves westward. For the modelling of cumulative impacts of multiple wind farms we make a distinction between these two sub-populations (see below Section 2.4.4). We refer to these sub-regions and populations as Region 4W (the portion from Cape Otway to the western extremity of the species’ distribution in South Australia), and Region 4E (the portion from Cape Otway to the eastern extremity of the species’ distribution in NSW). As each location where birds are known to reside for part of the non-breeding period is encountered during the migration into the mainland range by the two sub-populations we have assumed that a number of birds take up residence there whilst the rest of the birds continue eastward or westward. Thus the number of birds continuing to travel further is modelled as becoming sequentially less as birds take up residence along the route. For Region 4 we have modelled for a total of 95 birds in a western sub-population and 95 in an eastern sub-population that may interact with turbines. This total of 190 birds equates to 95% of the entire mean autumn population of Orange-bellied Parrots recorded during the seven years between 1998/99 and 2004/05 and models for that portion of the population all having some interaction with wind turbines.
The Orange-bellied Parrot scenario modelled for each wind farm is outlined in Table 3.

Mod
elle
d cu
mul
ativ
e im
pact
s of
win
d fa
rms
on th
e O
rang
e-be
llied
Par
rot –
Dec
embe
r 200
5
BIO
SIS
RE
SE
AR
CH
Met
hods
: Cum
ulat
ive
Impa
cts
Mod
ellin
g25
Tabl
e 3
Scen
ario
mod
elle
d fo
r Ora
nge-
belli
ed P
arro
t use
of w
ind
farm
s
Popu
latio
n si
zes
(num
ber o
f bird
s) m
odel
led
Win
d fa
rm
Reg
ion
Bird
utili
satio
n
stud
ied
at
the
site
Ora
nge-
belli
edPa
rrot
s &
/or
Blu
e-w
inge
d Pa
rrot
sre
cord
ed?
Type
s an
d an
nual
dur
atio
n of
O
rang
e-be
llied
Par
rot
inte
ract
ion
with
win
dfar
m
mod
elle
d
Res
iden
t po
pula
tion
for
6 m
onth
s (a
utum
n -
sprin
g,
mai
nlan
d
Res
iden
t po
pula
tion
for
2 w
eeks
(a
utum
n, N
W
Tas.
)
Pass
age
mig
rant
popu
latio
n (2
x
pass
es th
ru
site
per
ann
um)
Hee
msk
irk2
Yes
Ver
y fe
w O
BP
s,
few
BW
Ps
Pos
sibl
e m
igra
tion
pass
age
only
0
0 15
0
Jim
's P
lain
3
No
P
oten
tial r
esid
ency
by
part
of
popu
latio
n fo
r 2 w
eeks
+ m
igra
tion
pass
age
by a
dditi
onal
por
tion
of
popu
latio
n
0 50
50
Stud
land
Bay
(W
ooln
orth
Lot
2)
3 Ye
s V
ery
few
OB
Ps,
so
me
BW
Ps
Pot
entia
l res
iden
cy b
y pa
rt of
po
pula
tion
for 2
wee
ks +
mig
ratio
n pa
ssag
e by
add
ition
al p
ortio
n of
po
pula
tion
0 50
50
Blu
ff Po
int
(Woo
lnor
th L
ot 1
) 3
Yes
No
OB
Ps,
few
B
WP
sP
ossi
ble
mig
ratio
n pa
ssag
e on
ly
0 0
150
Kin
g Is
Hux
ley
Hill
St
age
1 3
No
D
ista
nt fr
om h
abita
t. N
ot re
leva
nt to
m
odel
N/A
N
/A
N/A
Kin
g Is
Hux
ley
Hill
St
age
2 3
No
D
ista
nt fr
om h
abita
t. N
ot re
leva
nt to
m
odel
N/A
N
/A
N/A
Nirr
anda
4W
Yes
V
ery
few
OB
Ps,
fe
w B
WP
s
Pot
entia
l res
iden
cy b
y pa
rt of
po
pula
tion
for 6
mon
ths
+ m
igra
tion
pass
age
by a
dditi
onal
por
tion
of
popu
latio
n
5 0
45

Mod
elle
d cu
mul
ativ
e im
pact
s of
win
d fa
rms
on th
e O
rang
e-be
llied
Par
rot –
Dec
embe
r 200
5
BIO
SIS
RE
SE
AR
CH
Met
hods
: Cum
ulat
ive
Impa
cts
Mod
ellin
g26
Popu
latio
n si
zes
(num
ber o
f bird
s) m
odel
led
Win
d fa
rm
Reg
ion
Bird
utili
satio
n
stud
ied
at
the
site
Ora
nge-
belli
edPa
rrot
s &
/or
Blu
e-w
inge
d Pa
rrot
sre
cord
ed?
Type
s an
d an
nual
dur
atio
n of
O
rang
e-be
llied
Par
rot
inte
ract
ion
with
win
dfar
m
mod
elle
d
Res
iden
t po
pula
tion
for
6 m
onth
s (a
utum
n -
sprin
g,
mai
nlan
d
Res
iden
t po
pula
tion
for
2 w
eeks
(a
utum
n, N
W
Tas.
)
Pass
age
mig
rant
popu
latio
n (2
x
pass
es th
ru
site
per
ann
um)
Nirr
anda
Sou
th
4W
Yes
N
o O
BP
s, fe
w
BW
Ps
Pot
entia
l res
iden
cy b
y pa
rt of
po
pula
tion
for 6
mon
ths
+ m
igra
tion
pass
age
by a
dditi
onal
por
tion
of
popu
latio
n
5 0
45
Cod
ringt
on4W
Y
es
No
OB
Ps,
few
B
WP
s
Pot
entia
l res
iden
cy b
y pa
rt of
po
pula
tion
for 6
mon
ths
+ m
igra
tion
pass
age
by a
dditi
onal
por
tion
of
popu
latio
n
10
0 35
Yam
buk
4W
Yes
Fe
w O
BP
s, fe
w
BW
Ps
Pot
entia
l res
iden
cy b
y pa
rt of
po
pula
tion
for 6
mon
ths
+ m
igra
tion
pass
age
by a
dditi
onal
por
tion
of
popu
latio
n
10
0 25
Port
land
3 C
apes
co
mbi
ned
4W
Yes
N
o O
BP
s, fe
w
BW
Ps
Pos
sibl
e m
igra
tion
pass
age
only
0
0 25
Gre
en P
oint
4W
Y
es
No
OB
Ps,
nu
mbe
rs o
f BW
Ps
Pot
entia
l res
iden
cy b
y pa
rt of
po
pula
tion
for 6
mon
ths
+ m
igra
tion
pass
age
by a
dditi
onal
por
tion
of
popu
latio
n
5 0
10
Kon
goro
ng4W
N
o
Pot
entia
l res
iden
cy b
y pa
rt of
po
pula
tion
for 6
mon
ths
+ m
igra
tion
pass
age
by a
dditi
onal
por
tion
of
popu
latio
n
5 0
10
Can
unda
4W
N
o
Pos
sibl
e m
igra
tion
pass
age
only
0
0 10
Lake
Bon
ney
Stag
e 1
4W
Yes
N
eith
er s
pp
reco
rded
Pos
sibl
e m
igra
tion
pass
age
only
0
0 10

Mod
elle
d cu
mul
ativ
e im
pact
s of
win
d fa
rms
on th
e O
rang
e-be
llied
Par
rot –
Dec
embe
r 200
5
BIO
SIS
RE
SE
AR
CH
Met
hods
: Cum
ulat
ive
Impa
cts
Mod
ellin
g27
Popu
latio
n si
zes
(num
ber o
f bird
s) m
odel
led
Win
d fa
rm
Reg
ion
Bird
utili
satio
n
stud
ied
at
the
site
Ora
nge-
belli
edPa
rrot
s &
/or
Blu
e-w
inge
d Pa
rrot
sre
cord
ed?
Type
s an
d an
nual
dur
atio
n of
O
rang
e-be
llied
Par
rot
inte
ract
ion
with
win
dfar
m
mod
elle
d
Res
iden
t po
pula
tion
for
6 m
onth
s (a
utum
n -
sprin
g,
mai
nlan
d
Res
iden
t po
pula
tion
for
2 w
eeks
(a
utum
n, N
W
Tas.
)
Pass
age
mig
rant
popu
latio
n (2
x
pass
es th
ru
site
per
ann
um)
Lake
Bon
ney
Stag
e 2
4W
Yes
N
eith
er s
pp
reco
rded
Pos
sibl
e m
igra
tion
pass
age
only
0
0 10
Bre
amle
a4E
N
o
Pot
entia
l res
iden
cy b
y pa
rt of
po
pula
tion
for 6
mon
ths
+ m
igra
tion
pass
age
by a
dditi
onal
por
tion
of
popu
latio
n
2 0
0
Won
thag
gi
4E
Yes
N
eith
er s
pp
reco
rded
Pot
entia
l res
iden
cy b
y pa
rt of
po
pula
tion
for 6
mon
ths
+ m
igra
tion
pass
age
by a
dditi
onal
por
tion
of
popu
latio
n
0 0
20
Bal
d H
ills
4E
Yes
N
o O
BP
s, fe
w
BW
Ps
Pos
sibl
e m
igra
tion
pass
age
only
0
0 15
Dol
lar
4E
Yes
N
o O
BP
s, fe
w
BW
Ps
Dis
tant
from
hab
itat.
Not
rele
vant
to
mod
elN
/A
N/A
N
/A
Toor
a 4E
N
o
Dis
tant
from
hab
itat.
Not
rele
vant
to
mod
elN
/A
N/A
N
/A

Modelled cumulative impacts of wind farms on the Orange-bellied Parrot – December 2005
B I O S I S R E S E A R C H Methods: Cumulative Impacts Modelling 28
2.4.4 Modelling of cumulative impacts relevant to subpopulations
In assessing the cumulative impacts of wind farms it is plausible to argue that all birds in the Orange-bellied Parrot population could encounter wind farms in western Tasmania and Bass Strait islands, as outlined above (Section 2.4.3 Regions 2 and 3). However, it appears unlikely that the entire Orange-bellied Parrot population would face risks from all of the wind farms distributed across the large mainland range in a given year. In order to account for this in modelling of cumulative impacts we have assessed the mainland range as two separate subregions (Region 4W and Region 4E, see Section 2.4.3). This concept allows modelling without the unrealistic assumption that every bird is at risk from every wind farm. The survivorship rate for the overall mainland range is thus found by first determining the survivorship rate for each subregion (i.e. the product of survivorship values of all wind farms within each subregion - see also Section 2.1 and Appendix 1). Since we have modelled population dispersion on the basis that each of these subregions accommodates half of the entire population, the survivorship rate for the two subregions is next halved and the two resulting values are then summed to obtain the overall value for the mainland (Region 4). Finally, that value is multiplied by the overall survivorship rate for Regions 2 and 3 to obtain the survivorship rate for the entire twenty-three wind farms across the species’ total range.

Modelled cumulative impacts of wind farms on the Orange-bellied Parrot – December 2005
B I O S I S R E S E A R C H Results: Cumulative Impacts Modelling 29
3.0 RESULTS: CUMULATIVE IMPACTS MODELLING
3.1 Estimated impacts from modelling of individual wind farms
The initial stage for modelling the cumulative risk of Orange-bellied Parrot collisions with wind turbines is to determine a level of risk posed by each individual wind farm. Results from this process also allow assessments to be made of the effects of any single wind farm or of any combination of farms. For the purposes of evaluating the potential impacts of current or future proposals to build wind farms this component of the process provides a valuable tool.
Predicted risk of collisions is expressed as a mean annual survivorship rate which represents the proportion of the population that is expected to survive all encounters with turbines at a given wind farm during the course of a year. Modelled survivorship rates for relevant wind farms are shown in Table 4. It has been necessary to calculate and show these values to seven significant numbers in order for differences between them to be detected. It is important that this is not to be misinterpreted to indicate any level of ‘accuracy’ in the predicted results.
Table 4 Modelled survivorship rates for wind farms presenting a collision risk to Orange-bellied
Parrots
Wind farm Survivorship rate at 95% avoidance
rate
Survivorship rate at 98% avoidance
rate
Survivorship rate at 99% avoidance
rate
Regions 2 and 3
Heemskirk 0.9999702 0.9999799 0.9999832
Jim's Plain 0.9999368 0.9999574 0.9999643
Woolnorth Lot 2 0.9999293 0.9999524 0.9999600
Woolnorth Lot 1 0.9999641 0.9999718 0.9999744
Region 4W
Nirranda 0.9986540 0.9989850 0.9990960
Nirranda South 0.9984370 0.9988000 0.9989210
Codrington 0.9980340 0.9984910 0.9986430
Yambuk 0.9970040 0.9977410 0.9979860
Portland 3 Capes 0.9998727 0.9999041 0.9999145

Modelled cumulative impacts of wind farms on the Orange-bellied Parrot – December 2005
B I O S I S R E S E A R C H Results: Cumulative Impacts Modelling 30
Wind farm Survivorship rate at 95% avoidance
rate
Survivorship rate at 98% avoidance
rate
Survivorship rate at 99% avoidance
rate
Green Point 0.9955140 0.9969750 0.9974620
Kongorong 0.9952720 0.9968110 0.9973250
Canunda 0.9999301 0.9999489 0.9999552
Lake Bonney Stage 1 0.9999200 0.9999372 0.9999429
Lake Bonney Stage 2 0.9999405 0.9995990 0.9999664
Region 4E
Breamlea 0.9997710 0.9997810 0.9997850
Wonthaggi 0.9999288 0.9999502 0.9999574
Bald Hills 0.9999001 0.9999294 0.9999392
3.2 Estimated cumulative impacts across the range of the Orange-bellied Parrot
The cumulative products of survivorship rates determined for all wind farms across the regions of the Orange-bellied Parrot’s range are provided in Table 5.
Table 5 Cumulative survivorship values for the Orange-bellied Parrot population from potential
collision risk posed by 17 wind farms in south-eastern Australia
Survivorship rate at 95%
avoidance rate
Survivorship rate at 98%
avoidance rate
Survivorship rate at 99%
avoidance rate
0.9910 0.9933 0.9944
3.2.1 Impacts on Orange-bellied Parrot annual survivorship
In order to assess the potential impact of altered survivorship rates that may be imposed on the Orange-bellied Parrot population by collisions with wind turbines it is first necessary to know the natural, background survivorship rate.
Comprehensive population data for Orange-bellied Parrots for the period from 1998/99 to 2004/05 has been provided to us by the Recovery Team (M. Holdsworth pers. comm. 2005). From that data we have determined survivorship values from the portion of the population comprised of individually colour-banded birds in the wild population, including reintroduced birds known to have survived beyond a first migration. Use of this portion of the population permits

Modelled cumulative impacts of wind farms on the Orange-bellied Parrot – December 2005
B I O S I S R E S E A R C H Results: Cumulative Impacts Modelling 31
the most accurate calculation of survivorship values.
The data for this portion of the population indicates that the mean annual survivorship rate (calculated for each year and then averaged) was 0.68 (SD = 0.10) (i.e. on average 68% of the population survive from one year to the next) for the period from 1998/99 to 2004/05 (Table 6).
McCarthy (1995) found that the annual survivorship of the wild Orange-bellied Parrot population was 0.59 (i.e. 59% of the population surviving from one year to the next). Data for the period from 1998/99 to 2004/05 thus indicates a higher background annual survivorship rate than that calculated by McCarthy for the period prior to 1995.
Orange-bellied Parrots are sedentary during the six month long annual breeding period in south-western Tasmania where there is no risk of interactions with wind farms. Hence, only the six-month period from autumn until spring, when collisions with wind turbines could occur, is relevant to determination of the background survival rate for the species for our purposes. The available data does not provide sufficient detail to determine actual survival rates for different portions of the birds’ annual cycle. Thus a constant year-round rate is assumed here for all post-fledgling birds in the population. On that basis the data gives us a background survival rate of 0.82 (SD = 0.07) for the six-month period during which birds are at risk of turbine collisions. The value is shown to four significant figures in Table 6 for the purpose of further calculations, below.
Table 6 Population and demographic values for the banded component of the Orange-bellied
Parrot population 1998/99 – 2004/05
Breedingseason
Annual populationminimum[total pre-breedingseason
population]
Annual populationmaximum[total post-breedingseason
population]
Annual survivorship
rate
Six-monthly (Autumn -
Spring)survivorship
rate
1998/99 83 106 0.7784 0.8823 1999/00 64 97 0.6568 0.8105 2000/01 81 96 0.8448 0.9191 2001/02 59 121 0.4909 0.7006 2002/03 73 108 0.6752 0.8217 2003/04 69 108 0.6375 0.7984 2004/05 68 96 0.7038 0.8389
mean 71 105 0.6839 0.8245 SD 8.58 9.13 0.10 0.07

Modelled cumulative impacts of wind farms on the Orange-bellied Parrot – December 2005
B I O S I S R E S E A R C H Results: Cumulative Impacts Modelling 32
The effect on the Orange-bellied Parrot population of survivorship values calculated here for cumulative impacts of collision risk may be determined by multiplying the background six-monthly survivorship rate by wind farm survivorship rates.
Thus, for the case of 95% avoidance rate, the cumulative effect equals 0.8170 (0.8245 x 0.9910). The equivalent annual rate for 98% avoidance rate equals 0.8189 (0.8245 x 0.9933) and for 99% avoidance rate equals 0.8198 (0.8245 x 0.9944).
In summary, it is predicted from the cumulative effects modelling process that the overall mean survival rate for the Orange-bellied Parrot may be expected to drop from a background environmental rate of 0.8245 to 0.8170, 0.8189 or 0.8198 for turbine avoidance rates of 95%, 98% and 99% respectively. These changes correspond to increases of 0.009, 0.007 or 0.006 in mortality rate.
It will immediately be seen that the rates of survivorship of turbine collisions at wind farms, predicted by our cumulative modelling, will alter survivorship rates of the Orange-bellied Parrot population from the existing background rate to only a very small degree. For all avoidance rates we have modelled, the predicted change in survivorship rates are approximately one order of magnitude less than the annual variation in the background rate as indicated by the standard deviations for background survivorship rates (Table 6).
3.2.2 Predicted Orange-bellied Parrot mortalities
A number of birds that might be killed annually by the predicted cumulative effects of collisions with wind turbines can be determined by multiplying the mean annual number of Orange-bellied Parrots that might interact with wind turbines by the predicted annual cumulative mortality rate. Note that the mortality rate is simply the inverse of the survivorship of rate.
The mean population size used here is 150 birds (i.e. equals the mean of the annual population maximum and minimum (200 + 99)/2 = 149.5) see Section 1.1.4).
For the case of 95% avoidance rate, the predicted annual cumulative mortality rate from wind turbine collisions equals 0.0090 (i.e. the inverse of the predicted annual cumulative survivorship rate (1 - 0.9910 = 0.0090). The annual number of mortalities thus equates to 1.35 birds (i.e. 150 x 0.0090 = 1.35).
For the case of 98% avoidance rate, the predicted annual cumulative mortality rate from wind turbine collisions equals 0.0067 (i.e. the inverse of the predicted annual cumulative survivorship rate (1 - 0.9933 = 0.0067). The annual number

Modelled cumulative impacts of wind farms on the Orange-bellied Parrot – December 2005
B I O S I S R E S E A R C H Results: Cumulative Impacts Modelling 33
of mortalities thus equates to 1.01 birds (i.e. 150 x 0.0067 = 1.005).
For the case of 99% avoidance rate, the predicted annual cumulative mortality rate from wind turbine collisions equals 0.0056 (i.e. the inverse of the predicted annual cumulative survivorship rate (1 - 0.9944 = 0.0056). The annual number of mortalities thus equates to 0.84 birds (i.e. 150 x 0.0056 = 0.8400).
In the entire Orange-bellied Parrot population, an average of 101 Orange-bellied Parrots have died annually in the period from 1998/99 to 2004/05 (Table 1). However the actual number has varied from 64 to 124 (SD = 19.74). Predictions of the current modelling suggest that between 1.35 and 0.84 additional parrot mortalities might result annually from the cumulative effects of wind turbine collisions across the species range if all potential wind farms were to be built. We consider that a collision avoidance rate for the species will be 99% or higher. Thus the additional mortality predicted for the cumulative effects of turbine collisions for wind farms within the range of the Orange-bellied Parrot is likely to result in the additional death of less than one bird per annum.
In a review of an early draft of this report (Pople 2005) it was suggested thatcompensatory mortality might be expected to ameliorate the effects of collisions at wind farms due to density dependent regulation of the population. In other words, birds that might fatally collide with turbines may have been birds that would have died anyway or their death might improve the survival probability of other birds. However, in order to demonstrate that the population is regulated in a density dependent fashion it would first be necessary to show that it is at equilibrium. We do not suggest that density dependence might not regulate the population, but we are not aware of any demonstrable evidence that this is the case and it is difficult to substantiate for almost any natural population (Krebs 1995). Certainly the population is now limited by a variety of influences, possibly including its fidelity to traditional relict breeding and overwintering locations and the resources provided at those sites. However such mechanistic regulators of the population do not of themselves provide evidence of density dependence. Indeed the Orange-bellied Parrot population’s substantial decline since European settlement has occurred for largely unknown reasons and current influences are also largely unknown. Despite relative stability of the population for the seven years of data we have here, the data for the period since 1999 follows some population growth resulting from initiation and continuing supplementation of the population by way of reintroductions. The reintroductions into apparently suitable former habitat at Birch’s Inlet actually provide an experimental indication that the population is not presently operating at a habitat carrying capacity and may not currently be regulated in a density dependent fashion.

Modelled cumulative impacts of wind farms on the Orange-bellied Parrot – December 2005
B I O S I S R E S E A R C H Results: Cumulative Impacts Modelling 34
3.2.3 Conclusion: Predicted Cumulative Impacts
The cumulative impacts of collision with turbines on the population of Orange-bellied Parrots predicted by the modelling undertaken here are small and it is highly likely that their effects would be masked by normal fluctuations that occur in the population due to natural environmental variables.
Mortality of Orange-bellied Parrots due to collisions with turbines may be very small – even barely noticeable - compared with natural mortality, however, we are of the view that it is nonetheless a negative impact on the species and should be offset by mitigation and conservation measures. That is preferable to assuming that density dependent regulation of the population will offset losses or that it might prevent potential growth of the population initiated by positive mitigation measures.

Modelled cumulative impacts of wind farms on the Orange-bellied Parrot – December 2005
B I O S I S R E S E A R C H Methods: Critical Impact Level 35
4.0 METHODS: CRITICAL IMPACT LEVEL The objective of this element is to determine a suitable estimation of the level at which predicted cumulative effects of collision is likely to present concerns for the Orange-bellied Parrot population.
One method is to use a Population Viability Analysis (PVA) to assess the level of impact on the population that would significantly increase the probability of extinction risk to the population. Simplistically, the objective would be to determine a threshold extinction risk below which the impact of predicted collisions with wind turbines would be considered ‘acceptable’ and above which the impact would be considered to be ‘unacceptable’.
We have used the Population Viability Analysis tool, VORTEX (v9.51), to examine the difference in extinction risk posed to the Orange-bellied Parrot resulting from increased mortality due to collisions with wind turbines as predicted by our modelling of the cumulative effects of wind farms across the species’ range. The VORTEX model used is an individualistic, stochastic model, accounting for life-stages and various mortality risks. It was possible to undertake this analysis for the Orange-bellied Parrot only because comprehensive census data for population has been obtained by the Orange-bellied Parrot Recovery Program since 1998 (Holdsworth, pers. comm.) and was made available to us. Population and demographic values from the data were used for input to the PVA model. A life-table was constructed from these to derive life-expectancy values.
In the absence of empirical data about actual impacts on the species, any evaluation of what constitutes a critical level of impact on an endangered species or population, will necessarily be subjective and arbitrary and we are not in a position to mandate a threshold level for ‘acceptable’ risk. Nevertheless, by re-running scenarios, increasing the environmental mortality each time, we were able to determine where the cumulative effects of wind farms (under the refinements and assumptions of our greatly simplified PVA – see below) began to make a measurable and significant effect.
4.1.1 Assumptions and inputs to the VORTEX PVA model
The modelling assumed that there is a single Orange-bellied Parrot population of an initial population size of 99 birds (i.e. the recent mean population size at the commencement of annual breeding seasons). A stable age distribution was used and a sex ratio of 3 males : 2 females was used.
Simulations were run for 100 years and for 1000 iterations per scenario.

Modelled cumulative impacts of wind farms on the Orange-bellied Parrot – December 2005
B I O S I S R E S E A R C H Methods: Critical Impact Level 36
Environmental variation in reproduction and mortality was considered to be concordant. An upper habitat carrying capacity of 500 Orange-bellied Parrots was used.
Extinction was defined as occurring in a simulation if the population was reduced to only one gender.
The parrots were defined as monogamous, but capable of re-pairing rapidly after the death of a previous partner. It was assumed that the age of first breeding was at one year and was the same for both males and females. Maximum breeding age for both sexes was set at a mean of ten years of age (Table 7).
Table 7 Putative life-table for Orange-bellied Parrot population based on life-history and
survivorship attributes provided by Orange-bellied Parrot Recovery Team (2005).
Age of life-stage
increment(years)
Life stage Annual
survivorship rate (Sx)
Cumulative cohort
survivorship rate (Sx)
Meannumber of
individuals of annualcohort
surviving
hatch 1010 - 1 Juvenile S 0.50 0.50 51 1 - 2 Adult 1 S 0.68 0.34 34 2 - 3 Adult 2 S 0.68 0.23 23 3 - 4 Adult 3 S 0.68 0.16 16 4 - 5 Adult 4 S 0.68 0.11 11 5 - 6 Adult 5 S 0.68 0.07 7 6 - 7 Adult 6 S 0.68 0.05 5 7 - 8 Adult 7 S 0.68 0.03 3 8 - 9 Adult 8 S 0.68 0.02 2
9 - 10 Adult 9 S 0.68 0.02 2 10 - 11 Adult 10 S 0.68 0.01 1 11 - 12 Adult 11 S 0.68 0.01 1 12 - 13 Adult 12 S 0.68 0.00 0
Annual survivorship rate for both sexes from hatch to one year of age was 0.50. For all adults it was 0.68. Environmental variation in annual survivorship for all ages and both sexes was set at 0.10 (Table 6).

Modelled cumulative impacts of wind farms on the Orange-bellied Parrot – December 2005
B I O S I S R E S E A R C H Methods: Critical Impact Level 37
Based on data supplied, fecundity rates used for those females producing progeny were:
6.00 percent of females produce 1 progeny in an average year 10.00 percent of females produce 2 progeny in an average year 24.00 percent of females produce 3 progeny in an average year 33.00 percent of females produce 4 progeny in an average year 23.00 percent of females produce 5 progeny in an average year 4.00 percent of females produce 6 progeny in an average year
Deterministic population growth rate values are critical for understanding the observed dynamics. (see Section 5.0 Results and Discussion: PVA Modelling of Critical Impact Assessment for discussion). The relevant values are:
r = 0.043 lambda = 1.044
R0 = 1.129 Generation time for females and males = 2.82 years.
No information was available about the possible influences of negative stochastic effects such wildfire, storm events during migrations or disease nor of unpredictable positive events like eruptions of favoured foods.Likewise, we were not able to incorporate any effects of inbreeding depression on a small population, or the influences of ‘harvest’ of birds into a captive population and of supplementation through reintroductions.
4.1.2 Incorporating the effects of wind farm collisions
Whilst Orange-bellied Parrot densities vary considerably across the species’ range, our objective was to provide a critical impact evaluation for the cumulative impact of all relevant wind farms. Hence the cumulative impact value predicted for all wind farms combined, for each avoidance rate (see 3.2Estimated cumulative impacts across the range of the Orange-bellied Parrot)was used in PVA modelling.
4.1.3 Finding a Critical Level of impact on the Orange-bellied Parrot
In order to ascertain a point at which the effects of collisions at a number of wind farms begin to make a measurable and significant effect on the extinction risk to the population, we re-ran the wind farm scenario a number of times increasing the environmental mortality each time. Scenarios were run to model the predicted cumulative effects of wind farm collisions, and the mean outputs were

Modelled cumulative impacts of wind farms on the Orange-bellied Parrot – December 2005
B I O S I S R E S E A R C H Methods: Critical Impact Level 38
compared with the outputs of the previous ‘Baseline’ model, which represents the population as it is currently functioning. This process, under the refinements and assumptions of this very simplified PVA, permitted us to determine a level at which heightened mortality began to significantly increase the probability of extinction risk.

Modelled cumulative impacts of wind farms on the Orange-bellied Parrot – December 2005
B I O S I S R E S E A R C H Results and Discussion: PVA Modelling of Critical Impact Assessment 39
5.0 RESULTS AND DISCUSSION: PVA MODELLING OF CRITICAL IMPACT ASSESSMENT
The following findings of Population Viability Analyses are drawn from two data sets: the Baseline and the Critical Level scenarios.
The Baseline scenario models the current observed environment for Orange-bellied Parrots as described in the Recovery Team data supplied by Mark Holdsworth. We then ran a further three scenarios, corresponding to the Cumulative Wind Turbine Collision effects results calculated for 95%, 98% and 99% avoidance rates respectively.
PVA modelling found that the risk of extinction is affected to varying degrees by the introduction of collision risks predicted by our modelling of the cumulative impacts for the twenty-three wind farms assessed here.
As can be seen in Figure 1, the probability of extinction immediately increases from the Baseline scenario when we add the cumulative effects of wind farm collisions, at any of the three avoidance rates, into the model.
Figure 1 Probability of extinction of the Orange-bellied Parrot for Baseline (blue) and Cumulative
Wind Turbine Collision results calculated for 95%, 98% and 99% avoidance.

Modelled cumulative impacts of wind farms on the Orange-bellied Parrot – December 2005
B I O S I S R E S E A R C H Results and Discussion: PVA Modelling of Critical Impact Assessment 40
Figure 2 displays the standard error bars over the same data, clearly showing that the separation between the Baseline case and the 99% avoidance of the current and proposed wind farms is a real effect.
Figure 2 Probability of extinction of the Orange-bellied Parrot for Baseline (blue) and Cumulative
Wind Turbine Collision results calculated for 95%, 98% and 99% avoidance with Error Bars shown.
The following few charts highlight the large amount of spread in the simulated population numbers, with the error bars corresponding to 66% confidence. The apparent plateau is driven by the population truncation as it reaches the proposed site capacity of 500 individuals.

Modelled cumulative impacts of wind farms on the Orange-bellied Parrot – December 2005
B I O S I S R E S E A R C H Results and Discussion: PVA Modelling of Critical Impact Assessment 41
Figure 3 Mean predicted population size of the Orange-bellied Parrot over time for
Baseline (blue) and Cumulative Wind Turbine Collision results calculated for 95%, 98% and
99% avoidance.
Figure 4 Mean predicted population size of the Orange-bellied Parrot over time for Baseline
(blue) and Cumulative Wind Turbine Collision results calculated for 95%, 98% and 99% avoidance with
Error Bars shown.
This distribution of population possibilities is explained by examining the deterministic drivers of the population.
The most significant of these is the deterministic “r” value (Figure 5), which controls the (exponential) growth of any natural system. As we can see, the Baseline case exhibits an “r” = of only 0.043. This value is

Modelled cumulative impacts of wind farms on the Orange-bellied Parrot – December 2005
B I O S I S R E S E A R C H Results and Discussion: PVA Modelling of Critical Impact Assessment 42
critical because, should it become negative, no environmental variations can conspire to save the species from impending extinction. Any additional stresses placed on the population, can be seen to immediately reduce this value. What makes the population so dynamic, is the effect of the Environmental Variations, which contribute around 0.23, or 5 times the baseline deterministic value. This means that the population is almost completely dominated by environmental variation.
Figure 5 Deterministic “r” values for the Orange-bellied Parrot over time for Baseline (blue) and
Cumulative Wind Turbine Collision results calculated for 95%, 98% and 99% avoidance.
Environmental variations are shown in the chart of Stochastic “r” (Figure 6). This indicates how the normal variation frequently tips the growth rate negative. The average for the current environment remains positive, albeit only just.
An “r” value of 0.04 means that for an average year, we expect the population to grow by about 4%, or in this case, 4 individuals. Once we add environmental effects, the average value drops to closer to 0.02, meaning average years only supply two individuals to the population (assuming a population of around 100).
Thus the continued survival of the species is currently very precariously balanced.

Modelled cumulative impacts of wind farms on the Orange-bellied Parrot – December 2005
B I O S I S R E S E A R C H Results and Discussion: PVA Modelling of Critical Impact Assessment 43
Figure 6 Stochastic “r” values for the Orange-bellied Parrot over time for Baseline (blue) and
Cumulative Wind Turbine Collision results calculated for 95%, 98% and 99% avoidance.
To highlight and interpret this component of the model, the ratio of the standard deviation of the growth rate to the deterministic value implies that 42% of years will result in a population decline. This in turn means that only around one in five years will actually result in a net population growth (two bad years, two good years to recover, and the final year to actually move forward).
5.1.1 Finding a Critical Level
Technically, and numerically, the critical level of environmental risk is when the deterministic “r” drops to a negative value. In order to find the Critical Level, the PVA model was run using incremental increases of 0.01, 0.02, 0.03, 0.04, 0.05, 0.06, 0.07, 0.10, 0.15 and 0.20 of the Baseline environmental risk. These are shown sequentially as “Critical Level (1)”, “Critical Level (2)”, ….“Critical Level (10)”, in Figure 7. It can be seen that the deterministic “r” drops to a negative value critical level at around 0.05 increase (“Critical Level (5)”), over the current observed risk to the birds from their environment. However, it should also be noted that large variation in population numbers is possible for this and any of the other levels modelled (Figure 8).

Modelled cumulative impacts of wind farms on the Orange-bellied Parrot – December 2005
B I O S I S R E S E A R C H Results and Discussion: PVA Modelling of Critical Impact Assessment 44
Figure 7 Incremental increases of 0.1 – 0.20 environmental risk (Deterministic “r”)
values above those currently operating (shown as Baseline (blue)) for the Orange-bellied
Parrot population over time.
Figure 8 Variation in population size (error bars) for an increases of 0.5 environmental
risk (Deterministic “r”) value above current for the Orange-bellied Parrot population over time.
To find the critical value, we can use either of the following methods, both

Modelled cumulative impacts of wind farms on the Orange-bellied Parrot – December 2005
B I O S I S R E S E A R C H Results and Discussion: PVA Modelling of Critical Impact Assessment 45
of which indicate an increase in background environmental risk of 0.05 will result in the loss of the species. It should be noted that at the current levels, the species only enjoys population growth, minimal as it is, 60% of the time, implying a one-year-in-five net growth. Any increase in risk to this species, such as the effects of catastrophes or genetic inbreeding, will reduce this tenuous hold. As it stands, an unmodelled event occurring once every five years may reduce the species growth rate to zero or negative.
Figure 9 Modelled mean and median times to extinction as environmental risk is
incrementally increased above current “Baseline” (1.0).
Figure 9 shows the Time to Extinction (TE) predicted from the PVA. The yellow curve is the mean time for any runs in the scenario testing which actually became extinct. We show the more robust median TE only when more than 50% of the models resulted in an extinction. Both these curves show a change in behaviour at an increase of 0.05 – 0.06 over the baseline case.
This is driven by the deterministic growth factor, shown in Figure 10.
Time to Extinction
0
10
20
30
40
50
60
70
80
90
100
0.95 1 1.05 1.1 1.15 1.2 1.25
Increase over BaseLine Risk
Year
s
Mean TE of thoseExtinct Runs Only
Median if more than50% of runs becameextinct

Modelled cumulative impacts of wind farms on the Orange-bellied Parrot – December 2005
B I O S I S R E S E A R C H Results and Discussion: PVA Modelling of Critical Impact Assessment 46
Figure 10 Deterministic growth rate for the Orange-bellied Parrot population as
environmental risk is incrementally increased above current “Baseline” (1.0).
5.1.2 Caveats and Conclusions.
PVA modelling should only really be used as a comparative tool, to assess the relative effects of different management strategies. However, in this particular case, we believe that the quality of data is good enough and consistent enough to draw the conclusions above.
The exclusion of some environmental effects, such as catastrophes, from this model highlights the tenuous balance of the species. The current and proposed levels of wind farms within its habitat do not significantly affect the chance of survival, although the clear dominance of the environmental variation (in which wind farms are included) upon the system is noted. Although technically capable of withstanding an increase to about 0.05 times current levels of environmental risk (after which extinction is predicted to be inevitable), this figure does not allow room for the effects of sporadic events, nor the stochastic conspiring of a run of “bad” years, which would potentially be the ultimate cause of extinction of the species.
Deterministic Growth Rate
-0.12
-0.1
-0.08
-0.06
-0.04
-0.02
0
0.02
0.04
0.06
0.95 1 1.05 1.1 1.15 1.2 1.25
Background environmental Risk over BaseLine

Modelled cumulative impacts of wind farms on the Orange-bellied Parrot – December 2005
B I O S I S R E S E A R C H Results and Discussion: PVA Modelling of Critical Impact Assessment 47
Modelling of the cumulative impacts of turbine collisions at twenty-three wind farms predicts an increases in mortality rates in the range of between 0.006 and 0.009 above current levels, dependant upon turbine avoidance rate (see Section 3.2.1). PVA modelling predicts that extinction risks for Orange-bellied Parrots would increase slightly as a result of such increases in mortality rates, as shown in Figures 1 and 2. PVA modelling indicates that extinction risk will increase to the point where it is an inevitable outcome if environmental risk, such as mortality rates, increase to about 0.05 times above current levels.
Of vital concern for the Orange-bellied Parrot, is the fact that PVA modelling utilising the most up-to-date and comprehensive population information indicates that the species has a very high probability of going extinct within about 50 years in the absence of any mortality due to wind turbine collisions. Despite the best efforts of the Orange-bellied Parrot Recovery effort, there are clearly substantive factors that are presently largely preventing growth of the population and placing it at very significant risk of extinction. Our modelling did not have information available from which to incorporate frequency or magnitude of stochastic environmental events such as wildfire, disease or storm events, nor adverse genetic consequences of small population size. Without doubt such factors must have adverse effects on the population that increase the risks of its extinction over and above results shown by our PVA modelling.
The Orange-bellied Parrot is clearly in a very tenuous predicament caused by an array of both identified and unknown factors. Our modelling suggests that the cumulative mortality of Orange-bellied Parrots that is likely to result from turbine collisions at current and proposed wind farms across its range will be very small at the population level. PVA modelling of this cumulative effect indicates that it would increase the probability of extinction if it were to continue over timeframes substantially longer than the average expected life of current wind farms.
Given that the Orange-bellied Parrot is predicted to have an extremely high probability of extinction in its current situation, almost any negative impact on the species could be sufficient to tip the balance against its continued existence.In this context it may be argued that any avoidable deleterious effect - even the very minor predicted impacts of turbine collisions - should be prevented. Our analyses suggest that such action will have extremely limited beneficial value to conservation of the parrot without addressing very much greater adverse effects that are currently operating against it.

Modelled cumulative impacts of wind farms on the Orange-bellied Parrot – December 2005
B I O S I S R E S E A R C H Appendices 48
APPENDICES

Modelled cumulative impacts of wind farms on the Orange-bellied Parrot – December 2005
B I O S I S R E S E A R C H Appendix 1 49
APPENDIX 1 Cumulative Wind Farm Effects Modelling

Cumulative Wind Farm Effects
Modelling
Approach and Justification
Stuart MuirSymboliX
forBiosis Research Pty. Ltd
June 10, 2005
Abstract
The method to combine the individual wind-farm site assessments intoa cumulative effects model is described. It is shown that this is done bymultiplying all the individual site survival probabilities for each speciestogether. i.e Survival chance = P (S1)P (S2)P (S3)P (S4) . . . P (SN )
1 Introduction
Previous windfarm modelling has resulted in a measure of risk of bird-turbine interactions. It inherently relied on the assumption that the birdinteracted with the site of the farm, and proceeded to generate a measureof the probability of birdstrike through calculations of presented areas ofturbine and assumptions and observations of bird movements.
To approximate cumulative effects of multiple windfarms on the risk ofstrike, we need to remove the assumption that the bird is already interact-ing with the site. Having done this, we must account for the probabilitiesof interacting with a given farm site, and then incorporate the risk ofstrike associated with that farm. We then can proceed to calculate thesurvival rate of a bird population residing or moving through a regionwith resident windfarms.
2 Mechanics
This section is provided to allow for subsequent auditing of the process.Due to its technical nature, it may be skimmed by the non-technicalreader.
1

2.0.1 Definitions
• “region” At this stage we only refer to a region to allow the distinc-tion between “home-ranges” and “habitats.” Appropriate choicesfor what these regions represent will need to be made at a laterstage.
• N the number of wind farm sites found within the region of interest
• “site” A particular wind farm, consisting of turbines standing onsome of the region
• Bi the event of a birdstrike associated with site i
• Ai the event of a bird interacting with site i
• Si the event of survival of an interaction with site i
• P (C) a measure of the probability of an event, C, occurring
Note: The development of the method requires that all mortality riskassessments be converted to survival chance. This is due to the impossi-bility of a struck bird going on to either be struck again, or to survive thenext interaction. Only survivors can continue to interact.
2.1 Estimating Individual Site Risk (P (Bi|Ai))
As stated previously, the previous wind farm risk assessments have con-centrated on the risk of strike, given that the bird is flying through thesite.
Using the definitions of section 2.0.1, this is written as
P (Bi|Ai), (1)
and read as the probability of strike (event Bi), given that the bird isalready on site (event Ai).
A measure of this risk can be obtained one of two ways. Assumingthere is a significant population (defined to be large enough that the lossof a single bird will not be significant and another individual will replaceit) then
Movements at Risk
Total Yearly Movements(2)
can be used. Using this ratio implicitly assumes that the site populationis comparable to the number of observed movements. This may result ina significant under estimate of risk.
If the population is small, then the mortality rate should be taken fromthe earlier model’s measure of corpse numbers per year, and expressed as
Expected corpses per year
Population. (3)
The later form, if population data is available, is the preferred form.This is both for completeness as well as ease of implementation. If theactual population is known to be small but site residency is unknown, it isbetter to estimate site population, or enter the habitat population, thanto rely on the movements at risk approximation which could well be twoorders of magnitude below actual risk.
2

2.2 Estimating the chance of surviving a site
To estimate the chance of surviving a site, we need both the probabilityof never visiting (P (A′)) and the chance of visiting, but not being struck(P (B′|A)). As there are only three possibilities,
1. Visiting and not being struck,
2. Visiting and being struck,
3. and Not visiting at all
the easiest estimation of this risk is to calculate the risk of visiting andbeing struck, and subtract this value from unity.
The probability of visiting and being struck is given by,
P (Ai ∩ Bi) = P (Ai)P (Bi|Ai) (4)
The chance of surviving site i is then given by
P ((Ai ∩ Bi)′) = P (Si) = 1 − P (Ai)P (Bi|Ai) (5)
Note: Earlier, non-cumulative models assumed that P (A) = 1The previous section (2.1) dealt with derivation of the second term.
The first term (P (Ai)) can be approximated a number of ways. These aredetailed next.
2.3 Estimating the chance of visiting a site (P (Ai))
Previous modelling successfully avoided the issue of the physical size ofthe windfarm site through its implementation of the observational data.Unfortunately, there does not appear to be any way to avoid incorporatingthis measure into the model at this stage.
The chances of visiting a given site can be generated by measuring theinteraction between a region and the site. This is most naturally doneby comparing areas of the site relative to the region. This assumes thatthere is no reason for visiting or avoiding the site relative to any otherarea of the region. It may be appropriate to adjust this value if the siteis a significant habitat or food source likely to attract visits. Conversely,if the site is barren, P (Ai) might be adjusted downwards to account forthis. Without accurate data on visitation habits, the following estimatesare safe and realistic by assuming a homogenous region.
A basic measure of this probability is given by
P (Ai) =Area of site
Area of region(6)
This approximation is most appropriate for sedentary species, wherethe relevant region is the home range, not the habitat.
The form indicated above may also be used for migratory species. Ifit is to be used for a migratory species, the region appropriate becomesthe habitat area. Should the species be using a narrow corridor, this formwill be an underestimate of risk.
For a migratory species using a corridor, P (Ai), is better approxi-mated by taking the widest projection of the farm site (orthogonal to the
3

corridor), and dividing through by the width of the migratory corridor atthat location. i.e
P (Ai) =width of site
width of corridor. (7)
This removes the possibility of birds flying around a farm placed inthe corridor, without ever “passing” it. This eventuality is possible forsedentary species, who are free to roam in arcs whilst avoiding the actualsite.
2.4 Cumulative effect of N sites
Having generated the chance of surviving site i’s existence(P (Si) = 1 − P (Ai)P (Bi|Ai)),we need to know the likelihood of surviving all N sites in the region.
This is given byP (S1 ∩ S2 ∩ S3 ∩ . . . ). (8)
As surviving any one of the windfarm sites in the region is independentof surviving any other site, this simplifies to
P (S1...N ) = P (S1)P (S2)P (S3) . . . (9)
= ΠNi P (Si) (10)
3 Summary
The derivation of cumulative effects takes into account the varying individ-ual risk presented by each wind farm in a given region. This informationcan be taken directly from the previously prepared reports on each site.Extra information required to perform this calculation is:
For sedentary species : relative areas of home ranges and site areas occu-pied by windfarms/turbines
For migratory species : effective blockage of corridors by windfarm sites.
3.1 Calculation steps
To calculate the cumulative effect on the survival rate of a species:
1. Identify the sites relevant to each species
2. Estimate the mortality rate for each site (P (Bi|Ai)). This can bedone either through the movements at risk, or mortality (corpse)rate found on the summary pages. (See Section 2.2)
3. Determine an appropriate chance of site visitation, P (Ai). (See Sec-tion 2.3)Note: If the home range of a sedentary species is signifi-cantly smaller than the habitat, then average, representa-tive values for these probabilities may be calculated andsubstituted.
4

4. Determine the survival rate of each site via 1 − P (Ai)P (Bi|Ai).
5. Multiply all the survival rates of each site relevant to the speciestogether.Note: If using average properties (as discussed in the pre-vious point), raise the average probability to the power ofthe number of sites relevant to the size of the home range.
The resultant figure is a chance of survival for the species as a resultof the residency of windfarms in the habitat or corridor. A figure of unity(1) indicates no individual will ever be struck. Zero (0) indicates completeloss of the population.
5

Modelled cumulative impacts of wind farms on the Orange-bellied Parrot – December 2005
B I O S I S R E S E A R C H References 55
REFERENCESBrook B.W., Burgman M.A., Akçakaya
H.R., O’Grady J.J., Frankham R., 2002. Critiques of PVA ask the wrong questions: throwing the heuristic baby out with the numerical bath water.Conserv. Biol. 16, 262-263.
Burgman M.A., 2000. Populationviability analysis for bird conservation: prediction, heuristics, monitoring and psychology. Emu, 100, 347-353.
Everaet, J., Devos, K. & Kyuijken, E. 2002. Windturbines en vogels in Vlaanderen: Voorlopige onderzoeksreultaten en buitenlandse bevindingen [Wind turbines and birds in Flanders (Belgium): Preliminary study results in a European context]. Instituut voor Natuurbehoud, Report R. 2002.03, Brussels.
Henderson, I.G., Langston, R.H.W. & Clark, N.A. 1996. The response of Common Terns Sterna hirundo to power lines: an assessment of risk in relation to breeding commitment, age and wind speed. BiologicalConservation 77: 185-192
Krebs, C. J. 1995. Two Paradigms of Population Regulation. Wildlife Research 22: 1 – 10.
Langston, R.H.W. & Pullan, J.D. 2002. Windfarms and birds: an analysis of the effects of windfarms on birds, and guidance on environmental assessment criteria and site selection issues. Bern Convention. Convention on the Conservation of European Wildlife and Natural habitats, Strasbourg, France.
McCarthy M.A., 1995. Stochasticpopulation models for wildlife management. PhD Thesis. University of Melbourne.
Meredith, C., Saunders, D. and Timewell, C. 2000. Avifauna monitoring update – proposed north-west Tasmania windfarm. Biosis Research Pty. Ltd. Report to Hydro-electric Corporation.
Meredith, C., Venosta, M. & Ressom, R. 2002, Codrington Wind Farm Avian Avoidance Behaviour Report. Biosis Research Pty. Ltd. Report to Pacific Hydro Pty. Ltd.
Mossop, D.H. 1997. Five years of monitoring bird strike potential at a Mountain-Top Wind Turbine, Yukon Territory. Annual Canadian Wind Energy Conference and Exhibition.Pp. 197-211. Yukon Energy Corporation, Whitehorse, Yukon, Canada.
Percival, S. 1998. Beinn Churlaich, Islay, Proposed Wind Cluster - On Geese and Turbines. Supplementary Precognition to Board of Inquiry
Percival, S.M. 2001. Assessment of the Effects of Offshore Wind Farms on Birds. Consultancy Report to UK Department of Technology and Industry. Ecology Consulting, University of Sunderland, Sunderland, UK.
Pople. T. 2005. Review of the BIOSIS modelling of the cumulative impacts of windfarms on the orange-bellied parrot. Report to Department of Environment and Heritage.
Richardson, W.J. 1998. Bird Migration and Wind Turbines: Migration Timing, Flight Behavior, and Collision Risk. Pp 132-140. In: Proceedings of the National Avian - Wind Power Planning Meeting IV. San Diego, California, May 1998.

Modelled cumulative impacts of wind farms on the Orange-bellied Parrot – December 2005
B I O S I S R E S E A R C H References 56
Schaffer, M. L. 1981. Minimumpopulation sizes for species conservation. Bioscience 31: 131 – 134.
Tulp, I., Schekkerman, H., Larsen, J., van der Winden, J., van de Haterd, R.J.W., van Horssen, P., Dirksen, S. & Spaans, A.L. 1999. Nocturnal flight activity of sea ducks near the windfarm TunoKnob in the Kattegat. BureauWaardenburg, Culemborg
Winkleman, J.E. 1990. Nocturnalcollision risks for and behaviour of birds approaching a rotor in operation in the experimental wind park near Oosterbierum, Friesland, The Netherlands. English summary. Rijksinstituut voor Natuurbeheer, Arnheim. RIN-Rapport 90/17.
Winkelman, J.E. 1992. The impact of the Sep wind Park near Oosterbierum (Fr.), The Netherlands on birds. 2. nocturnal collision victims. RIN-Rapport 92/3. Rijksinstitut voor Natuurbeheer, Arnhem, The Netherlands.
Winkelman, J.E. 1994. Bird/wind turbine investigations in Europe. National Avian-Wind power planning meeting. Pp. 43-47.

Tasmanian Wedge-tailed EagleDave Watts

Modelled cumulative impacts on the Tasmanian Wedge-tailed Eagle of wind farms across the species’ range
September 2005
Ian Smales and Stuart Muir

Report forDepartment of Environment and Heritage
Modelled cumulative impacts on the Tasmanian Wedge-tailed Eagle of wind farms across the species’ range
September 2005
Ian Smales1 and Stuart Muir2
1 Biosis Research Pty. Ltd. 2 SymboliX
Project no. 4857
BIOSISR E S E A R C H
Biosis Research Pty. Ltd. This document is and shall remain the property of Biosis Research Pty Ltd. The document may only be used for the purposes for which it was commissioned and in accordance with the Terms of the Engagement for the commission. Unauthorised use of this document in any form whatsoever is prohibited.
BIOSIS RESEARCH Pty. Ltd. A.B.N. 65 006 175 097 Natural & Cultural Heritage Consultants
Ballarat: 449 Doveton Street north, Ballarat VIC 3354 Ph: (03) 5331 7000 Fax: (03) 5331 7033 email: [email protected]
Melbourne: 38 Bertie Street Port Melbourne 3207 Ph: (03) 9646 9499 Fax: (03) 9646 9242 email: [email protected]

Modelled cumulative impacts of wind farms on the Tasmanian Wedge-tailed Eagle –September 2005
B I O S I S R E S E A R C H Acknowledgments & Abbreviations III
ACKNOWLEDGEMENTS
Biosis Research wishes to acknowledge the contribution of the following people and organisations in undertaking this study:
Department of the Environment & Heritage, Canberra Wayne Furler Malcolm Forbes Nick Gascoigne Chris Murphy
Biosis Research Pty. Ltd. Dr Charles Meredith Dr Bob Baird
SymboliXDr Elizabeth Stark
ABBREVIATIONS
DEH Department of the Environment & Heritage DPIWE Department of Primary Industries, Water and Environment,
Tasmania EPBC Act Environment Protection and Biodiversity Conservation Act 1999

Modelled cumulative impacts of wind farms on the Tasmanian Wedge-tailed Eagle –September 2005
B I O S I S R E S E A R C H Contents IV
CONTENTS1.0 INTRODUCTION............................................................................................................ 5
1.1 Project Background ..................................................................................................... 5 1.1.1 Risk modelling.............................................................................................................. 6 1.1.2 Overview of Collision Risk Modelling for individual wind farms................................... 7 1.1.3 Presentation of results ................................................................................................. 9
2.0 METHODS: CUMULATIVE IMPACTS MODELLING ................................................. 10 2.1 Mathematical approach to cumulative impacts modelling ................................... 10
2.2 Model inputs ............................................................................................................... 11
2.3 Parameters of wind farms ......................................................................................... 12 2.3.1 Turbines ..................................................................................................................... 12 2.3.2 Turbine number and configuration............................................................................. 14
2.4 Parameters of Tasmanian Wedge-tailed Eagles ..................................................... 15 2.4.1 The Tasmanian Wedge-tailed Eagle population........................................................ 15 2.4.2 Determining population values used for modelling.................................................... 18 2.4.3 Populations of Tasmanian Wedge-tailed Eagles at wind farm sites.......................... 20 2.4.4 Frequency and heights of flights by Tasmanian Wedge-tailed Eagles ..................... 22 2.4.5 Parameters modelled for Tasmanian Wedge-tailed Eagles at wind farm sites........ 23 2.4.6 Avoidance by Tasmanian Wedge-tailed Eagles of wind turbines.............................. 24
3.0 RESULTS: CUMULATIVE IMPACTS MODELLING................................................... 28 3.1 Estimated impacts from modelling of individual wind farms............................... 28
3.2 Estimated cumulative impacts across the range of the Tasmanian
Wedge-tailed Eagle ............................................................................................................ 293.2.1 Impacts on Tasmanian Wedge-tailed Eagle annual survivorship.............................. 29 3.2.2 Predicted Tasmanian Wedge-tailed Eagle mortalities............................................... 31 3.2.3 Conclusion ................................................................................................................. 32
4.0 METHODS: DETERMINING CRITICAL IMPACT LEVEL .......................................... 33 4.1.1 Assumptions and inputs to the VORTEX PVA model................................................ 33 4.1.2 Incorporating the effects of wind farm collisions........................................................ 35 4.1.3 Assessment of significant impacts............................................................................. 35
5.0 RESULTS AND DISCUSSION: PVA MODELLING OF CRITICAL IMPACT ASSESSMENT ......................................................................................................................... 36
5.1.1 Conclusion and caveats............................................................................................. 39
APPENDICES........................................................................................................................... 41 APPENDIX 1............................................................................................................................. 42
Cumulative Wind Farm Effects Modelling ....................................................................... 42
REFERENCES ......................................................................................................................... 48

Modelled cumulative impacts of wind farms on the Tasmanian Wedge-tailed Eagle – September 2005
B I O S I S R E S E A R C H Introduction 5
1.0 INTRODUCTION
1.1 Project Background
The Tasmanian Wedge-tailed Eagle Aquila audax fleayi is listed as Endangered under provisions of the Environment Protection and Biodiversity Conservation Act (1999) for threatened species. The subspecies is distributed across most of Tasmania and some of its offshore islands, but is believed to be in slow decline (Bell and Mooney 1999, Garnett and Crowley 2000). The subspecies range includes a number of recently constructed wind power generation facilities (wind farms) and more facilities are proposed.
Wind farms may pose a risk of collision to the eagle as bird mortalities are known from wind farms in a variety of situations worldwide and a few Wedge-tailed Eagles have already been recorded as casualties of collision with turbines in Tasmania and elsewhere in Australia. The present project is specifically aimed at determining the cumulative risks posed by collision of eagles with wind turbines. A variety of associated impacts of wind farm developments may affect bird populations. They include direct loss of habitat due to constructed facilities and roads; alienation of habitat caused by disturbance during construction and on-going operation; and potential for electrocution and collisions with overhead distribution lines. These latter impacts are not addressed as part of the present project.
The project has two essential aims:
1. To predict, based upon the extant population of Tasmanian Wedge-tailed Eagles, the potential cumulative impacts of collision risk posed by a number of wind farms across the range of the species distribution. The project utilises bird collision risk modelling to generate assessments of the cumulative risk to the endangered Tasmanian Wedge-tailed Eagle posed by such collisions.
2. To determine a suitable assessment to provide an estimate of the level at which predicted collision (and hence number of turbines or presented area of turbines) is likely to present concerns for the Tasmanian Wedge-tailed Eagle population. We term this ‘critical impact level’.
The cumulative modelling was undertaken for the species using the Biosis Research avian collision risk model. The assessment is based on existing and currently proposed wind farm sites.
Using data available for the Tasmanian Wedge-tailed Eagle, the Biosis Research collision model is utilised to determine the bird strike risk for the eagle’s

Modelled cumulative impacts of wind farms on the Tasmanian Wedge-tailed Eagle – September 2005
B I O S I S R E S E A R C H Introduction 6
population from the wind farms in the following categories, as at 30th May 2005, within the species range:
(i) already constructed or approved;
(ii) referred under the Environment Protection and Biodiversity Conservation Act 1999 (EPBC Act) and:
. determined to be not a controlled action (NCA);
. determined to be not a controlled action manner specified (NCA-MS);
. approved under the EPBC Act; and
. proposed and currently being assessed for a determination under the EPBC Act.
1.1.1 Risk modelling
The fundamental objective of modelling of risk is to provide a rigorous process by which probability can be assessed in a manner that can be replicated.
When making predictions of risk, the rationale behind the predictions is explicitly stated in the mathematics of a model, which means that the logical consistency of the predictions can be easily evaluated. Compared to subjective judgement, this makes models more open to analysis, criticism and modification when new information becomes available. Although there may be assumptions used and some arbitrary choices when deciding on the structure and parameters of a model, these choices are stated explicitly when using a model but are difficult to disclose when making subjective judgements. Assessments based on subjective judgement can give the illusion that they are not scientifically rigorous (Burgman 2000), regardless of whether they are or not. The assumptions underlying a model can be tested. Models can be used to help design data collection strategies. They can help to resolve and avoid inconsistencies, and the rigorous analysis of data can help to clarify thoughts. Models are often most valuable for their heuristic capacities, by focussing attention on the important processes and parameters when assessing risks (Brook et al., 2002). These benefits are difficult, if not impossible to achieve with subjective judgement.
Biosis Research’s Avian Collision Risk Assessment Model is designed to determine the risk of birdstrike at individual wind farms. This model has been modified to create a Multi-site Risk Assessment Model, enabling the assessment of cumulative risk from multiple wind farms. No other windfarm avian collision risk model currently exists in Australia, and the Biosis Research model is more advanced than those that have been used overseas. The Biosis Research model

Modelled cumulative impacts of wind farms on the Tasmanian Wedge-tailed Eagle – September 2005
B I O S I S R E S E A R C H Introduction 7
has been developed in the context of Australian birds and has been tested on a range of wind farm proposals in Australia, and has been subject to independent peer review by Uniquest Pty. Ltd. (University of Queensland). It has been constantly updated and improved over the last five years and now constitutes a unique and powerful tool for assessing the potential impacts of wind farms on birds. The model is the proprietary software of Biosis Research Pty. Ltd.
1.1.2 Overview of Collision Risk Modelling for individual wind farms
In order to quantify levels of potential risk to birds of collision with turbines, Biosis Research Pty Ltd developed a detailed method for the assessment of deterministic collision risk, initially for the Woolnorth Wind Farm in Tasmania. This model has continued to be used for a variety of operating wind farms as further data has been obtained and has also been used to assess the potential impacts of wind farms at a number of further potential sites in Tasmania, Victoria, South Australia and recently in Fiji. It is applied here to determine levels of predicted risk to Tasmanian Wedge-tailed Eagles from individual wind farms.
The model provides a measure of the potential risk at different rates at which birds might avoid collisions. For example, a 95% avoidance rate means that in one of every twenty flights a bird would hit an obstacle in its path. Clearly, birds have vastly better avoidance capacity than this and it is well established overseas that even collision-prone bird species avoid collisions with wind generators on most occasions (see Section 2.4.6, below).
In the modelling undertaken for the present project we divide the risk into two height zones according to components of wind turbine structures. These are:
1. the zone between the ground and lowest height swept by turbine rotors, and
2. the height zone swept by turbine rotors
We consider that birds will avoid collision with the stationary components of a turbine in all but the most exceptional circumstances and model for 99% avoidance rate in the height zone below rotor height. For the height zone swept by rotors we provide predictions for movements at risk for each of 95%, 98% and 99% avoidance rates.
In usual practice the model requires data on the utilisation rates of each species being modelled, as collected during Point Count surveys on-site. This data provides inputs to the model regarding activities of birds that might be at risk of collision with turbines. Where data is not available because a species is not recorded from a site, or where data are too few and is thus an unreliable basis for

Modelled cumulative impacts of wind farms on the Tasmanian Wedge-tailed Eagle – September 2005
B I O S I S R E S E A R C H Introduction 8
extrapolation, a well informed scenario can be used. In the case of the present project, data has been obtained for Tasmanian Wedge-tailed Eagles at four of the seven wind farms and is used here. For the other three wind-farms scenarios are modelled, based on available information about the sites and experience from similar sites. The risk assessment accounts for a combination of variables that are specific to the particular wind farm and to birds that inhabit the vicinity.
They include the following:
The numbers of flights made by the species below rotor height, and for which just the lower portion of turbine towers present a collision risk.
The numbers of flights made by the species at heights within the zone swept by turbine rotors, and for which the upper portion of towers, nacelles and rotors present a collision risk.
The numbers of movements-at-risk of collision. Usually this parameter is as recorded for each species during timed Point Counts, which are then extrapolated to determine an estimated number of movements-at-risk for each species for an entire year. Account is taken of whether particular bird species are year-round residents or are present for a portion of the year as annual migrants.
The mean area of tower (m2 per turbine), nacelle and stationary rotor blades of a wind generator that present a risk to birds. The multidirectional model used here allows for birds to move toward a turbine from any direction. Thus the mean area presented by a turbine is between the maximum (where the direction of the bird is perpendicular to the plane of the rotor sweep) and the minimum (where the direction of the bird is parallel to the plane of the rotor sweep). The mean presented area is determined from turbine specifications supplied to Biosis Research for individual turbine makes and models.
The additional area (m2 per turbine) presented by the movement of rotors during the potential flight of a bird through a turbine. This is determined according to the length and flight speed of the bird species in question. In the case of the Tasmanian Wedge-tailed Eagle the bird’s length is set at 950 mm and its flight speed at 60 km/h.
A calculation, based on the total number of turbines proposed for the wind farm, of the number of turbines likely to be encountered by a bird in any one flight. This differs according to whether turbines form a linear or a clustered array on the landscape.
A value, or values, for each of the parameters above forms an input to the model for each wind farm for which collision risk is modelled.

Modelled cumulative impacts of wind farms on the Tasmanian Wedge-tailed Eagle – September 2005
B I O S I S R E S E A R C H Introduction 9
1.1.3 Presentation of results
All collisions are assumed to result in death of a bird or birds. Results produced from modelling of the collision risk to Tasmanian Wedge-tailed Eagles, of both individual wind farms and of the cumulative impacts of multiple wind farms, are generally expressed here in terms of the annual proportion of the known population of the species that are predicted to survive encounters with wind turbines. On the basis of published demographic values for the current population of the species, including the numbers of birds known to exist and the mean annual mortality rate that is believed to be affecting the population in the absence of wind farm collisions, we also provide estimates of our predicted results in terms of the number of birds that might be affected annually.

Modelled cumulative impacts of wind farms on the Tasmanian Wedge-tailed Eagle – September 2005
B I O S I S R E S E A R C H Methods: Cumulative Impacts Modelling 10
2.0 METHODS: CUMULATIVE IMPACTS MODELLINGMethods are presented here for the first aim of the project - to predict, based upon the extant population of Tasmanian Wedge-tailed Eagles, the potential cumulative impacts of collision risk posed by a number of wind farms across the range of the species distribution.
The modelling outlined here assesses the potential risks to a bird population of collision with wind-driven electricity turbines. Other potential impacts, such as loss of habitat, increased disturbance, or other effects that may result from wind farms are not encompassed by this assessment.
2.1 Mathematical approach to cumulative impacts modelling
The mathematical approach to modelling of the potential cumulative impacts on bird populations used, along with its rationale, is provided in Appendix 1 (Cumulative Wind Farm Effects Modelling by Dr. Stuart Muir).
The Tasmanian Wedge-tailed Eagle is confined to Tasmania, where it occupies the majority of the state, including a number of small offshore islands (Brothers et al. 2001) and larger Bass Strait islands. However, the species breeds through a portion, but not all, of this range. Wedge-tailed Eagles are believed to remain as year-round residents only within home-ranges occupied by breeding birds. The portion of the population comprised of non-breeding adults between one and four years of age is believed to be nomadic over the greater range across the state. Such birds may overlap with the home-ranges of breeding birds in areas where they occur.
Since resident birds, including adult parents and their first-year offspring, are sedentary, such birds are considered to have a probability of interacting with only one wind farm throughout the course of a given year. It is possible that nomadic birds may move through more than one wind farm site during the course of a year, however, no data exists about movements of such birds and it is therefore assumed for the purpose of this project that they are essential random.
Modelling for the cumulative effects of collisions with wind turbines for resident birds is effectively as outlined in the mathematical model (Appendix 1), where they can interact with a single wind farm. As mentioned above, there is no real basis on which to determine a number of wind farms which nomadic birds might encounter. We considered an option of assessing the probability of nomadic birds encountering a series of wind farms as relative to the proportions of the entire range (the area of Tasmania) that is occupied by various wind farms.

Modelled cumulative impacts of wind farms on the Tasmanian Wedge-tailed Eagle – September 2005
B I O S I S R E S E A R C H Methods: Cumulative Impacts Modelling 11
However, the proportional areas are extremely small and we considered that this might underestimate potential risk, especially if nomadic birds are more concentrated into some regions than others. On balance, we determined that a more parsimonious approach was to assume that nomadic birds might be modelled as though they were resident within wind farm sites throughout a given year at a rate proportional to the percentage of nomadic birds that comprise the overall population. This approach is considered more likely to introduce some slight overestimate of risk than an underestimate.
Initially, the possible impact of each wind farm on the Tasmanian Wedge-tailed Eagle is modelled on the basis of available information about that particular wind farm or an informed scenario of how part of the eagle’s total population might interact with the wind farm annually. The impact is expressed as a mortality rate (annual probability of eagles being killed by the particular wind farm) for that part of the eagle population. The inverse of annual mortality is an annual survivorship rate (annual probability of eagles surviving encounters with the wind farm).
The cumulative impacts of all wind farms across the subspecies’ range is subsequently determined as the mean of the combined survivorship rates for Tasmanian Wedge-tailed Eagles interacting with all wind farms. The mean is weighted according to the relative numbers of birds modelled for the different sites. Cumulative impact is expressed as a mortality rate (annual probability of eagles being killed at all wind farms involved) for the combined portion of the total eagle population interacting with all of the wind farms. The inverse of annual mortality is an annual survivorship rate (annual probability of eagles surviving encounters with all wind farms). This survivorship rate is multiplied by the background annual survivorship rate that effects the entire population in the absence of any impacts of wind farms. The result indicates the cumulative impact of wind farm collisions on the entire population of the Tasmanian Wedge-tailed Eagle.
2.2 Model inputs
Inputs to the model have been determined to specifically assess the possible cumulative effects upon the Tasmanian Wedge-tailed Eagle population posed by seven existing and proposed wind farms, through the entire range of the subspecies’ natural distribution. The subspecies has been recorded at, or within close proximity to, all of the seven wind farms under consideration here. Specific attributes of each wind farm were provided by DEH and were augmented, where required, from our own investigations.
Field investigations of the utilisation by birds at four of the relevant wind farms have been undertaken previously by Biosis Research. Results of those studies

Modelled cumulative impacts of wind farms on the Tasmanian Wedge-tailed Eagle – September 2005
B I O S I S R E S E A R C H Methods: Cumulative Impacts Modelling 12
were used here to determine the usage of those sites by Tasmanian Wedge-tailed Eagles. For the remaining three sites we have used a scenario for each based on informed assumptions about similarity of the particular location to sites for which we do have data.
Where assumptions were made in the absence of empirical information, we have used what we believe are valid judgements based on what is known and have attempted to err, if at all, on the basis of over- rather than underestimation of potential risks to the species.
2.3 Parameters of wind farms
Of the eight wind farms considered here, four are built and currently in operation (King Island Huxley Hill Stage 1, King Island Huxley Hill Stage 2, Woolnorth Lot 1, Flinders Island (DEH data)). The remaining four wind farms are proposed (Heemskirk, Mussleroe, Jim’s Plain, Woolnorth Lot 2) and fall within the categories outlined at (i) and (ii) in Section 1.1, above. Hereafter we treat the two stages of the Huxley Hill wind farm as one site.
Key to the collision risk posed by a wind farm to Tasmanian Wedge-tailed Eagles are both the specifications of turbines in use or proposed to be used and configuration of turbines on the landscape.
2.3.1 Turbines
The model of turbine in operation, or proposed to be used, at the various wind farms differ. The specific attributes of turbines are incorporated into the model since the different turbine types present different collision risks to birds. Differences are due to such things as the size (‘presented area’) of the structure that a bird might strike and such specifics as operational rotor speed and percentage of time that rotors are likely to turn, as dictated by variables of appropriate wind speed and maintenance downtime.
At least four different models of turbine are currently in operation, or are proposed to be built at the eight wind farms considered here. The current proposal for the Mussleroe wind farm will utilise Vestas V90 turbines installed on reduced height towers and specifications for these were provided by Hydro Tasmania. For one potential wind farm (Jim’s Plain) we were not able to obtain a clear indication of the turbine type proposed to be used as it appeared that proponents have not yet determined which they might use. In this instance we modelled for a turbine type most likely to be used based on the total generating capacity planned for and from industry trends in the type of turbines being proposed. We were not supplied with specifications of the two rather old

Modelled cumulative impacts of wind farms on the Tasmanian Wedge-tailed Eagle – September 2005
B I O S I S R E S E A R C H Methods: Cumulative Impacts Modelling 13
turbines on Flinders Island and were unable to obtain them. Hence we modelled for a turbine type for which we have specifications with a slightly larger generating capacity than the actual turbines. Similarly, for the two stages of Huxley Hill wind farm on King Island we were unable to obtain full specifications for the three older generation turbines installed for Stage 1. Thus we used the specifications of the slightly larger machines comprising Stage 2 for the entire farm of five turbines and hereafter evaluate the entire installation as one wind farm. Table 1 provides information about turbine type used in modelling for the various wind farms assessed here.
Table 1 Details of the wind farms assessed.
Windfarm
EPBCreferralnumber(where
applicable)
POINT_X POINT_Y Number
ofturbines
Turbine type used for risk modelling
Mussleroe 2002/683 148.09 -40.04 46 Vestas V90 (low tower)
Heemskirk 2002/678 145.121 -41.833 53 Vestas V90
Jim's Plain 2003/1162 144.838 -40.847 20 Vestas V90
Woolnorth Lot 1 2000/12 144.925 -40.785 37 Vestas V66 1.75 MW
Woolnorth Lot 2 2000/12 144.925 -40.785 25 Vestas V90
King Is Huxley Hill 2002/570 143.893 -39.942 5 Vestas [V52 - 850] 0.85 MW
FlindersIsland 148.09 -40.04 2 Nordex 0.125 MW
Manufacturer’s specifications for wind turbine models were used to calculate attributes of each of them. Sixteen dimensions for each turbine, in combination with rotor speed, were input to the model. The mean presented area [m2] of each turbine, that presents a collision risk to eagles, was calculated from specification data for both the static elements (all physical components of a turbine, including tower, nacelle, rotors) and the dynamic components (accounting for the movement of rotors) of each turbine structure.

Modelled cumulative impacts of wind farms on the Tasmanian Wedge-tailed Eagle – September 2005
B I O S I S R E S E A R C H Methods: Cumulative Impacts Modelling 14
The plane of a wind turbine rotor pivots in a 360 horizontal arc around the turbine tower in order to face into the wind direction. The area presenting a collision risk to a bird flying in a particular direction may thus vary from a maximum, in which the rotor plane is at 90 to the direction in which the bird is travelling, to a minimum in which the rotor plane is parallel with the travel direction of the bird.
To account for this variable, specifications for turbine types were used to calculate a mean area that each turbine presents to birds. The use of a mean turbine area is appropriate when the flights of birds are not biased toward any particular compass direction and it is thus assumed that a bird is equally likely to encounter a turbine from any direction. The flights of Wedge-tailed Eagles in the vicinity of the relevant wind farms are multi-directional and the use of a mean turbine area is thus the appropriate approach.
The area presented by a turbine also differs according to whether the rotors are stationary or are in motion. When turbines are operational and rotors are in motion, the area swept by the rotors during passage of a bird the size and speed of a Tasmanian Wedge-tailed Eagle is included in calculations of the presented area.
Turbines rotors do not turn when wind speed is too low (usually below about 4 m/sec) and are braked and feathered to prevent them from turning if it is too high (usually in excess of about 25m/sec), and during maintenance. During such times only the static area of each turbine presents a collision risk. To account for the difference in mean area presented by operational and non-operational turbines a percentage of downtime is an input to the model.
2.3.2 Turbine number and configuration
Two principal components of the collision risk represented by a particular wind farm are the number of turbines at the site and way in which they are positioned relative to each other in the landscape.
The number of turbines at each site is a simple parameter input to the model.
The layout of turbines relative to each other, in combination with the lengths and directions of flights that birds make, affects the number of turbines that a bird might be likely to encounter at the site. In relation to this, a linear array entailing a single row of turbines is quite different from a cluster of turbines. This factor is taken into account as a parameter input that can be varied according to the known layout array of each wind farm modelled.

Modelled cumulative impacts of wind farms on the Tasmanian Wedge-tailed Eagle – September 2005
B I O S I S R E S E A R C H Methods: Cumulative Impacts Modelling 15
2.4 Parameters of Tasmanian Wedge-tailed Eagles
2.4.1 The Tasmanian Wedge-tailed Eagle population
In order to assess the potential cumulative impacts of collisions with wind turbines on the Tasmanian Wedge-tailed Eagle population an initial review was required to determine a number of aspects of the population for use in our analyses. These included the overall size of the population, relevant information about variable densities of the subspecies across its range and the potential influences of nomadic and residential behaviours of different age-classes of the birds. A population viability analysis for the Tasmanian Wedge-tailed Eagle population inhabiting the Forestry Tasmania Bass District has recently been undertaken by Bekessy et al. (2004). Their work provides the most comprehensive and up-to-date collation of information about demographics of the entire Tasmanian Wedge-tailed Eagle population. In general, we have used demographic values they provide both directly and to derive additional values required for our analysis. However, we note that population and demographic estimates provided by various primary authors differ somewhat. We have relied on our own judgement of these various estimates, particularly with regard to overall population size.
Population size and density
Tasmanian Wedge-tailed Eagles occupy most of the state (Bryant and Jackson 1999, Barrett et al. 2003). Various estimates of the size and densities of the population of Tasmanian Wedge-tailed Eagles have been published in recent years (Bell and Mooney 1999, Garnett and Crowley 2000, Bekessy et al. 2004).
Total population estimates range from ‘an adult population of less than 440’ (Bell and Mooney 1999), to ‘750 territorial birds’ (= breeding adults) (Bekessy etal. 2004).
Bell and Mooney (1999) cite density estimates varying from a maximum of one pair per 20 – 30 km2 in lowland eastern and northern Tasmania to one pair per 1,200 km2 in southern and western parts of the state. Bekessy et al. (2004) cite Mooney and Holdsworth (1991) and Bell and Mooney (1999) for values of 50 – 100 km2 in lowland eastern and northern Tasmania to one pair per 1,200 km2 insouthern and western parts of the state. Since the species is a top-order predator and scavenger, densities are likely to correlate very directly with productivity of habitats the birds occupy.
Bekessy et al. (2004) provide the most recent overview of available information about population size and density relevant to the present assessment. Information they provide is summarised in Table 2.

Modelled cumulative impacts of wind farms on the Tasmanian Wedge-tailed Eagle – September 2005
B I O S I S R E S E A R C H Methods: Cumulative Impacts Modelling 16
Table 2 Summary of population size and density information for Tasmanian Wedge- tailed Eagles adapted from Bekessy et al.
Maximum total population of Tasmanian Wedge-tailed Eagles 1500
Number of territorial birds (breeding adults) 750
Number of non-territorial birds (juveniles, immatures & non-territorial adults 750
Density of Wedge-tailed Eagles eastern and northern Tasmania 1 pair/50 - 100 km2
Density of Wedge-tailed Eagles southern and western Tasmania 1 pair/1,200 km2
Territoriality, social and site fidelity
Breeding adults occupy home-ranges year-round and generally maintain life-long monogamous pair bonds. The death of a partner may be followed by the survivor re-pairing (Marchant and Higgins 1993). It appears usual for home-ranges to be occupied throughout the adult life of Wedge-tailed Eagles and, whilst various nest sites may be used in different years, a given nest may be re-used for many years and even by subsequent generations of birds. During the breeding season adult pairs concentrate their activities on a nesting territory, which is a core portion of the year-round home-range.
Age-related movement behaviour
During the first year of life, juveniles remain within their parents’ territories. As the subsequent breeding season approaches, immature birds move away from natal territories and from that age, eagles join a non-breeding component of the population until forming partnerships and themselves becoming breeders at about five years of age. Dispersal of non-breeding birds in Tasmania has not been investigated, although long-distance movements by such birds have been recorded from the mainland subspecies and it is thus possible that non-breeders (‘floaters’) may wander widely over the state (Olsen 1995, Bekessy et al. 2004).
It seems likely that more productive areas of the state, where high densities of Wedge-tailed Eagles occur are also areas where breeding territories are concentrated. The distribution of breeding records across the state is provided by Bryant and Jackson (1999). In regions inhabited by breeding birds, the home-ranges of resident breeding birds may overlap with areas used by non-breeding birds (Olsen 1995, Bekessy et al. 2004), although it is expected that residents would not normally tolerate non-breeders within their core nesting territories. Conversely, areas of low densities of birds are likely to be inhabited principally by non-breeders. If that assumption is correct, then breeding territories may be

Modelled cumulative impacts of wind farms on the Tasmanian Wedge-tailed Eagle – September 2005
B I O S I S R E S E A R C H Methods: Cumulative Impacts Modelling 17
rare in the south and west of Tasmania, where non-breeding birds may predominate, albeit at low occupancy rates. Marchant and Higgins (1993) indicate that breeding occurs on Flinders Island in the Furneaux Group, but that whilst birds are recorded from King Island, no breeding is known to occur there, so we presume that birds there are nomadic non-breeders.
Additional demographic data
A variety of demographic information for the subspecies, additional to population size and density, is provided by Bekessy et al. (2004) and is summarized in Tables 3 and 4 below.
Table 3 Demographic values for Tasmanian Wedge-tailed Eagles adapted from Bekessy et al. (2004).
Estimated number of territories within Tasmania 363
Approx. proportion of territories annually producing chicks 0.5
Average annual number of chicks per successful territory 1.07
Fecundity per breeding female 0.531
Nestling period Hatch - 11 or 12 weeks
Juvenile period 12 weeks - 1 year of age
Average age at first breeding 5 years
Reproductive lifespan 15 - 20 years
‘Usual lifespan' 20 - 25 years
Bell and Mooney (1999) provide minimum mortality rates for three life-stages. Those rates were incorporated into a refined set of rates for eight life-stages used by Bekessy et al. (2004).
Table 4 Mortality rates for life-stages of Tasmanian Wedge-tailed Eagles (adapted from Table 10.1 of Bekessy et al.) and derived survivorship rates
Life-stage Average mortality rate Derived survivorship rate
Chick 10% 90%
Juvenile 50% 50%
Immature 1 30% 70%
Immature 2 25% 75%
Immature 3 20% 80%
Immature 4 10% 90%
Non-breeding Adult 5% 95%
Breeding Adult 5% 95%

Modelled cumulative impacts of wind farms on the Tasmanian Wedge-tailed Eagle – September 2005
B I O S I S R E S E A R C H Methods: Cumulative Impacts Modelling 18
2.4.2 Determining population values used for modelling
We have used the demographic information, summarized above, as the basis for creation of a static life-table for the Tasmanian Wedge-tailed Eagle population (Krebs 1978) (Table 5). In essence it provides a cross-section of the age structure of the population. The life-table was used to ascertain putative values required for our modelling that were not explicitly provided by previous authors, including the proportions of the population that are breeders and non-breeders. It was also used to provide the population estimate for our modelling purposes and to determine the background mean annual survivorship rate of the population against which to measure the predicted impacts of collision risk.
Table 5 Putative life-table for Tasmanian Wedge-tailed Eagle population based on life-history and survivorship attributes provided by Bekessy et al. (2004)
Age of life-stage
increment(years)
Life stage Life-stagesurvivorship
rate (Sx)
Annual survivorship
rate (Sx)
Cumulative cohort
survivorship rate (Sx)
Mean number of individuals
annually survive life-stage in Tas. Population
Life stage duration(months)
0 Hatch 1.00 1.00 194
0 - 0.22 Chick 0.90 0.90 175 2.6
0.22 – 1 Juvenile 0.50 0.45 0.45 87 9.4
1 – 2 Immature 1 0.70 0.70 0.32 61 12
2 – 3 Immature 2 0.75 0.75 0.24 46 12
3 – 4 Immature 3 0.80 0.80 0.19 37 12
4 – 5 Immature 4 0.90 0.90 0.17 33 12
5 – 6 Adult 1 0.95 0.95 0.16 31 12
6 – 7 Adult 2 0.95 0.95 0.15 30 12
7 – 8 Adult 3 0.95 0.95 0.15 28 12
8 – 9 Adult 4 0.95 0.95 0.14 27 12
9 – 10 Adult 5 0.95 0.95 0.13 26 12
10 – 11 Adult 6 0.95 0.95 0.13 24 12
11 – 12 Adult 7 0.95 0.95 0.12 23 12
12 – 13 Adult 8 0.95 0.95 0.11 22 12
13 – 14 Adult 9 0.95 0.95 0.11 21 12
14 – 15 Adult 10 0.95 0.95 0.10 20 12
15 – 16 Adult 11 0.95 0.95 0.10 19 12
16 – 17 Adult 12 0.95 0.95 0.09 18 12

Modelled cumulative impacts of wind farms on the Tasmanian Wedge-tailed Eagle – September 2005
B I O S I S R E S E A R C H Methods: Cumulative Impacts Modelling 19
17 – 18 Adult 13 0.95 0.95 0.09 17 12
18 – 19 Adult 14 0.95 0.95 0.08 16 12
19 – 20 Adult 15 0.95 0.95 0.08 15 12
20 – 21 Adult 16 0.95 0.95 0.07 15 12
21 – 22 Adult 17 0.95 0.95 0.07 14 12
22 – 23 Adult 18 0.95 0.95 0.07 13 12
23 – 24 Adult 19 0.95 0.95 0.06 12 12
24 – 25 Adult 20 0 0 0.00 0 12
Annual maximum Tasmanian population based on life-table 742
Mean population annual survivorship rate (Sx) 0.8660
Portion of total population (post-fledging birds) that are floaters (1 - 4 years of age) 0.24
Mean number floaters in population (1 – 4 years of age) 177
Bekessy et al. state that ‘usual lifespan’ of Tasmanian Wedge-tailed Eagles is 20 – 25 years. We have thus truncated the life-table to a maximum longevity of 25 years.
Cumulative cohort survivorship rates are derived from the product of the incremental survivorship rates of all preceding annual age-classes in a population (Sx = finite rate of survival during the time interval x to x + 1 (Krebs 1978)).
We have used a mean number of 194 chicks annually hatched in the entire population. This is derived from detailed values, as provided by Bekessy et al.(2004), for the total estimate of Tasmanian Wedge-tailed Eagle breeding territories (= 363); the percentage of those that are successful annually (~50%); and the mean number of chicks hatched per successful female (= 1.07). We have used these values, which would appear to be based on more detailed estimates, rather then the, “approximately 140 pairs breed successfully each year” that Bekessy et al. cite elsewhere (p. 219).
Note, that the life-stage survivorship rates and longevity attributes provided by Bekessy et al. (2004), in combination with the number of chicks produced per annum as we have determined it, indicates a mean annual maximum population estimate for Tasmanian Wedge-tailed Eagles of 742 birds. This is the maximum number of eagles that are suggested would be of flying age and is comprised of the combined estimates of 390 adults, 175 fledglings and 177 birds aged 1 – 4 years. It excludes chicks prior to fledging and juveniles which are encompassed within each annual cohort of fledglings.
This total is considerably lower than the 1500 birds in the population suggested by Bekessy et al. although it is derived entirely from values they provide. The

Modelled cumulative impacts of wind farms on the Tasmanian Wedge-tailed Eagle – September 2005
B I O S I S R E S E A R C H Methods: Cumulative Impacts Modelling 20
number of adults suggested by the life-table does not equate with the 363 breeding pairs on which it is based. This would seem to indicate that published population estimates or demographic rates are not entirely accurate. A smaller annual cohort of chicks, based on 140 successful breeding pairs, would suggest an even lower total population. We have not attempted to reconcile these differences, but note that they are indicative of the kinds of difficulties in population estimates that are available even for a large and conspicuous species that is relatively easy to study. Despite that, in the absence of other information, we have based our modelling on this most recently available information.
Values from the life-table indicate that approximately 24% of the population is comprised of non-breeding adult birds aged 1 – 4 years. This constitutes the nomadic portion of the population.
2.4.3 Populations of Tasmanian Wedge-tailed Eagles at wind farm sites
Specific investigations have not been undertaken into the population dynamics of Tasmanian Wedge-tailed Eagles inhabiting any wind farm sites in Tasmania so there is no empirical data about the number of birds using sites. In order to provide necessary inputs about the number of birds that might interact with turbines at any given site, and consequently across all sites, we have made assumptions about the number of birds involved based on available information about relative regional densities of the wider Tasmanian population of the species (see 2.4.1 The Tasmanian Wedge-tailed Eagle population). That has been further informed by knowledge of habitats at particular sites and their potential influence on densities of the bird; by local knowledge, where available; and by information gleaned during bird utilisation studies at a number of the sites. The latter includes the relative frequencies of observing Wedge-tailed Eagles and the maximum numbers of individuals observed on any one occasion at any of the relevant wind farm sites.
The Wedge-tailed Eagle population is comprised of two components whose movement behaviours relative to a particular site are likely to differ. These are territory residents, including breeding adults and their first-year offspring, and nomadic non-breeders aged between approximately one and five years. We have therefore had to determine how to appropriately model for these two sectors of the population in modelling of both collision risk for individual wind farms and subsequently of the cumulative impacts of multiple wind farms.
The numbers of Tasmanian Wedge-tailed Eagles that we have considered are likely to be resident in the area of each wind farm, based on the considerations above, is shown in Table 6 (Section 2.4.5). In order to account for a level of uncertainty, we have attempted to err toward modelling for a higher level of risk

Modelled cumulative impacts of wind farms on the Tasmanian Wedge-tailed Eagle – September 2005
B I O S I S R E S E A R C H Methods: Cumulative Impacts Modelling 21
and have assumed that the territories of more than one pair may intersect within the site of any given wind farm. Thus for every location where breeding birds might occur we have modelled for the possibility that a minimum of two pairs and their juvenile offspring may interact with turbines on the site.
Based on the 24% of the overall population that was determined to be nomadic, we have added that percentage to the number of residents believed to be present at the majority of wind farm sites. At two sites where resident breeding birds are considered unlikely to exist (Heemskirk and Huxley Hill), we have modelled on the basis of two non-breeding birds being present at all times. Numbers of non-breeding birds at each site are provided in Table 6. The rationale for modelling of the presence of nomadic birds is outlined above (2.4 Mathematical approach to cumulative impacts modelling).
The combined total of Tasmanian Wedge-tailed Eagles modelled as having potential to interact with turbines at each wind farm is shown in Table 6.
We have assumed that development of a wind farm does not alienate the area from further use by eagles. This is considered to be the case because previous land uses at all current wind farm sites in southern Australia, including Tasmania, have continued and pre-existing habitat values have remained largely unaltered following construction of facilities. It is also the case that Wedge-tailed Eagles are known to continue to occupy operational wind farm sites in southern Australia, including the large Bluff Point Wind Farm (formerly Woolnorth Lot 1) in Tasmania.
It is also assumed that mortalities due to collisions with turbines do not alter usage, or occupancy of wind farm sites by Tasmanian Wedge-tailed Eagles. We do not consider that collisions are likely to result in heightened avoidance behaviours on the part of survivors. The closest analogy in our view are motor vehicle collisions involving Wedge-tailed Eagles and we are not aware of any suggestion that fatal accidents result in changed behaviours on the part of surviving birds. In the short-term there may be a period of months before an individual bird that is killed might be replaced in a local population. However we do not consider that the presence of a wind farm or the incidence of collision is likely to materially alter the rate at which dead eagles will be replaced from that which occurs elsewhere.
Following the rational outlined above, we have modelled the effects of collisions on the basis that occupancy rates of wind farm sites and eagle behaviours, including avoidance rates for eagles encountering turbines, will remain constant over time.

Modelled cumulative impacts of wind farms on the Tasmanian Wedge-tailed Eagle – September 2005
B I O S I S R E S E A R C H Methods: Cumulative Impacts Modelling 22
2.4.4 Frequency and heights of flights by Tasmanian Wedge-tailed Eagles
In studies of the utilisation of wind farm sites by birds through south-eastern Australia, the number of flights and height of each flight made by birds has been recorded during standard point counts. Thus we have data for utilisation by Tasmanian Wedge-tailed Eagles of the Mussleroe, Woolnorth Lot 1, Woolnorth Lot 2 and Heemskirk wind farm sites where Biosis Research has undertaken such investigations. These data provide the parameter inputs used here that are specific to those wind farm locations.
We do not have data for utilisation by Tasmanian Wedge-tailed Eagles of the Jim’s Plain, Flinders Island and Huxley Hill sites. In order to model for those sites we have used a scenario for each based on informed assumptions about similarity of the particular location to sites for which we do have data. Thus we have modelled the Jim’s Plain site on the basis that it is biogeographically close to the Woolnorth sites and have assumed that utilisation might equate with those recorded at Woolnorth Lot 2, which has higher rates than Woolnorth Lot 1. Similarly, Flinders Island has been modelled on the basis of its biogeographic proximity to the Mussleroe site. Tasmanian Wedge-tailed Eagles are known from King Island but are not known to breed there. Hence, we have assumed that utilisation rates for the Huxley Hill site may be most similar to those recorded at the Heemskirk location which is also in a region believed to be inhabited by few, if any, breeding birds.
Frequency of Wedge-tailed Eagle flights
The numbers of movements-at-risk of collision has been determined from the number of Wedge-tailed Eagle flights recorded during timed point count records at wind farms where they have been undertaken (Mussleroe, Woolnorth Lot 1, Woolnorth Lot 2 and Heemskirk). This parameter is then extrapolated to determine an estimated number of movements-at-risk for each species for an entire year.
For sites where the number of flights has not been collected or was not available (Jim’s Plain, Flinders Island and Huxley Hill), we have used a scenario for each based on informed assumptions about similarity of the particular location to sites for which we do have data, as outlined above (Section 2.5).
The numbers of flights per annum at risk of collision with turbines that have been used in modelling for each site are the sum of the numbers of flights shown for the two height zones in Table 6.
Relative heights of Wedge-tailed Eagle flights
The height at which birds fly within a wind farm is relevant to the likelihood of collision with turbines due to the different heights of turbine components and

Modelled cumulative impacts of wind farms on the Tasmanian Wedge-tailed Eagle – September 2005
B I O S I S R E S E A R C H Methods: Cumulative Impacts Modelling 23
different collision risks they present to birds. The moving rotors of a turbine are considered to present a greater risk than are the static elements of the machine. A variety of turbine types are involved in this assessment, but by way of example, the rotors of the largest turbines (Vestas V90) on a standard height tower, sweep a 90 metre deep height zone between 33 and 123 metres above the ground. This rotor-swept-zone is considered to represent an area of greater danger to flying birds than is the stationary tower below rotor-swept height.
As part of our studies of bird utilisation at the Mussleroe, Woolnorth Lot 1, Woolnorth Lot 2 and Heemskirk wind farm sites we have recorded the height of each flight made by birds observed during standard point counts. These data are allocated to the two height zones in which birds may interact with turbines:
the zone between the ground and the lowest point swept by rotors, and
the zone between the lowest and highest point swept by rotors (the rotor-swept-zone).
The proportion of flights recorded from the two height zones vary considerably between the four sites, but are consistent in that the majority of flights were from rotor-swept-height at all of them (Table 6).
Flight height data has not been collected or was not available for the remaining three sites, Jim’s Plain, Flinders Island and Huxley Hill. In order to model for those sites we have used a scenario for each based on informed assumptions about similarity of the particular location to sites for which we do have data, as outlined above (Section 2.5).
2.4.5 Parameters modelled for Tasmanian Wedge-tailed Eagles at wind farm sites
The data or scenario for Tasmanian Wedge-tailed Eagle modelled for each wind farm is outlined in Table 6.

Modelled cumulative impacts of wind farms on the Tasmanian Wedge-tailed Eagle – September 2005
B I O S I S R E S E A R C H Methods: Cumulative Impacts Modelling 24
Table 6 Inputs modelled for Tasmanian Wedge-tailed Eagle use of wind farms
Wind farm Number of flight records from below rotor-swept-
zone
Number of flight records from within rotor-swept-
zone
Total minutes of
observations
Putative number of residents
(breeding age adults +
juveniles) modelled
Putative number of
floaters (1- 4 year old non-
breeders)
Modelledpopulation
total for site
Mussleroe A 3 29 8100 6 1.44 7.44
Heemskirk A 1 7 11610 0 2 2
Jim's Plain B Modelled as for Woolnorth Lot 2 6 1.44 7.44
Woolnorth Lot 1 A
11 32 11315 9 2.16 11.16
Woolnorth Lot 2 A
32 45 14805 6 1.44 7.44
King Is Huxley Hill B
Modelled as for Heemskirk 0 2 2
FlindersIsland B
Modelled as for Mussleroe 6 1.44 7.44
Total 33 11.9 44.9
A = All values from site-specific data B = Scenario based on similar site
2.4.6 Avoidance by Tasmanian Wedge-tailed Eagles of wind turbines
Note that in modelling of the cumulative impacts of collision, any collision caused by a bird striking, or being struck by, a turbine, is assumed to result in death of the bird.
The use of the term ‘avoidance’ here refers to how birds respond when they encounter a wind turbine, that is, the rate at which birds attempt to avoid colliding with the structures.
At the request of DEH, three avoidance rates are modelled: 95%, 98% and 99%. Given that static elements of a turbine (tower, nacelle, etc.) are stationary and highly visible, we take the approach of modelling the likely avoidance rate of the area presented by these parts as 99% in all scenarios. The three variable avoidance rates that are modelled here relate to the area in which the sweeping

Modelled cumulative impacts of wind farms on the Tasmanian Wedge-tailed Eagle – September 2005
B I O S I S R E S E A R C H Methods: Cumulative Impacts Modelling 25
motion of rotors is considered to present a higher risk. They are calculated as the area swept by rotors during the passage of a bird at a given flight speed.Complete lack of avoidance (0%) is behaviour that has not been observed in any study of bird interactions with wind turbines and would be analogous to birds flying blindly without responding to any objects within their environments. It should be noted that 99% avoidance rate means that for every 100 flight made by a bird it will make one in which it takes no evasive action to avoid collision with a turbine. In real terms this equates to avoidance behaviour that is considerably lower than that shown by many species of birds under most circumstances. Absolute avoidance behaviour (100%) has been documented for some species and may be a reasonable approximation for many species in good conditions, but is unlikely for some species in certain conditions.
For all bird groups, specific avoidance rates measured to date are:
1. Directly observed avoidance rates (i.e. observations of birds passing through a turbine array, but showing active avoidance of collisions):
100% - Barnacle, Greylag, White-fronted Geese, Sweden (Percival 1998);
100% - range of species (Common Starling, Straw-necked Ibis, Australian Magpie, Australian Raven, Little Raven, European Goldfinch, White-fronted Chat, Skylark, Black-shouldered Kite, Brown Goshawk, Richards Pipit, Magpielark, Nankeen Kestrel, White-faced Heron, Brown Songlark, Wedge-tailed Eagle, Swamp Harrier, Brown Falcon, Collared Sparrowhawk, egret sp., White Ibis), Codrington, Victoria (Meredith et al. 2002);
99% - migrating birds, Holland (diurnal and nocturnal data) (Winkelman 1992);
99.9% - gulls, Belgium (Everaert et al. 2002, in Langston & Pullan 2002);
99.8% - Common Terns, Belgium (Everaert et al. 2002, in Langston & Pullan 2003);
97.5% - waterfowl and waders, Holland (Winkelman 1992, 1994);
87% - waterfowl and waders at night, Holland (Winkelman 1990).
2. Calculated avoidance rates (i.e. recorded fatalities compared with measured utilisation rates – these are more accurately considered as survival rates of birds passing through a wind farm, but they give an indirect estimate of avoidance rate):
100% - waterfowl, Yukon, Canada (Mossop 1997);

Modelled cumulative impacts of wind farms on the Tasmanian Wedge-tailed Eagle – September 2005
B I O S I S R E S E A R C H Methods: Cumulative Impacts Modelling 26
100% - raptors, Yukon (ibid);
99% - Australian Magpie, Skylark, Codrington Victoria (Meredith et al.2002);
99% - waterfowl, waders, cormorants, UK (Percival 2001);
>95% - Brown Falcon, Victoria [Codrington] (Meredith et al. 2002).
Based on the experience cited above, it is reasonable to conclude that an avoidance rate of 99% or greater is typical for daylight and normal weather. The only measured avoidance rate of nocturnal flights is 87% (Winkelman 1990). While other sources conclude that birds’ avoidance behaviour differs between night and day, they do not provide actual avoidance rates. Radar studies record 100% avoidance in most cases, but where a “reduction” in avoidance has been noted, corresponding avoidance rates have not been provided (Dirksen et al.1996). These sources suggest that at night, birds are more cautious about flying into a wind farm area, but have potentially lower rates of avoidance if they do enter a wind farm. Since 87% is the only avoidance rate figure available for conditions of poor visibility (e.g. night, fog), and in the absence of any other empirical data this is most reasonable to use as a lower bound on ecologically reasonable rates.
It would seem likely that avoidance by a species with the flight characteristics of the Tasmanian Wedge-tailed Eagle would generally be in the range of 95% to 100% in most conditions. Eagles may fly infrequently when visibility is reduced by fog or rain, however some individuals of some species do fly under these conditions and this can lead to increased collision risk. They are highly unlikely to fly during the hours of darkness. Data from overseas, based on findings of bird carcasses, demonstrates that large raptors do collide with turbines. However, empirical data about avoidance rates requires investigations that assess the actual behaviours of birds when they are confronted by turbines. Such studies for raptors have rarely been attempted and the only research into this question for the Wedge-tailed Eagle is that of Meredith et al. (2002) who investigated avian avoidance of turbines at the Codrington wind farm in Victoria. They documented just three instances of Wedge-tailed Eagles flying in the vicinity of the wind farm and the birds avoided collision in each case. In a recent investigation of collision risk for the closely related Golden Eagle Aquilachrysaetos for the proposed Lewis Wind Farm in Scotland, Coates (2004) modelled for avoidance rates of between 95% and 99.9%. He considered that, ‘… the actual level of avoidance is most likely to lie within the upper part of this range, that is, around 99.0 to 99.5%”. Overall, considering the range of species sampled in Australia and overseas, the consistency in avoidance rates and the absence of any documented cases lower then 95%, it is appropriate to assume

Modelled cumulative impacts of wind farms on the Tasmanian Wedge-tailed Eagle – September 2005
B I O S I S R E S E A R C H Methods: Cumulative Impacts Modelling 27
that Tasmanian Wedge-tailed Eagles will have avoidance rates in the 95% - 100% range. Nonetheless, we recommend that this is a key area requiring further soundly based investigation within operational wind farms.

Modelled cumulative impacts of wind farms on the Tasmanian Wedge-tailed Eagle – September 2005
B I O S I S R E S E A R C H Results: Cumulative Impacts Modelling 28
3.0 RESULTS: CUMULATIVE IMPACTS MODELLING
3.1 Estimated impacts from modelling of individual wind farms
The initial stage for modelling the cumulative risk of Tasmanian Wedge-tailed Eagle collisions with wind turbines is to determine a level of risk posed by each individual wind farm. Results from this process also allow assessment to be made of the effects of any single wind farm or of any combination of farms. For the purposes of evaluating the potential impacts of current or future proposals to build wind farms this component of the process provides a valuable tool.
Predicted risk of collisions is expressed as a mean annual survivorship rate which represents the proportion of the population that is expected to survive all encounters with turbines at a given wind farm during the course of a year. Modelled survivorship rates for relevant wind farms are shown in Table 7. It has been necessary to calculate and show these values to four significant numbers in order for differences between them to be detected. It is important that this is not to be misinterpreted to indicate any level of ‘accuracy’ in the predicted results.
Table 7 Modelled survivorship rates for wind farms presenting a collision risk to Tasmanian Wedge-tailed Eagles
Windfarm Survivorship rate at 95% avoidance
rate
Survivorship rate at 98% avoidance
rate
Survivorship rate at 99% avoidance
rate
Mussleroe 0.8621 0.9248 0.9467
Heemskirk 0.9118 0.9524 0.9663
Jim's Plain 0.9269 0.9595 0.9706
Woolnorth Lot 1 0.9628 0.9783 0.9835
Woolnorth Lot 2 0.9187 0.9548 0.9672
King Is Huxley Hill 0.9793 0.9891 0.9924
Flinders Island 0.9881 0.9932 0.9948

Modelled cumulative impacts of wind farms on the Tasmanian Wedge-tailed Eagle – September 2005
B I O S I S R E S E A R C H Results: Cumulative Impacts Modelling 29
3.2 Estimated cumulative impacts across the range of the Tasmanian Wedge-tailed Eagle
No empirical values for annual variations in population numbers nor for any variables of demographic parameters influencing the population were available. Clearly environmental variables and stochastic events have effects on the Tasmanian Wedge-tailed Eagle population, however in the absence of any known values and for simplicity of presentation, we have not assigned arbitrary coefficients of variation. Therefore, in the following results and discussion mean values are used throughout, but may be viewed as indicative only. Annual variations in all values will occur and may have considerable influence on population numbers used here and on predictions derived from them.
The total number of Wedge-tailed Eagles modelled as interacting annually with all seven wind farms under consideration here is 45 (2.4.5 Parameters modelled for Tasmanian Wedge-tailed Eagles at wind farm sites). This equates to 6% of the entire Tasmanian population of 742 Wedge-tailed Eagles (as derived from the life-table) that is at risk of collisions with wind turbines.
The weighted mean survivorship rates determined for the cumulative impacts of collisions at all wind farms across the Tasmanian Wedge-tailed Eagle’s range are provided in Table 8.
Table 8 Cumulative survivorship values for the Tasmanian Wedge-tailed Eagle population from potential collision risk posed by seven wind farms in Tasmania
Survivorship rate at 95% avoidance
rate
Survivorship rate at 98% avoidance
rate
Survivorship rate at 99% avoidance
rate
0.9355 0.9642 0.9741
3.2.1 Impacts on Tasmanian Wedge-tailed Eagle annual survivorship
In order to assess the potential impact of altered survivorship rates that may be imposed on the Tasmanian Wedge-tailed Eagle population by collisions with wind turbines it is first necessary to know the background survivorship rate that affects the population in the absence of any impacts of wind farm collision.
A mean annual background survivorship rate of 0.8660 (i.e. 86.60% of the population surviving from one year to the next) was obtained from the life-table constructed from previously published rates for life-stages of the Tasmanian

Modelled cumulative impacts of wind farms on the Tasmanian Wedge-tailed Eagle – September 2005
B I O S I S R E S E A R C H Results: Cumulative Impacts Modelling 30
Wedge-tailed Eagle population (see 2.4.2 Determining population values used for modelling).
The effect of survivorship values for cumulative impacts of collision risk on the portion of the Tasmanian Wedge-tailed Eagle population that interacts with wind farms is found by multiplying the background by wind farm survivorship rates.
Thus, for the case of 95% avoidance rate, the cumulative effect equals 0.8102 (0.8660 x 0.9355). The equivalent annual rate for 98% avoidance rate equals 0.8350 (0.8660 x 0.9642) and for 99% avoidance rate equals 0.8436 (0.8660 x 0.9741). Note that these altered survivorship rates affect only the 6% of the population that are modelled as coming into contact with wind farms in any year, while the remaining 94% of the population continue to experience the background rate.
We can also determine an overall cumulative impact of the seven wind farms on the entire subspecies. To do so we compare the effect of background survivorship of the entire population in the absence of wind farms, with the combined effects of that rate affecting the 94% of the population that do not interact with turbines on the seven wind farms and the predicted increased rate affecting the 6% of the population that does interact with them.
The background rate for the entire population indicates that a mean of 642.23 birds survive each year (742 x 0.8660). Of 94% (697 birds) of the population surviving at the mean annual background rate, 603.26 (697 x 0.8660) would be expected to survive per annum.
For 95% collision avoidance rate, of 6% (45 birds) of the population affected by the survival rate for wind farms, 36.46 (45 x 0.8102) would be expected to survive each year. The sum of these two components of the overall population is 640.06 birds. Expressed in terms of the effect on annual survivorship rates of the entire population, this predicts an overall decrease from 0.8660 to 0.8631.
For 98% collision avoidance rate, of 6% (45 birds) of the population affected by the survival rate for wind farms, 37.58 (45 x 0.8350) would be expected to survive each year. The sum of these two components of the overall population is 641.18 birds. Expressed in terms of the effect on annual survivorship rates of the entire population, this predicts an overall decrease from 0.8660 to 0.8646.
For 99% collision avoidance rate, of 6% (45 birds) of the population affected by the survival rate for wind farms, 37.96 (45 x 0.8436) would be expected to survive each year. The sum of these two components of the overall population is 641.22 birds. Expressed in terms of the effect on annual survivorship rates of the entire population, this predicts an overall decrease from 0.8660 to 0.8646, which

Modelled cumulative impacts of wind farms on the Tasmanian Wedge-tailed Eagle – September 2005
B I O S I S R E S E A R C H Results: Cumulative Impacts Modelling 31
is no different from that predicted for 98% avoidance.
3.2.2 Predicted Tasmanian Wedge-tailed Eagle mortalities
A number of birds that might be killed annually by the predicted cumulative effects of turbine collisions for all seven wind farms can be determined by comparing the number of individuals utilising the wind farm sites that would be expected to die at the background mortality rate with the number expected to die at the rate predicted for wind farms. The total population of Wedge-tailed Eagles modelled as interacting annually with all seven wind farms under consideration here is 45 (2.4.5 Parameters modelled for Tasmanian Wedge-tailed Eagles at wind farm sites). Note that mortality rate is simply the inverse of survivorship of rate. See Section 3.2.1 Impacts on Tasmanian Wedge-tailed Eagle annual survivorship for survivorship rates calculated for the three different rates of collision avoidance modelled.
The background annual mortality rate equals 0.1340 (i.e. the inverse of the predicted annual cumulative survivorship rate (1 - 0.8660 = 0.1340). The annual number of background mortalities occurring within the population of Wedge-tailed Eagles modelled as interacting annually with all seven wind farms thus equates to 6.03 birds (i.e. 45 x 0.1340 = 6.030).
For the case of 95% avoidance rate, the predicted annual cumulative mortality rate from wind turbine collisions equals 0.1898 (i.e. the inverse of the predicted annual cumulative survivorship rate (1 - 0.8102 = 0.1898). The annual number of mortalities thus equates to 8.54 birds (i.e 45 x 0.1898 = 8.541). The increase in mortalities of the entire Tasmanian Wedge-tailed Eagle population due to the cumulative effects of collisions at 95% avoidance rate, is thus predicted to average approximately 2.5 birds per annum (8.54 – 6.03 = 2.51).
For the case of 98% avoidance rate, the predicted annual cumulative mortality rate from wind turbine collisions equals 0.1650 (i.e. the inverse of the predicted annual cumulative survivorship rate (1 - 0.8350 = 0.1650). The annual number of mortalities thus equates to 7.43 birds (i.e 45 x 0.1650 = 7.425). The increase in mortalities of the entire Tasmanian Wedge-tailed Eagle population due to the cumulative effects of collisions at 98% avoidance rate, is thus predicted to average approximately 1.4 birds per annum (7.43 – 6.03 = 1.40).
For the case of 99% avoidance rate, the predicted annual cumulative mortality rate from wind turbine collisions equals 0.1564 (i.e. the inverse of the predicted annual cumulative survivorship rate (1 - 0.8436 = 0.1564). The annual number of mortalities thus equates to 7.04 birds (i.e 45 x 0.1564 = 7.038). The increase in mortalities of the entire Tasmanian Wedge-tailed Eagle population due to the cumulative effects of collisions at 99% avoidance rate, is thus predicted to

Modelled cumulative impacts of wind farms on the Tasmanian Wedge-tailed Eagle – September 2005
B I O S I S R E S E A R C H Results: Cumulative Impacts Modelling 32
average approximately 1.0 birds per annum (7.04 – 6.03 = 1.01).
We consider that a collision avoidance rate for the species is likely to be 99% or higher. Thus the additional mortality predicted for the cumulative effects of turbine collisions for wind farms within the range of the Tasmanian Wedge-tailed Eagle is likely to result in the additional death of approximately one bird per annum.
3.2.3 Conclusion
The cumulative impacts of collision with turbines on the overall population of Tasmanian Wedge-tailed Eagles, predicted by the modelling for current and presently proposed wind farms within the species’ range, are very small and it is thus highly likely that their effects would be masked by normal fluctuations in the population due to natural environmental variables. However, mortality due to turbine collision is a negative impact on the species that would be expected to increase further if the number of wind farms continues to grow (see also Section 5.0 Results and Discussion: PVA Modelling Of Critical Impact Assessment).
Effects of wind farm developments on eagle populations, other than collisions with turbines, such as direct and indirect losses of habitat are not encompassed by the assessment here. Collisions with other wind farm infrastructure like transmission poles and lines may present particular risks for eagles. We recognise that the cumulative impacts of a variety of such aspects of wind farms may have adverse effects on the Tasmanian Wedge-tailed Eagle population additional to those modelled here.

Modelled cumulative impacts of wind farms on the Tasmanian Wedge-tailed Eagle – September 2005
B I O S I S R E S E A R C H Methods: Determining Critical Impact Level 33
4.0 METHODS: DETERMINING CRITICAL IMPACT LEVELThe objective of this element was to determine a suitable assessment for providing an estimate of the level at which predicted collision is likely to present concerns for the Tasmanian Wedge-tailed Eagle population. Ideally, a critical impact level should be measured in terms of presented area of turbines (m2).Such a value could conceivably be converted into a number of turbines of any particular type, or into a matrix of both turbine numbers and types.
One method is to use a Population Viability Analysis (PVA) to assess the level of impact on the population that would significantly increase the probability of extinction risk to the population. Simplistically, the objective would be to determine a threshold extinction risk below which the impact of predicted collisions with wind turbines would be considered ‘acceptable’ and above which the impact would be considered to be ‘unacceptable’.
We have used the Population Viability Analysis tool, VORTEX (v9.51), to examine the difference in extinction risk posed to the Tasmanian Wedge-tailed Eagle resulting from increased mortality due to collisions with wind turbines as predicted by our modelling of the cumulative effects of wind farms in Tasmania. The VORTEX model used is an individualistic, stochastic model, accounting for life-stages and various mortality risks. It was possible to undertake this analysis for the Tasmanian Wedge-tailed Eagle only because a recent PVA has been undertaken to assess the potential impacts of forestry practices on a regional portion of the population (Bekessy et al. 2004) and it provided values for most of the population parameters required. Where derived values were required, the base data provided by Bekessy et al. permitted us to construct a life-table in order to calculate required values.
In the absence of empirical data, any evaluation of what constitutes a critical level of impact on an endangered species or population, will necessarily be subjective and arbitrary and we are not in a position to mandate a threshold level for ‘acceptable’ risk. Nevertheless, by re-running scenarios, increasing the environmental mortality each time, we were able to determine where the cumulative effects of wind farms (under the refinements and assumptions of our greatly simplified PVA – see below) began to make a measurable and significant effect.
4.1.1 Assumptions and inputs to the VORTEX PVA model
Extinction was defined as occurring in a simulation if the population was reduced to only one gender.

Modelled cumulative impacts of wind farms on the Tasmanian Wedge-tailed Eagle – September 2005
B I O S I S R E S E A R C H Methods: Determining Critical Impact Level 34
The population was modelled as homogenous over the entire suitable habitat range. We are aware that densities of Wedge-tailed Eagles do vary considerably across the species’ range in Tasmania (Mooney and Holdsworth (1991), Bell and Mooney (1999)). But we were not able to take this factor into account in PVA modelling since the proportions of the population that exist at different densities have not been quantified. However, this will mean that wind farms situated in different parts of the range would present different levels of risk to the population. Hence a single measure of risk is not entirely applicable across the species’ range and this complicates the notion of determining a single suitably applicable threshold that would constitute a critical impact level.
The eagles were defined as long-term monogamous, with a maximum breeding age of 25 years. It was assumed that the age of first breeding was the same for both males and females, and was set at 5 years. The maximum progeny per cycle was set at two, although with a 98% likelihood of only one offspring. The sex ratio at birth was assumed to be equal.
The mean annual fecundity of adult females was set at 0.531 (Bekessy et al.2004), with an environmental variation allowing for a 95% confidence interval for the rate of between 0.425 and 0.637.
No distinction in demographic values was drawn between the sexes, and the following table of mortality rates (Table 9) was derived from the life table we constructed (2.4.2 Determining population values used for modelling).
Table 9 Mortality rates and standard deviations for life-stages used in PVA modelling of extinction risks posed by predicted collisions with wind turbines on Tasmanian Wedge-tailed Eagles
Life Stage Mortality Standard Deviation due to
Environmental Variance
0-1 Year 0.55 0.20
1-2 Years 0.30 0.03
2-3 Years 0.25 0.03
3-4 Years 0.20 0.03
4-5 Years 0.10 0.03
5+ Years 0.05 0.03
25+ Years 1.00 0.00
The initial population was assumed to be 700 individuals, with a maximum environmental carrying capacity of 1500 individuals. It should be noted that in the 20000 simulation runs used to generate the following findings, not a single run met this carrying capacity barrier. It was assumed that carrying capacity was

Modelled cumulative impacts of wind farms on the Tasmanian Wedge-tailed Eagle – September 2005
B I O S I S R E S E A R C H Methods: Determining Critical Impact Level 35
static for the 200 years of the simulation run, meaning that no habitat loss (or creation) was modelled.
There was assumed to be a correlation between the environmental variation in good breeding years, and years conducive to higher survival rate.
The focus of this model was to highlight the difference in survivorship rate/extinction probability between different scenarios hence we did not model the species’ recovery rate, or the ability to recover from any stochastic catastrophe. In the absence of input values and the interests of clarity, we did not model genetic effects or density dependent breeding effects. There was no account made in this modelling for either harvest, or supplementation of the population.
A run of 5000 iterations, modelling the population over 200 years, was completed for the background configuration detailed above. The data from this was collated, and the mean extinction was used to generate a probability of extinction.
4.1.2 Incorporating the effects of wind farm collisions
From the cumulative effects modelling process, it was predicted that the overall survival rate for the Tasmanian Wedge-tailed Eagle may be expected to drop from a background environmental rate of 0.8660 to 0.8646. This corresponds to a 0.001% increase in mortality rate. As wind farms are assumed to be non-discriminating in their risk, this 0.001% increase in mortality was applied across all of the life stages. Environmental variation and all other factors were kept the same as previously. Another 5000 scenarios were run to model the predicted cumulative effects of wind farm collisions, and the mean outputs were compared with the outputs of the previous ‘background’ model.
4.1.3 Assessment of significant impacts
It order to ascertain a point at which the effects of collisions at a number of wind farms begin to make a measurable and significant effect on the extinction risk to the population, we re-ran the wind farm scenario a number of times increasing the environmental mortality each time. This process, under the refinements and assumptions of this very simplified PVA, permitted us to determine a level at which heightened mortality began to significantly increase the probability of extinction risk.

Modelled cumulative impacts of wind farms on the Tasmanian Wedge-tailed Eagle – September 2005
B I O S I S R E S E A R C H Results and Discussion: PVA Modelling of Critical Impact Assessment 36
5.0 RESULTS AND DISCUSSION: PVA MODELLING OF CRITICAL IMPACT ASSESSMENTPVA modelling found that the risk of extinction is not affected to any significant level by the introduction of collision risks predicted by our modelling of the cumulative impacts for the seven wind farms assessed here.
Comparing the two P(Extinct) curves generated for extinction risk in the absence of the seven wind farms and with the seven wind farms (i.e. with a mortality rate increase of 1.001 over the base scenario) (Figure 1), a slight increase in extinction risk can be identified for the data set containing wind farm effects. However the standard error associated with each curve clearly overlaps the other, indicating that there is no significant difference. In fact, the median year of extinction for both scenarios is identical, supporting the argument of no significant effect.
Figure 1
Examining the same curves with the Standard error bars overlain (Figure 2), it can be seen that there is no significance to the slight difference between the two curves.

Modelled cumulative impacts of wind farms on the Tasmanian Wedge-tailed Eagle – September 2005
B I O S I S R E S E A R C H Results and Discussion: PVA Modelling of Critical Impact Assessment 37
Figure 2
The model was re-run using the same scenarios but with incrementally increased mortality each time with a view to determining a point at which the effects of collisions at a number of wind farms begin to make a measurable and significant effect on the extinction risk to the population. Hence, it was run with for 1.005, 1.0075, 1.01 and 1.02 times the background mortality. This generated the family
of curves shown in Figure 3.

Modelled cumulative impacts of wind farms on the Tasmanian Wedge-tailed Eagle – September 2005
B I O S I S R E S E A R C H Results and Discussion: PVA Modelling of Critical Impact Assessment 38
Figure 3
It is at the 1.005 level, or an increase of 0.5% to the background mortality rate that a difference in the models can first start to be resolved. It should be noted here that the increase of 0.75% actually shows a greater chance of extinction than increasing the background mortality by a whole percentage point. This serves to highlight the level of caution we should have in using the model for such fine analysis.
Figure 4
Showing the error bars, we can see that they just begin to separate at the 0.5% level (Figure 4).
If we examine the mean numbers of individuals predicted for any given time we can see that all curves are well and truly within each other’s band of confidence (Figure 5).

Modelled cumulative impacts of wind farms on the Tasmanian Wedge-tailed Eagle – September 2005
B I O S I S R E S E A R C H Results and Discussion: PVA Modelling of Critical Impact Assessment 39
Figure 5
5.1.1 Conclusion and caveats
Predicted risk of extinction for Tasmanian Wedge-tailed Eagles of the modelled cumulative impacts of the seven wind farms (i.e. an expected 0.001 increase in mortality) is not significantly different from that indicated for the population in the absence of those wind farms. PVA modelling predicted a significant difference in extinction risk only when the mortality rate increased to five times that level. On this basis it could be predicted that a significant impact on the Tasmanian Wedge-tailed Eagle population, over and above the existing variable mortality due to current environmental conditions, might occur only if collisions with turbines occur at a considerably higher rate than they are predicted to by our modelling for seven existing and currently proposed wind farms.
However, we offer this assessment derived from PVA modelling with strong reservations. Using the PVA model in this way places incredible faith in its representation. We have used the PVA model in the most appropriate setting, as an aid to comparison of two scenarios. Unfortunately, the actual data entered to the PVA model is simplistic as it does not account for catastrophes, significant events, or a full range of potential environmental variables. These factors aside, the simple PVA as it is used here can highlight the extent to which collisions with turbines at that the wind farm sites can be expected to affect the likelihood

Modelled cumulative impacts of wind farms on the Tasmanian Wedge-tailed Eagle – September 2005
B I O S I S R E S E A R C H Results and Discussion: PVA Modelling of Critical Impact Assessment 40
of survival. By removing the environmental factors described above, we reduce the variability of the population, and increase the sensitivity of the population to background environmental mortality rates. This will result in a slight overstatement of the sensitivity to cumulative effects of wind farms on the probability of survival.

Modelled cumulative impacts of wind farms on the Tasmanian Wedge-tailed Eagle – September 2005
B I O S I S R E S E A R C H Appendices 41
APPENDICES
Modelled cumulative impacts of wind farms on the Tasmanian Wedge-tailed Eagle – September 2005
B I O S I S R E S E A R C H Appendix 1 42
APPENDIX 1 Cumulative Wind Farm Effects Modelling

Cumulative Wind Farm Effects
Modelling
Approach and Justification
Stuart MuirSymboliX
forBiosis Research Pty. Ltd
June 10, 2005
Abstract
The method to combine the individual wind-farm site assessments intoa cumulative effects model is described. It is shown that this is done bymultiplying all the individual site survival probabilities for each speciestogether. i.e Survival chance = P (S1)P (S2)P (S3)P (S4) . . . P (SN )
1 Introduction
Previous windfarm modelling has resulted in a measure of risk of bird-turbine interactions. It inherently relied on the assumption that the birdinteracted with the site of the farm, and proceeded to generate a measureof the probability of birdstrike through calculations of presented areas ofturbine and assumptions and observations of bird movements.
To approximate cumulative effects of multiple windfarms on the risk ofstrike, we need to remove the assumption that the bird is already interact-ing with the site. Having done this, we must account for the probabilitiesof interacting with a given farm site, and then incorporate the risk ofstrike associated with that farm. We then can proceed to calculate thesurvival rate of a bird population residing or moving through a regionwith resident windfarms.
2 Mechanics
This section is provided to allow for subsequent auditing of the process.Due to its technical nature, it may be skimmed by the non-technicalreader.
1

2.0.1 Definitions
• “region” At this stage we only refer to a region to allow the distinc-tion between “home-ranges” and “habitats.” Appropriate choicesfor what these regions represent will need to be made at a laterstage.
• N the number of wind farm sites found within the region of interest
• “site” A particular wind farm, consisting of turbines standing onsome of the region
• Bi the event of a birdstrike associated with site i
• Ai the event of a bird interacting with site i
• Si the event of survival of an interaction with site i
• P (C) a measure of the probability of an event, C, occurring
Note: The development of the method requires that all mortality riskassessments be converted to survival chance. This is due to the impossi-bility of a struck bird going on to either be struck again, or to survive thenext interaction. Only survivors can continue to interact.
2.1 Estimating Individual Site Risk (P (Bi|Ai))
As stated previously, the previous wind farm risk assessments have con-centrated on the risk of strike, given that the bird is flying through thesite.
Using the definitions of section 2.0.1, this is written as
P (Bi|Ai), (1)
and read as the probability of strike (event Bi), given that the bird isalready on site (event Ai).
A measure of this risk can be obtained one of two ways. Assumingthere is a significant population (defined to be large enough that the lossof a single bird will not be significant and another individual will replaceit) then
Movements at Risk
Total Yearly Movements(2)
can be used. Using this ratio implicitly assumes that the site populationis comparable to the number of observed movements. This may result ina significant under estimate of risk.
If the population is small, then the mortality rate should be taken fromthe earlier model’s measure of corpse numbers per year, and expressed as
Expected corpses per year
Population. (3)
The later form, if population data is available, is the preferred form.This is both for completeness as well as ease of implementation. If theactual population is known to be small but site residency is unknown, it isbetter to estimate site population, or enter the habitat population, thanto rely on the movements at risk approximation which could well be twoorders of magnitude below actual risk.
2

2.2 Estimating the chance of surviving a site
To estimate the chance of surviving a site, we need both the probabilityof never visiting (P (A′)) and the chance of visiting, but not being struck(P (B′|A)). As there are only three possibilities,
1. Visiting and not being struck,
2. Visiting and being struck,
3. and Not visiting at all
the easiest estimation of this risk is to calculate the risk of visiting andbeing struck, and subtract this value from unity.
The probability of visiting and being struck is given by,
P (Ai ∩ Bi) = P (Ai)P (Bi|Ai) (4)
The chance of surviving site i is then given by
P ((Ai ∩ Bi)′) = P (Si) = 1 − P (Ai)P (Bi|Ai) (5)
Note: Earlier, non-cumulative models assumed that P (A) = 1The previous section (2.1) dealt with derivation of the second term.
The first term (P (Ai)) can be approximated a number of ways. These aredetailed next.
2.3 Estimating the chance of visiting a site (P (Ai))
Previous modelling successfully avoided the issue of the physical size ofthe windfarm site through its implementation of the observational data.Unfortunately, there does not appear to be any way to avoid incorporatingthis measure into the model at this stage.
The chances of visiting a given site can be generated by measuring theinteraction between a region and the site. This is most naturally doneby comparing areas of the site relative to the region. This assumes thatthere is no reason for visiting or avoiding the site relative to any otherarea of the region. It may be appropriate to adjust this value if the siteis a significant habitat or food source likely to attract visits. Conversely,if the site is barren, P (Ai) might be adjusted downwards to account forthis. Without accurate data on visitation habits, the following estimatesare safe and realistic by assuming a homogenous region.
A basic measure of this probability is given by
P (Ai) =Area of site
Area of region(6)
This approximation is most appropriate for sedentary species, wherethe relevant region is the home range, not the habitat.
The form indicated above may also be used for migratory species. Ifit is to be used for a migratory species, the region appropriate becomesthe habitat area. Should the species be using a narrow corridor, this formwill be an underestimate of risk.
For a migratory species using a corridor, P (Ai), is better approxi-mated by taking the widest projection of the farm site (orthogonal to the
3

corridor), and dividing through by the width of the migratory corridor atthat location. i.e
P (Ai) =width of site
width of corridor. (7)
This removes the possibility of birds flying around a farm placed inthe corridor, without ever “passing” it. This eventuality is possible forsedentary species, who are free to roam in arcs whilst avoiding the actualsite.
2.4 Cumulative effect of N sites
Having generated the chance of surviving site i’s existence(P (Si) = 1 − P (Ai)P (Bi|Ai)),we need to know the likelihood of surviving all N sites in the region.
This is given byP (S1 ∩ S2 ∩ S3 ∩ . . . ). (8)
As surviving any one of the windfarm sites in the region is independentof surviving any other site, this simplifies to
P (S1...N ) = P (S1)P (S2)P (S3) . . . (9)
= ΠNi P (Si) (10)
3 Summary
The derivation of cumulative effects takes into account the varying individ-ual risk presented by each wind farm in a given region. This informationcan be taken directly from the previously prepared reports on each site.Extra information required to perform this calculation is:
For sedentary species : relative areas of home ranges and site areas occu-pied by windfarms/turbines
For migratory species : effective blockage of corridors by windfarm sites.
3.1 Calculation steps
To calculate the cumulative effect on the survival rate of a species:
1. Identify the sites relevant to each species
2. Estimate the mortality rate for each site (P (Bi|Ai)). This can bedone either through the movements at risk, or mortality (corpse)rate found on the summary pages. (See Section 2.2)
3. Determine an appropriate chance of site visitation, P (Ai). (See Sec-tion 2.3)Note: If the home range of a sedentary species is signifi-cantly smaller than the habitat, then average, representa-tive values for these probabilities may be calculated andsubstituted.
4

4. Determine the survival rate of each site via 1 − P (Ai)P (Bi|Ai).
5. Multiply all the survival rates of each site relevant to the speciestogether.Note: If using average properties (as discussed in the pre-vious point), raise the average probability to the power ofthe number of sites relevant to the size of the home range.
The resultant figure is a chance of survival for the species as a resultof the residency of windfarms in the habitat or corridor. A figure of unity(1) indicates no individual will ever be struck. Zero (0) indicates completeloss of the population.
5

Modelled cumulative impacts of wind farms on the Tasmanian Wedge-tailed Eagle – September 2005
B I O S I S R E S E A R C H References 48
REFERENCESBarrett, G., Silcocks, A., Barry, S.,
Cunningham, R and Poulter, R. 2003. The New Atlas of Australian Birds.Royal Australasian Ornithologists Union. Hawthorn East.
Bekessy, S., Fox, J., Brown, B., Regan, T. and Mooney, N. 2004. TasmanianWedge-tailed Eagle (Aquila audax fleayi). in Linking landscape ecology and management to population viability analysis. Report 2: Population viability analyses for eleven forest dependent species.University of Melbourne and Forestry Tasmania.
Bell, P.J., and Mooney, N.J. 1999. The Wedge-tailed Eagle Recovery Plan 1998 – 2003. Tasmanian Parks And Wildlife Service, Hobart.
Brook B.W., Burgman M.A., Akçakaya H.R., O’Grady J.J., and Frankham R., 2002. Critiques of PVA ask the wrong questions: throwing the heuristic baby out with the numerical bath water.Conserv. Biol. 16, 262-263.
Brothers, N., Pemberton, D. Pryor, H. and Halley, V. 2001. Tasmania’sOffshore Islands: seabirds and other natural features. Tasmanian Museum and Art Gallery, Hobart
Bryant, S. and Jackson, J. 1999. Tasmania’s Threatened Fauna Handbook. Parks and Wildlife Service Tasmania, Hobart
Burgman, M.A., 2000. Populationviability analysis for bird conservation: prediction, heuristics, monitoring and psychology. Emu, 100, 347-353.
Coates, A., 2004. Collision Risk Report.Appendix 12C Lewis Wind Farm Proposal. ERM Consulting, Edinburgh 2004.
Dirksen, S., Spaans, A.L. & van der Winden, J. 1996. Nachtelijke trek en vlieghoogtes van steltlopers in het voorjaar over de Noordelijke Havendam van Ijmuiden [Nocturnal migration and flight altitudes of waders at the Ijmuiden Northern Breakwater during spring migration].Sula 10: 129-142.
Everaet, J., Devos, K. & Kyuijken, E. 2002. Windturbines en vogels in Vlaanderen: Voorlopige onderzoeksreultaten en buitenlandse bevindingen [Wind turbines and birds in Flanders (Belgium): Preliminary study results in a European context]. Instituut voor Natuurbehoud, Report R. 2002.03, Brussels.
Garnett, S.T. and Crowley, G. M. 2000. The Action Plan for Australian Birds. Environment Australia, Canberra.
Krebs, C. J. 1978. Ecology: the experimental analysis of distribution and abundance. 2nd edn. Harper and Row. New York.
Langston, R.H.W. & Pullan, J.D. 2002. Windfarms and birds: an analysis of the effects of windfarms on birds, and guidance on environmental assessment criteria and site selection issues. Birdlife International report to the Bern Convention. Convention on the Conservation of European Wildlife and Natural habitats, Strasbourg, France.
Marchant, S. and Higgins, P.J. 1993. Handbook of Australian, New Zealand and Antarctic Birds Volume 2 Raptors to Lapwings. Oxford University Press, Melbourne.
Modelled cumulative impacts of wind farms on the Tasmanian Wedge-tailed Eagle – September 2005
B I O S I S R E S E A R C H References 49
Meredith, C., Venosta, M. & Ressom, R. 2002, Codrington Wind Farm Avian Avoidance Behaviour Report. Biosis Research Pty. Ltd. Report to Pacific Hydro Pty. Ltd.
Mooney, N. and Holdsworth, M. 1991. The effects of disturbance on nesting Wedge-tailed Eagles (Aquila audax fleayi) in Tasmania. Tasforests, 3:15 – 32.
Mossop, D.H. 1997. Five years of monitoring bird strike potential at a Mountain-Top Wind Turbine, Yukon Territory. Annual Canadian Wind Energy Conference and Exhibition.Pp. 197-211. Yukon Energy Corporation, Whitehorse, Yukon, Canada.
Olsen, P. 1995. Australian Birds of Prey: the Biology and Conservation of Raptors. University of New South Wales Press, Sydney.
Percival, S. 1998. Beinn Churlaich, Islay, Proposed Wind Cluster - On Geese and Turbines. Supplementary Precognition to Board of Inquiry.
Percival, S.M. 2001. Assessment of the Effects of Offshore Wind Farms on Birds. Consultancy Report to UK Department of Technology and Industry. Ecology Consulting, University of Sunderland, Sunderland, UK.
Winkleman, J.E. 1990. Nocturnalcollision risks for and behaviour of birds approaching a rotor in operation in the experimental wind park near Oosterbierum, Friesland, The Netherlands; English summary. Rijksinstituut voor Natuurbeheer, Arnheim. RIN-Rapport 90/17.
Winkelman, J.E. 1992. The impact of the Sep wind Park near Oosterbierum (Fr.), The Netherlands on birds. 2. nocturnal collision victims. RIN-Rapport 92/3. Rijksinstitut voor Natuurbeheer, Arnhem, The Netherlands.
Winkelman, J.E. 1994. Bird/wind turbine investigations in Europe. National Avian-Wind power planning meeting. Pp. 43-47.

Swift ParrotDave Watts

Modelled cumulative impacts on the Swift Parrot of wind farms across the species’ range in south-eastern Australia
October 2005
Ian Smales

Report forDepartment of Environment and Heritage
Modelled cumulative impacts on the Swift Parrot of wind farms across the species’ range in south-eastern Australia
October 2005
Ian Smales
Project no. 5238
BIOSISR E S E A R C H
Biosis Research Pty. Ltd. This document is and shall remain the property of Biosis Research Pty Ltd. The document may only be used for the purposes for which it was commissioned and in accordance with the Terms of the Engagement for the commission. Unauthorised use of this document in any form whatsoever is prohibited.
BIOSIS RESEARCH Pty. Ltd. A.B.N. 65 006 175 097 Natural & Cultural Heritage Consultants
Ballarat: 449 Doveton Street north, Ballarat VIC 3354 Ph: (03) 5331 7000 Fax: (03) 5331 7033 email: [email protected]
Melbourne: 38 Bertie Street Port Melbourne 3207 Ph: (03) 9646 9499 Fax: (03) 9646 9242 email: [email protected]

Modelled cumulative impacts of wind farms on the Swift Parrot – October 2005
B I O S I S R E S E A R C H Acknowledgments & Abbreviations III
ACKNOWLEDGEMENTS
Biosis Research wishes to acknowledge the contribution of the following people and organisations in undertaking this study:
SymboliXStuart Muir
Department of the Environment & Heritage, Canberra Wayne Furler Alex Rankin
Swift Parrot Recovery Team Debbie SaundersChris Tzaros Ray Brereton
Biosis Research Pty. Ltd. Charles Meredith Bob Baird Rohan Clarke
ABBREVIATIONS
DEH Department of the Environment & Heritage EPBC Act Environment Protection and Biodiversity Conservation Act 1999

Modelled cumulative impacts of wind farms on the Swift Parrot – October 2005
B I O S I S R E S E A R C H Contents IV
CONTENTS1.0 INTRODUCTION ......................................................................................................... 5
1.1 Project Background................................................................................................... 51.1.1 Risk modelling.............................................................................................................. 51.1.2 Overview of Collision Risk Modelling for individual wind farms................................... 61.1.3 Presentation of results ................................................................................................. 81.1.4 Swift Parrot ecology ..................................................................................................... 81.1.5 Swift Parrot population size ......................................................................................... 91.1.6 Swift Parrot breeding range ......................................................................................... 91.1.7 Swift Parrot migration................................................................................................... 91.1.8 Swift Parrot population dispersion in the mainland range ......................................... 101.1.9 Swift Parrot collisions................................................................................................. 11
2.0 METHODS: CUMULATIVE IMPACTS MODELLING ............................................... 152.1 Mathematical approach to cumulative impacts modelling.................................. 15
2.2 Model inputs............................................................................................................. 16
2.3 Parameters of wind farms....................................................................................... 172.3.1 Turbines ..................................................................................................................... 182.3.2 Turbine number and configuration............................................................................. 20
2.4 Parameters of Swift Parrots.................................................................................... 212.4.1 Size and flight speed of Swift Parrots ........................................................................ 212.4.2 Flight heights of Swift Parrots .................................................................................... 212.4.3 Periodicity, population size and movements of Swift Parrots at wind farm sites....... 222.4.4 Avoidance by Swift Parrots of wind turbines ............................................................. 26
3.0 RESULTS: CUMULATIVE IMPACTS MODELLING ................................................ 283.1 Estimated impacts from modelling of individual wind farms ............................. 28
3.2 Estimated cumulative impacts across the range of the Swift Parrot................. 303.2.1 Impacts on annual survivorship of total Swift Parrot population................................ 303.2.2 Predicted Swift Parrot mortalities............................................................................... 303.2.3 Conclusion ................................................................................................................. 32
APPENDICES........................................................................................................................... 33APPENDIX 1............................................................................................................................. 34
Cumulative Wind Farm Effects Modelling ....................................................................... 34
REFERENCES ......................................................................................................................... 40

Modelled cumulative impacts of wind farms on the Swift Parrot – October 2005
B I O S I S R E S E A R C H Introduction 5
1.0 INTRODUCTION
1.1 Project Background
The Swift Parrot Lathamus discolor is listed as Endangered under provisions of the EPBC Act for threatened species. The species migrates annually between Tasmania and the coast of south-eastern Australia. Current population estimates indicate that the population numbers fewer than 2000 birds. The species range coincides with a number of recently constructed wind power generation facilities (wind farms) and more facilities are proposed within its range. The wind farms may pose a risk of collision to the parrot as bird mortalities are known from wind farms in a variety of situations worldwide.
The essential aim of the current project is to predict, based upon the extant population of Swift Parrots, the potential cumulative impacts of collision risk posed by wind farms across the range of the species distribution. The project utilises bird collision risk modelling to generate assessments of the cumulative risk to the endangered Swift Parrot posed by such collisions.
The cumulative modelling was undertaken for the species using the Biosis Research avian collision risk model. The assessment is based on existing and currently proposed wind farm sites.
Using data available for the Swift Parrot, the Biosis Research collision model is utilised to determine the bird strike risk for the parrot’s population from the wind farms in the following categories, as at 30th May 2005, within the species range:
(i) already constructed or approved;
(ii) referred under the Environment Protection and Biodiversity Conservation Act 1999 (EPBC Act) and:
. determined to be not a controlled action (NCA);
. determined to be not a controlled action manner specified (NCA-MS);
. approved under the EPBC Act; and
. proposed and currently being assessed for a determination under the EPBC Act.
1.1.1 Risk modelling
The fundamental objective of modelling of risk is to provide a rigorous process

Modelled cumulative impacts of wind farms on the Swift Parrot – October 2005
B I O S I S R E S E A R C H Introduction 6
by which probability can be assessed in a manner that can be replicated.
When making predictions of risk, the rationale behind the predictions is explicitly stated in the mathematics of a model, which means that the logical consistency of the predictions can be easily evaluated. Compared to subjective judgement, this makes models more open to analysis, criticism and modification when new information becomes available. Although there may be assumptions used and some arbitrary choices when deciding on the structure and parameters of a model, these choices are stated explicitly when using a model but are difficult to disclose when making subjective judgements. Assessments based on subjective judgement can give the illusion that they are not scientifically rigorous (Burgman 2000), regardless of whether they are or not. The assumptions underlying a model can be tested. Models can be used to help design data collection strategies. They can help to resolve and avoid inconsistencies, and the rigorous analysis of data can help to clarify thoughts. Models are often most valuable for their heuristic capacities, by focussing attention on the important processes and parameters when assessing risks (Brook et al., 2002). These benefits are difficult, if not impossible to achieve with subjective judgement.
Biosis Research’s Avian Collision Risk Assessment Model is designed to determine the risk of birdstrike at individual wind farms. This model has been modified to create a Multi-site Risk Assessment Model, enabling the assessment of cumulative risk from multiple wind farms. No other windfarm avian collision risk model currently exists in Australia, and the Biosis Research model is more advanced than those that have been used overseas. The Biosis Research model has been developed in the context of Australian birds and has been tested on a range of wind farm proposals in Australia, and has been subject to independent peer review by Uniquest Pty. Ltd. (University of Queensland). It has been constantly updated and improved over the last five years and now constitutes a unique and powerful tool for assessing the potential impacts of wind farms on birds. The model is the proprietary software of Biosis Research Pty. Ltd.
1.1.2 Overview of Collision Risk Modelling for individual wind farms
In order to quantify levels of potential risk to birds from collision with turbines, Biosis Research Pty Ltd developed a detailed method for the assessment of deterministic collision risk, initially for the Woolnorth Wind Farm in Tasmania (Meredith et al. 2000). This model has continued to be used for a variety of operating wind farms as further data has been obtained and has also been used to assess the potential impacts of wind farms at a number of further potential sites in Tasmania, Victoria, South Australia and recently in Fiji. It is applied here to determine levels of predicted risk to Swift Parrots from individual wind farms.
The model provides a measure of the potential risk at different rates at which

Modelled cumulative impacts of wind farms on the Swift Parrot – October 2005
B I O S I S R E S E A R C H Introduction 7
birds might avoid collisions. For example, a 95% avoidance rate means that in one of every twenty flights a bird would hit an obstacle in its path. Clearly, birds have vastly better avoidance capacity than this and it is well established overseas that even collision-prone bird species avoid collisions with wind generators on most occasions (see Section 2.4.2, below).
In the modelling undertaken for the present project we divide the risk into two height zones according to components of wind turbine structures. These are:
1. the stationary tower below rotor height, and
2. the turbine components within the height area swept by turbine rotors
We consider that birds will avoid collision with the stationary tower below rotor height in all but the most exceptional circumstances and model for 99% avoidance rate in that height zone. For the zone within rotor-swept height (encompassing rotors, upper portion of tower and nacelle) we provide predictions for movements at risk for each of 95%, 98% and 99% avoidance rates.
In usual practice the model requires data on the utilisation rates of each species being modelled, as collected during Point Count surveys on-site. These data provide inputs to the model regarding activities of birds that might be at risk of collision with turbines. Where data are not available because a species is not recorded from a site, or where data are too few and are thus an unreliable basis for extrapolation, a well informed scenario can be used, as is the case for the present project. The risk assessment accounts for a combination of variables that are specific to the particular wind farm and to birds that inhabit the vicinity.
The variables are:
The numbers of flights for each bird species below rotor height, and for which just the lower portion of turbine towers present a collision risk.
The numbers of bird flights at heights within the zone swept by turbine rotors, and for which the upper portion of towers, nacelles and rotors present a collision risk.
The numbers of movements-at-risk of collision. Usually this parameter is as recorded for each species during timed Point Counts, which are then extrapolated to determine an estimated number of movements-at-risk for each species for an entire year. Account is taken of whether particular bird species are year-round residents or annual migrants.
The mean area of tower (m2 per turbine), nacelle and stationary rotor blades of a wind generator that present a risk to birds. The multidirectional model used

Modelled cumulative impacts of wind farms on the Swift Parrot – October 2005
B I O S I S R E S E A R C H Introduction 8
here allows for birds to move toward a turbine from any direction. Thus the mean area presented by a turbine is between the maximum (where the direction of the bird is perpendicular to the plane of the rotor sweep) and the minimum (where the direction of the bird is parallel to the plane of the rotor sweep). The mean presented area is determined from turbine specifications supplied to Biosis Research for individual turbine makes and models.
The additional area (m2 per turbine) presented by the movement of rotors during the potential flight of a bird through a turbine. This is determined according to the length and flight speed of the bird species in question. In the case of the Swift Parrot the bird’s length is set at 230 mm and its flight speed at 60 km/h.
A calculation, based on the total number of turbines proposed for the wind farm, of the number of turbines likely to be encountered by a bird in any one flight. This differs according to whether turbines form a linear or a clustered array on the landscape.
A value, or values, for each of the parameters above forms an input to the model for each wind farm for which collision risk is modelled.
1.1.3 Presentation of results
All collisions are assumed to result in death of a bird or birds. Results produced from modelling of the collision risk to Swift Parrots, of both individual wind farms and of the cumulative impacts of them all, are expressed here in terms of the annual proportion of the known population of the species that are predicted to survive encounters with wind turbines. On the basis of the size of the population modelled as likely to encounter wind farms, the modelling also provides an actual number of parrots predicted to be killed annually.
1.1.4 Swift Parrot ecology
The Swift Parrot Lathamus discolor is a small, fast-flying nectarivorous parrot that inhabits eucalypt forests in south eastern Australia. Swift Parrots breed in eastern Tasmania and migrate to mainland Australia in autumn
Within both the breeding and non-breeding range, Swift Parrots prefer to forage in larger trees, as these provide greater floral food resources than smaller trees and also flower more frequently (Wilson and Bennett 1999). During the breeding season, Swift Parrots feed primarily on the nectar from the flowers of Tasmanian Blue Gum Eucalyptus globulus and to a lesser extent Swamp Gum Eucalytptus ovata. Post-breeding food resources in Tasmania include a range of other summer and autumn flowering eucalypts. On mainland Australia, the

Modelled cumulative impacts of wind farms on the Swift Parrot – October 2005
B I O S I S R E S E A R C H Introduction 9
species feeds extensively on nectar and lerp (carbohydrate exudates of insects that feed on eucalypt phloem through leaf surfaces) from eucalypt flowers and foliage. Red Ironbark Eucalyptus tricarpa, Mugga Ironbark Eucalyptussideroxylon, Grey Box Eucalyptus microcarpa and Yellow Gum Eucalyptusleucoxylon provide important food resources during the non-breeding season. Other foods such as Acacia flowers, insect galls on foliage and insects are consumed less often.
Probably the most important habitat for overwintering Swift Parrots is the Box-Ironbark Forests of central Victoria and southern NSW, where it feeds on the profusely-flowering Red Ironbarks E. tricarpa (central Victoria), Mugga Ironbark E. sideroxylon (north eastern Victoria) and other flowering eucalypts.However, small numbers of individuals are often recorded foraging at winter-flowering eucalypts throughout much of south-eastern Australia, including within planted trees in parks and gardens in suburban Melbourne.
1.1.5 Swift Parrot population size
The most recent population estimates for the entire known population of the Swift Parrot are provided in the Swift Parrot Recovery Plan (Swift Parrot Recovery Team 2001). The most recent estimate is for the 1995/96 breeding season, for which an estimated 940 pairs were located. The Plan suggests that the Swift Parrot population is at best stable at an estimate 1000 breeding pairs but may be in a continuing decline due to habitat loss. The number of Swift Parrots can be expected to vary from an annual low immediately prior to the breeding season, to an annual high at the end of the breeding season.
No study of swift Parrot demographics has been undertaken, so demographic parameters such as annual mortality and fecundity rates are unknown.
1.1.6 Swift Parrot breeding range
The parrot has a breeding range restricted to Tasmania centred on the south-east coast within the range of Tasmanian Blue Gum Eucalyptus globulus. There is also a smaller breeding population between Launceston and Smithton on Tasmania’s north coast (Swift Parrot Recovery Team 2001).
1.1.7 Swift Parrot migration
The Swift Parrot migrates annually between its breeding range in eastern and north-central Tasmania and the coastal mainland of Victoria, New South Wales and southern Queensland. Rare occurrences are recorded from south-eastern South Australia. This annual process involves both regular migratory

Modelled cumulative impacts of wind farms on the Swift Parrot – October 2005
B I O S I S R E S E A R C H Introduction 10
movements through a very large geographic range and variable periods of residence by portions of the population at different locations across the range.The timing of migratory movements is quite well known from annual arrival and departures dates from the breeding range. However, actual migratory movements have rarely been documented for a number of reasons likely to include the following:
the small number of birds in the extant population,
the few ornithologists, relative to the extensive migration area, that are likely to be on hand to make observations of the species,
the fact that it entails crossings of Bass Strait,
the probability, based on the species flight capacity, that migrations across Bass Strait may be rapid, entailing direct flights of just a few hours (Brown 1989), and
the possibility, based on a general lack of records of Swift Parrots aggregating at ‘staging’ locations, that they may migrate directly across Bass Strait from locations dispersed across northern Tasmania and southern Victoria.
It is known that the annual migration cycle commences somewhat after the breeding season with some records of parrots appearing at various localities in Tasmania outside of the breeding range. Between January and May birds have generally left Tasmania (Higgins 1999) and thereafter are found across the mainland range. During August and September small to quite large groups of birds are sometimes located in southern Victoria, occasionally including urban areas. By October most birds are believed to be within the breeding range in Tasmania (Higgins 1999). During the annual periods of trans- Bass Strait movements, a few records exist from the Furneaux Islands and King Island, however these are not considered to suggest routine reliance on these islands by the migrating population (Higgins 1999).
1.1.8 Swift Parrot population dispersion in the mainland range
During the wintering period of the Swift Parrot’s annual cycle, birds may be found across much of Victoria, eastern New South Wales and south-eastern Queensland. Within this range, records of the species are most usually of birds feeding at flowering eucalypts and heavy concentrations of psyllid lerps on eucalypts (C. Tzaros pers. comm.). These resources may be very localised, eruptive and highly variable from one year to another. As a consequence, Swift Parrots appear to be very mobile, even nomadic, during the course of a given winter and their mainland distribution may differ considerably between years

Modelled cumulative impacts of wind farms on the Swift Parrot – October 2005
B I O S I S R E S E A R C H Introduction 11
(Higgins 1999). In general, the resource requirements of the species are met only within specific eucalypt forest or woodland environments. Planted flowering eucalypts in urban situations are sometimes used.
Wind farms are not suited to wooded environments and Swift Parrots are thus highly unlikely to reside in close proximity to wind farms anywhere within their range. Nonetheless, the mobile nature of the species means that it must traverse ‘unsuitable’ habitats whilst moving between places where it feeds, roosts and breeds. During these movements it is possible that occasional flights may be made through wind farms.
1.1.9 Swift Parrot collisions
Key threats affecting the Swift Parrot, are identified in the Swift Parrot Recovery Plan (Swift Parrot Recovery Team 2001) and The Action Plan for Australian Birds (Garnett and Crowley 2000).
The two key threats to the species are:
loss of habitat
mortality, primarily through collision with artificial objects
One of the recovery actions for the species listed in the Swift Parrot Recovery Plan 2001-2005 is:
to reduce the incidence of swift parrot collisions with man made structures including chain-link fences, windows and vehicles.
With a population estimated at 2000 birds or less (Swift Parrot Recovery Team 2001), mortality due to collisions with artificial structures, particularly when the population is concentrated during the breeding season in Tasmania, is believed to be removing a significant proportion of the population each year. Since collisions with man-made structures are significant in this species, the following review has been compiled to assist assessment of the likelihood that collisions with wind turbines might occur.
Studies of Swift Parrot mortality that have been recorded since 1981 indicate that a substantial cause of death and injury in Tasmania and the mainland occurs as a result of collision with man-made structures. Primarily, these are:
windows (including buildings and bus shelters);
chain mesh fences; and
cars.
The most common cause of such deaths of Swift Parrots is trauma, sustained

Modelled cumulative impacts of wind farms on the Swift Parrot – October 2005
B I O S I S R E S E A R C H Introduction 12
through window strike, fence strike or motor vehicle impact. In some cases a cause of death has not been identified. To date, no wind turbines have been implicated in Swift Parrot collisions.
For south-east mainland Australia, records of Swift Parrot collisions have been kept since 2002. A summary of this information has been kindly provided by Debbie Saunders, co-ordinator of the National Swift Parrot Recovery Team and is presented in Table 1 below.
Table 1 Summary of Swift Parrot collision in south-east mainland Australia
Year Number Status Window Busshelter Fence Car Unknown
2002 14 Deceased 3 - 2 4 5 3 Released 1 - - 1 1
2003 3 Deceased 1 1 - 1 - 2 Released 1 1 - - -
2004 2 Deceased - - - - - Released - - - - 2
2005 (to date) 1 Deceased 1 - - - -
Released - - - - -
Total 7 2 2 6 8
Data provided by Debbie Saunders, Swift Parrot Recovery Team co-ordinator
The high number of collisions in 2002 is attributed to drought forcing Swift Parrots to concentrate their foraging in eucalypts in developed areas where they are thought to have encountered man-made structures more often than normal.
Overall the statistics presented above are likely to represent only a small proportion of the total number of birds that have collided with objects. They do not include birds taken to wildlife carers and not reported to the Recovery Team, birds not collected at all, and birds not found due to inaccessibility of the site of a collision. Numbers cited here are for the mainland and it is understood that in the order of 15 to 20 birds are documented as being killed due to collisions in Tasmania each year.
Swift Parrot collisions with built structures like chainmesh fences, windows and glass bus shelters are associated with situations where such structures are in close proximity to sites of concentrated foraging by the species. The species is known for bursts of extremely rapid flight (hence its common name). In situations where groups of the birds aggregate to forage in close proximity to mesh fences and glass and fly rapidly amongst trees, this flight behaviour seems to be a primary factor leading to collisions. Most likely these collisions occur principally where birds can see through glass or mesh without perceiving them to be barriers.

Modelled cumulative impacts of wind farms on the Swift Parrot – October 2005
B I O S I S R E S E A R C H Introduction 13
The proximity of a structure to a tree in which Swift Parrots forage is believed to influence the likelihood of collision and the degree of injury suffered by a bird.This is related to the behaviour of the bird when leaving a foraging tree. Swift Parrots typically swoop out of a tree and fly at 1-2 metres above the ground as they gain speed. Studies of injuries suffered by Swift Parrots indicate that birds do not collide head-first with structures, but many strike objects with the sternum. This suggests that the bird may see an object and attempt to avoid it but cannot due to its flight speed. As such, the experts consider the following scenarios are likely:
A Swift Parrot may collide with a structure located immediately adjacent to a foraging tree but is less likely to suffer fatal injuries as it will be travelling at a slower rate at the time of impact.
A Swift Parrot is likely to collide with structures, particularly mesh fences or bus shelters, that are in the zone of their flight when they are 1-2 metres above the ground. They are likely to suffer fatal injuries as they are flying at high speeds in this portion of their flight.
Swift Parrots are likely to avoid a structure that is situated far enough from a foraging resource that they will have gained sufficient height to pass above the object. However, if they do collide, they will be travelling at high speed and be likely to suffer fatal injuries.
In the breeding range in Tasmania the placement of a structure in an area between breeding and foraging habitat is also likely to pose a high risk to Swift Parrots. This is principally due to the number of movements the birds make between their two key habitat areas. However, a collision in this instance resulting in death of an adult could have a greater impact on the population through the potential for resultant death of eggs or dependent juveniles.
It is suggested that longer movements, in which Swift Parrots fly between more distant locations, may entail different behaviours that are less prone to collision risk. This may be because they generally fly at greater heights above the ground when making such movements thereby reducing the risks of collision.
Wind farms in south-eastern Australia are not built in wooded or forested environments. None of the current and proposed wind farm developments within the overall range of the Swift Parrot are in close proximity to habitats utilised by the species. Wind turbines are solid, opaque structures and the risks posed by moving rotors are generally within the height range of between 30 and 120 metres above the ground. It is thus considered unlikely that the types of collision situations that the parrot presently encounters in urban environments will exist at

Modelled cumulative impacts of wind farms on the Swift Parrot – October 2005
B I O S I S R E S E A R C H Introduction 14
wind farms.

Modelled cumulative impacts of wind farms on the Swift Parrot – October 2005
B I O S I S R E S E A R C H Methods: Cumulative Impacts Modelling 15
2.0 METHODS: CUMULATIVE IMPACTS MODELLINGMethods are presented here for the first aim of the project - to predict, based upon the extant population of Swift Parrots, the potential cumulative impacts of collision risk posed by a number of wind farms across the range of the species distribution.
The modelling outlined here assesses the potential risks to a bird population of collision with wind-driven electricity turbines. Other potential impacts, such as loss of habitat, increased disturbance, or other effects that may result from wind farms are not encompassed by this assessment.
2.1 Mathematical approach to cumulative impacts modelling
The mathematical approach to modelling of the potential cumulative impacts on bird populations used, along with its rationale, is provided in Appendix 1 (Cumulative Wind Farm Effects Modelling by Dr. Stuart Muir).
The Swift Parrot migrates annually between its breeding range in portions of Tasmania and a large mainland area including parts of Victoria, New South Wales, Queensland and, occasionally South Australia. This annual process involves both regular migratory movements through a very large geographic range and variable periods of residence by portions of the population at different locations across the range. Throughout the entire distributional range of the species there are a number of current and proposed wind farms which may present a collision risk to the birds. The probability that any Swift Parrots will encounter and/or collide with turbines is likely to differ from one wind farm to another and according to the seasonal activities of the parrots in the regions of different wind farms. In essence, the approach taken here to modelling of potential cumulative impacts on the population has been as follows:
Initially, the possible impact of each wind farm on the Swift Parrot is modelled on the basis of an informed scenario of how part of the parrot’s total population might interact with the wind farm annually. The impact is expressed as a survivorship rate (annual probability of parrots surviving the risks of collision at the particular wind farm) for that part of the parrot population. Based on the number of individuals that are assumed to be at risk of collision at each wind farm, the predicted number of Swift Parrot fatalities per annum is calculated from the mortality rate (the direct inverse of survivorship rate) for that site.
The cumulative risk is subsequently determined as the number of birds that the scenario modelling predicts might be killed due to collisions with turbines, on

Modelled cumulative impacts of wind farms on the Swift Parrot – October 2005
B I O S I S R E S E A R C H Methods: Cumulative Impacts Modelling 16
average per annum, at all wind farms across the species’ range. This provides an indication of the level of cumulative impact on the entire population of Swift Parrots.
A background annual survivorship rate, that effects the entire population in the absence of impacts of wind farms, is not known. However, if or when that is determined, the turbine collision mortality rate for the population can be multiplied by the background rate to show the predicted change in population-wide mortality that modelling predicts will occur due to collisions with turbines across the species’ range. Since collision effects are considered to be constant over time, the adjusted mortality rate will be applicable regardless of the Swift Parrot population size.
Mathematics of modelling for the cumulative effects of birds colliding with wind turbines at all wind farms within the parrot’s range is outlined in Appendix 1. The population of Swift Parrots that might encounter wind farms is highly dispersed across a very wide range within which current and proposed wind farms are also very widely scattered. As a proportion of the landscape in which the parrots move, wind farms constitute only a minute fraction and none of the current or proposed wind farms occupies habitat that is ideal for Swift Parrots. It is thus considered that there is essentially a zero probability of a single bird encountering more than one wind farm in a given year. For that reason the cumulative effect of turbine collisions on the population is modelled in such a way that the number of sites with which any one bird can interact is modelled as one.
2.2 Model inputs
Inputs to the model have been determined to specifically assess the possible cumulative effects upon the Swift Parrot population posed by thirty-nine existing and proposed wind farms, through the entire range of the species’ natural distribution. Specific attributes of each wind farm were provided by DEH and were augmented where required, from our own investigations.
Field investigations of the utilisation by birds of twenty of the relevant wind farms have been undertaken previously by Biosis Research or other workers. Results of all of those studies were checked to determine the known usage of each site by Swift Parrots. As far as could be determined, the species has not been recorded at any wind farm site. As a consequence, modelling using actual utilisation rates for the species was not an option. Hence scenarios to represent the possible interactions of Swift Parrots with each wind farm were developed and used for modelling.

Modelled cumulative impacts of wind farms on the Swift Parrot – October 2005
B I O S I S R E S E A R C H Methods: Cumulative Impacts Modelling 17
The specific scenario developed for each wind farm site was determined from published information about the size Swift Parrot population and its geographic and temporal use of its distributional range. This was supplemented with more detailed information kindly provided by specialists with the species, particularly Chris Tzaros and Ray Brereton, of the National Swift Parrot Recovery Team. This provided useful additional information about key habitat characteristics and regions used by the parrots. Nevertheless, it is recognised that the seasonal distribution of the species on the mainland is quite unpredictable and considerable gaps in knowledge of the species exist, particularly with regard to the nature of movements between patches of suitable habitat. Where assumptions were made in the absence of empirical information, they are believed to be valid judgements based on what is known. Parameters specific to each site were used to account for seasonal variation in the population of Swift Parrots and behaviours of parrots.
We have used a precautionary approach to input assumptions to modelling. For instance, Swift Parrots have not been recorded at any of the thirty-nine wind farm sites under consideration despite some level of active searching for them at most of the sites. Thus there is no informative empirical data about actual numbers or variation in numbers of birds that might visit at any site. However we have modelled on the basis that a small number of birds do visit or pass through the great majority of sites. The scenarios modelled here thus exceed all actual experience. Similarly, we have modelled for birds to visit individual mainland wind farm locations over a duration of six months - which is longer than any birds have ever been recorded continuously from any mainland location. We have intentionally adopted this approach in an attempt to err, if at all, on the basis of over- rather than under-estimation of potential risks to the species.
2.3 Parameters of wind farms
Of the thirty-nine wind farms considered here, fourteen are built and currently in operation (Aurora, Blayney, Breamlea, Bluff Point (Woolnorth Lot 1), Canunda, Challicum Hills, Codrington, Crookwell, Flinders Island, Hampton, King Island Huxley Hill, Kooragang, Lake Bonney Stage 1, Toora (DEH data)). Yambuk is currently under construction and a further twenty-five are not yet constructed but fall within categories (i) or (ii) of Section 1.1, above. All of the thirty-nine wind farms considered are shown in Table 2 and Figure 1.
Key to the collision risk posed by a wind farm to Swift Parrots are both the specifications of turbines proposed to be used and configuration of turbines on the landscape.

Modelled cumulative impacts of wind farms on the Swift Parrot – October 2005
B I O S I S R E S E A R C H Methods: Cumulative Impacts Modelling 18
Table 2 Details of the thirty-nine wind farms assessed.
Wind farm
EPBCreferralnumber(where
applicable)
Positionco-ordinates
Number ofturbines Turbine model
Aurora 144.96 -37.77 1 0.01 MW
Bald Hills, Vic 730 145.95 -38.75 52 REPower 2MW
Blayney, NSW 149.22 -33.56 15 Vestas 0.66 MW
Bluff Point (Woolnorth Lot 1), Tas 12 144.92 -40.78 37 Vestas V66
Breamlea, Vic 439 144.60 -38.25 1 Westwind 0.60 MW
Canunda, SA 691 140.40 -37.77 23 Vestas V80
Cape Bridgewater, Vic 18 141.38 -38.37 40 NEG Micon NM82
Cape Nelson, Vic 18 141.54 -38.42 39 NEG Micon NM82
Cape Sir William Grant, Vic 19 141.62 -38.39 21 NEG Micon NM82
Challicum Hills, Vic 142.99 -37.24 35 NEG Micon NM64
Codrington, Vic 1929 141.97 -38.28 14 AN Bonus 1.3 MW
Crookwell, NSW 149.43 -34.57 8 NEG Micon NM44
Dollar, Vic 1110 146.17 -38.57 60 NEG Micon NM82
Drysdale, Vic 1960 40 *Vestas V90
Flinders Island, Tas 148.09 -40.04 2 Nordex 0.6 & 0.125 MW
Green Point, SA 529 140.88 -38.03 18 Vestas V90
Gunning, NSW 149.21 -34.74 31 Vestas V80
Hampton, NSW 150.11 -33.56 2 Vestas V52
Heemskirk, Tas 678 145.12 -41.83 53 Vestas V90
Jim's Plain, Tas 1162 144.84 -40.85 20 *Vestas V90
King Is Huxley Hill Stages 1 & 2, Tas 570 143.89 -39.94 3 Nordex 0.25 MW & Vestas
V52
Kongorong, SA 568 140.50 -37.94 20 *Vestas V90
Kooragang, NSW 151.68 -32.97 1 Vestas V52
Lake Bonney Stage 1, SA 265 140.07 -37.42 46 Vestas V66
Lake Bonney Stage 2, SA 1630 140.36 -37.69 53 Vestas V90
Mussleroe, Tas 46 Vestas V90 on low tower
Naroghid, Vic 1542 22 *Vestas V90
Nirranda South, Vic 763 142.79 -38.56 >40 *Vestas V66
Nirranda, Vic 471 142.74 -38.52 28 NEG Micon NM82
Paling Yard, NSW 2018 149.69 -34.11 50 *Vestas V90
Rosedale Ridge, Vic 1100 146.83 -38.09 45 *Vestas V90
Studland Bay (Woolnorth Lot 2), Tas 12 144.92 -40.78 25 Vestas V90
Taralga, NSW 1888 69 *Vestas V90

Modelled cumulative impacts of wind farms on the Swift Parrot – October 2005
B I O S I S R E S E A R C H Methods: Cumulative Impacts Modelling 19
Wind farm
EPBCreferralnumber(where
applicable)
Positionco-ordinates
Number ofturbines Turbine model
Toora, Vic 1109 146.41 -38.65 12 Vestas V66
Waubra, Vic 1864 143.66 -37.28 128 NEG Micon NM82
Wonthaggi, Vic 820 145.56 -38.61 6 REPower 2 MW
Woolsthorpe, Vic 1929 142.37 -38.15 30 *Vestas V90
Yaloak, Vic 925 144.29 -37.65 70 NEG Micon NM82
Yambuk, Vic 18 141.62 -38.39 20 NEG Micon NM82
* denotes turbine type used for modelling particular wind farm where manufacturer and model of turbine not specified
2.3.1 Turbines
The model of turbine in use, or proposed to be used, at the various wind farms differ. The specific attributes of turbines are incorporated into the model since the different turbine types present different collision risks to birds. Differences are due to such things as the size (‘presented area’) of the structure that a bird might strike and such specifics as operational rotor speed and percentage of time that rotors are likely to turn, as dictated by variables of appropriate wind speed and maintenance downtime.
As far as could be determined, sixteen different models of turbine are currently in operation, or are proposed to be built at the thirty-nine wind farms considered here. For nine potential wind farms we were not able to obtain a clear indication of the turbine type proposed to be used as it appeared that proponents have not yet determined which they might use. In those instances we modelled for a turbine type most likely to be used based on the total generating capacity planned for and from industry trends in the type of turbines being proposed. Table 2 provides information about turbines in use, or proposed for the thirty-nine wind farms assessed here.
Manufacturer’s specifications for wind turbine models were used to calculate attributes of each of the nine models. Sixteen dimensions for each turbine, in combination with rotor speed, were input to the model. The mean presented area [m2] of each turbine, that presents a collision risk to parrots, was calculated from specification data for both the static elements (all physical components of a turbine, including tower, nacelle, rotors) and the dynamic components (accounting for the movement of rotors) of each turbine structure.
The plane of a wind turbine rotor pivots in a 360 horizontal arc around the turbine tower in order to face into the wind direction. Hence, the area presenting a collision risk to a bird flying in a particular direction may vary from a maximum, in which the rotor plane is at 90 to the direction in which the bird is

Modelled cumulative impacts of wind farms on the Swift Parrot – October 2005
B I O S I S R E S E A R C H Methods: Cumulative Impacts Modelling 20
travelling, to a minimum in which the rotor plane is parallel with the travel direction of the bird.
To account for this variable, specifications for turbine types were used to calculate a mean area that each turbine presents to birds. The compass direction of the wind at any given time influences the direction faced by turbines. Where seasonal wind direction data for a particular wind farm site is known, it can be used to appropriately weight the mean presented area of a turbine according to the direction of birds’ flights if they, in turn, are strongly directional. However, in the modelling undertaken here, seasonal wind direction data for the great majority of wind farm locations was not available and few realistic assumptions could be made about prevailing directions of the parrots’ flights. Strongly directional movements are likely to be made by Swift Parrots during their annual migrations, however the number of such flights is an extremely small proportion of the total number of flights made by the birds during the course of a year. In this situation the use of a mean turbine area is appropriate as it assumes that neither the direction faced by turbines nor the direction of birds’ flights are biased toward any particular compass direction and it is thus assumed that a bird is equally likely to encounter a turbine from any direction. This approach was adopted for the present modelling.
The area presented by a turbine does differ according to whether the rotors are stationary or are in motion. When turbines are operational and rotors are in motion, the area swept by the rotors during passage of a bird the size of a Swift Parrot is included in calculations of the presented area.
Turbine rotors do not turn when wind speed is too low (usually below about 4 m/sec) and are braked and feathered to prevent them from turning if it is too high (usually in excess of about 25m/sec), and during maintenance. During such times only the minimum area of each turbine presents a collision risk. To account for the difference in mean area presented by operational and non-operational turbines a percentage of downtime is an input to the model.
2.3.2 Turbine number and configuration
Two principal components of the collision risk represented by a particular wind farm are the number of turbines at the site and way in which they are positioned relative to each other in the landscape.
The number of turbines at each site is a simple parameter input to the model.

Modelled cumulative impacts of wind farms on the Swift Parrot – October 2005
B I O S I S R E S E A R C H Methods: Cumulative Impacts Modelling 21
The layout of turbines relative to each other, in combination with the lengths and directions of flights that birds make, affects the number of turbines that a bird might be likely to encounter at the site. In relation to this, a linear array entailing a single row of turbines is quite different from a cluster of turbines. This factor is taken into account as a parameter input that can be varied according to the known layout array of each wind farm modelled.
2.4 Parameters of Swift Parrots
2.4.1 Size and flight speed of Swift Parrots
Swift Parrots are approximately 23 cm long. Average flight speed of the species was estimated from observations of birds at other locations and modelled as 60 km/h. These two factors were used to determine the time it would take for a bird to fly through the danger zone of moving rotors. This was incorporated into calculation of the amount of rotor travel that would be involved in an encounter and hence contributed to determination of the area of turbine presented to the bird.
2.4.2 Flight heights of Swift Parrots
The height at which birds fly within a wind farm is clearly relevant to the likelihood of collision with turbines. This is due to the different heights of turbine components and of collision risks they present to birds. The moving rotors of a turbine are considered to present a greater risk than is the stationary tower. By way of example, the largest turbines involved in this assessment (Vestas V90 on 78 metre-high tower) sweep up to approximately 123 metres above the ground. The height zone swept by rotors (in the case of Vesta V90 between 33 and 123 metres height) is considered to represent the zone of greatest danger to flying birds.
In studies of the utilisation of wind farm sites by birds through south-eastern Australia, we have consistently evaluated the height of each flight recorded during standard point counts. No data for Swift Parrots are available since the species has not been recorded in the course of those investigations. However, a body of data has been obtained for a variety of other parrot species of south-eastern Australia. Those species do fly within the rotor-swept-height at times although the very great majority of recorded flights are from below that zone. Flight behaviour, including height, is likely to vary according to the activity being undertaken. Swift Parrots moving about a location in the course of routine foraging generally do so within the height of the trees in which they feed. Less frequent movements between sites, between feeding and roosting areas and on

Modelled cumulative impacts of wind farms on the Swift Parrot – October 2005
B I O S I S R E S E A R C H Methods: Cumulative Impacts Modelling 22
migration may be higher. We have assigned 25% of flights to the rotor-swept zone and 75% to the zone below rotor height. This is conservative when compared with our data for other parrots, in which a larger percentage of flights have generally been below rotor-swept height.
2.4.3 Periodicity, population size and movements of Swift Parrots at wind farm sites
For the purposes of scenario modelling, the Swift Parrot’s range falls into three zones (Figure 1):
‘Migration Zone’: The portion of the range through which the entire population moves twice annually between Tasmania and Victoria. A number of wind farms exist or are proposed in this range.
‘Resident Zone’: The portions of the species’ distributional range where Swift Parrots reside for up to six months per annum. These include the relatively small portions of south-eastern and north-central Tasmania where breeding occurs and the majority of the mainland range. No wind farms currently exist or are proposed for the breeding range, however a number are operational or proposed within the mainland ‘resident’ zone.
‘Incidental Zone’: The portion of the range from which only rare, incidental occurrences of Swift Parrots are now reported. This includes south-eastern South Australia, coastal western Victoria and central- to south-western Tasmania. Throughout this area habitat suitable for the species is generally very sparse and records of the parrot are rare. Nonetheless, birds are occasionally found there for brief periods and a number of wind farms exist or are proposed in this range.
The main differences between scenarios developed for the three zones is the duration of the annual cycle in which parrots might encounter wind farms.
Of a total of thirty-nine wind farms within the overall range of the Swift Parrot four were considered to offer no habitat for the bird and are also in geographic locations where the species is highly unlikely to ever encounter them. Those wind farms are noted in Table 4 and were not included in modelling.
Within the three zones, scenarios were developed and modelled to ascertain a potential survivorship rate for Swift Parrots for each wind farm where it was deemed possible that parrots might interact with the particular farm at all. A scenario was developed to reflect the annual period during which birds might be in the appropriate zone, number of annual movements that might occur within the wind farm and numbers of parrots that might interact with the wind farm

Modelled cumulative impacts of wind farms on the Swift Parrot – October 2005
B I O S I S R E S E A R C H Methods: Cumulative Impacts Modelling 23
during those movements. The actual numbers of Swift Parrots and frequency of their movements for any given wind farm are unknown and, outside of the breeding range, it is not clear to what extent the population might be segmented, or alternatively how widely the total population ranges (see Section 1). Hence, the number of Swift Parrots potentially occurring at each wind farm has been estimated. Assumptions about numbers of birds that might interact with any given wind farm were informed, where possible, by records of locations used by the species and by the area of the wind farm. However, in the absence of substantive empirical data, both population size and the annual number of movements used in the model are necessarily arbitrary. In total, the modelling has assumed that 316 Swift Parrots may interact annually with thirty-five existing and proposed wind farms across the species’ range.
Within the ‘Migration Zone’ it is assumed that birds may simply fly through each site once on each of the two annual migrations during a total annual period encompassing two months.
Within the ‘Resident Zone’ it is assumed that Swift Parrots may be within the general vicinity of some wind farms for up to a maximum of six months in a year. This is reflective of the annual cycle in which the parrots spend about half of each year in the core breeding range in Tasmania and half in appropriate locations on the mainland. Since none of the wind farms are sited within, or contain good habitat for the species, modelling has assumed that a small number of movements through a site may occur only when birds move between other locations supporting habitat.
Within the ‘Incidental Zone’ it is assumed that occasional birds might move through sites of some wind farms during a maximum period of six months in a year. In the main, this zone simply accounts for rare instances that have been documented of Swift Parrots moving outside of their principle range during the period of each annual cycle when they are on the mainland. The modelled assumption allows for any such bird to make two movements through a wind farm within this zone.
Numerical values for assumptions used for the scenario for each wind farm is shown in Table 4.
The Swift Parrot scenario modelled for each wind farm is outlined in Table 3.

Modelled cumulative impacts of wind farms on the Swift Parrot – October 2005
B I O S I S R E S E A R C H Methods: Cumulative Impacts Modelling 24
Table 3 Scenario modelled for Swift Parrot use of wind farms
Wind farm Zone
Annual duration
(months) of possible
Swift Parrot interactionwith wind
farmmodelled
Populationsize (number
of birds) modelled
Number of annual
movements per bird per
annummodelled
Aurora, Vic Not modelled as location inappropriate for species N/A N/A N/A
Bald Hills, Vic Migration 2 10 2
Breamlea, Vic Migration 2 2 2
Blayney, NSW Resident 6 10 10
Bluff Point (Woolnorth Lot 1), Tas Migration 2 20 2
Canunda, SA Incidental 6 2 2
Cape Bridgewater, Vic Not modelled as location inappropriate for species N/A N/A N/A
Cape Nelson, Vic Not modelled as location inappropriate for species N/A N/A N/A
Cape Sir William Grant, Vic
Not modelled as location inappropriate for species N/A N/A N/A
Challicum Hills, Vic Resident 6 10 10
Codrington, Vic Incidental 6 2 2
Crookwell, NSW Resident 6 2 10
Dollar, Vic Migration 2 10 2
Drysdale, Vic Incidental 6 5 2
Flinders Island, Tas Migration 2 20 2
Green Point, SA Incidental 6 2 2
Gunning, NSW Resident 6 10 10
Hampton, NSW Resident 6 2 10
Heemskirk, Tas Incidental 6 5 2
Jim's Plain, Tas Migration 2 20 2
King Is Huxley Hill Stages 1 & 2, Tas Migration 2 20 2

Modelled cumulative impacts of wind farms on the Swift Parrot – October 2005
B I O S I S R E S E A R C H Methods: Cumulative Impacts Modelling 25
Wind farm Zone
Annual duration
(months) of possible
Swift Parrot interactionwith wind
farmmodelled
Populationsize (number
of birds) modelled
Number of annual
movements per bird per
annummodelled
Kongorong, SA Incidental 6 2 2
Kooragang, NSW Resident 6 2 2
Lake Bonney Stage 1, SA Incidental 6 2 2
Lake Bonney Stage 2, SA Incidental 6 2 2
Mussleroe, Tas Migration 2 20 2
Naroghid, Vic Incidental 6 5 2
Nirranda, Vic Incidental 6 2 2
Nirranda South, Vic Incidental 6 2 2
Paling Yard, NSW Resident 6 10 10
Rosedale Ridge, Vic Migration 2 20 2
Studland Bay (Woolnorth Lot 2), Tas Migration 2 20 2
Taralga, NSW Resident 6 10 10
Toora, Vic Migration 2 20 2
Waubra, Vic Resident 6 20 10
Wonthaggi, Vic Migration 2 10 2
Woolsthorpe, Vic Incidental 6 5 2
Yaloak, Vic Resident 6 10 10
Yambuk, Vic Incidental 6 2 2

Modelled cumulative impacts of wind farms on the Swift Parrot – October 2005
B I O S I S R E S E A R C H Methods: Cumulative Impacts Modelling 26
2.4.4 Avoidance by Swift Parrots of wind turbines
Note that in modelling of the cumulative impacts of collision, any collision caused by a bird striking, or being struck by, a turbine, is assumed to result in death of the bird.
The use of the term ‘avoidance’ here refers to how birds respond when they encounter a wind turbine, that is, the rate at which birds attempt to avoid colliding with the structure.
At the request of DEH, three avoidance rates are modelled: 95%, 98% and 99%. Given that static elements of a turbine (tower, nacelle, etc.) are stationary and highly visible, we take the approach of modelling the likely avoidance rate of the area presented by these parts as 99% in all scenarios. The three variable avoidance rates that are modelled relate to the area presented by moving turbine components (the area of rotors plus the area swept by rotors during the passage of a bird at a given flight speed). Complete lack of avoidance (0%) is behaviour that has not been observed in any study of bird interactions with wind turbines and would be analogous to birds flying blindly without responding to any objects within their environments. In should noted that 99% avoidance rate means that for every 100 flight made by a bird it will make one in which it takes no evasive action to avoid collision with a turbine. In real terms this equates to avoidance behaviour that is considerably lower than that shown by most birds in most circumstances. Absolute avoidance behaviour (100%) has been documented for some species and may be a reasonable approximation for many species in good conditions, but unlikely for some species in certain conditions.
It would seem likely that avoidance by a species with the flight characteristics of the Swift Parrot would generally be close to 100% in most conditions, but it may decrease in conditions of poor visibility, resulting in the average (mean) avoidance rate, being less than 100%. Collisions with windows, chainmesh fences and vehicles are known to cause the deaths of some Swift Parrots each year within urban areas (see 1.1.9 Swift Parrot Collisions). However, those incidences of collisions generally occur within close proximity to trees where birds are feeding in situations quite different from those at wind farms.
Birds of most species fly less frequently when visibility is reduced by fog or rain (Richardson 1998, Tulp et al. 1999) than they do in clear conditions. However, some individuals of some species do fly in conditions of reduced visibility and this can lead to increased collision risk. This occurs due to a decreased level of control individual birds have of their flight in very windy conditions or reduced visibility in fog/mist events (Richardson 1998). In respect of migrating Swift Parrots specifically, there are no data, however, is would seem unlikely that birds would travel during storm weather conditions. This is consistent with migration

Modelled cumulative impacts of wind farms on the Swift Parrot – October 2005
B I O S I S R E S E A R C H Methods: Cumulative Impacts Modelling 27
behaviour as observed in birds generally (Richardson 1998). Overall, considering the range of species sampled in Australia and overseas, the consistency in avoidance rates and the absence of any documented cases lower then 95%, it is appropriate to assume that Swift Parrots will have avoidance rates in the range between 95% -100%.

Modelled cumulative impacts of wind farms on the Swift Parrot – October 2005
B I O S I S R E S E A R C H Results: Cumulative Impacts Modelling 28
3.0 RESULTS: CUMULATIVE IMPACTS MODELLING
3.1 Estimated impacts from modelling of individual wind farms
The initial stage for modelling the cumulative risk of Swift Parrot collisions with wind turbines is to determine a level of risk posed by each individual wind farm. Results from this process also allow assessments to be made of the effects of any single wind farm or of any combination of farms. For the purposes of evaluating the potential impacts of current or future proposals to build wind farms this component of the process provides a valuable tool.
No empirical values for annual variations in population numbers of Swift Parrots exist and demographic parameters influencing the population are unknown. Clearly, environmental variables and stochastic events have effects on the Swift Parrot population, however in the absence of any known values and for simplicity of presentation, we have not assigned arbitrary coefficients of variation. Therefore, in the following results and discussion, mean values are used throughout, but should be viewed as indicative only. Annual variations in all values will occur and may have considerable influence on population numbers used here and on predictions derived from them.
Predicted risk of collisions is expressed as a mean annual survivorship rate which represents the proportion of the population at risk at a given wind farm, that is expected to survive all encounters with turbines at during the course of a year.Modelled survivorship rates for relevant wind farms are shown in Table 4. It has been necessary to calculate and show these values to five significant numbers in order for differences between them to be detected. It is important that this is not to be misinterpreted to indicate any level of ‘accuracy’ in the predicted results.
Table 4 Modelled survivorship rates for wind farms presenting a collision risk to Swift Parrots
Windfarm Survivorship rate at 95% avoidance
rate
Survivorship rate at 98% avoidance
rate
Survivorship rate at 99% avoidance
rate
Bald Hills, Vic 0.99957 0.99970 0.99974
Breamlea, Vic 0.99998 0.99998 0.99998
Blayney, NSW 0.99982 0.99987 0.99988
Bluff Point (Woolnorth Lot 1), Tas 0.99971 0.99977 0.99979
Canunda, SA 0.99986 0.99990 0.99991
Challicum Hills, Vic 0.99975 0.99980 0.99982

Modelled cumulative impacts of wind farms on the Swift Parrot – October 2005
B I O S I S R E S E A R C H Results: Cumulative Impacts Modelling 29
Windfarm Survivorship rate at 95% avoidance
rate
Survivorship rate at 98% avoidance
rate
Survivorship rate at 99% avoidance
rate
Codrington, Vic 0.99990 0.99993 0.99993
Crookwell, NSW 0.99990 0.99992 0.99993
Dollar, Vic 0.99959 0.99970 0.99973
Drysdale, Vic 0.99978 0.99985 0.99988
Flinders Island, Tas 0.99995 0.99996 0.99996
Green Point, SA 0.99985 0.99990 0.99992
Gunning, NSW 0.99918 0.99940 0.99948
Hampton, NSW 0.99993 0.99995 0.99996
Heemskirk, Tas 0.99975 0.99983 0.99986
Jim's Plain, Tas 0.99968 0.99979 0.99982
King Is Huxley Hill Stages 1 & 2, Tas 0.99994 0.99995 0.99996
Kongorong, SA 0.99984 0.99990 0.99991
Kooragang, NSW 0.99999 0.99999 0.99999
Lake Bonney Stage 1, SA 0.99984 0.99987 0.99989
Lake Bonney Stage 2, SA 0.99975 0.99983 0.99986
Mussleroe, Tas 0.99949 0.99967 0.99973
Naroghid, Vic 0.99984 0.99989 0.99991
Nirranda, Vic 0.99998 0.99998 0.99998
Nirranda South, Vic 0.99989 0.99992 0.99993
Paling Yard, NSW 0.99876 0.99917 0.99931
Rosedale Ridge, Vic 0.99952 0.99968 0.99973
Studland Bay (Woolnorth Lot 2), Tas 0.99965 0.99976 0.99980
Taralga, NSW 0.99855 0.99903 0.99919
Toora, Vic 0.99983 0.99987 0.99988
Waubra, Vic 0.99905 0.99929 0.99937
Wonthaggi, Vic 0.99927 0.99949 0.99957
Woolsthorpe, Vic 0.99981 0.99987 0.99989
Yaloak, Vic 0.99930 0.99947 0.99953
Yambuk, Vic 0.99989 0.99991 0.99992

Modelled cumulative impacts of wind farms on the Swift Parrot – October 2005
B I O S I S R E S E A R C H Results: Cumulative Impacts Modelling 30
3.2 Estimated cumulative impacts across the range of the Swift Parrot
The total number of Swift Parrots modelled as interacting annually with all thirty-five wind farms under consideration here is 316 (2.4.3 Periodicity, population size and movements of Swift Parrots at wind farm sites). This equates to approximately 16% of the entire estimated population of 2000 Swift Parrots believed to exist (Swift Parrot Recovery Team 2001) that is at risk of collisions with wind turbines.
The mean survivorship rates determined for the cumulative impacts of collisions at thirty-five wind farms across the Swift Parrot’s range are provided in Table 5.
Table 5 Cumulative annual survivorship rates for collision risk posed by turbines for the portion of the Swift Parrot population modelled as interacting with 35 wind farms in the species’ distributional range
Survivorship rate at 95% avoidance
rate
Survivorship rate at 98% avoidance
rate
Survivorship rate at 99% avoidance
rate
0.99967 0.99977 0.99980
3.2.1 Impacts on annual survivorship of total Swift Parrot population
In order to assess the potential impact of altered survivorship rates that may be imposed on the Swift Parrot population by collisions with wind turbines it will first be necessary to know the background survivorship rate that affects the population in the absence of any impacts of wind farm collision. Unfortunately, this has not been determined for the species. If or when it is, it can be multiplied by the cumulative collision risk survivorship rates predicted by the modelling and shown in Table 5, for the portion of the total population that is assumed to interact with wind farms. Since collision effects are considered to function as a constant over time, the adjusted mortality rate will be applicable regardless of the Swift Parrot population size.
3.2.2 Predicted Swift Parrot mortalities
The number of Swift Parrots that the model predicts might be killed on average per annum at each wind farm, according to the three avoidance rates modelled, are shown in Table 6. A total number of birds predicted to be killed annually by the cumulative effects of turbine collisions across the species’ range is

Modelled cumulative impacts of wind farms on the Swift Parrot – October 2005
B I O S I S R E S E A R C H Results: Cumulative Impacts Modelling 31
determined by summing the number of fatalities predicted for each avoidance rate for all thirty-five wind farms, and is shown as a total in Table 6.
Table 6 Predicted average annual number of Swift Parrot mortalities due to collisions with
wind turbines
Windfarm Number of deaths at 95% avoidance
rate
Number of deaths at 98% avoidance
rate
Number of deaths at 99% avoidance
rate
Bald Hills, Vic 0.00431 0.00299 0.00255
Breamlea, Vic 0.00004 0.00003 0.00003
Blayney, NSW 0.00184 0.00135 0.00118
Bluff Point (Woolnorth Lot 1), Tas 0.00589 0.00459 0.00416
Canunda, SA 0.00030 0.00021 0.00018
Challicum Hills, Vic 0.00248 0.00195 0.00178
Codrington, Vic 0.00019 0.00015 0.00013
Crookwell, NSW 0.00021 0.00016 0.00014
Dollar, Vic 0.00406 0.00303 0.00269
Drysdale, Vic 0.00111 0.00074 0.00062
Flinders Island, Tas 0.00106 0.00086 0.00079
Green Point, SA 0.00030 0.00020 0.00017
Gunning, NSW 0.00822 0.00596 0.00521
Hampton, NSW 0.00067 0.00049 0.00043
Heemskirk, Tas 0.00127 0.00085 0.00071
Jim's Plain, Tas 0.00634 0.00425 0.00355
King Is Huxley Hill Stages 1 & 2, Tas 0.00129 0.00095 0.00083
Kongorong, SA 0.00031 0.00021 0.00018
Kooragang, NSW 0.00002 0.00001 0.00001
Lake Bonney Stage 1, SA 0.00032 0.00025 0.00023
Lake Bonney Stage 2, SA 0.00051 0.00034 0.00029
Mussleroe, Tas 0.01012 0.00651 0.00531
Naroghid, Vic 0.00082 0.00055 0.00046
Nirranda, Vic 0.00005 0.00003 0.00003
Nirranda South, Vic 0.00021 0.00016 0.00014

Modelled cumulative impacts of wind farms on the Swift Parrot – October 2005
B I O S I S R E S E A R C H Results: Cumulative Impacts Modelling 32
Windfarm Number of deaths at 95% avoidance
rate
Number of deaths at 98% avoidance
rate
Number of deaths at 99% avoidance
rate
Paling Yard, NSW 0.01236 0.00828 0.00692
Rosedale Ridge, Vic 0.00951 0.00637 0.00533
Studland Bay (Woolnorth Lot 2), Tas 0.00709 0.00475 0.00397
Taralga, NSW 0.01452 0.00973 0.00813
Toora, Vic 0.00335 0.00261 0.00237
Waubra, Vic 0.01900 0.01422 0.01263
Wonthaggi, Vic 0.00146 0.00102 0.00087
Woolsthorpe, Vic 0.00096 0.00064 0.00054
Yaloak, Vic 0.00703 0.00526 0.00467
Yambuk, Vic 0.00023 0.00017 0.00015
Total predicted deaths 0.12745 0.08988 0.07737
Thus for the scenarios modelled here, a cumulative total of between 0.08 and 0.13 Swift Parrots per year are predicted to be killed by collisions at all of the sites the population is likely to encounter within its natural range. This equates to slightly more or less than a single parrot killed every ten years.
3.2.3 Conclusion
The cumulative impacts of collision with turbines on the overall population of Swift Parrots, predicted by the modelling for all current and presently proposed wind farms within the species’ range are very small. Results for the range of avoidance rates modelled equate to slightly more or less than one parrot killed due to wind turbine collisions every ten years.
It is recognised that assumptions about numbers of Swift Parrots and numbers of their movements used in the modelling are necessarily arbitrary since there is no empirical data on which to base them. It is therefore possible that they may not reflect reality for every one of the thirty-nine wind farms encompassed by the modelling. However, even if all assumptions for Swift Parrot numbers and movements for all of the wind farms were too low by an order of magnitude the model would still only predict a cumulative mortality of approximately one bird killed each year across all the wind farms within the species’ range. Based on knowledge of the species, it can be confidently assumed that predictions of the present modelling are considerably more accurate than that.

Modelled cumulative impacts of wind farms on the Swift Parrot – October 2005
B I O S I S R E S E A R C H Appendices 33
APPENDICES

Modelled cumulative impacts of wind farms on the Swift Parrot – October 2005
B I O S I S R E S E A R C H Appendix 1 34
APPENDIX 1 Cumulative Wind Farm Effects Modelling

Cumulative Wind Farm Effects
Modelling
Approach and Justification
Stuart MuirSymboliX
forBiosis Research Pty. Ltd
June 10, 2005
Abstract
The method to combine the individual wind-farm site assessments intoa cumulative effects model is described. It is shown that this is done bymultiplying all the individual site survival probabilities for each speciestogether. i.e Survival chance = P (S1)P (S2)P (S3)P (S4) . . . P (SN )
1 Introduction
Previous windfarm modelling has resulted in a measure of risk of bird-turbine interactions. It inherently relied on the assumption that the birdinteracted with the site of the farm, and proceeded to generate a measureof the probability of birdstrike through calculations of presented areas ofturbine and assumptions and observations of bird movements.
To approximate cumulative effects of multiple windfarms on the risk ofstrike, we need to remove the assumption that the bird is already interact-ing with the site. Having done this, we must account for the probabilitiesof interacting with a given farm site, and then incorporate the risk ofstrike associated with that farm. We then can proceed to calculate thesurvival rate of a bird population residing or moving through a regionwith resident windfarms.
2 Mechanics
This section is provided to allow for subsequent auditing of the process.Due to its technical nature, it may be skimmed by the non-technicalreader.
1

2.0.1 Definitions
• “region” At this stage we only refer to a region to allow the distinc-tion between “home-ranges” and “habitats.” Appropriate choicesfor what these regions represent will need to be made at a laterstage.
• N the number of wind farm sites found within the region of interest
• “site” A particular wind farm, consisting of turbines standing onsome of the region
• Bi the event of a birdstrike associated with site i
• Ai the event of a bird interacting with site i
• Si the event of survival of an interaction with site i
• P (C) a measure of the probability of an event, C, occurring
Note: The development of the method requires that all mortality riskassessments be converted to survival chance. This is due to the impossi-bility of a struck bird going on to either be struck again, or to survive thenext interaction. Only survivors can continue to interact.
2.1 Estimating Individual Site Risk (P (Bi|Ai))
As stated previously, the previous wind farm risk assessments have con-centrated on the risk of strike, given that the bird is flying through thesite.
Using the definitions of section 2.0.1, this is written as
P (Bi|Ai), (1)
and read as the probability of strike (event Bi), given that the bird isalready on site (event Ai).
A measure of this risk can be obtained one of two ways. Assumingthere is a significant population (defined to be large enough that the lossof a single bird will not be significant and another individual will replaceit) then
Movements at Risk
Total Yearly Movements(2)
can be used. Using this ratio implicitly assumes that the site populationis comparable to the number of observed movements. This may result ina significant under estimate of risk.
If the population is small, then the mortality rate should be taken fromthe earlier model’s measure of corpse numbers per year, and expressed as
Expected corpses per year
Population. (3)
The later form, if population data is available, is the preferred form.This is both for completeness as well as ease of implementation. If theactual population is known to be small but site residency is unknown, it isbetter to estimate site population, or enter the habitat population, thanto rely on the movements at risk approximation which could well be twoorders of magnitude below actual risk.
2

2.2 Estimating the chance of surviving a site
To estimate the chance of surviving a site, we need both the probabilityof never visiting (P (A′)) and the chance of visiting, but not being struck(P (B′|A)). As there are only three possibilities,
1. Visiting and not being struck,
2. Visiting and being struck,
3. and Not visiting at all
the easiest estimation of this risk is to calculate the risk of visiting andbeing struck, and subtract this value from unity.
The probability of visiting and being struck is given by,
P (Ai ∩ Bi) = P (Ai)P (Bi|Ai) (4)
The chance of surviving site i is then given by
P ((Ai ∩ Bi)′) = P (Si) = 1 − P (Ai)P (Bi|Ai) (5)
Note: Earlier, non-cumulative models assumed that P (A) = 1The previous section (2.1) dealt with derivation of the second term.
The first term (P (Ai)) can be approximated a number of ways. These aredetailed next.
2.3 Estimating the chance of visiting a site (P (Ai))
Previous modelling successfully avoided the issue of the physical size ofthe windfarm site through its implementation of the observational data.Unfortunately, there does not appear to be any way to avoid incorporatingthis measure into the model at this stage.
The chances of visiting a given site can be generated by measuring theinteraction between a region and the site. This is most naturally doneby comparing areas of the site relative to the region. This assumes thatthere is no reason for visiting or avoiding the site relative to any otherarea of the region. It may be appropriate to adjust this value if the siteis a significant habitat or food source likely to attract visits. Conversely,if the site is barren, P (Ai) might be adjusted downwards to account forthis. Without accurate data on visitation habits, the following estimatesare safe and realistic by assuming a homogenous region.
A basic measure of this probability is given by
P (Ai) =Area of site
Area of region(6)
This approximation is most appropriate for sedentary species, wherethe relevant region is the home range, not the habitat.
The form indicated above may also be used for migratory species. Ifit is to be used for a migratory species, the region appropriate becomesthe habitat area. Should the species be using a narrow corridor, this formwill be an underestimate of risk.
For a migratory species using a corridor, P (Ai), is better approxi-mated by taking the widest projection of the farm site (orthogonal to the
3

corridor), and dividing through by the width of the migratory corridor atthat location. i.e
P (Ai) =width of site
width of corridor. (7)
This removes the possibility of birds flying around a farm placed inthe corridor, without ever “passing” it. This eventuality is possible forsedentary species, who are free to roam in arcs whilst avoiding the actualsite.
2.4 Cumulative effect of N sites
Having generated the chance of surviving site i’s existence(P (Si) = 1 − P (Ai)P (Bi|Ai)),we need to know the likelihood of surviving all N sites in the region.
This is given byP (S1 ∩ S2 ∩ S3 ∩ . . . ). (8)
As surviving any one of the windfarm sites in the region is independentof surviving any other site, this simplifies to
P (S1...N ) = P (S1)P (S2)P (S3) . . . (9)
= ΠNi P (Si) (10)
3 Summary
The derivation of cumulative effects takes into account the varying individ-ual risk presented by each wind farm in a given region. This informationcan be taken directly from the previously prepared reports on each site.Extra information required to perform this calculation is:
For sedentary species : relative areas of home ranges and site areas occu-pied by windfarms/turbines
For migratory species : effective blockage of corridors by windfarm sites.
3.1 Calculation steps
To calculate the cumulative effect on the survival rate of a species:
1. Identify the sites relevant to each species
2. Estimate the mortality rate for each site (P (Bi|Ai)). This can bedone either through the movements at risk, or mortality (corpse)rate found on the summary pages. (See Section 2.2)
3. Determine an appropriate chance of site visitation, P (Ai). (See Sec-tion 2.3)Note: If the home range of a sedentary species is signifi-cantly smaller than the habitat, then average, representa-tive values for these probabilities may be calculated andsubstituted.
4

4. Determine the survival rate of each site via 1 − P (Ai)P (Bi|Ai).
5. Multiply all the survival rates of each site relevant to the speciestogether.Note: If using average properties (as discussed in the pre-vious point), raise the average probability to the power ofthe number of sites relevant to the size of the home range.
The resultant figure is a chance of survival for the species as a resultof the residency of windfarms in the habitat or corridor. A figure of unity(1) indicates no individual will ever be struck. Zero (0) indicates completeloss of the population.
5

Modelled cumulative impacts of wind farms on the Swift Parrot – October 2005
B I O S I S R E S E A R C H References 40
REFERENCESBrook B.W., Burgman M.A., Akçakaya
H.R., O’Grady J.J., Frankham R. 2002. Critiques of PVA ask the wrong questions: throwing the heuristic baby out with the numerical bath water.Conserv. Biol. 16, 262-263.
Brown, P. B. 1989. The Swift Parrot. A report on its ecology, distribution and status, including management considerations. Tas. Dept of Lands, Parks and Wildlife. Hobart.
Burgman M.A., 2000. Populationviability analysis for bird conservation: prediction, heuristics, monitoring and psychology. Emu, 100, 347-353.
Higgins, P. J. (ed) 1999. Handbook of Australian, New Zealand and Antarctic Birds. Volume 4: Parrots to Dollarbird. Oxford University Press. Melbourne.
Meredith, C., Saunders, D. and Timewell, C. 2000. Avifauna monitoring update – proposed north-west Tasmania windfarm. Biosis Research Pty. Ltd. Report to Hydro-electric Corporation.
Richardson, W.J. 1998. Bird Migration and Wind Turbines: Migration Timing, Flight Behavior, and Collision Risk. Pp 132-140. In: Proceedings of the National Avian - Wind Power Planning Meeting IV. San Diego, California, May 1998.
Tulp, I., Schekkerman, H., Larsen, J., van der Winden, J., van de Haterd, R.J.W., van Horssen, P., Dirksen, S. & Spaans, A.L. 1999. Nocturnal flight activity of sea ducks near the windfarm TunoKnob in the Kattegat. BureauWaardenburg, Culemborg
Garnett, S. & Crowley, G. 2000. The Action Plan for Australian Birds. Environment Australia, Canberra.
Swift Parrot Recovery Team 2001. SwiftParrot Recovery Plan. Department of Primary Industries, Water and Environment, Hobart.
Wilson, J. and Bennett, A. 1999. Patchiness of a floral resource: Flowering of Red Ironbark Eucalyptus tricarpa in a Box-Ironbark Forest.The Victorian Naturalist 116(2): 48-53.

White-bellied Sea-EagleDave Watts

Modelled cumulative impacts on the White-bellied Sea-eagle of wind farms across the species’ Australian range
December 2005
Ian Smales

Report forDepartment of Environment and Heritage
Modelled cumulative impacts on the White-bellied Sea-eagle of wind farms across the species’ Australian range
December 2005
Ian Smales
Project no. 5238
BIOSISR E S E A R C H
Biosis Research Pty. Ltd. This document is and shall remain the property of Biosis Research Pty Ltd. The document may only be used for the purposes for which it was commissioned and in accordance with the Terms of the Engagement for the commission. Unauthorised use of this document in any form whatsoever is prohibited.
BIOSIS RESEARCH Pty. Ltd. A.B.N. 65 006 175 097 Natural & Cultural Heritage Consultants
Ballarat: 449 Doveton Street north, Ballarat VIC 3354 Ph: (03) 5331 7000 Fax: (03) 5331 7033 email: [email protected]
Melbourne: 38 Bertie Street Port Melbourne 3207 Ph: (03) 9646 9499 Fax: (03) 9646 9242 email: [email protected]

Modelled cumulative impacts of wind farms on the White-bellied Sea-eagle – December 2005
B I O S I S R E S E A R C H Acknowledgments & Abbreviations III
ACKNOWLEDGEMENTS
Biosis Research wishes to acknowledge the contribution of the following people and organisations in undertaking this study:
Department of the Environment & Heritage, Canberra Wayne Furler Alex Rankin
Biosis Research Pty. Ltd. Dr Charles Meredith Dr Bob Baird
ABBREVIATIONS
DEH Department of the Environment & Heritage EPBC Act Environment Protection and Biodiversity Conservation Act 1999

Modelled cumulative impacts of wind farms on the White-bellied Sea-eagle – December 2005
B I O S I S R E S E A R C H Contents IV
CONTENTS1.0 INTRODUCTION............................................................................................................ 5
1.1 Project Background ..................................................................................................... 5 1.1.1 Risk modelling.............................................................................................................. 6 1.1.2 Overview of Collision Risk Modelling for individual wind farms................................... 7 1.1.3 Presentation of results ................................................................................................. 81.1.4 The White-bellied Sea-eagle population...................................................................... 9
2.0 METHODS: CUMULATIVE IMPACTS MODELLING ................................................. 11 2.1 Mathematical approach to cumulative impacts modelling ................................... 11
2.2 Model inputs ............................................................................................................... 12
2.3 Parameters of wind farms ......................................................................................... 13 2.3.1 Turbines ..................................................................................................................... 15 2.3.2 Turbine number and configuration............................................................................. 16
2.4 Parameters of White-bellied Sea-eagles.................................................................. 17 2.4.1 Size and flight speed of White-bellied Sea-eagles .................................................... 17 2.4.2 Flight heights of White-bellied Sea-eagles ................................................................ 17 2.4.3 Population size and movements of White-bellied Sea-eagles at wind farm sites ..... 18 2.4.4 Avoidance by White-bellied Sea-eagles of wind turbines.......................................... 21
3.0 RESULTS: CUMULATIVE IMPACTS MODELLING................................................... 24 3.1 Estimated impacts from modelling of individual wind farms............................... 24
3.2 Estimated cumulative impacts across the range of the White-bellied Sea-eagle26 3.2.1 Impacts on White-bellied Sea-eagle annual survivorship.......................................... 27 3.2.2 Predicted White-bellied Sea-eagle mortalities........................................................... 27 3.2.3 Conclusion ................................................................................................................. 30
APPENDICES........................................................................................................................... 31 APPENDIX 1............................................................................................................................. 32
Cumulative Wind Farm Effects Modelling ....................................................................... 32
REFERENCES ......................................................................................................................... 38

Modelled cumulative impacts of wind farms on the White-bellied Sea-eagle – December 2005
B I O S I S R E S E A R C H Introduction 5
1.0 INTRODUCTION
1.1 Project Background
The White-bellied Sea-eagle Haliaeetus leucogaster is listed under provisions of the Environment Protection and Biodiversity Conservation Act (1999) for migratory species. The species has a world distribution from western India through south-east Asia to southern Australia. In Australia it is distributed around the coastline of most of Australia, including Tasmania and near-shore islands (Marchant and Higgins 1993). It also inhabits some larger river systems and large permanent inland waterbodies, such as major water-storage impoundments. The species’ range includes a number of currently operating constructed wind power generation facilities (wind farms) and more facilities that are proposed.
Wind farms may pose a risk of collision to the White-bellied Sea-eagle since mortalities of various eagle species are known from wind farms in a variety of situations worldwide and large raptors have already been recorded as casualties of collision with turbines in Australia. The present project is specifically aimed at determining the cumulative risks posed by collision of sea-eagles with wind turbines. A variety of associated impacts of wind farm developments may affect bird populations. They include direct loss of habitat due to constructed facilities and roads; alienation of habitat caused by disturbance during construction and on-going operation; and potential for electrocution and collisions with overhead distribution lines. These latter impacts are not addressed as part of the present project.
The essential aim of the current project is to predict, the potential cumulative impacts of collision risk posed by wind farms across the range of the species’ distribution. The project utilises bird collision risk modelling to generate assessments of the cumulative risk to the White-bellied Sea-eagle posed by such collisions.
Using data available for the White-bellied Sea-eagle, the Biosis Research collision model is utilised to determine the bird strike risk for the sea-eagle’s population from the wind farms in the following categories, as at 30th May 2005, within the species range:
(i) already constructed or approved;
(ii) referred under the Environment Protection and Biodiversity Conservation Act 1999 (EPBC Act) and:

Modelled cumulative impacts of wind farms on the White-bellied Sea-eagle – December 2005
B I O S I S R E S E A R C H Introduction 6
. determined to be not a controlled action (NCA);
. determined to be not a controlled action manner specified (NCA-MS);
. approved under the EPBC Act; and
. proposed and currently being assessed for a determination under the EPBC Act.
1.1.1 Risk modelling
The fundamental objective of modelling of risk is to provide a rigorous process by which probability can be assessed in a manner that can be replicated.
When making predictions of risk, the rationale behind the predictions is explicitly stated in the mathematics of a model, which means that the logical consistency of the predictions can be easily evaluated. Compared to subjective judgement, this makes models more open to analysis, criticism and modification when new information becomes available. Although there may be assumptions used and some arbitrary choices when deciding on the structure and parameters of a model, these choices are stated explicitly when using a model but are difficult to disclose when making subjective judgements. Assessments based on subjective judgement can give the illusion that they are not scientifically rigorous (Burgman 2000), regardless of whether they are or not. The assumptions underlying a model can be tested. Models can be used to help design data collection strategies. They can help to resolve and avoid inconsistencies, and the rigorous analysis of data can help to clarify thoughts. Models are often most valuable for their heuristic capacities, by focussing attention on the important processes and parameters when assessing risks (Brook et al., 2002). These benefits are difficult, if not impossible to achieve with subjective judgement.
Biosis Research’s Avian Collision Risk Assessment Model is designed to determine the risk of birdstrike at individual wind farms. This model has been modified to create a Multi-site Risk Assessment Model, enabling the assessment of cumulative risk from multiple wind farms. No other windfarm avian collision risk model currently exists in Australia, and the Biosis Research model is more advanced than those that have been used overseas. The Biosis Research model has been developed in the context of Australian birds and has been tested on a range of wind farm proposals in Australia, and has been subject to independent peer review by Uniquest Pty. Ltd. (University of Queensland). It has been constantly updated and improved over the last five years and now constitutes a unique and powerful tool for assessing the potential impacts of wind farms on birds. The model is the proprietary software of Biosis Research Pty. Ltd.

Modelled cumulative impacts of wind farms on the White-bellied Sea-eagle – December 2005
B I O S I S R E S E A R C H Introduction 7
1.1.2 Overview of Collision Risk Modelling for individual wind farms
In order to quantify levels of potential risk to birds of collision with turbines, Biosis Research Pty Ltd developed a detailed method for the assessment of deterministic collision risk, initially for the Woolnorth Wind Farm (now Bluff Point and Studland Bay Wind Farms) in Tasmania. This model has continued to be used for a variety of operating wind farms as further data has been obtained and has also been used to assess the potential impacts of wind farms at a number of further potential sites in , Victoria, South Australia and recently in Fiji. It is applied here to determine levels of predicted risk to White-bellied Sea-eagles from individual wind farms.
The model provides a measure of the potential risk at different rates at which birds might avoid collisions. For example, a 95% avoidance rate means that in one of every twenty flights a bird would hit an obstacle in its path. Clearly, birds have vastly better avoidance capacity than this and it is well established overseas that even collision-prone bird species avoid collisions with wind generators on most occasions (see Section 2.4.4, below).
In the modelling undertaken for the present project we divide the risk into two height zones according to components of wind turbine structures. These are:
1. the zone between the ground and lowest height swept by turbine rotors, and
2. the height zone swept by turbine rotors
We consider that birds will avoid collision with the stationary components of a turbine in all but the most exceptional circumstances and model for 99% avoidance rate in the height zone below rotor height. For the height zone swept by rotors we provide predictions for movements at risk for each of 95%, 98% and 99% avoidance rates.
In usual practice the model requires data on the utilisation rates of each species being modelled, as collected during Point Count surveys on-site. This data provides inputs to the model regarding activities of birds that might be at risk of collision with turbines. Where data is not available because a species is not recorded from a site, or where data are too few and is thus an unreliable basis for extrapolation, a well informed scenario can be used. In the case of the present project, data has been obtained for White-bellied Sea-eagles at four wind farms and is used here. For the other wind farms scenarios are modelled based on available information about the sites and experience from similar sites. The risk assessment accounts for a combination of variables that are specific to the particular wind farm and to birds that inhabit the vicinity.

Modelled cumulative impacts of wind farms on the White-bellied Sea-eagle – December 2005
B I O S I S R E S E A R C H Introduction 8
They include the following:
The numbers of flights made by the species below rotor height, and for which just the lower portion of turbine towers present a collision risk.
The numbers of flights made by the species at heights within the zone swept by turbine rotors, and for which the upper portion of towers, nacelles and rotors present a collision risk.
The numbers of movements-at-risk of collision. Usually this parameter is as recorded for each species during timed Point Counts, which are then extrapolated to determine an estimated number of movements-at-risk for each species for an entire year. Account is taken of whether particular bird species are year-round residents or are present for a portion of the year as annual migrants.
The mean area of tower (m2 per turbine), nacelle and stationary rotor blades of a wind generator that present a risk to birds. The multidirectional model used here allows for birds to move toward a turbine from any direction. Thus the mean area presented by a turbine is between the maximum (where the direction of the bird is perpendicular to the plane of the rotor sweep) and the minimum (where the direction of the bird is parallel to the plane of the rotor sweep). The mean presented area is determined from turbine specifications supplied to Biosis Research for individual turbine makes and models.
The additional area (m2 per turbine) presented by the movement of rotors during the potential flight of a bird through a turbine. This is determined according to the length and flight speed of the bird species in question. In the case of the White-bellied Sea-eagle the bird’s length is set at 80 cm and its flight speed at 60 km/h.
A calculation, based on the total number of turbines proposed for the wind farm, of the number of turbines likely to be encountered by a bird in any one flight. This differs according to whether turbines form a linear or a clustered array on the landscape.
A value, or values, for each of the parameters above forms an input to the model for each wind farm for which collision risk is modelled.
1.1.3 Presentation of results
All collisions are assumed to result in death of a bird or birds. Results produced from modelling of the collision risk to White-bellied Sea-eagles, of both individual wind farms and of the cumulative impacts of multiple wind farms, are generally expressed here in terms of the annual proportion of the known population of the species that are predicted to survive encounters with wind

Modelled cumulative impacts of wind farms on the White-bellied Sea-eagle – December 2005
B I O S I S R E S E A R C H Introduction 9
turbines. We also provide estimates of our predicted results in terms of the number of birds that might be affected annually.
1.1.4 The White-bellied Sea-eagle population
In Australia, the White-bellied Sea-eagle is distributed around the coastline of most of the continent, including Tasmania and near-shore islands (Blakers et al.1984, Barrett et al. 2003, Marchant and Higgins 1993). It also inhabits some larger river systems and large permanent inland waterbodies, such as major water-storage impoundments. The species is less common along some portions of the coast such as western Victoria from around Port Phillip Bay to the South Australian border and along the Nullabor coast (Marchant and Higgins 1993). It may be absent altogether from some portions of the coastline. The species breeds throughout its coastal distribution and to a lesser extent near some inland waters.
Adult White-bellied Sea-eagles are believed to remain as year-round residents within home-ranges where they breed (Marchant and Higgins 1993). In common with other large eagles, it would seem likely that adults actively defend a relatively small breeding territory within the larger home-range. Breeding may not occur until birds are six years old (Marchant and Higgins 1993) and immatures are likely to be excluded from the core breeding territories of adults.
No estimate is available for the entire Australian population of the White-bellied Sea-eagle. Mooney (1986 in Marchant and Higgins 1993) provides an estimate of between 80 and 100 pairs around the Tasmanian coast, including Bass Strait islands. This equates to between 40 and 50 kilometres of coastline per pair for the 4,882 kilometres of Tasmanian coast including islands (Australian Bureau of Statistics). The entire Australian coastline, including islands, is 59,736 kilometres in length (Australian Bureau of Statistics). If we were to assume that two thirds of that length is suitable for White-bellied Sea-eagles, it would be expected to support between 790 and 990 pairs of birds at the density range reported for Tasmania. This approximation is for the number of territorial adult pairs in the population. In addition, the total population includes an annual cohort of juveniles and an unknown number of sub-adults. If these latter groups collectively equate to half the number of adults, the total population may be between 2000 and 3000 birds.
This is an extremely rough approximation and takes no account of inland waters that are known to support some birds nor of some coastal regions where densities may be considerably higher such as the Gippsland Lakes, Victoria and some island groups (see citations in Marchant and Higgins 1993). Nonetheless, it provides an order-of-magnitude estimation for the Australian population.

Modelled cumulative impacts of wind farms on the White-bellied Sea-eagle – December 2005
B I O S I S R E S E A R C H Introduction 10
Breeding adults occupy their home-ranges year-round and generally maintain life-long monogamous pair bonds. The death of a partner may be followed by the survivor re-pairing (Marchant and Higgins 1993). It appears likely that home-ranges would be occupied throughout the adult life of White-bellied Sea-eagles.
Bilney and Emison (1983 in Marchant and Higgins 1993) have documented an average of 0.8 young produced per occupied territory per annum in Victoria. Juveniles remain within their parents’ territories for the first few months of life. Dispersal of non-breeding birds has not been investigated thoroughly, although some long-distance movements by a few of such birds have been recorded (Marchant and Higgins 1993).

Modelled cumulative impacts of wind farms on the White-bellied Sea-eagle – December 2005
B I O S I S R E S E A R C H Methods: Cumulative Impacts Modelling 11
2.0 METHODS: CUMULATIVE IMPACTS MODELLINGMethods are presented here for the aim of the project - to predict, based upon the extant population of White-bellied Sea-eagles, the potential cumulative impacts of collision risk posed by a number of wind farms across the range of the species distribution.
The modelling outlined here assesses the potential risks to a bird population of collision with wind-driven electricity turbines. Other potential impacts, such as loss of habitat, increased disturbance, or other effects that may result from wind farms are not encompassed by this assessment.
2.1 Mathematical approach to cumulative impacts modelling
The mathematical approach to modelling of the potential cumulative impacts on bird populations used, along with its rationale, is provided in Appendix 1 (Cumulative Wind Farm Effects Modelling by Dr. Stuart Muir).
Resident White-bellied Sea-eagles, including adult parents and their first-year offspring, are sedentary and, for the purposes of modelling, such birds are thus considered to have a probability of interacting with only one wind farm throughout the course of a given year. It is feasible that, in common with other eagles such as Aquila species, adult White-bellied Sea-eagles are likely to maintain a home range, within which a smaller core breeding territory is actively defended during the breeding season, whilst conspecifics are generally tolerated within the larger home range.
Immature birds disperse from natal territories and some may move long distances (Marchant and Higgins 1993). However, no data exists about patterns or frequency of movements made by such birds, although there does not appear to be evidence suggesting that immature White-bellied Sea-eagles make long-distance movements away from the coast or large watercourses. There is no information to suggest that they are likely to make numerous movements through multiple wind farm sites. In the absence of evidence to the contrary, it seems logical to assume that immature White-bellied Sea-eagles would generally disperse from their natal territories to take up residence in nearby coastal environments. Areas utilised by immature birds may be exclusive of the core territories of breeding pairs and may not provide all of the resources necessary for successful reproduction. Thus for the purposes of modelling, it has been assumed that all birds, whether immature or birds of breeding age, should be modelled as essentially sedentary residents of coastal habitats.

Modelled cumulative impacts of wind farms on the White-bellied Sea-eagle – December 2005
B I O S I S R E S E A R C H Methods: Cumulative Impacts Modelling 12
Modelling for the cumulative effects of collisions with wind turbines by White-bellied Sea-eagles thus has assumed that all birds can interact with a single wind farm during the course of any given year. The mathematical approach is therefore as outlined in Appendix 1, where the number of wind farms that a given bird can encounter is set at one.
Initially, the possible impact of each wind farm on the White-bellied Sea-eagle is modelled on the basis of available information about that particular wind farm or an informed scenario of how part of the sea-eagle’s total population might interact with the wind farm annually. The impact is expressed as a mortality rate (annual probability of sea-eagles being killed by the particular wind farm) for that part of the sea-eagle population. Based on the number of individuals that are assumed to be at risk of collision at each wind farm, the predicted number of White-bellied Sea-eagle fatalities per annum is calculated from the mortality rate (the direct inverse of survivorship rate) for that site.
The cumulative risk is subsequently determined as the number of birds that the scenario modelling predicts might be killed due to collisions with turbines, on average per annum, at all wind farms across the species’ range. This provides an indication of the level of cumulative impact on the entire population of White-bellied Sea-eagles.
A background annual survivorship rate, that effects the entire population in the absence of impacts of wind farms, is not known. However, if or when that is determined, the turbine collision mortality rate for the population can be multiplied by the background rate to show the predicted change in population-wide mortality that modelling predicts will occur due to collisions with turbines across the species’ range. Since collision effects are considered to be constant over time, the adjusted mortality rate will be applicable regardless of the White-bellied Sea-eagle population size.
2.2 Model inputs
Inputs to the model have been determined to specifically assess the possible cumulative effects upon the White-bellied Sea-eagle population posed by existing and proposed wind farms, through the entire range of the species’ Australian distribution.
Sea-eagles are known from some inland areas and are known to breed along some rivers, particularly in a central portion of the Murray River and associated Riverina waterways. However, inland wind farm locations do not coincide with those environments. The distribution of White-bellied Sea-eagles overlaps with wind farm locations only in close proximity to the coast, which is where the great majority of existing and proposed wind farms are located. In all, fifty-six wind

Modelled cumulative impacts of wind farms on the White-bellied Sea-eagle – December 2005
B I O S I S R E S E A R C H Methods: Cumulative Impacts Modelling 13
farms are considered likely to be encountered by the species and are considered in modelling undertaken here. The species has been recorded at, or within close proximity to, a number of these sites.
Field investigations of the utilisation by birds of many wind farms in south-eastern Australia, including Tasmania, have been undertaken previously by Biosis Research or other workers. From the results of those studies, documented usage by White-bellied Sea-eagles was available for four sites, all in Tasmania (Bluff Point, Heemskirk, Mussleroe and Studland Bay). Utilisation rates recorded from those locations were used to develop scenarios for modelling of the possible interactions of White-bellied Sea-eagles with all fifty-six wind farms.
The specific scenario developed for each wind farm site was also informed from published information about the density and dispersion of White-bellied Sea-eagles around the Australian coastline.
Where assumptions were made in the absence of empirical information, we have used what we believe are valid judgements based on what is known and have attempted to err, if at all, on the basis of over- rather than underestimation of potential risks to the species.
2.3 Parameters of wind farms
Of the wind farms considered here, twenty-nine are built and currently in operation. The remaining twenty-seven wind farms are proposed and fall within categories (i) or (ii) of Section 1.1, above. Specific attributes of each wind farm were provided by DEH and were augmented, where required, from our own investigations. Included in this assessment are a number of very small wind ‘farms’ and thirteen installations of single, small turbines. These have been included where they appear to be situated within prime coastal habitats for sea-eagles and, because there are a number of them across the entire range, the cumulative risk they may pose to the species should not be ignored.
Bird utilisation data collected by Biosis Research at a variety of wind farms and observations made during numerous assessments for other purposes, indicates that White-bellied Sea-eagles residing in coastal locations are almost entirely confined to a narrow zone and are rarely sighted more than 500 metres inland. Key to the collision risk posed by a wind farm to White-bellied Sea-eagles are both the specifications of turbines proposed to be used and configuration of turbines on the landscape. Details of the fifty-six wind farms considered are shown in Table 1 and Figure 1.

Modelled cumulative impacts of wind farms on the White-bellied Sea-eagle – December 2005
B I O S I S R E S E A R C H Methods: Cumulative Impacts Modelling 14
Table 1 Details of the fifty-six wind farms assessed.
Wind farm
EPBCreferralnumber(where
applicable)
Positionco-ordinates
Numberof
turbinesTurbine model
10 Mile Lagoon, WA 121.76 -33.89 9 Vestas V27
9 Mile Beach, WA 121.78 -33.9 6 Enercon 600 kW
Albany, WA 117.82 -35.07 12 Enercon E66
Bluff Point, Tas 12 144.92 -40.78 37 Vestas V66
Breamlea, Vic 439 144.6 -38.25 1 Westwind 0.60 MW
Bremer Bay, WA 119.38 -34.39 1 Enercon 600 kW
Canunda, SA 691 140.4 -37.77 23 Vestas V80
Cape Barren Is, Tas 148.03 -40.38 1 Westwind 10kW
Cape Bridgewater, Vic 18 141.38 -38.37 40 NEG Micon NM82
Cape Nelson, Vic 18 141.54 -38.42 39 NEG Micon NM82
Cape Sir William Grant, Vic 19 141.62 -38.39 21 NEG Micon NM82
Cathedral Rocks, SA 134.85 -34.72 33 *Vestas V90
Codrington, Vic 1929 141.97 -38.28 14 AN Bonus 1.3 MW
Denham, WA 113.53 -25.93 3 Enercon E30 230kW
Denmark, WA 2105 117.32 -35.07 4 0.6 MW
Emu Downs, WA 115.01 -30.22 48 Vestas V82 1.65MW
Exmouth, WA 114.1 -22.08 3 20 kW
Flinders Island, Tas 148.09 -40.04 2 Nordex 0.6 & 0.125 MW
Fraser Is, Qld 153.21 -24.73 1 Westwind 10kW
Fremantle, WA 933 115.75 -32.06 8 *Vestas V90
Gabo Is, Vic 149.92 -37.57 1 Westwind 10kW
Green Point, SA 529 140.88 -38.03 18 Vestas V90
Heemskirk, Tas 678 145.12 -41.83 53 Vestas V90
Hopetoun, Wa 120.12 -33.85 1 Enercon 600 kW
Kemmiss Hill Road, SA 1611 138.48 -35.46 15 *Vestas V90
King Is Huxley Hill Stages 1 & 2, Tas 570 143.89 -39.94 3 Nordex 0.25 MW & Vestas V52
Kongorong, SA 568 140.5 -37.94 20 *Vestas V90
Kooragang, NSW 151.68 -32.97 1 Vestas V52
Lake Bonney Stage 1, SA 265 140.07 -37.42 46 Vestas V66
Lake Bonney Stage 2, SA 1630 140.36 -37.69 53 Vestas V90
Mallacoota, Vic 149.75 -37.56 1 Westwind 10kW
Mount Millar, SA 136.71 -33.64 35 Enercon E70 2 MW
Mumbida stg 1, WA 114.68 -28.89 50 Enercon 600 kW
Mussleroe, Tas 148.00 -40.80 46 Vestas V90 on low tower
Myponga, SA 138.41 -35.36 20 Vestas V66
Nirranda South, Vic 763 142.79 -38.56 40 *Vestas V66

Modelled cumulative impacts of wind farms on the White-bellied Sea-eagle – December 2005
B I O S I S R E S E A R C H Methods: Cumulative Impacts Modelling 15
Wind farm
EPBCreferralnumber(where
applicable)
Positionco-ordinates
Numberof
turbinesTurbine model
Nirranda, Vic 471 142.74 -38.52 28 NEG Micon NM82
North Keppel Is, Qld 150.90 -23.08 1 *Westwind 10kW
Pt Hicks, Vic 149.27 -37.80 1 Westwind 10kW
Rottnest Is, WA 115.53 -31.99 1 Enercon 600 kW
Sheringa, SA 50313511' -33 55' 95 *Vestas V90
Starfish Hill, SA 138.16 -35.57 23 NEG Micon NM64C 1.5 MW
Studland Bay, Tas 12 144.92 -40.78 25 Vestas V90
Swan Valley, WA 116.00 -31.83 2 *Westwind 10kW
Thursday Is, Qld 142.22 -10.59 2 Vestas 225kW
Toora, Vic 1109 146.41 -38.65 12 Vestas V66
Tortoise Head, Vic 145.29 -38.39 1 Westwind 10kW
Troubridge Point, SA 136.99 -35.16 15 *Vestas V90
Tungetta Hill & Loch Well Beach, SA 135 -33 55 NEC Micon 900 kW
Vincent North (She Oak Flat), SA 1001 137.86 -34.70 36 Vestas V82 1.65MW
Waitpinga, SA 135913832' -35 37' 23 *Vestas V90
Walkaway Alinta, WA 114.80 -28.94 54 Vestas NM 82 1.65MW
Wattle Point, SA 137.73 -35.13 55 Vestas V82 1.65MW
Wilsons Promontory, Vic 146.37 -39.13 1 Westwind 10kW
Wonthaggi, Vic 820 145.56 -38.61 6 REPower 2 MW
Yambuk, Vic 18 141.62 -38.39 20 NEG Micon NM82
* denotes turbine type used for modelling particular wind farm where manufacturer and model of turbine not specified
2.3.1 Turbines
The model of turbine in operation, or proposed to be used, at the various wind farms differ. The specific attributes of turbines are incorporated into the model since the different turbine types present different collision risks to birds. Differences are due to such things as the size (‘presented area’) of the structure that a bird might strike and such specifics as operational rotor speed and percentage of time that rotors are likely to turn, as dictated by variables of appropriate wind speed and maintenance downtime.
At least twenty different models of turbine are currently in operation, or are proposed to be built at the wind farms considered here. For a few potential wind farms (noted by an asterisk in Table 1) we were not able to obtain a clear indication of the turbine type proposed to be used as it appeared that proponents have not yet determined which they might use. In those instances we modelled for a turbine type most likely to be used based on the total generating capacity

Modelled cumulative impacts of wind farms on the White-bellied Sea-eagle – December 2005
B I O S I S R E S E A R C H Methods: Cumulative Impacts Modelling 16
planned for and from industry trends in the type of turbines being proposed. Table 1 provides information about turbines in use, or proposed for the wind farms assessed here.
Manufacturer’s specifications for wind turbine models were used to calculate attributes of each of them. Sixteen dimensions for each turbine, in combination with rotor speed, were input to the model. The mean presented area [m2] of each turbine, that presents a collision risk to sea-eagles, was calculated from specification data for both the static elements (all physical components of a turbine, including tower, nacelle, rotors) and the dynamic components (accounting for the movement of rotors) of each turbine structure.
The plane of a wind turbine rotor pivots in a 360 horizontal arc around the turbine tower in order to face into the wind direction. Hence, the area presenting a collision risk to a bird flying in a particular direction may thus vary from a maximum, in which the rotor plane is at 90 to the direction in which the bird is travelling, to a minimum in which the rotor plane is parallel with the travel direction of the bird.
To account for this variable, specifications for turbine types were used to calculate a mean area that each turbine presents to birds. The use of a mean turbine area is appropriate when the flights of birds are not biased toward any particular compass direction and it is thus assumed that a bird is equally likely to encounter a turbine from any direction. The flights of White-bellied Sea-eagles in the vicinity of the relevant wind farms are multi-directional and the use of a mean turbine area is thus the appropriate approach.
The area presented by a turbine also differs according to whether the rotors are stationary or are in motion. When turbines are operational and rotors are in motion, the area swept by the rotors during passage of a bird the size and speed of a White-bellied Sea-eagle is included in calculations of the presented area.
Turbines rotors do not turn when wind speed is too low (usually below about 4 m/sec) and are braked and feathered to prevent them from turning if it is too high (usually in excess of about 25m/sec), and during maintenance. During such times only the static area of each turbine presents a collision risk. To account for the difference in mean area presented by operational and non-operational turbines a percentage of downtime is an input to the model.
2.3.2 Turbine number and configuration
Two principal components of the collision risk represented by a particular wind farm are the number of turbines at the site and way in which they are positioned relative to each other in the landscape.

Modelled cumulative impacts of wind farms on the White-bellied Sea-eagle – December 2005
B I O S I S R E S E A R C H Methods: Cumulative Impacts Modelling 17
The number of turbines at each site is a simple parameter input to the model.
The layout of turbines relative to each other, in combination with the lengths and directions of flights that birds make, affects the number of turbines that a bird might be likely to encounter at the site. In relation to this, a linear array entailing a single row of turbines is quite different from a cluster of turbines. This factor is taken into account as a parameter input that can be varied according to the known layout array of each wind farm modelled.
2.4 Parameters of White-bellied Sea-eagles
2.4.1 Size and flight speed of White-bellied Sea-eagles
White-bellied Sea-eagles are approximately 75 - 85 cm in length (Marchant and Higgins 1993) and were modelled here as 80 cm long. Average flight speed of the species was estimated from observations of birds and was modelled as 60 km/h. These two factors were used to determine the time it would take for a bird to fly through the danger zone of moving rotors. This was incorporated into calculation of the amount of rotor travel that would be involved in an encounter and hence contributed to determination of the area of turbine presented to the bird.
2.4.2 Flight heights of White-bellied Sea-eagles
The height at which birds fly within a wind farm is clearly relevant to the likelihood of collision with turbines. This is due to the different heights of turbine components and of collision risks they present to birds. The moving rotors of a turbine are considered to present a greater risk than is the stationary tower. By way of example, the largest turbines involved in this assessment (Vestas V90 on 78 metre-high tower) sweep up to approximately 123 metres above the ground. The height zone swept by rotors (in the case of Vesta V90 between 33 and 123 metres height) is considered to represent the zone of greatest danger to flying birds.
In studies of the utilisation of wind farm sites by birds through south-eastern Australia, we have consistently evaluated the height of each flight recorded during standard point counts. The heights of 160 movements by White-bellied Sea-eagles, within 120 metres of the ground, have been recorded by Biosis Research at four wind farm sites. Of those, 30% were within 30 metres of the ground and 70% were between 30 and 120 metres of the ground. This body of flight-height data was used as a basis for determining scenarios for the

Modelled cumulative impacts of wind farms on the White-bellied Sea-eagle – December 2005
B I O S I S R E S E A R C H Methods: Cumulative Impacts Modelling 18
proportion of sea-eagle flights that might occur relative to the dimensions of particular types of turbines at sites for which no data exists.
For each wind farm modelled a number of sea-eagle flights are allocated to each of two height zones in which birds may interact with turbines:
the zone between the ground and the lowest point swept by rotors, and
the zone between the lowest and highest point swept by rotors (the rotor-swept-zone).
2.4.3 Population size and movements of White-bellied Sea-eagles at wind farm sites
Specific investigations have not been undertaken into the population dynamics of White-bellied Sea-eagles inhabiting any wind farm sites in Australia, or elsewhere, so there is little empirical data about the number of birds using sites. In order to provide necessary inputs about the number of birds that might interact with turbines at any given site, and consequently across all sites, we have made assumptions about the number of birds involved based on information collected during bird utilisation studies undertaken by Biosis Research at four wind farm sites where White-bellied Sea-eagles occur (Bluff Point, Heemskirk, Mussleroe and Studland Bay). The basis for assessment of the number of birds present at a site was the maximum number of individual birds sighted at any one time, or identifiable as individuals from differences in plumage.
On the basis of the information from those wind farms, it appears that any one site is likely to be part of the home range of a single pair of adult birds. A home-range is expected to be occupied year-round by an adult pair and, on average, for a few months by less than one juvenile. Almost all wind farms cover an area that is considerably smaller than the expected home-range of such a family group. Therefore the majority of wind farms have been modelled for the possibility of three birds interacting with turbines throughout a given year (Table 2).
It is possible that larger wind farms may intersect the home-ranges of two family groups. Taking this possibility into account, larger wind farms have been modelled for the possibility of six birds interacting with turbines throughout a given year (Table 2).
As outlined in Section 2.1, it has been assumed for modelling purposes that immature birds occupy habitat at the same density as that at which home-ranges of breeding pairs are occupied.

Modelled cumulative impacts of wind farms on the White-bellied Sea-eagle – December 2005
B I O S I S R E S E A R C H Methods: Cumulative Impacts Modelling 19
We have assumed that development of a wind farm does not alienate the area from further use by sea-eagles. This is considered to be the case because previous land uses at all currently operating wind farm sites in Australia, are believed to have continued and pre-existing habitat values have remained largely unaltered following construction of facilities. It is also the case that White-bellied Sea-eagles are known to continue to occupy operational wind farm sites in southern Australia, including the large Bluff Point Wind Farm (formerly Woolnorth Lot 1) in Tasmania.
It is also assumed that mortalities due to collisions with turbines do not alter usage, or occupancy of wind farm sites by White-bellied Sea-eagles. We do not consider that collisions are likely to result in heightened avoidance behaviours on the part of survivors. In the short-term there may be a period of months before an individual bird that is killed might be replaced in a local population. However we do not consider that the presence of a wind farm or the incidence of collision is likely to materially alter the rate at which dead sea-eagles will be replaced from that which occurs elsewhere.
Following the rational outlined above, we have modelled the effects of collisions on the basis that occupancy rates of wind farm sites and sea-eagle behaviours, including avoidance rates for sea-eagles encountering turbines, will remain constant over time.
In studies of the utilisation of wind farm sites by birds through south-eastern Australia, the number of flights made by birds has been recorded during standard point counts. Thus we have data for the numbers of movements-at-risk of collision made by White-bellied Sea-eagles at the Bluff Point, Heemskirk, Mussleroe and Studland Bay wind farm sites where Biosis Research has undertaken such investigations. In order to determine possible numbers of movements that might be made by sea-eagles at other locations, data from those four sites has been averaged and then extrapolated to determine an estimated number of movements-at-risk made by the species at each site for an entire year. It is recognised that the basis for these estimations is a small pool of data from limited locations which may not be representative of the wide range of wind farm sites under consideration and is thus somewhat arbitrary. However, it is considered best to base scenario modelling on the only available data rather than on none at all.
The numbers of birds and number of flights per annum at risk of collision with turbines that have been used in modelling for each site are shown in Table 2.

Modelled cumulative impacts of wind farms on the White-bellied Sea-eagle – December 2005
B I O S I S R E S E A R C H Methods: Cumulative Impacts Modelling 20
Table 2 Scenario modelled for White-bellied Sea-eagle use of wind farms
Wind farm
Populationsize (number
of birds) modelled
Number of annual
movements at risk per bird per annum
modelled
10 Mile Lagoon, WA 3 330 9 Mile Beach, WA 3 330 Albany, WA 3 330 Bluff Point, Tas 6 660 Breamlea, Vic 3 330 Bremer Bay, WA 3 330 Canunda, SA 6 660 Cape Barren Is, Tas 3 330 Cape Bridgewater, Vic 3 330 Cape Nelson, Vic 3 330 Cape Sir William Grant, Vic 3 330 Cathedral Rocks, SA 3 330 Codrington, Vic 3 330 Denham, WA 3 330 Denmark, WA 3 330 Emu Downs, WA 6 660 Exmouth, WA 3 330 Flinders Island, Tas 3 330 Fraser Is, Qld 3 330 Fremantle, WA 3 330 Gabo Is, Vic 3 330 Green Point, SA 3 330 Heemskirk, Tas 6 660 Hopetoun, Wa 3 330 Kemmiss Hill Road, SA 3 330 King Is Huxley Hill Stages 1 & 2, Tas 3 330 Kongorong, SA 3 330 Kooragang, NSW 3 330 Lake Bonney Stage 1, SA 6 660 Lake Bonney Stage 2, SA 6 660 Mallacoota, Vic 3 330 Mount Millar, SA 6 660 Mumbida stg 1, WA 6 660 Mussleroe, Tas 6 660 Myponga, SA 3 330 Nirranda South, Vic 3 330 Nirranda, Vic 3 330 North Keppel Is, Qld 3 330 Pt Hicks, Vic 3 330 Rottnest Is, WA 3 330 Sheringa, SA 6 660 Starfish Hill, SA 6 660 Studland Bay, Tas 6 660 Swan Valley, WA 3 330 Thursday Is, Qld 3 330 Toora, Vic 3 330 Tortoise Head, Vic 3 330 Troubridge Point, SA 3 330 Tungetta Hill & Loch Well Beach, SA 6 660 Vincent North (She Oak Flat), SA 6 660 Waitpinga, SA 6 660

Modelled cumulative impacts of wind farms on the White-bellied Sea-eagle – December 2005
B I O S I S R E S E A R C H Methods: Cumulative Impacts Modelling 21
Wind farm
Populationsize (number
of birds) modelled
Number of annual
movements at risk per bird per annum
modelled
Walkaway Alinta, WA 6 660 Wattle Point, SA 6 660 Wilsons Promontory, Vic 3 330 Wonthaggi, Vic 3 330 Yambuk, Vic 3 330
2.4.4 Avoidance by White-bellied Sea-eagles of wind turbines
Note that in modelling of the cumulative impacts of collision, any collision caused by a bird striking, or being struck by, a turbine, is assumed to result in death of the bird.
The use of the term ‘avoidance’ here refers to how birds respond when they encounter a wind turbine, that is, the rate at which birds attempt to avoid colliding with the structures.
At the request of DEH, three avoidance rates are modelled: 95%, 98% and 99%. Given that static elements of a turbine (tower, nacelle, etc.) are stationary and highly visible, we take the approach of modelling the likely avoidance rate of the area presented by these parts as 99% in all scenarios. The three variable avoidance rates that are modelled here relate to the area in which the sweeping motion of rotors is considered to present a higher risk. They are calculated as the area swept by rotors during the passage of a bird at a given flight speed.Complete lack of avoidance (0%) is behaviour that has not been observed in any study of bird interactions with wind turbines and would be analogous to birds flying blindly without responding to any objects within their environments. It should be noted that 99% avoidance rate means that for every 100 flight made by a bird it will make one in which it takes no evasive action to avoid collision with a turbine. In real terms this equates to avoidance behaviour that is considerably lower than that shown by many species of birds under most circumstances. Absolute avoidance behaviour (100%) has been documented for some species and may be a reasonable approximation for many species in good conditions, but is unlikely for some species in certain conditions.
For all bird groups, specific avoidance rates measured to date are:

Modelled cumulative impacts of wind farms on the White-bellied Sea-eagle – December 2005
B I O S I S R E S E A R C H Methods: Cumulative Impacts Modelling 22
1. Directly observed avoidance rates (i.e. observations of birds passing through a turbine array, but showing active avoidance of collisions):
100% - Barnacle, Greylag, White-fronted Geese, Sweden (Percival 1998);
100% - range of species (Common Starling, Straw-necked Ibis, Australian Magpie, Australian Raven, Little Raven, European Goldfinch, White-fronted Chat, Skylark, Black-shouldered Kite, Brown Goshawk, Richards Pipit, Magpielark, Nankeen Kestrel, White-faced Heron, Brown Songlark, Swamp Harrier, Brown Falcon, Collared Sparrowhawk, egret sp., White Ibis), Codrington, Victoria (Meredith et al. 2002);
99% - migrating birds, Holland (diurnal and nocturnal data) (Winkelman 1992);
99.9% - gulls, Belgium (Everaert et al. 2002, in Langston & Pullan 2002);
99.8% - Common Terns, Belgium (Everaert et al. 2002, in Langston & Pullan 2003);
97.5% - waterfowl and waders, Holland (Winkelman 1992, 1994);
87% - waterfowl and waders at night, Holland (Winkelman 1990).
2. Calculated avoidance rates (i.e. recorded fatalities compared with measured utilisation rates – these are more accurately considered as survival rates of birds passing through a wind farm, but they give an indirect estimate of avoidance rate):
100% - waterfowl, Yukon, Canada (Mossop 1997);
100% - raptors, Yukon (ibid);
99% - Australian Magpie, Skylark, Codrington Victoria (Meredith et al.2002);
99% - waterfowl, waders, cormorants, UK (Percival 2001);
>95% - Brown Falcon, Victoria [Codrington] (Meredith et al. 2002).
Based on the experience cited above, it is reasonable to conclude that an avoidance rate of 99% or greater is typical for daylight and normal weather. The only measured avoidance rate of nocturnal flights is 87% (Winkelman 1990). While other sources conclude that birds’ avoidance behaviour differs between night and day, they do not provide actual avoidance rates. Radar studies record 100% avoidance in most cases, but where a “reduction” in avoidance has been noted, corresponding avoidance rates have not been provided (Dirksen et al.

Modelled cumulative impacts of wind farms on the White-bellied Sea-eagle – December 2005
B I O S I S R E S E A R C H Methods: Cumulative Impacts Modelling 23
1996). These sources suggest that at night, birds are more cautious about flying into a wind farm area, but have potentially lower rates of avoidance if they do enter a wind farm. Since 87% is the only avoidance rate figure available for conditions of poor visibility (e.g. night, fog), and in the absence of any other empirical data this is most reasonable to use as a lower bound on ecologically reasonable rates.
It would seem likely that avoidance by a species with the flight characteristics of the White-bellied Sea-eagle would generally be in the range of 95% to 100% in most conditions. Sea-eagles may fly infrequently when visibility is reduced by fog or rain, however some individuals of some species do fly under these conditions and this can lead to increased collision risk. They are highly unlikely to fly during the hours of darkness. Data from overseas, based on findings of bird carcasses, demonstrates that large raptors do collide with turbines. However, empirical data about avoidance rates requires investigations that assess the actual behaviours of birds when they are confronted by turbines. Such studies for raptors have rarely been attempted and the only research into this question for the raptors in Australia is that of Meredith et al. (2002) who investigated avian avoidance of turbines at the Codrington wind farm in Victoria. They documented three instances of Wedge-tailed Eagles flying in the vicinity of the wind farm and the birds avoided collision in each case. In a recent investigation of collision risk for the Golden Eagle Aquila chrysaetos for the proposed Lewis Wind Farm in Scotland, Coates (2004) modelled for avoidance rates of between 95% and 99.9%. He considered that, ‘… the actual level of avoidance is most likely to lie within the upper part of this range, that is, around 99.0 to 99.5%”. Overall, considering the range of species sampled in Australia and overseas, the consistency in avoidance rates and the absence of any documented cases lower then 95%, it is appropriate to assume that White-bellied Sea-eagles will have avoidance rates in the 95% - 100% range. Nonetheless, we recommend that this is a key area requiring further soundly based investigation within operational wind farms.

Modelled cumulative impacts of wind farms on the White-bellied Sea-eagle – December 2005
B I O S I S R E S E A R C H Results: Cumulative Impacts Modelling 24
3.0 RESULTS: CUMULATIVE IMPACTS MODELLING
3.1 Estimated impacts from modelling of individual wind farms
The initial stage for modelling the cumulative risk of White-bellied Sea-eagle collisions with wind turbines is to determine a level of risk posed by each individual wind farm. Results from this process also allow assessment to be made of the effects of any single wind farm or of any combination of farms. For the purposes of evaluating the potential impacts of current or future proposals to build wind farms this component of the process provides a valuable tool.
No empirical values for annual variations in population numbers nor for any variables of demographic parameters influencing the population were available. Clearly environmental variables and stochastic events have effects on the White-bellied Sea-eagle population, however in the absence of any known values and for simplicity of presentation, we have not assigned arbitrary coefficients of variation. Therefore, in the following results and discussion mean values are used throughout, but may be viewed as indicative only. Annual variations in all values will occur and may have considerable influence on population numbers used here and on predictions derived from them.
Predicted risk of collisions is expressed as a mean annual survivorship rate which represents the proportion of the population that is expected to survive all encounters with turbines at a given wind farm during the course of a year. Modelled survivorship rates for relevant wind farms are shown in Table 3. It has been necessary to calculate and show these values to five significant numbers in order for differences between them to be detected. It is important that this is not misinterpreted to indicate any level of ‘accuracy’ in the predicted results.
Table 3 Modelled survivorship rates for wind farms presenting a collision risk to White-bellied
Sea-eagles
Windfarm Survivorship rate at 95% avoidance
rate
Survivorship rate at 98% avoidance
rate
Survivorship rate at 99% avoidance
rate
10 Mile Lagoon, WA 0.99364 0.99628 0.99716
9 Mile Beach, WA 0.99657 0.99801 0.99849
Albany, WA 0.99515 0.99719 0.99787
Bluff Point, Tas 0.98929 0.99359 0.99151
Breamlea, Vic 0.99997 0.99998 0.99998
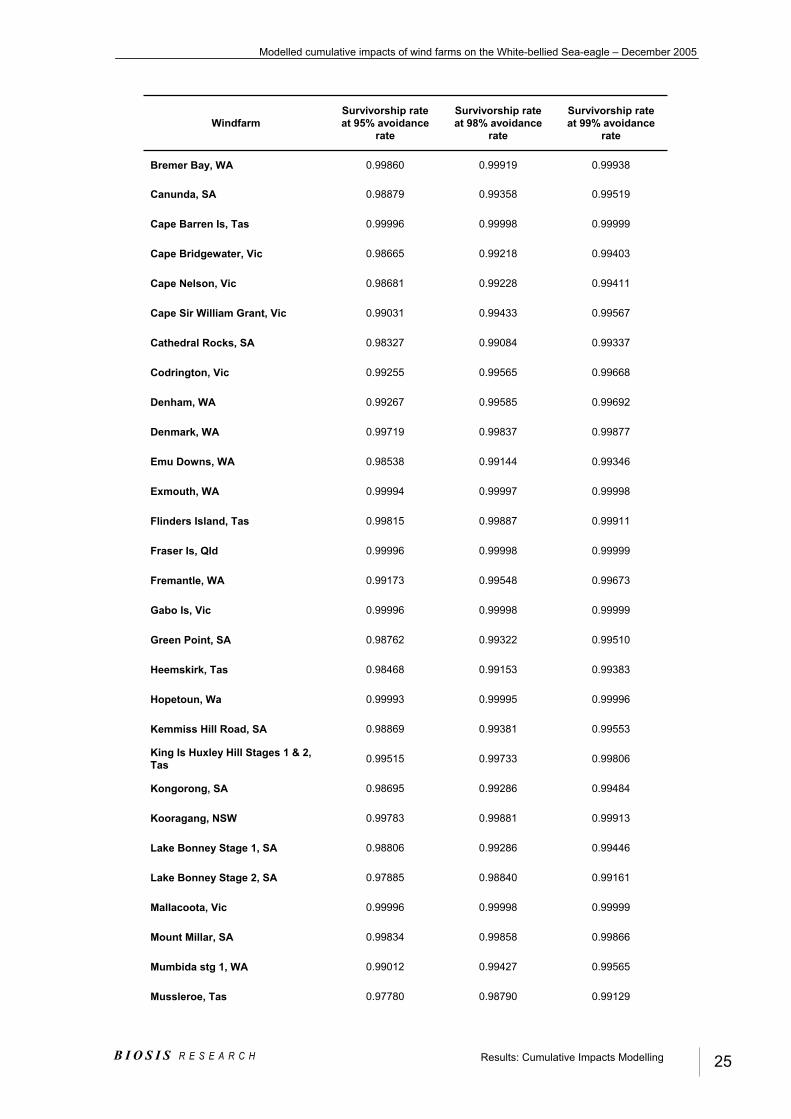
Modelled cumulative impacts of wind farms on the White-bellied Sea-eagle – December 2005
B I O S I S R E S E A R C H Results: Cumulative Impacts Modelling 25
Windfarm Survivorship rate at 95% avoidance
rate
Survivorship rate at 98% avoidance
rate
Survivorship rate at 99% avoidance
rate
Bremer Bay, WA 0.99860 0.99919 0.99938
Canunda, SA 0.98879 0.99358 0.99519
Cape Barren Is, Tas 0.99996 0.99998 0.99999
Cape Bridgewater, Vic 0.98665 0.99218 0.99403
Cape Nelson, Vic 0.98681 0.99228 0.99411
Cape Sir William Grant, Vic 0.99031 0.99433 0.99567
Cathedral Rocks, SA 0.98327 0.99084 0.99337
Codrington, Vic 0.99255 0.99565 0.99668
Denham, WA 0.99267 0.99585 0.99692
Denmark, WA 0.99719 0.99837 0.99877
Emu Downs, WA 0.98538 0.99144 0.99346
Exmouth, WA 0.99994 0.99997 0.99998
Flinders Island, Tas 0.99815 0.99887 0.99911
Fraser Is, Qld 0.99996 0.99998 0.99999
Fremantle, WA 0.99173 0.99548 0.99673
Gabo Is, Vic 0.99996 0.99998 0.99999
Green Point, SA 0.98762 0.99322 0.99510
Heemskirk, Tas 0.98468 0.99153 0.99383
Hopetoun, Wa 0.99993 0.99995 0.99996
Kemmiss Hill Road, SA 0.98869 0.99381 0.99553
King Is Huxley Hill Stages 1 & 2, Tas 0.99515 0.99733 0.99806
Kongorong, SA 0.98695 0.99286 0.99484
Kooragang, NSW 0.99783 0.99881 0.99913
Lake Bonney Stage 1, SA 0.98806 0.99286 0.99446
Lake Bonney Stage 2, SA 0.97885 0.98840 0.99161
Mallacoota, Vic 0.99996 0.99998 0.99999
Mount Millar, SA 0.99834 0.99858 0.99866
Mumbida stg 1, WA 0.99012 0.99427 0.99565
Mussleroe, Tas 0.97780 0.98790 0.99129

Modelled cumulative impacts of wind farms on the White-bellied Sea-eagle – December 2005
B I O S I S R E S E A R C H Results: Cumulative Impacts Modelling 26
Windfarm Survivorship rate at 95% avoidance
rate
Survivorship rate at 98% avoidance
rate
Survivorship rate at 99% avoidance
rate
Myponga, SA 0.99211 0.99528 0.99634
Nirranda South, Vic 0.98882 0.99345 0.99500
Nirranda, Vic 0.98784 0.99293 0.99463
North Keppel Is, Qld 0.99996 0.99998 0.99999
Pt Hicks, Vic 0.99996 0.99998 0.99999
Rottnest Is, WA 0.99860 0.99919 0.99938
Sheringa, SA 0.97178 0.98450 0.98878
Starfish Hill, SA 0.98986 0.99406 0.99547
Studland Bay, Tas 0.98543 0.99202 0.99423
Swan Valley, WA 0.99996 0.99998 0.99999
Thursday Is, Qld 0.99707 0.99829 0.99869
Toora, Vic 0.99389 0.99634 0.99717
Tortoise Head, Vic 0.99996 0.99998 0.99999
Troubridge Point, SA 0.98869 0.99381 0.99553
Tungetta Hill & Loch Well Beach, SA 0.98436 0.99084 0.99300
Vincent North (She Oak Flat), SA 0.98733 0.99258 0.99434
Waitpinga, SA 0.98602 0.99234 0.99446
Walkaway Alinta, WA 0.98450 0.99092 0.99307
Wattle Point, SA 0.98436 0.99084 0.99300
Wilsons Promontory, Vic 0.99996 0.99998 0.99999
Wonthaggi, Vic 0.99374 0.99653 0.99745
Yambuk, Vic 0.99054 0.99446 0.99578
3.2 Estimated cumulative impacts across the range of the White-bellied Sea-eagle
The total number of White-bellied Sea-eagles modelled as interacting annually with all fifty-six wind farms under consideration here is 219 (2.4.3 Population size and movements of White-bellied Sea-eagles at wind farm sites).

Modelled cumulative impacts of wind farms on the White-bellied Sea-eagle – December 2005
B I O S I S R E S E A R C H Results: Cumulative Impacts Modelling 27
The mean survivorship rates determined for the cumulative impacts of collisions on this portion of the entire sea-eagle population at fifty-six wind farms across the bird’s range are provided in Table 4.
Table 4 Cumulative survivorship values for the White-bellied Sea-eagle
population from potential collision risk posed by fifty-six wind farms in the species’ range
Survivorship rate at 95% avoidance
rate
Survivorship rate at 98% avoidance
rate
Survivorship rate at 99% avoidance
rate
0.99188 0.99537 0.99648
3.2.1 Impacts on White-bellied Sea-eagle annual survivorship
In order to assess the potential impact of altered survivorship rates that may be imposed on the White-bellied Sea-eagle population by collisions with wind turbines it will first be necessary to know the background survivorship rate that affects the population in the absence of any impacts of wind farm collision. Unfortunately, this has not been determined for the species. If or when it is, it can be multiplied by the cumulative collision risk survivorship rates predicted by the modelling and shown in Table 4, for the portion of the total population that is assumed to interact with wind farms. Since collision effects are considered to function as a constant over time, the adjusted mortality rate will be applicable regardless of the White-bellied Sea-eagle population size.
3.2.2 Predicted White-bellied Sea-eagle mortalities
The number of White-bellied Sea-eagles that the model predicts might be killed on average per annum at each wind farm, according to the three avoidance rates modelled, are shown in Table 5. A total number of birds predicted to be killed annually by the cumulative effects of turbine collisions across the species’ range is determined by summing the number of fatalities predicted for each avoidance rate for all thirty-five wind farms, and is shown as a total in Table 5.

Modelled cumulative impacts of wind farms on the White-bellied Sea-eagle – December 2005
B I O S I S R E S E A R C H Results: Cumulative Impacts Modelling 28
Table 5 Predicted average annual number of White-bellied Sea-eagle mortalities due to
collisions with wind turbines
Windfarm Number of deaths at 95% avoidance
rate
Number of deaths at 98% avoidance
rate
Number of deaths at 99% avoidance
rate
10 Mile Lagoon, WA 0.01907 0.01115 0.00851
9 Mile Beach, WA 0.01030 0.00597 0.00452
Albany, WA 0.01030 0.00597 0.00452
Bluff Point, Tas 0.06427 0.03846 0.02983
Breamlea, Vic 0.00008 0.00007 0.00006
Bremer Bay, WA 0.00421 0.00244 0.00185
Canunda, SA 0.06728 0.03849 0.02887
Cape Barren Is, Tas 0.00011 0.00005 0.00003
Cape Bridgewater, Vic 0.04006 0.02346 0.01791
Cape Nelson, Vic 0.03956 0.02317 0.01768
Cape Sir William Grant, Vic 0.02908 0.01702 0.01299
Cathedral Rocks, SA 0.05018 0.02749 0.01989
Codrington, Vic 0.02236 0.01306 0.00995
Denham, WA 0.02199 0.01244 0.00925
Denmark, WA 0.00842 0.00488 0.00369
Emu Downs, WA 0.08770 0.05138 0.03922
Exmouth, WA 0.00017 0.00008 0.00005
Flinders Island, Tas 0.00555 0.00338 0.00266
Fraser Is, Qld 0.00011 0.00005 0.00003
Fremantle, WA 0.02481 0.01357 0.00981
Gabo Is, Vic 0.00011 0.00005 0.00003
Green Point, SA 0.03714 0.02033 0.01470
Heemskirk, Tas 0.09194 0.05082 0.03705
Hopetoun, Wa 0.00022 0.00014 0.00012
Kemmiss Hill Road, SA 0.03392 0.01856 0.01342
King Is Huxley Hill Stages 1 & 2, Tas 0.01455 0.00801 0.00582
Kongorong, SA 0.03914 0.02142 0.01549

Modelled cumulative impacts of wind farms on the White-bellied Sea-eagle – December 2005
B I O S I S R E S E A R C H Results: Cumulative Impacts Modelling 29
Windfarm Number of deaths at 95% avoidance
rate
Number of deaths at 98% avoidance
rate
Number of deaths at 99% avoidance
rate
Kooragang, NSW 0.00652 0.00358 0.00260
Lake Bonney Stage 1, SA 0.07162 0.04287 0.03325
Lake Bonney Stage 2, SA 0.12691 0.06959 0.05036
Mallacoota, Vic 0.00011 0.00005 0.00003
Mount Millar, SA 0.00997 0.00850 0.00801
Mumbida stg 1, WA 0.05930 0.03441 0.02608
Mussleroe, Tas 0.13321 0.07258 0.05224
Myponga, SA 0.02366 0.01415 0.01097
Nirranda South, Vic 0.03355 0.01964 0.01499
Nirranda, Vic 0.03647 0.02122 0.01612
North Keppel Is, Qld 0.00011 0.00005 0.00003
Pt Hicks, Vic 0.00011 0.00005 0.00003
Rottnest Is, WA 0.00421 0.00244 0.00185
Sheringa, SA 0.16930 0.09299 0.06733
Starfish Hill, SA 0.06085 0.03561 0.02718
Studland Bay, Tas 0.08745 0.04788 0.03464
Swan Valley, WA 0.00011 0.00005 0.00003
Thursday Is, Qld 0.00880 0.00514 0.00392
Toora, Vic 0.01834 0.01097 0.00850
Tortoise Head, Vic 0.00011 0.00005 0.00003
Troubridge Point, SA 0.03392 0.01856 0.01342
Tungetta Hill & Loch Well Beach, SA 0.09383 0.05498 0.04197
Vincent North (She Oak Flat), SA 0.07603 0.04452 0.03398
Waitpinga, SA 0.08390 0.04593 0.03322
Walkaway Alinta, WA 0.09298 0.05448 0.04159
Wattle Point, SA 0.09383 0.05498 0.04197
Wilsons Promontory, Vic 0.00011 0.00005 0.00003
Wonthaggi, Vic 0.01877 0.01042 0.00764
Yambuk, Vic 0.02838 0.01661 0.01267

Modelled cumulative impacts of wind farms on the White-bellied Sea-eagle – December 2005
B I O S I S R E S E A R C H Results: Cumulative Impacts Modelling 30
Windfarm Number of deaths at 95% avoidance
rate
Number of deaths at 98% avoidance
rate
Number of deaths at 99% avoidance
rate
Total predicted deaths 2.09513 1.19430 0.89272
Thus for the scenarios modelled here, a cumulative total of between 0.9 and 2.1 White-bellied Sea-eagles per year are predicted to be killed by collisions at all of the sites the population is likely to encounter within its natural range. From the admittedly limited, but accumulating, information about bird avoidance of wind turbines, particularly for large raptors, we consider that the higher avoidance rates modelled here are the most likely to represent the avoidance capacities of White-bellied Sea-eagles. Thus the lower annual mortalities predicted are considered to be the closest to what might occur in reality.
3.2.3 Conclusion
The cumulative impacts of collision with turbines on the overall population of White-bellied Sea-eagles, predicted by the modelling for all current and presently proposed wind farms within the species’ range are provided. Results for the range of avoidance rates modelled, predict an average of between slightly less than one and slightly more than two sea-eagles may be killed due to wind turbine collisions every year.
It is recognised that assumptions about numbers of White-bellied Sea-eagles and numbers of their movements used in the modelling are necessarily arbitrary since there is relatively few empirical data on which to base them. It is therefore possible that they may not reflect reality for all of the fifty-six wind farms encompassed by the modelling. Based on knowledge of the species, it can be assumed that predictions of the present modelling are as accurate as can be currently made.
We consider it important that further investigations of White-bellied Sea-eagles at wind farm sites should be made in order to better validate modelled predictions. Additional data for utilisation rates of sites by the species will assist, as will studies that document the actual avoidance behaviours of birds in flight within functioning wind farms.

Modelled cumulative impacts of wind farms on the White-bellied Sea-eagle – December 2005
B I O S I S R E S E A R C H Appendices 31
APPENDICES

Modelled cumulative impacts of wind farms on the White-bellied Sea-eagle – December 2005
B I O S I S R E S E A R C H Appendix 1 32
APPENDIX 1 Cumulative Wind Farm Effects Modelling

Cumulative Wind Farm Effects
Modelling
Approach and Justification
Stuart MuirSymboliX
forBiosis Research Pty. Ltd
June 10, 2005
Abstract
The method to combine the individual wind-farm site assessments intoa cumulative effects model is described. It is shown that this is done bymultiplying all the individual site survival probabilities for each speciestogether. i.e Survival chance = P (S1)P (S2)P (S3)P (S4) . . . P (SN )
1 Introduction
Previous windfarm modelling has resulted in a measure of risk of bird-turbine interactions. It inherently relied on the assumption that the birdinteracted with the site of the farm, and proceeded to generate a measureof the probability of birdstrike through calculations of presented areas ofturbine and assumptions and observations of bird movements.
To approximate cumulative effects of multiple windfarms on the risk ofstrike, we need to remove the assumption that the bird is already interact-ing with the site. Having done this, we must account for the probabilitiesof interacting with a given farm site, and then incorporate the risk ofstrike associated with that farm. We then can proceed to calculate thesurvival rate of a bird population residing or moving through a regionwith resident windfarms.
2 Mechanics
This section is provided to allow for subsequent auditing of the process.Due to its technical nature, it may be skimmed by the non-technicalreader.
1

2.0.1 Definitions
• “region” At this stage we only refer to a region to allow the distinc-tion between “home-ranges” and “habitats.” Appropriate choicesfor what these regions represent will need to be made at a laterstage.
• N the number of wind farm sites found within the region of interest
• “site” A particular wind farm, consisting of turbines standing onsome of the region
• Bi the event of a birdstrike associated with site i
• Ai the event of a bird interacting with site i
• Si the event of survival of an interaction with site i
• P (C) a measure of the probability of an event, C, occurring
Note: The development of the method requires that all mortality riskassessments be converted to survival chance. This is due to the impossi-bility of a struck bird going on to either be struck again, or to survive thenext interaction. Only survivors can continue to interact.
2.1 Estimating Individual Site Risk (P (Bi|Ai))
As stated previously, the previous wind farm risk assessments have con-centrated on the risk of strike, given that the bird is flying through thesite.
Using the definitions of section 2.0.1, this is written as
P (Bi|Ai), (1)
and read as the probability of strike (event Bi), given that the bird isalready on site (event Ai).
A measure of this risk can be obtained one of two ways. Assumingthere is a significant population (defined to be large enough that the lossof a single bird will not be significant and another individual will replaceit) then
Movements at Risk
Total Yearly Movements(2)
can be used. Using this ratio implicitly assumes that the site populationis comparable to the number of observed movements. This may result ina significant under estimate of risk.
If the population is small, then the mortality rate should be taken fromthe earlier model’s measure of corpse numbers per year, and expressed as
Expected corpses per year
Population. (3)
The later form, if population data is available, is the preferred form.This is both for completeness as well as ease of implementation. If theactual population is known to be small but site residency is unknown, it isbetter to estimate site population, or enter the habitat population, thanto rely on the movements at risk approximation which could well be twoorders of magnitude below actual risk.
2

2.2 Estimating the chance of surviving a site
To estimate the chance of surviving a site, we need both the probabilityof never visiting (P (A′)) and the chance of visiting, but not being struck(P (B′|A)). As there are only three possibilities,
1. Visiting and not being struck,
2. Visiting and being struck,
3. and Not visiting at all
the easiest estimation of this risk is to calculate the risk of visiting andbeing struck, and subtract this value from unity.
The probability of visiting and being struck is given by,
P (Ai ∩ Bi) = P (Ai)P (Bi|Ai) (4)
The chance of surviving site i is then given by
P ((Ai ∩ Bi)′) = P (Si) = 1 − P (Ai)P (Bi|Ai) (5)
Note: Earlier, non-cumulative models assumed that P (A) = 1The previous section (2.1) dealt with derivation of the second term.
The first term (P (Ai)) can be approximated a number of ways. These aredetailed next.
2.3 Estimating the chance of visiting a site (P (Ai))
Previous modelling successfully avoided the issue of the physical size ofthe windfarm site through its implementation of the observational data.Unfortunately, there does not appear to be any way to avoid incorporatingthis measure into the model at this stage.
The chances of visiting a given site can be generated by measuring theinteraction between a region and the site. This is most naturally doneby comparing areas of the site relative to the region. This assumes thatthere is no reason for visiting or avoiding the site relative to any otherarea of the region. It may be appropriate to adjust this value if the siteis a significant habitat or food source likely to attract visits. Conversely,if the site is barren, P (Ai) might be adjusted downwards to account forthis. Without accurate data on visitation habits, the following estimatesare safe and realistic by assuming a homogenous region.
A basic measure of this probability is given by
P (Ai) =Area of site
Area of region(6)
This approximation is most appropriate for sedentary species, wherethe relevant region is the home range, not the habitat.
The form indicated above may also be used for migratory species. Ifit is to be used for a migratory species, the region appropriate becomesthe habitat area. Should the species be using a narrow corridor, this formwill be an underestimate of risk.
For a migratory species using a corridor, P (Ai), is better approxi-mated by taking the widest projection of the farm site (orthogonal to the
3

corridor), and dividing through by the width of the migratory corridor atthat location. i.e
P (Ai) =width of site
width of corridor. (7)
This removes the possibility of birds flying around a farm placed inthe corridor, without ever “passing” it. This eventuality is possible forsedentary species, who are free to roam in arcs whilst avoiding the actualsite.
2.4 Cumulative effect of N sites
Having generated the chance of surviving site i’s existence(P (Si) = 1 − P (Ai)P (Bi|Ai)),we need to know the likelihood of surviving all N sites in the region.
This is given byP (S1 ∩ S2 ∩ S3 ∩ . . . ). (8)
As surviving any one of the windfarm sites in the region is independentof surviving any other site, this simplifies to
P (S1...N ) = P (S1)P (S2)P (S3) . . . (9)
= ΠNi P (Si) (10)
3 Summary
The derivation of cumulative effects takes into account the varying individ-ual risk presented by each wind farm in a given region. This informationcan be taken directly from the previously prepared reports on each site.Extra information required to perform this calculation is:
For sedentary species : relative areas of home ranges and site areas occu-pied by windfarms/turbines
For migratory species : effective blockage of corridors by windfarm sites.
3.1 Calculation steps
To calculate the cumulative effect on the survival rate of a species:
1. Identify the sites relevant to each species
2. Estimate the mortality rate for each site (P (Bi|Ai)). This can bedone either through the movements at risk, or mortality (corpse)rate found on the summary pages. (See Section 2.2)
3. Determine an appropriate chance of site visitation, P (Ai). (See Sec-tion 2.3)Note: If the home range of a sedentary species is signifi-cantly smaller than the habitat, then average, representa-tive values for these probabilities may be calculated andsubstituted.
4

4. Determine the survival rate of each site via 1 − P (Ai)P (Bi|Ai).
5. Multiply all the survival rates of each site relevant to the speciestogether.Note: If using average properties (as discussed in the pre-vious point), raise the average probability to the power ofthe number of sites relevant to the size of the home range.
The resultant figure is a chance of survival for the species as a resultof the residency of windfarms in the habitat or corridor. A figure of unity(1) indicates no individual will ever be struck. Zero (0) indicates completeloss of the population.
5
Modelled cumulative impacts of wind farms on the White-bellied Sea-eagle – December 2005
B I O S I S R E S E A R C H References 38
REFERENCESBarrett, G., Silcocks, A., Barry, S.,
Cunningham, R and Poulter, R. 2003. The New Atlas of Australian Birds.Royal Australasian Ornithologists Union. Hawthorn East.
Bilney, R. J. and Emison, W. B. 1983. Aust. Bird Watcher 10: 61 – 68.
Blakers, M., Davies, S. J. J. F. and Reilly, P. N. 1984 The Atlas of Australian Birds Royal Australasian Ornithologists Union. Melbourne University Press, Carlton.
Brook B.W., Burgman M.A., Akçakaya H.R., O’Grady J.J., and Frankham R., 2002. Critiques of PVA ask the wrong questions: throwing the heuristic baby out with the numerical bath water.Conserv. Biol. 16, 262-263.
Burgman, M.A., 2000. Populationviability analysis for bird conservation: prediction, heuristics, monitoring and psychology. Emu, 100, 347-353.
Coates, A., 2004. Collision Risk Report.Appendix 12C Lewis Wind Farm Proposal. ERM Consulting, Edinburgh 2004.
Dirksen, S., Spaans, A.L. & van der Winden, J. 1996. Nachtelijke trek en vlieghoogtes van steltlopers in het voorjaar over de Noordelijke Havendam van Ijmuiden [Nocturnal migration and flight altitudes of waders at the Ijmuiden Northern Breakwater during spring migration].Sula 10: 129-142.
Everaet, J., Devos, K. & Kyuijken, E. 2002. Windturbines en vogels in Vlaanderen: Voorlopige onderzoeksreultaten en buitenlandse bevindingen [Wind turbines and birds in Flanders (Belgium): Preliminary study results in a European context]. Instituut voor Natuurbehoud, Report R. 2002.03, Brussels.
Langston, R.H.W. & Pullan, J.D. 2002. Windfarms and birds: an analysis of the effects of windfarms on birds, and guidance on environmental assessment criteria and site selection issues. Birdlife International report to the Bern Convention. Convention on the Conservation of European Wildlife and Natural habitats, Strasbourg, France.
Marchant, S. and Higgins, P.J. 1993. Handbook of Australian, New Zealand and Antarctic Birds: Volume 2 Raptors to Lapwings. Oxford University Press, Melbourne.
Meredith, C., Venosta, M. & Ressom, R. 2002, Codrington Wind Farm Avian Avoidance Behaviour Report. Biosis Research Pty. Ltd. Report to Pacific Hydro Pty. Ltd.
Mooney, N. J. 1986. Fintas 9: 39 – 41.
Mossop, D.H. 1997. Five years of monitoring bird strike potential at a Mountain-Top Wind Turbine, Yukon Territory. Annual Canadian Wind Energy Conference and Exhibition.Pp. 197-211. Yukon Energy Corporation, Whitehorse, Yukon, Canada.
Percival, S. 1998. Beinn Churlaich, Islay, Proposed Wind Cluster - On Geese and Turbines. Supplementary Precognition to Board of Inquiry.

Modelled cumulative impacts of wind farms on the White-bellied Sea-eagle – December 2005
B I O S I S R E S E A R C H References 39
Percival, S.M. 2001. Assessment of the Effects of Offshore Wind Farms on Birds. Consultancy Report to UK Department of Technology and Industry. Ecology Consulting, University of Sunderland, Sunderland, UK.
Winkleman, J.E. 1990. Nocturnalcollision risks for and behaviour of birds approaching a rotor in operation in the experimental wind park near Oosterbierum, Friesland, The Netherlands; English summary. Rijksinstituut voor Natuurbeheer, Arnheim. RIN-Rapport 90/17.
Winkelman, J.E. 1992. The impact of the Sep wind Park near Oosterbierum (Fr.), The Netherlands on birds. 2. nocturnal collision victims. RIN-Rapport 92/3. Rijksinstitut voor Natuurbeheer, Arnhem, The Netherlands.
Winkelman, J.E. 1994. Bird/wind turbine investigations in Europe. National Avian-Wind power planning meeting. Pp. 43-47.

Risk level to select species listed under the EPBC Act, of collision at wind farms in Gippsland, Victoria
December 2005
Ian Smales and Mark Venosta

Report forDepartment of Environment and Heritage
Risk level to select species listed under the EPBC Act of collision at wind farms in Gippsland, Victoria
December 2005
Ian Smales and Mark Venosta
Project no. 5182
BIOSISR E S E A R C H
Biosis Research Pty. Ltd. This document is and shall remain the property of Biosis Research Pty Ltd. The document may only be used for the purposes for which it was commissioned and in accordance with the Terms of the Engagement for the commission. Unauthorised use of this document in any form whatsoever is prohibited.
BIOSIS RESEARCH Pty. Ltd. A.B.N. 65 006 175 097 Natural & Cultural Heritage Consultants
Ballarat: 449 Doveton Street north, Ballarat VIC 3354 Ph: (03) 5331 7000 Fax: (03) 5331 7033 email: [email protected]
Melbourne: 38 Bertie Street Port Melbourne 3207 Ph: (03) 9646 9499 Fax: (03) 9646 9242 email: [email protected]

Risk to select EPBC species of turbine collisions at Gippsland wind farms– Dec 2005
B I O S I S R E S E A R C H Acknowledgments & Abbreviations III
ACKNOWLEDGEMENTS
Biosis Research wishes to acknowledge the contribution of the following people and organisations in undertaking this study:
Department of the Environment & Heritage, Canberra Wayne Furler Alex Rankin
Biosis Research Pty. Ltd. Charles Meredith Rohan Clarke
ABBREVIATIONS
AVW Atlas of Victorian Wildlife DEH Department of the Environment & Heritage EPBC Act Environment Protection and Biodiversity Conservation Act 1999

Risk to select EPBC species of turbine collisions at Gippsland wind farms– Dec 2005
B I O S I S R E S E A R C H Contents IV
CONTENTSACKNOWLEDGEMENTS ......................................................................................................... III ABBREVIATIONS ..................................................................................................................... III CONTENTS ............................................................................................................................... IV 1.0 INTRODUCTION .............................................................................................................. 5
1.1 Project Background.................................................................................................... 5
2.0 METHODS........................................................................................................................ 7 1.2 Information sources ................................................................................................... 7
3.0 RESULTS......................................................................................................................... 8 4.0 CONCLUSION ............................................................................................................... 19REFERENCES ......................................................................................................................... 20

Risk to select EPBC species of turbine collisions at Gippsland wind farms– Dec 2005
B I O S I S R E S E A R C H Introduction 5
1.0 INTRODUCTION
1.1 Project Background Biosis Research Pty. Ltd. was commissioned by the Department of the Environment & Heritage to provide an assessment of the potential for a variety of birds and a bat to be at risk of collisions with wind turbines at wind farms in Gippsland, Victoria.
Specific and detailed investigations of the bird and bat fauna of a number of individual wind farm sites in Gippsland have been made (e.g. Organ and Meredith 2004a, b, Brett Lane and Assoc. 2003a,b, 2005). However, those assessments are limited to the species that have been recorded during fieldwork at the particular site and/or to records of birds and bats included in public databases from areas local to the particular site.
The objective of the present study was to provide information about a suite of birds and a bat species listed under provisions of the EPBC Act, regardless of whether records of their occurrence in the immediate vicinity of wind farm sites presently exists or not. It thus has the intent of using information available from a variety of sources about the distribution, occurrence and behaviours of the species in question in order to provide an informed assessment of the potential for a risk to be posed to them by collision with wind turbines. It does not purport to provide a detailed quantification of collision risk of the kind that can be determined by collision risk modelling (Smales, Meredith and McCarthy 2004). Rather, it is designed to make a preliminary determination of whether a risk exists for a species and, if so, the likely level of impact on the Australian population of the species that might exist.
The list of species to be assessed was provided by DEH (table 1). Following an initial assessment of this list, we advised that some of the species have distributional ranges that do not extend to eastern Victoria, or records of them from the area represent very rare vagrant occurrences only. Those species are indicated by asterisk in table 1 and, as agreed following our advice to DEH, were not included in further assessment. With one exception the species assessed are all listed under provisions of the EPBC Act for “Migratory Species”. The exception is the Grey-headed Flying –fox, which is listed as ‘Vulnerable’ under provisions of the Act for “Threatened Species”.
Table 1 EPBC Act listed species assessed
Common Name Scientific Name Grey-headed Flying-fox Pteropus poliocephalus Common Sandpiper Actitis hypoleucos Fork-tailed Swift Apus pacificus Great Egret Ardea alba Cattle Egret Ardea ibis Ruddy Turnstone Arenaria interpres Sharp-tailed Sandpiper Calidris acuminata Sanderling Calidris alba Red Knot, Knot Calidris canutus Curlew Sandpiper Calidris ferruginea Pectoral Sandpiper Calidris melanotos Red-necked Stint Calidris ruficollis

Risk to select EPBC species of turbine collisions at Gippsland wind farms– Dec 2005
B I O S I S R E S E A R C H Introduction 6
Common Name Scientific Name Long-toed Stint Calidris subminuta Great Knot Calidris tenuirostris Double-banded Plover Charadrius bicinctus Greater Sand Plover, Large Sand Plover Charadrius leschenaultii Lesser Sand Plover, Mongolian Plover Charadrius mongolus Oriental Plover, Oriental Dotterel Charadrius veredus Latham's Snipe, Japanese Snipe Gallinago hardwickii Swinhoe's Snipe * Gallinago megala Pin-tailed Snipe * Gallinago stenura Grey-tailed Tattler Heteroscelus brevipes Wandering Tattler * Heteroscelus incanus White-throated Needle-tail Hirundapus caudacutus Broad-billed Sandpiper Limicola falcinellus Asian Dowitcher * Limnodromus semipalmatus Bar-tailed Godwit Limosa lapponica Black-tailed Godwit Limosa limosa Eurasian Curlew * Numenius arquata Eastern Curlew Numenius madagascariensis Little Curlew, Little Whimbrel * Numenius minutus Whimbrel Numenius phaeopus Red-necked Phalarope * Phalaropus lobatus Ruff (Reeve) Philomachus pugnax American Golden Plover * Pluvialis dominica Pacific Golden Plover Pluvialis fulva Grey Plover Pluvialis squatarola Short-tailed Shearwater Puffinus tenuirostris Wood Sandpiper Tringa glareola Common Greenshank, Greenshank Tringa nebularia Marsh Sandpiper, Little Greenshank Tringa stagnatilis Common Redshank, Redshank * Tringa totanus Terek Sandpiper Xenus cinereus
The assessment here is based on available information about five wind farms in Gippsland. One of them, the Toora Wind Farm, is operational. The Wonthaggi Wind Farm is currently under construction and the remaining three, Bald Hills, Dollar and Rosedale Ridge Wind Farms, are proposed and either do not require assessment under the EPBC Act (Rosedale Ridge Wind Farm) or are at various stages of the project assessment or approval process.

Risk to select EPBC species of turbine collisions at Gippsland wind farms– Dec 2005
B I O S I S R E S E A R C H Methods 7
2.0 METHODS The project entailed a desktop study to evaluate available information from published sources and the collective knowledge and experience of Biosis Research zoologists, about the listed bird and bat species.
Our assessment was made against a matrix of the following criteria for each species:
Based on geographic range and habitat requirements of each species, the likelihood that a portion of the Australian population of that species might encounter wind farms in Gippsland, assessed as Minimal / Low / Medium / High.
Based on information available about population size and geographic distribution, an estimation of the portion of the Australian population likely to encounter wind farms in Gippsland, estimated as <2% / 2 - 10% / 11 - 50% / 51 - 100%. For some of the species assessed there are no records from Gippsland. In such instances we considered that the portion of the population that might encounter wind farms there is ‘minimal’.
Based on migratory and other movement behaviours, where applicable, an indication of season(s) and annual duration for potential encounters to occur.
Based on life-history characters and behaviours, in combination with habitats at and in the vicinity of Gippsland wind farm sites, potential for collision risk to exist, assessed as Negligible / Low / Medium / High.
Where applicable, the conservation status of the particular species in Australia was taken into account in combination with the above, to determine an indication of whether collisions with turbines might affect the species. Note that we use the term ‘impact’ in the sense that it refers to a negative effect on the conservation status of a species.
From the matrix of information provided by this assessment, we provide an evaluation of the potential value of undertaking more detailed modelling for each species of the cumulative impacts of collisions with turbines at the five wind farms combined.
For species with potential for cumulative modelling, the review provides a determination of priority for modelling amongst the suite of species listed.
1.2 Information sources The project undertook a literature review, searches of relevant databases and collation of information from other reliable sources to ascertain relevant current data about bird and bat species on the list provided by DEH. Published sources are detailed in References to this report. Where applicable, information collected during field assessments of Gippsland wind farm sites by Biosis Research and other workers was used (see Table 2 Notes).
Information about current and proposed wind farms in Gippsland, such as location and size of the facility and type of turbines to be used, were drawn from information recently supplied to Biosis Research by DEH for wind farms in Australia. Key information related to habitats within, and in the vicinity of, wind farm sites was taken into account. In particular, given the fact that the great majority of species are waders and shorebirds, the proximity of coastal and freshwater wetlands to wind farm sites was evaluated. Information relative to habitats at and in the vicinity of Gippsland wind farm sites was drawn from pre-existing reports and specific Biosis Research knowledge of the sites.

Risk to select EPBC species of turbine collisions at Gippsland wind farms– Dec 2005
B I O S I S R E S E A R C H Results 8
3.0 RESULTS An assessment matrix for evaluation of potential and likely impacts of collision risk at Gippsland wind farms for listed EPBC Act species is provided in Table 2. From evaluation of the matrix, a resultant overall likely level of impact on the Australian population of each species is provided on a scale of Negligible / Low / Medium / High (see Resultant Overall Likely Level of Impact On Aust. Population of Species Table 2).
The assessment indicates that potential impacts on the majority of species evaluated is considered to be Negligible and we consider that additional detailed collision risk modelling is unlikely to be warranted for those species.
Impacts at the species level is considered to be Low for the following species: Grey-headed Flying-fox, Great Egret, Cattle Egret, White-throated Needle-tail, Short-tailed Shearwater, Fork-tailed Swift, Red Knot, Latham's Snipe, Sharp-tailed Sandpiper, Double-banded Plover, Pacific Golden Plover, Common Sandpiper. For species assessed as having a Low impact potential we consider that detailed collision risk modelling may be of value as a too1 in quantifying the level of impact that each species might experience as a result of collisions with wind turbines. On the basis of risk posed by species’ flight behaviour and conservation status, we consider that the White-throated Needletail, Latham’s Snipe and Grey-headed Flying-fox would constitute the highest priority species, in terms of being the most likely species to be at risk from collision with wind turbines at wind farms in Gippsland. All other species would constitute a lower priority. It should be stressed, however, that this priority ranking is only relevant in terms of the current group of species assessed in this study. Further, this finding should not be interpreted as a recommendation that these species should undergo a more detailed level of evaluation at this time, as the potential risk of collision posed by the Gippsland wind farms to these species is considered to be Low.
It should be noted that collision risk modelling can be undertaken on the basis of scenarios in the absence of actual bird or bat utilisation data obtained from field studies. However, modelling can be expected to be most accurate, and results more robust, when it utilises substantial field data collected from wind farm sites under various conditions and across a number of seasons.

Ris
k to
sel
ect E
PBC
spe
cies
of t
urbi
ne c
ollis
ions
at G
ipps
land
win
d fa
rms–
Dec
200
5
BIOSIS
RE
SE
AR
CH
Res
ults
9
Tabl
e 2
Ass
essm
ent m
atrix
for e
valu
atio
n of
pot
entia
l im
pact
s of
col
lisio
n ris
k at
Gip
psla
nd w
ind
farm
s fo
r lis
ted
EPB
C A
ct s
peci
es
Com
mon
Nam
e Sc
ient
ific
Nam
e EP
BC
Act
lis
ting
Gip
psla
nd
AVW
reco
rds
Seas
on a
nd
dura
tion
of
risk
Like
lihoo
d of
po
rtio
n of
po
pula
tion
enco
unte
ring
curr
ent o
r pr
opos
ed w
ind
farm
s (M
inim
al
/ Low
/ M
ediu
m
/ Hig
h)
Estim
ated
por
tion
of A
ustr
alia
n po
pula
tion
with
po
tent
ial t
o en
coun
ter c
urre
nt
or p
ropo
sed
win
d fa
rms
( Min
imal
/ <2
% /
2 - 1
0% /
11 -
50%
/ 51
- 10
0% )
Like
lihoo
d of
sp
ecie
s'be
havi
our
posi
ng c
ollis
ion
risk
if/w
hen
enco
unte
rs w
ith
win
d fa
rms
occu
r (Lo
w /
Med
ium
/ H
igh)
RES
ULT
AN
T O
VER
ALL
LI
KEL
Y LE
VEL
OF
IMPA
CT
ON
A
UST
RA
LIA
N
POPU
LATI
ON
O
F SP
ECIE
S (N
eglig
ible
/ Lo
w /
Med
ium
/ H
igh)
Not
es
Gre
y-he
aded
Fl
ying
-fox
Pte
ropu
spo
lioce
phal
usV
u
Few
sin
gle
reco
rds
from
co
asta
l are
as,
scat
tere
d in
land
reco
rds.
Sum
mer
, may
be
rest
ricte
d to
br
ief d
urat
ion
of s
emi-a
nnua
l m
igra
tions
or
vagr
ants
. No
resi
denc
e in
w
este
rn
Gip
psla
nd
Med
ium
2 - 1
0%
Hig
hLo
w
Mov
emen
t bet
wee
n th
e M
elbo
urne
pop
ulat
ion
and
thos
e in
E. G
ipps
land
and
Sou
ther
n N
SW
is
know
n to
occ
ur (M
enkh
orst
199
5), h
owev
er
reco
rds
are
scar
ce a
nd p
reci
se m
ovem
ent r
oute
s ar
e un
know
n. M
enkh
orst
(199
5) h
ighl
ight
s th
e im
porta
nce
of th
e G
ipps
land
coa
st a
s a
sign
ifica
nt
sour
ce o
f foo
d fo
r the
sou
ther
nmos
t bre
edin
g po
pula
tions
dur
ing
som
e w
inte
rs.
Gre
at E
gret
A
rdea
alb
a M
i/Ma
Num
erou
sre
cord
s al
ong
coas
t.Ye
ar ro
und
Hig
h <2
%
Med
ium
Lo
w
Kno
wn
to u
se te
rres
trial
wet
land
s, e
stua
rine
and
litto
ral h
abita
ts, m
oist
gra
ssla
nds
farm
dam
s,
area
s of
man
grov
es, f
lood
wat
ers
and
artif
icia
l w
etla
nds
crea
ted
by ir
rigat
ion
(Mar
chan
t and
H
iggi
ns 1
990,
Em
ison
et a
l. 19
87).
The
spe
cies
us
es e
stua
rine
mud
flats
mai
nly
as s
umm
er-
autu
mn
or d
roug
ht re
fuge
s in
sou
ther
n V
ic.
(Mar
chan
t and
Hig
gins
199
0).
Mov
emen
t inl
and
betw
een
coas
tal h
abita
ts a
nd w
etla
nd h
abita
ts
coul
d po
se c
ollis
ion
risk.

Ris
k to
sel
ect E
PBC
spe
cies
of t
urbi
ne c
ollis
ions
at G
ipps
land
win
d fa
rms–
Dec
200
5
BIOSIS
RE
SE
AR
CH
Res
ults
10
Com
mon
Nam
e Sc
ient
ific
Nam
e EP
BC
Act
lis
ting
Gip
psla
nd
AVW
reco
rds
Seas
on a
nd
dura
tion
of
risk
Like
lihoo
d of
po
rtio
n of
po
pula
tion
enco
unte
ring
curr
ent o
r pr
opos
ed w
ind
farm
s (M
inim
al
/ Low
/ M
ediu
m
/ Hig
h)
Estim
ated
por
tion
of A
ustr
alia
n po
pula
tion
with
po
tent
ial t
o en
coun
ter c
urre
nt
or p
ropo
sed
win
d fa
rms
( Min
imal
/ <2
% /
2 - 1
0% /
11 -
50%
/ 51
- 10
0% )
Like
lihoo
d of
sp
ecie
s'be
havi
our
posi
ng c
ollis
ion
risk
if/w
hen
enco
unte
rs w
ith
win
d fa
rms
occu
r (Lo
w /
Med
ium
/ H
igh)
RES
ULT
AN
T O
VER
ALL
LI
KEL
Y LE
VEL
OF
IMPA
CT
ON
A
UST
RA
LIA
N
POPU
LATI
ON
O
F SP
ECIE
S (N
eglig
ible
/ Lo
w /
Med
ium
/ H
igh)
Not
es
Cat
tle E
gret
A
rdea
ibis
M
i/Ma
Sca
ttere
dre
cord
s fro
m
And
erso
n’s
Inle
t, C
orne
r In
let a
nd
inla
nd.
Win
ter
Hig
h<2
%M
ediu
mLo
w
Reg
ular
ly fo
rage
aw
ay fr
om w
ater
on
low
-lyin
g gr
assl
ands
, im
prov
ed p
astu
res
and
crop
land
s an
d as
soci
ate
with
gra
zing
ani
mal
s. In
Gip
psla
nd th
ey
pref
er s
hallo
w w
etla
nds
betw
een
Apr
il-M
ay, l
ow-
lyin
g gr
assl
ands
in J
une-
Sep
t and
impr
oved
pa
stur
e, lu
cern
e pl
antin
gs a
nd c
ropl
and
on h
ighe
r gr
ound
in O
ct (M
arch
ant a
nd H
iggi
ns 1
990)
. M
ovem
ent b
etw
een
wet
land
hab
itats
cou
ld p
ose
colli
sion
risk
. Rec
orde
d at
Dol
lar w
ind
farm
site
(B
iosi
s 20
03).
Whi
te-th
roat
ed
Nee
dle-
tail
Hiru
ndap
usca
udac
utus
Mi/M
aN
umer
ous
reco
rds
from
G
ipps
land
.
Sum
mer
(pea
k in
Feb
-Mar
ch)
Hig
h <2
%
Hig
h Lo
w
Usu
ally
reco
rded
on
the
win
g an
d ra
rely
repo
rted
roos
ting.
Ofte
n ap
pear
s in
feed
ing
cong
rega
tions
w
here
inse
cts
are
abun
dant
(Em
ison
et a
l. 19
87).
Fl
ight
reco
rded
acr
oss
wid
e ra
nge
of h
eigh
ts fr
om
<1m
- >1
000m
(Hig
gins
199
9). R
egul
arly
reco
rded
du
ring
Dol
lar w
ind
farm
mon
itorin
g (B
iosi
s R
esea
rch
Pty
Ltd
) and
reco
rded
at B
ald
Hill
s w
ind
farm
(Bre
tt La
ne &
Ass
oc. 2
003)
flyi
ng a
t, ab
ove
and
belo
w ro
tor s
wep
t hei
ght.
Shor
t-tai
led
Shea
rwat
er
Puf
finus
tenu
irost
risM
i/Ma
Num
erou
sre
cord
s co
ncen
trate
dar
ound
Cor
ner
Inle
t/Wils
ons
Pro
mon
tory
, A
nder
son’
sIn
let a
nd a
t se
a.
Sum
mer
Lo
w
<2%
H
igh
Low
Rec
orde
d cl
ose
insh
ore
or in
pel
agic
wat
ers
far
from
land
. Bre
ed a
long
coa
st o
r on
offs
hore
is
land
s (E
mis
on e
t al.
1987
). L
arge
st c
olon
ies
on
isla
nds
off W
ilson
s P
rom
onto
ry (M
arch
ant a
nd
Hig
gins
199
0). P
oten
tial f
or ro
tor s
trike
at w
ind
farm
s w
ithin
clo
se p
roxi
mity
to th
e co
ast.

Ris
k to
sel
ect E
PBC
spe
cies
of t
urbi
ne c
ollis
ions
at G
ipps
land
win
d fa
rms–
Dec
200
5
BIOSIS
RE
SE
AR
CH
Res
ults
11
Com
mon
Nam
e Sc
ient
ific
Nam
e EP
BC
Act
lis
ting
Gip
psla
nd
AVW
reco
rds
Seas
on a
nd
dura
tion
of
risk
Like
lihoo
d of
po
rtio
n of
po
pula
tion
enco
unte
ring
curr
ent o
r pr
opos
ed w
ind
farm
s (M
inim
al
/ Low
/ M
ediu
m
/ Hig
h)
Estim
ated
por
tion
of A
ustr
alia
n po
pula
tion
with
po
tent
ial t
o en
coun
ter c
urre
nt
or p
ropo
sed
win
d fa
rms
( Min
imal
/ <2
% /
2 - 1
0% /
11 -
50%
/ 51
- 10
0% )
Like
lihoo
d of
sp
ecie
s'be
havi
our
posi
ng c
ollis
ion
risk
if/w
hen
enco
unte
rs w
ith
win
d fa
rms
occu
r (Lo
w /
Med
ium
/ H
igh)
RES
ULT
AN
T O
VER
ALL
LI
KEL
Y LE
VEL
OF
IMPA
CT
ON
A
UST
RA
LIA
N
POPU
LATI
ON
O
F SP
ECIE
S (N
eglig
ible
/ Lo
w /
Med
ium
/ H
igh)
Not
es
Fork
-taile
d Sw
ift A
pus
paci
ficus
M
i/Ma
Sca
ttere
dre
cord
s ac
ross
G
ipps
land
.S
umm
erH
igh
<2%
Hig
hLo
w
Alm
ost e
xclu
sive
ly a
eria
l fro
m <
1m -
>300
m a
nd
ofte
n oc
cur o
ver b
each
es a
nd c
liffs
as
wel
l as
farm
land
and
dev
elop
ed a
reas
(Hig
gins
199
9).
Pot
entia
l for
roto
r stri
ke d
ue to
flig
ht b
ehav
iour
.
Woo
d Sa
ndpi
per
Trin
ga g
lare
ola
Mi/M
a -
Sum
mer
,V
agra
nt v
isito
rLo
w
<2%
Lo
w
Neg
ligib
le
Sca
ttere
d re
cord
s ar
ound
Cor
ner I
nlet
(Hig
gins
an
d D
avie
s 19
96).
Com
mon
G
reen
shan
k,
Gre
ensh
ank
Trin
ga n
ebul
aria
M
i/Ma
Sca
ttere
dre
cord
s al
ong
the
coas
t. S
umm
er
Low
<2
%
Low
N
eglig
ible
W
ides
prea
d in
coa
stal
hab
itats
bet
wee
n G
ipps
land
La
kes
and
Por
t Phi
llip
(Hig
gins
and
Dav
ies
1996
). N
umbe
rs u
p to
app
rox.
300
at A
nder
son’
s In
let
and
Cor
ner/
Sha
llow
Inle
t (W
atki
ns 1
993)
.
Mar
shSa
ndpi
per,
Littl
e G
reen
shan
k Tr
inga
sta
gnat
ilis
Mi/M
a
Thre
e re
cord
s al
ong
coas
t ne
ar P
t Alb
ert
and
Jack
S
mith
’s L
ake.
Sum
mer
Lo
w
<2%
Lo
w
Neg
ligib
le
A fe
w G
ipps
land
reco
rds
betw
een
Rot
amah
Isla
nd
and
Jack
Sm
ith’s
Lak
e, n
ext c
lose
st re
cord
s in
W
este
rnpo
rt B
ay (H
iggi
ns a
nd D
avie
s 19
96).
Occ
asio
nal v
agra
nt v
isito
r to
Gip
psla
nd.
Bro
ad-b
illed
Sa
ndpi
per
Lim
icol
a fa
lcin
ellu
s M
i/Ma
One
reco
rd
from
And
erso
n’s
Inle
t
Sum
mer
Lo
w
<2%
Lo
w
Neg
ligib
le
Few
er th
an fi
ve b
irds
a ye
ar a
ppea
r in
Vic
toria
, in
som
e ye
ars
none
(Em
ison
et a
l. 19
87, H
iggi
ns a
nd
Dav
ies
1996
).

Ris
k to
sel
ect E
PBC
spe
cies
of t
urbi
ne c
ollis
ions
at G
ipps
land
win
d fa
rms–
Dec
200
5
BIOSIS
RE
SE
AR
CH
Res
ults
12
Com
mon
Nam
e Sc
ient
ific
Nam
e EP
BC
Act
lis
ting
Gip
psla
nd
AVW
reco
rds
Seas
on a
nd
dura
tion
of
risk
Like
lihoo
d of
po
rtio
n of
po
pula
tion
enco
unte
ring
curr
ent o
r pr
opos
ed w
ind
farm
s (M
inim
al
/ Low
/ M
ediu
m
/ Hig
h)
Estim
ated
por
tion
of A
ustr
alia
n po
pula
tion
with
po
tent
ial t
o en
coun
ter c
urre
nt
or p
ropo
sed
win
d fa
rms
( Min
imal
/ <2
% /
2 - 1
0% /
11 -
50%
/ 51
- 10
0% )
Like
lihoo
d of
sp
ecie
s'be
havi
our
posi
ng c
ollis
ion
risk
if/w
hen
enco
unte
rs w
ith
win
d fa
rms
occu
r (Lo
w /
Med
ium
/ H
igh)
RES
ULT
AN
T O
VER
ALL
LI
KEL
Y LE
VEL
OF
IMPA
CT
ON
A
UST
RA
LIA
N
POPU
LATI
ON
O
F SP
ECIE
S (N
eglig
ible
/ Lo
w /
Med
ium
/ H
igh)
Not
es
Bar
-taile
d G
odw
it Li
mos
a la
ppon
ica
Mi/M
a
Num
erou
sre
cord
s fro
m
Cor
ner a
nd
Sha
llow
Inle
t.
Year
roun
d,
mos
tly
sum
mer
but
no
n-br
eedi
ng
indi
vidu
als
frequ
ently
sp
end
win
ter
in C
orne
r Inl
et.
Low
<2
%Lo
w
Neg
ligib
le
1 3,13
9 bi
rds
wer
e re
cord
ed in
Cor
ner a
nd S
hallo
w
Inle
t in
1987
(Wat
kins
199
3). T
hese
bird
s ar
e re
gula
rly re
cord
ed u
sing
coa
stal
mud
flats
and
ra
rely
reco
rded
usi
ng w
etla
nds
or in
are
as o
f sho
rt gr
ass
such
as
farm
land
, pad
dock
s or
airs
trips
(H
iggi
ns a
nd D
avie
s 19
96).
Unl
ikel
y to
be
at ri
sk o
f ro
tor s
trike
due
to s
peci
fic h
abita
t req
uire
men
ts
that
rest
rict t
he s
peci
es d
istri
butio
n to
inte
rtida
l ar
eas.
Bla
ck-ta
iled
God
wit
Lim
osa
limos
a M
i/Ma
Thre
e re
cord
s fro
m S
hallo
w
Inle
t.S
umm
er
Low
<2
%
Low
N
eglig
ible
R
arel
y re
cord
ed in
Gip
psla
nd (H
iggi
ns a
nd D
avie
s 19
96).
East
ern
Cur
lew
N
umen
ius
mad
agas
carie
nsis
M
i/Ma
Num
erou
sre
cord
s fro
m
And
erso
n’s,
Cor
ner a
nd
Sha
llow
Inle
t, an
d Ja
ck
Sm
ith’s
Lak
e.
Year
roun
d,
prin
cipa
lly
sum
mer
but
sm
all n
umbe
rs
over
win
ter.
Low
2
- 10%
Lo
w
Neg
ligib
le
Occ
ur o
n in
terti
dal m
udfla
ts o
r san
dfla
ts, o
ften
with
be
ds o
f sea
gras
s, a
nd o
ccas
iona
lly o
n oc
ean
beac
hes
(Hig
gins
and
Dav
ies
1996
). A
ppro
xim
atel
y 20
00 b
irds
occu
r reg
ular
ly in
Cor
ner
and
Sha
llow
Inle
t (E
mis
on e
t al.
1987
, Hig
gins
and
D
avie
s 19
96, W
atki
ns 1
993,
AV
W).
Em
ison
et a
l. (1
987)
com
men
t tha
t mos
t of t
he w
orld
pop
ulat
ion
win
ters
in e
aste
rn A
ustra
lia, w
here
the
habi
tats
in
Vic
toria
are
vita
l for
thei
r con
serv
atio
n. U
nlik
ely
to
be a
t ris
k of
roto
r stri
ke d
ue to
spe
cific
hab
itat
requ
irem
ents
that
rest
rict t
he s
peci
es d
istri
butio
n to
inte
rtida
l are
as.

Ris
k to
sel
ect E
PBC
spe
cies
of t
urbi
ne c
ollis
ions
at G
ipps
land
win
d fa
rms–
Dec
200
5
BIOSIS
RE
SE
AR
CH
Res
ults
13
Com
mon
Nam
e Sc
ient
ific
Nam
e EP
BC
Act
lis
ting
Gip
psla
nd
AVW
reco
rds
Seas
on a
nd
dura
tion
of
risk
Like
lihoo
d of
po
rtio
n of
po
pula
tion
enco
unte
ring
curr
ent o
r pr
opos
ed w
ind
farm
s (M
inim
al
/ Low
/ M
ediu
m
/ Hig
h)
Estim
ated
por
tion
of A
ustr
alia
n po
pula
tion
with
po
tent
ial t
o en
coun
ter c
urre
nt
or p
ropo
sed
win
d fa
rms
( Min
imal
/ <2
% /
2 - 1
0% /
11 -
50%
/ 51
- 10
0% )
Like
lihoo
d of
sp
ecie
s'be
havi
our
posi
ng c
ollis
ion
risk
if/w
hen
enco
unte
rs w
ith
win
d fa
rms
occu
r (Lo
w /
Med
ium
/ H
igh)
RES
ULT
AN
T O
VER
ALL
LI
KEL
Y LE
VEL
OF
IMPA
CT
ON
A
UST
RA
LIA
N
POPU
LATI
ON
O
F SP
ECIE
S (N
eglig
ible
/ Lo
w /
Med
ium
/ H
igh)
Not
es
Whi
mbr
el
Num
eniu
sph
aeop
usM
i/Ma
Sca
ttere
dre
cord
s fro
m
And
erso
n’s
and
Sha
llow
In
let.
Year
roun
d,
prin
cipa
lly
sum
mer
but
sm
all n
umbe
rs
over
win
ter.
Low
<2
%Lo
w
Neg
ligib
le
Floc
ks o
f up
to 3
0 bi
rds
occu
r in
Cor
ner I
nlet
du
ring
sum
mer
on
inte
rtida
l mud
flats
(Em
ison
et
al. 1
987)
. Unl
ikel
y to
be
at ri
sk o
f rot
or s
trike
due
to
spe
cific
hab
itat r
equi
rem
ents
that
rest
rict t
he
spec
ies
dist
ribut
ion
to in
terti
dal a
reas
.
Ruf
f (R
eeve
) P
hilo
mac
hus
pugn
axM
i/Ma
Nil
No
reco
rds
from
are
a M
inim
al
Min
imal
Lo
w
Neg
ligib
le
No
reco
rds
from
Gip
psla
nd (A
VW
, Bar
rett
et a
l. 20
03, H
iggi
ns a
nd D
avie
s 19
96).
Red
Kno
t, K
not
Cal
idris
can
utus
M
i/Ma
Num
erou
sre
cord
s fro
m
And
erso
n’s,
Cor
ner a
nd
Sha
llow
Inle
t, an
d Ja
ck
Sm
ith’s
Lak
e.
Year
roun
d,
prin
cipa
lly
sum
mer
but
no
n-br
eede
rs
may
rem
ain
over
win
ter.
Low
2
- 10%
M
ediu
m
Low
Thou
sand
s of
bird
s (7
,110
Wat
kins
(199
3))
regu
larly
occ
ur o
n in
terti
dal m
udfla
ts o
n C
orne
r an
d S
hallo
w In
let.
Sm
all f
lock
s irr
egul
arly
occ
ur
else
whe
re (E
mis
on e
t al.
1987
). D
urin
g hi
gh ti
de
they
may
mov
e to
nea
rby
lake
s, la
goon
s or
flo
odw
ater
s to
con
tinue
feed
ing,
alth
ough
they
us
ually
roos
t with
oth
er w
ader
s on
spi
ts a
nd is
lets
(E
mis
on e
t al.
1987
). U
nlik
ely
to b
e at
risk
of r
otor
st
rike
due
to s
peci
fic h
abita
t req
uire
men
ts th
at
rest
rict t
he s
peci
es d
istri
butio
n to
inte
rtida
l are
as.
Cur
lew
Sa
ndpi
per
Cal
idris
ferr
ugin
ea
Mi/M
a
Num
erou
sre
cord
s fro
m
And
erso
n’s,
Cor
ner a
nd
Sha
llow
Inle
t, an
d Ja
ck
Sm
ith’s
Lak
e.
Year
roun
d,
prin
cipa
lly
sum
mer
but
no
n-br
eede
rs
may
rem
ain
over
win
ter.
Low
2
- 10%
Lo
w
Neg
ligib
le
Thou
sand
s of
bird
s (9
,068
Wat
kins
(199
3)) o
ccur
at
Cor
ner a
nd S
hallo
w In
let,
with
con
greg
atio
ns
also
reco
rded
at J
ack
Sm
ith’s
Lak
e an
d A
nder
son’
s In
let (
Em
ison
et a
l. 19
87, H
iggi
ns a
nd
Dav
ies
1996
) whe
re th
ey fo
rage
on
inte
rtida
l m
udfla
ts. O
ccas
iona
lly fo
rage
am
ong
low
em
erge
nt v
eget
atio
n or
from
wet
pas
ture
s (E
mis
on
et a
l. 19
87).
Unl
ikel
y to
be
at ri
sk o
f rot
or s
trike
du
e to
spe
cific
hab
itat r
equi
rem
ents
that
rest
rict
the
spec
ies
dist
ribut
ion
mai
nly
to in
terti
dal a
reas
.

Ris
k to
sel
ect E
PBC
spe
cies
of t
urbi
ne c
ollis
ions
at G
ipps
land
win
d fa
rms–
Dec
200
5
BIOSIS
RE
SE
AR
CH
Res
ults
14
Com
mon
Nam
e Sc
ient
ific
Nam
e EP
BC
Act
lis
ting
Gip
psla
nd
AVW
reco
rds
Seas
on a
nd
dura
tion
of
risk
Like
lihoo
d of
po
rtio
n of
po
pula
tion
enco
unte
ring
curr
ent o
r pr
opos
ed w
ind
farm
s (M
inim
al
/ Low
/ M
ediu
m
/ Hig
h)
Estim
ated
por
tion
of A
ustr
alia
n po
pula
tion
with
po
tent
ial t
o en
coun
ter c
urre
nt
or p
ropo
sed
win
d fa
rms
( Min
imal
/ <2
% /
2 - 1
0% /
11 -
50%
/ 51
- 10
0% )
Like
lihoo
d of
sp
ecie
s'be
havi
our
posi
ng c
ollis
ion
risk
if/w
hen
enco
unte
rs w
ith
win
d fa
rms
occu
r (Lo
w /
Med
ium
/ H
igh)
RES
ULT
AN
T O
VER
ALL
LI
KEL
Y LE
VEL
OF
IMPA
CT
ON
A
UST
RA
LIA
N
POPU
LATI
ON
O
F SP
ECIE
S (N
eglig
ible
/ Lo
w /
Med
ium
/ H
igh)
Not
es
Pect
oral
Sand
pipe
r C
alid
ris m
elan
otos
M
i/Ma
Nil
No
reco
rds
from
are
a M
inim
alM
inim
alLo
w
Neg
ligib
le
No
reco
rds
from
Gip
psla
nd (A
VW
, Bar
rett
et a
l.20
03, H
iggi
ns a
nd D
avie
s 19
96).
Red
-nec
ked
Stin
tC
alid
ris ru
ficol
lis
Mi/M
a
Num
erou
sre
cord
s fro
m
And
erso
n’s,
Cor
ner a
nd
Sha
llow
Inle
t, an
d Ja
ck
Sm
ith’s
Lak
e.
Year
roun
d,
prin
cipa
lly
sum
mer
but
no
n-br
eede
rs
may
rem
ain
over
win
ter.
Low
11
- 50
%
Low
N
eglig
ible
Thou
sand
s ar
e re
cord
ed re
gula
rly a
long
coa
stal
S
th G
ipps
land
. 500
0 ha
ve b
een
reco
rded
at
And
erso
n’s
Inle
t and
203
38 a
t Cor
ner a
nd S
hallo
w
Inle
t (W
atki
ns 1
993)
whe
re th
ey fo
rage
on
inte
rtida
l mud
flats
. Dur
ing
high
tide
they
may
mov
e to
nea
rby
lake
s, la
goon
s or
floo
dwat
ers
to
cont
inue
feed
ing,
alth
ough
they
usu
ally
roos
t with
ot
her w
ader
s on
spi
ts a
nd is
lets
(Em
ison
et a
l.19
87).
Unl
ikel
y to
be
at ri
sk o
f rot
or s
trike
due
to
spec
ific
habi
tat r
equi
rem
ents
that
rest
rict t
he
spec
ies
dist
ribut
ion
mai
nly
to in
terti
dal a
reas
.
Long
-toed
Stin
t C
alid
ris s
ubm
inut
a M
i/Ma
Nil
No
reco
rds
from
are
a M
inim
al
Min
imal
Lo
w
Neg
ligib
le
No
reco
rds
from
Sth
Gip
psla
nd (A
VW
, Bar
rett
etal
. 200
3, H
iggi
ns a
nd D
avie
s 19
96).
Gre
at K
not
Cal
idris
te
nuiro
stris
Mi/M
a
Sca
ttere
dre
cord
s fro
m
Cor
ner a
nd
Sha
llow
Inle
t, an
d Ja
ck
Sm
ith’s
Lak
e.
Sum
mer
,so
me
non-
bree
ders
may
re
mai
n ov
er
win
ter.
Low
2
- 10%
Lo
w
Neg
ligib
le
Floc
ks o
ccur
regu
larly
at i
nter
tidal
mud
flats
on
Cor
ner I
nlet
(Em
ison
et a
l. 19
87, H
iggi
ns a
nd
Dav
ies
1996
). S
mal
ler f
lock
s ar
e re
gula
rly
reco
rded
els
ewhe
re a
long
the
Sth
Gip
psla
nd
coas
t. U
nlik
ely
to b
e at
risk
of r
otor
stri
ke d
ue to
sp
ecifi
c ha
bita
t req
uire
men
ts th
at re
stric
t the
sp
ecie
s di
strib
utio
n m
ainl
y to
inte
rtida
l are
as.

Ris
k to
sel
ect E
PBC
spe
cies
of t
urbi
ne c
ollis
ions
at G
ipps
land
win
d fa
rms–
Dec
200
5
BIOSIS
RE
SE
AR
CH
Res
ults
15
Com
mon
Nam
e Sc
ient
ific
Nam
e EP
BC
Act
lis
ting
Gip
psla
nd
AVW
reco
rds
Seas
on a
nd
dura
tion
of
risk
Like
lihoo
d of
po
rtio
n of
po
pula
tion
enco
unte
ring
curr
ent o
r pr
opos
ed w
ind
farm
s (M
inim
al
/ Low
/ M
ediu
m
/ Hig
h)
Estim
ated
por
tion
of A
ustr
alia
n po
pula
tion
with
po
tent
ial t
o en
coun
ter c
urre
nt
or p
ropo
sed
win
d fa
rms
( Min
imal
/ <2
% /
2 - 1
0% /
11 -
50%
/ 51
- 10
0% )
Like
lihoo
d of
sp
ecie
s'be
havi
our
posi
ng c
ollis
ion
risk
if/w
hen
enco
unte
rs w
ith
win
d fa
rms
occu
r (Lo
w /
Med
ium
/ H
igh)
RES
ULT
AN
T O
VER
ALL
LI
KEL
Y LE
VEL
OF
IMPA
CT
ON
A
UST
RA
LIA
N
POPU
LATI
ON
O
F SP
ECIE
S (N
eglig
ible
/ Lo
w /
Med
ium
/ H
igh)
Not
es
Lath
am's
Sni
pe,
Japa
nese
Sni
pe G
allin
ago
hard
wic
kii
Mi/M
a
Sca
ttere
dre
cord
s fro
m
acro
ss
Gip
psla
nd.
Sum
mer
Med
ium
<2%
Low
Lo
w
Occ
ur in
a w
ide
varie
ty o
f per
man
ent a
nd
ephe
mer
al w
etla
nds
with
nea
rby
cove
r (H
iggi
ns
and
Dav
ies
1996
). W
ides
prea
d th
roug
hout
mos
t of
Vic
toria
, with
onl
y sc
atte
red
reco
rds
from
Sth
G
ipps
land
(AV
W).
Pot
entia
l for
roto
r stri
ke a
t win
d fa
rms
with
in c
lose
pro
xim
ity to
sui
tabl
e w
etla
nd
habi
tats
. Has
bee
n re
cord
ed a
t Bal
d H
ills
win
d fa
rm (B
rett
Lane
& A
ssoc
. 200
3).
Gre
y Pl
over
P
luvi
alis
sq
uata
rola
Mi/M
a
Num
erou
sre
cord
s fro
m
Cor
ner I
nlet
to
Jack
Sm
ith’s
La
ke a
nd
som
e fro
m
And
erso
n’s
Inle
t.
Sum
mer
,so
me
non-
bree
ders
may
re
mai
n ov
er
win
ter.
Low
2
- 10%
Lo
w
Neg
ligib
le
Alm
ost e
ntire
ly a
ssoc
iate
d w
ith c
oast
al h
abita
ts,
but o
ccas
iona
lly re
cord
ed o
n in
land
wet
land
s (M
arch
ant a
nd H
iggi
ns 1
993)
. M
ost n
umer
ous
on
inte
rtida
l mud
flats
, par
ticul
arly
in C
orne
r inl
et (o
ver
400
bird
s) (E
mis
on e
t al.
1987
). W
atki
ns (1
993)
re
port
900
bird
s fro
m C
orne
r and
Sha
llow
Inle
t in
sum
mer
198
7. U
nlik
ely
to b
e at
risk
of r
otor
stri
ke
due
to s
peci
fic h
abita
t req
uire
men
ts th
at re
stric
t th
e sp
ecie
s di
strib
utio
n m
ostly
to in
terti
dal a
reas
.
Rud
dy
Turn
ston
e A
rena
ria in
terp
res
Mi/M
a
Num
erou
sre
cord
s fro
m
Cor
ner I
nlet
to
Jack
Sm
ith’s
La
ke a
nd
som
e fro
m
And
erso
n’s
Inle
t.
Sum
mer
,so
me
non-
bree
ders
may
re
mai
n ov
er
win
ter.
Low
<2
%
Low
N
eglig
ible
Dur
ing
sum
mer
, sm
all f
lock
s (u
p to
100
bird
s) (1
61
repo
rted
on C
orne
r and
Sha
llow
Inle
t in
sum
mer
19
87 b
y W
atki
ns (1
993)
) occ
ur re
gula
rly o
n ro
cky
coas
ts w
ith a
djac
ent i
nter
tidal
mud
flats
and
on
beac
hes
with
rock
pla
tform
s ex
pose
d at
low
tide
(E
mis
onet
al.
1987
). U
nlik
ely
to b
e at
risk
of r
otor
st
rike
due
to s
peci
fic h
abita
t req
uire
men
ts th
at
rest
rict t
he s
peci
es d
istri
butio
n m
ostly
to in
terti
dal
area
s.

Ris
k to
sel
ect E
PBC
spe
cies
of t
urbi
ne c
ollis
ions
at G
ipps
land
win
d fa
rms–
Dec
200
5
BIOSIS
RE
SE
AR
CH
Res
ults
16
Com
mon
Nam
e Sc
ient
ific
Nam
e EP
BC
Act
lis
ting
Gip
psla
nd
AVW
reco
rds
Seas
on a
nd
dura
tion
of
risk
Like
lihoo
d of
po
rtio
n of
po
pula
tion
enco
unte
ring
curr
ent o
r pr
opos
ed w
ind
farm
s (M
inim
al
/ Low
/ M
ediu
m
/ Hig
h)
Estim
ated
por
tion
of A
ustr
alia
n po
pula
tion
with
po
tent
ial t
o en
coun
ter c
urre
nt
or p
ropo
sed
win
d fa
rms
( Min
imal
/ <2
% /
2 - 1
0% /
11 -
50%
/ 51
- 10
0% )
Like
lihoo
d of
sp
ecie
s'be
havi
our
posi
ng c
ollis
ion
risk
if/w
hen
enco
unte
rs w
ith
win
d fa
rms
occu
r (Lo
w /
Med
ium
/ H
igh)
RES
ULT
AN
T O
VER
ALL
LI
KEL
Y LE
VEL
OF
IMPA
CT
ON
A
UST
RA
LIA
N
POPU
LATI
ON
O
F SP
ECIE
S (N
eglig
ible
/ Lo
w /
Med
ium
/ H
igh)
Not
es
Shar
p-ta
iled
Sand
pipe
r C
alid
ris a
cum
inat
a M
i/Ma
Num
erou
sre
cord
s fro
m
And
erso
n’s
Inle
t, sc
atte
red
reco
rds
from
C
orne
r Inl
et to
Ja
ck S
mith
’s
Lake
.
Sum
mer
Med
ium
2 - 1
0%
Med
ium
Low
Floc
ks o
f hun
dred
s or
thou
sand
s (W
atki
ns (1
993)
re
ports
253
0 bi
rds
in A
nder
son’
s In
let)
occu
r in
shal
low
fres
hwat
er o
r sal
ine
swam
ps w
ith
scat
tere
d, lo
w, e
mer
gent
veg
etat
ion,
esp
ecia
lly
thos
e w
ith w
et m
uddy
mar
gins
. The
y al
so e
xplo
it te
mpo
rary
floo
dwat
ers,
incl
udin
g flo
oded
sa
ltmar
shes
, sal
twor
ks a
nd s
ewag
e la
goon
s (E
mis
onet
al.
1987
, Hig
gins
and
Dav
ies
1996
). O
n in
terti
dal m
udfla
ts th
ey o
nly
occu
r whe
re th
ere
are
near
by h
abita
ts th
at a
re s
uita
ble
for f
eedi
ng a
t hig
h tid
e (E
mis
on e
t al.
1987
). P
oten
tial f
or ro
tor s
trike
at
win
d fa
rms
with
in c
lose
pro
xim
ity to
sui
tabl
e no
n-co
asta
l wet
land
hab
itats
prim
arily
at h
igh
tide.
Sand
erlin
g C
alid
ris a
lba
Mi
Som
e re
cord
s fro
mA
nder
son’
sIn
let,
San
dy
Poi
nt a
nd
num
erou
ssc
atte
red
reco
rds
from
C
orne
r and
S
hallo
w In
let.
Sum
mer
,so
me
non-
bree
ders
may
re
mai
n ov
er
win
ter.
Low
<2
%
Low
N
eglig
ible
Floc
ks o
ccur
on
sand
y oc
ean
beac
hes,
with
re
gula
r pop
ulat
ions
of a
few
hun
dred
bird
s (3
21
betw
een
1981
-85
(Wat
kins
199
3)) a
t Cor
ner a
nd
Sha
llow
Inle
ts a
nd W
ilson
’s P
rom
onto
ry (E
mis
on
et a
l. 19
87, H
iggi
ns a
nd D
avie
s 19
96).
Rar
ely
reco
rded
in n
ear-
coas
tal w
etla
nds
(Hig
gins
and
D
avie
s 19
96).
Unl
ikel
y to
be
at ri
sk o
f rot
or s
trike
du
e to
spe
cific
hab
itat r
equi
rem
ents
that
rest
rict
the
spec
ies
dist
ribut
ion
mos
tly to
coa
stal
are
as.
Gre
ater
San
d Pl
over
, Lar
ge
Sand
Plo
ver
Cha
radr
ius
lesc
hena
ultii
Mi/M
aS
catte
red
reco
rds
from
S
hallo
w In
let.
Sum
mer
,so
me
non-
bree
ders
may
re
mai
n ov
er
win
ter.
Low
<2
%
Low
N
eglig
ible
Sm
all n
umbe
rs o
f bird
s re
gula
rly o
ccur
on
inte
rtida
l m
udfla
ts in
Cor
ner I
nlet
(Em
ison
et a
l. 19
87).
Alm
ost e
ntire
ly c
oast
al, i
n lit
tora
l and
est
uarin
e ha
bita
ts (
Mar
chan
t and
Hig
gins
199
3). U
nlik
ely
to
be a
t ris
k of
roto
r stri
ke d
ue to
spe
cific
hab
itat
requ
irem
ents
that
rest
rict t
he s
peci
es d
istri
butio
n m
ostly
to c
oast
al a
reas
.

Ris
k to
sel
ect E
PBC
spe
cies
of t
urbi
ne c
ollis
ions
at G
ipps
land
win
d fa
rms–
Dec
200
5
BIOSIS
RE
SE
AR
CH
Res
ults
17
Com
mon
Nam
e Sc
ient
ific
Nam
e EP
BC
Act
lis
ting
Gip
psla
nd
AVW
reco
rds
Seas
on a
nd
dura
tion
of
risk
Like
lihoo
d of
po
rtio
n of
po
pula
tion
enco
unte
ring
curr
ent o
r pr
opos
ed w
ind
farm
s (M
inim
al
/ Low
/ M
ediu
m
/ Hig
h)
Estim
ated
por
tion
of A
ustr
alia
n po
pula
tion
with
po
tent
ial t
o en
coun
ter c
urre
nt
or p
ropo
sed
win
d fa
rms
( Min
imal
/ <2
% /
2 - 1
0% /
11 -
50%
/ 51
- 10
0% )
Like
lihoo
d of
sp
ecie
s'be
havi
our
posi
ng c
ollis
ion
risk
if/w
hen
enco
unte
rs w
ith
win
d fa
rms
occu
r (Lo
w /
Med
ium
/ H
igh)
RES
ULT
AN
T O
VER
ALL
LI
KEL
Y LE
VEL
OF
IMPA
CT
ON
A
UST
RA
LIA
N
POPU
LATI
ON
O
F SP
ECIE
S (N
eglig
ible
/ Lo
w /
Med
ium
/ H
igh)
Not
es
Less
er S
and
Plov
er,
Mon
golia
n Pl
over
Cha
radr
ius
mon
golu
s M
i/Ma
Rec
ords
from
A
nder
son’
s,C
orne
r and
S
hallo
w In
let.
Sum
mer
,so
me
non-
bree
ders
may
re
mai
n ov
er
win
ter i
n P
t P
hilli
p B
ay.
Low
<2
%Lo
w
Neg
ligib
le
Alm
ost e
ntire
ly c
oast
al, i
n lit
tora
l and
est
uarin
e ha
bita
ts (
Mar
chan
t and
Hig
gins
199
3). F
lock
s of
up
to 5
0 bi
rds
regu
larly
occ
ur o
n in
terti
dal m
udfla
ts
on C
orne
r inl
et (E
mis
on e
t al.
1987
). U
nlik
ely
to b
e at
risk
of r
otor
stri
ke d
ue to
spe
cific
hab
itat
requ
irem
ents
that
rest
rict t
he s
peci
es d
istri
butio
n to
inte
rtida
l are
as.
Orie
ntal
Plo
ver,
Orie
ntal
D
otte
rel
Cha
radr
ius
vere
dus
Mi/M
a N
il S
umm
er
Low
<2
%
Low
N
eglig
ible
O
nly
one
reco
rd o
f 53
bird
s fro
m J
ack
Sm
ith’s
La
ke in
198
3 du
ring
drou
ght (
Em
ison
et a
l. 19
87).
App
ears
to b
e ab
sent
or v
agra
nt to
Sth
Gip
psla
nd.
Dou
ble-
band
ed
Plov
er
Cha
radr
ius
bici
nctu
sM
i/Ma
Num
erou
sre
cord
s fro
m
muc
h of
co
asta
l Sth
G
ipps
land
.
Win
ter,
ver
y fe
w n
on-
bree
ders
may
re
mai
n ov
er
sum
mer
.
Med
ium
2
- 10%
M
ediu
m
Low
Inha
bit l
ittor
al, e
stua
rine
and
fresh
or s
alin
e te
rres
trial
wet
land
s; a
lso
saltm
arsh
, gra
ssla
nds
and
past
ure
(Mar
chan
t and
Hig
gins
199
3). F
lock
s of
up
to 5
50 a
nd 8
00 h
ave
been
reco
rded
at
And
erso
n’s,
Cor
ner/
Sha
llow
Inle
ts re
spec
tivel
y (W
atki
ns 1
993)
. Pot
entia
l for
roto
r stri
ke a
t win
d fa
rms
with
in c
lose
pro
xim
ity to
sui
tabl
e no
n-co
asta
l ha
bita
ts ie
: ran
k pa
stur
e.
Paci
fic G
olde
n Pl
over
P
luvi
alis
fulv
a M
i/Ma
Rec
ords
from
A
nder
son’
sIn
let,
San
dy
Poi
nt a
nd
num
erou
ssc
atte
red
reco
rds
from
C
orne
r and
S
hallo
w In
let.
Sum
mer
Lo
w
2 - 1
0%
Med
ium
Lo
w
Inha
bits
san
dy, r
ocky
or m
uddy
sho
res,
est
uarie
s an
d la
goon
s, re
efs,
sal
tmar
sh a
nd s
hort
gras
s in
pa
ddoc
ks a
nd c
rops
. Usu
ally
coa
stal
, inc
ludi
ng
offs
hore
isla
nds;
rare
ly fa
r inl
and
(Mar
chan
t and
H
iggi
ns 1
993)
. Wat
kins
(199
3) re
ports
251
bird
s at
A
nder
son
Inle
t an
d 30
3 bi
rds
at C
orne
r and
S
hallo
w In
let.
Pot
entia
l for
roto
r stri
ke a
t win
d fa
rms
with
in c
lose
pro
xim
ity to
sui
tabl
e no
n-co
asta
l ha
bita
ts ie
: wet
pas
ture
.

Ris
k to
sel
ect E
PBC
spe
cies
of t
urbi
ne c
ollis
ions
at G
ipps
land
win
d fa
rms–
Dec
200
5
BIOSIS
RE
SE
AR
CH
Res
ults
18
Com
mon
Nam
e Sc
ient
ific
Nam
e EP
BC
Act
lis
ting
Gip
psla
nd
AVW
reco
rds
Seas
on a
nd
dura
tion
of
risk
Like
lihoo
d of
po
rtio
n of
po
pula
tion
enco
unte
ring
curr
ent o
r pr
opos
ed w
ind
farm
s (M
inim
al
/ Low
/ M
ediu
m
/ Hig
h)
Estim
ated
por
tion
of A
ustr
alia
n po
pula
tion
with
po
tent
ial t
o en
coun
ter c
urre
nt
or p
ropo
sed
win
d fa
rms
( Min
imal
/ <2
% /
2 - 1
0% /
11 -
50%
/ 51
- 10
0% )
Like
lihoo
d of
sp
ecie
s'be
havi
our
posi
ng c
ollis
ion
risk
if/w
hen
enco
unte
rs w
ith
win
d fa
rms
occu
r (Lo
w /
Med
ium
/ H
igh)
RES
ULT
AN
T O
VER
ALL
LI
KEL
Y LE
VEL
OF
IMPA
CT
ON
A
UST
RA
LIA
N
POPU
LATI
ON
O
F SP
ECIE
S (N
eglig
ible
/ Lo
w /
Med
ium
/ H
igh)
Not
es
Tere
kSa
ndpi
per
Xen
us c
iner
eus
Mi/M
a
Rec
ords
from
A
nder
son’
sIn
let a
nd
Cor
ner a
nd
Sha
llow
Inle
t.
Sum
mer
Low
<2
%Lo
w
Neg
ligib
le
Sm
all n
umbe
rs (u
p to
ten
bird
s) o
ccur
on
inte
rtida
l m
udfla
ts in
Cor
ner I
nlet
. Th
ey fo
rage
on
m
angr
ove-
lined
mud
flats
and
roos
t on
spits
, isl
ets
or m
angr
oves
(Em
ison
et a
l. 19
87).
Unl
ikel
y to
be
at ri
sk o
f rot
or s
trike
due
to s
peci
fic h
abita
t re
quire
men
ts th
at re
stric
t the
spe
cies
dis
tribu
tion
to in
terti
dal a
reas
.
Com
mon
Sa
ndpi
per
Act
itis
hypo
leuc
os
Mi/M
aA
few
reco
rds
from
coa
stal
S
th G
ipps
land
.S
umm
er
Low
2
- 10%
M
ediu
m
Low
Hab
itat i
nclu
des
a w
ide
rang
e of
coa
stal
or i
nlan
d w
etla
nds,
with
var
ying
leve
ls o
f sal
inity
. Mai
nly
mud
dy m
argi
ns o
r roc
ky s
hore
s of
wet
land
s,
estu
arie
s, s
tream
del
tas
as w
ell a
s ba
nks
furth
er
upst
ream
form
mud
flats
(Hig
gins
and
Dav
ies
1996
, E
mis
onet
al.
1987
). P
oten
tial f
or ro
tor s
trike
at
win
d fa
rms
with
in c
lose
pro
xim
ity to
sui
tabl
e ha
bita
ts ie
: ups
tream
from
mud
flats
.
Gre
y-ta
iled
Tattl
er
Het
eros
celu
s br
evip
esM
i/Ma
A fe
w re
cord
s fro
m C
orne
r an
d S
hallo
w
Inle
ts.
Sum
mer
Lo
w
<2%
Lo
w
Neg
ligib
le
Inha
bits
she
ltere
d co
asts
with
reef
s an
d ro
ck
plat
form
s or
with
inte
rtida
l mud
flats
. Rar
ely
reco
rded
in G
ipps
land
(Hig
gins
and
Dav
ies
1996
). S
mal
l flo
cks
(up
to 4
0 bi
rds)
gat
her r
egul
arly
in
sum
mer
in C
orne
r Inl
et (E
mis
on e
t al.
1987
). U
nlik
ely
to b
e at
risk
of r
otor
stri
ke d
ue to
spe
cific
ha
bita
t req
uire
men
ts th
at re
stric
t the
spe
cies
di
strib
utio
n to
inte
rtida
l are
as.

Risk to select EPBC species of turbine collisions at Gippsland wind farms– Dec 2005
B I O S I S R E S E A R C H Conclusion 19
4.0 CONCLUSIONWe have assessed likely impacts on thirty-four species that might result from collisions with turbines at current and proposed wind farms in Gippsland. Using a matrix of criteria to determine likely levels of impacts, we conclude that impacts are likely to be low for twelve species and negligible for twenty-two of them.
Results are due to a variety of species-specific factors. For many of the species, the likelihood of any part of their populations interacting with wind turbines is low as a result of the location of the wind farms relative to their required habitats. For the majority of them, even those that might move through the wind farms, we also consider it most probable that only a very small portion of their total Australian populations would ever do so. The known behaviours of most suggest that they would also actively avoid collisions or do not frequently fly in the zone swept by turbine rotors.
IN COMBINATION, THESE FACTORS DRAW US TO THE CONCLUSION THAT COLLISIONS WITH WIND TURBINES POSE LITTLE RISK TO THE MAJORITY OF THE THIRTY-FOUR SPECIES EVALUATED HERE.

Risk to select EPBC species of turbine collisions at Gippsland wind farms– Dec 2005
B I O S I S R E S E A R C H References 20
REFERENCESBarrett, B., Silcocks, A., Barry, S., Cunningham, R. & Poulter, R. 2003. TheNew Atlas of Australian Birds. RAOU.
Brett Lane and Assoc. 2003a. Bald Hills Windfarm Flora, Fauna and Avian Assessment. Report for Wind Power Pty. Ltd.
Brett Lane and Assoc. 2003b. Bald Hills Windfarm Flora, Fauna and Avian Assessment Errata. Report for Wind Power Pty. Ltd.
Brett Lane and Assoc. 2005. Wonthaggi Wind Farm Bird and Bat Management Plan. Report for Wind Power Pty. Ltd.
Duncan, A., Baker, G. B. & Montgomery, N. 1999. The Action Plan for Australian Bats. Environment Australia, Canberra.
Emison, W.B., C.M. Beardsell, F.I. Norman, R.H. Loyn & S.C. Bennett. 1987. Atlas of Victorian Birds. Melbourne: Dept. Cons. Forests Lands and RAOU.
Higgins, P.J. (Ed.) 1990. Handbook of Australian, New Zealand & Antarctic Birds. Volume 4: Parrots to Dollardbird.Oxford University Press, Melbourne.
Higgins, P.J., & S.J.J.F. Davies. (Eds) 1996. Handbook of Australian, New Zealand & Antarctic Birds. Volume 3: Snipe to Pigeons. Oxford University Press, Melbourne.
Marchant, S. & Higgins, P.J. 1990. Handbook of Australian, New Zealand & Antarctic Birds. Volume 1: Ratites to Ducks. Oxford University Press, Melbourne.
Marchant, S. & Higgins, P.J. 1993. Handbook of Australian, New Zealand & Antarctic Birds. Volume 2: Raptors to Lapwings. Oxford University Press, Melbourne.
Menkhorst, P. W. (Ed.) 1995. Mammalsof Victoria: Distribution, Ecology and Conservation. Oxford University Press, Melbourne.
Organ, A. & Meredith, C. 2004a Avifauna Monitoring Survey – Summer 2002, Summer, Autumn and Spring 2003 Dollar Wind Farm. Biosis Research Pty. Ltd. report for Dollar Wind Farm Pty. Ltd.
Organ, A. & Meredith, C. 2004b. 2004 Avifauna Monitoring for the proposed Dollar Wind Farm – Updated Risk Modelling. Biosis Research Pty. Ltd. report for Dollar Wind Farm Pty. Ltd.
Smales, I., Meredith, C. & McCarthy, M. 2004. Stochastic modelling of the potential impacts on the Orange-bellied Parrot of a proposed wind farm at Heemskirk, Tasmania. Biosis Research Pty. Ltd. report to Hydro Tasmania.
Watkins, D. 1993. A National Plan for shorebird conservation in Australia.Australian Wader Studies Group, Royal Australasian Ornithologists Union and World Wide Fund for Nature Report No. 90

Appendix - Wind farms within species distribution zones

Ora
nge-
belli
edPa
rrot
Dis
trib
utio
n
Butc
hers
Gap
Long
Beac
h
Nor
aC
rein
a
Can
unda
NP
Car
pent
erR
ocks
8M
ileC
reek
Hom
este
ad
Picc
anin
nie
Pond
s
Nob
leR
ocks
Yam
buk
Estu
ary
Rut
ledg
esC
uttin
g
Lake
Gille
ar
Nel
son
Estu
ary
PtLi
llias
-Ava
lon
Brea
mle
a
Lake
Con
new
arre
Lake
Vict
oria
Swan
Bay
PtC
ook
Wes
tern
Trea
tmen
tPla
nt
PtSm
ythe
Pow
lett
Riv
er
Tank
erto
n
Nor
thFr
ench
Isla
nd
Stok
esPo
int
Sea
Elep
hant
Lago
on
Hen
tyR
iver
Birc
hsIn
let
Nye
Bay
Tow
tere
rCre
ek
Noy
hene
rBea
ch
Kelly
Basi
n
StKi
lda
Salt
Fiel
ds
Mel
aleu
ca
Cur
rie
Bald
Hea
d
Sand
yC
ape
Bluf
fHill
Pt
Wes
tPt
Hun
terI
slan
d
PtW
ilson
Told
erol
Gam
eR
eser
ve
Hin
dmar
shIs
land
Youn
ghus
band
Peni
nsul
a
Coo
rong
NP
Chi
nam
anC
reek
Com
eron
gIs
land
Mar
oubr
a
Shel
lhar
bour
Nor
thw
estT
asm
ania
100
010
020
030
050
kilo
mtre
s
±
DR
AFT
ON
LY14
June
2005
This
isa
prel
imin
ary
dist
ribut
ion
map
fort
heO
rang
e-be
llied
Par
rotN
eoph
ema
chry
soga
ster
com
pile
dby
the
Ora
nge-
bellie
dP
arro
tRec
over
yTe
am.T
his
isa
draf
tmap
subj
ectt
och
ange
.
Cav
eat:
The
info
rmat
ion
pres
ente
din
this
map
has
been
prov
ided
bya
rang
eof
grou
psan
dag
enci
es.W
hile
ever
yef
fort
has
been
mad
eto
ensu
reac
cura
cyan
dco
mpl
eten
ess,
nogu
aran
tee
isgi
ven,
norr
espo
nsib
ility
take
nby
the
Com
mon
wea
lthfo
rerro
rsor
omis
sion
s,an
dth
eC
omm
onw
ealth
does
nota
ccep
tres
pons
ibilit
yin
resp
ecto
fany
info
rmat
ion
orad
vice
give
nin
rela
tion
to,o
ras
aco
nseq
uenc
eof
,any
thin
gco
ntai
ned
here
in.T
hem
apha
sbe
enco
llate
dfro
ma
rang
eof
sour
ces,
with
data
atva
rious
reso
lutio
ns.D
ata
are
assu
med
tobe
corre
ctas
rece
ived
byth
eda
tasu
pplie
rs.
Prod
uced
by:
ERIN
,Dep
artm
ento
fthe
Envi
ronm
enta
ndH
erita
geC
anbe
rraJu
ne20
05C
OPY
RIG
HT
Com
mon
wea
lthof
Aust
ralia
,200
5
Proj
ectio
n:G
eogr
aphi
cSp
hero
id:
Aust
ralia
nN
atio
nal
Dat
um:
Aust
ralia
nG
eode
tic19
84
Lege
ndBr
eedi
ngra
nge
Cor
eno
n-br
eedi
ngra
nge
Infre
quen
tnon
-bre
edin
gra
nge
Mig
ratio
nro
ute
Poss
ible
mig
ratio
nro
ute
Sout
hwes
tCor
nerI
nlet
Jack
Smith
Lake
Rob
bins
Isla
nd
Woo
lnor
th

Windfarm locationsBiosis Research Pty. Ltd.
38 Bertie Street(PO Box 489)Port MelbourneVICTORIA 3207
DATE: 23 June 2005Checked by: ISLocation: projects\MRG 4800's\4857\Mapping\4857 general2.wor
File number: 4857Scale: 30 60 90 120 1500
kilometres
CodringtonCodringtonCodringtonCodringtonCodringtonCodringtonCodringtonCodringtonCodrington
NirrandaNirrandaNirrandaNirrandaNirrandaNirrandaNirrandaNirrandaNirranda
Cape Sir William GrantCape Sir William GrantCape Sir William GrantCape Sir William GrantCape Sir William GrantCape Sir William GrantCape Sir William GrantCape Sir William GrantCape Sir William Grant Nirranda SouthNirranda SouthNirranda SouthNirranda SouthNirranda SouthNirranda SouthNirranda SouthNirranda SouthNirranda SouthCape Nelson ParkCape Nelson ParkCape Nelson ParkCape Nelson ParkCape Nelson ParkCape Nelson ParkCape Nelson ParkCape Nelson ParkCape Nelson Park
YambukYambukYambukYambukYambukYambukYambukYambukYambuk
Cape BridgewaterCape BridgewaterCape BridgewaterCape BridgewaterCape BridgewaterCape BridgewaterCape BridgewaterCape BridgewaterCape Bridgewater
KongorongKongorongKongorongKongorongKongorongKongorongKongorongKongorongKongorong
WonthaggiWonthaggiWonthaggiWonthaggiWonthaggiWonthaggiWonthaggiWonthaggiWonthaggi
Lake Bonney stage 2Lake Bonney stage 2Lake Bonney stage 2Lake Bonney stage 2Lake Bonney stage 2Lake Bonney stage 2Lake Bonney stage 2Lake Bonney stage 2Lake Bonney stage 2
Lake Bonney stage 1Lake Bonney stage 1Lake Bonney stage 1Lake Bonney stage 1Lake Bonney stage 1Lake Bonney stage 1Lake Bonney stage 1Lake Bonney stage 1Lake Bonney stage 1
King Island Huxley Hill stage 1/2King Island Huxley Hill stage 1/2King Island Huxley Hill stage 1/2King Island Huxley Hill stage 1/2King Island Huxley Hill stage 1/2King Island Huxley Hill stage 1/2King Island Huxley Hill stage 1/2King Island Huxley Hill stage 1/2King Island Huxley Hill stage 1/2
Woolnorth Lot 2Woolnorth Lot 2Woolnorth Lot 2Woolnorth Lot 2Woolnorth Lot 2Woolnorth Lot 2Woolnorth Lot 2Woolnorth Lot 2Woolnorth Lot 2Jim's PlainJim's PlainJim's PlainJim's PlainJim's PlainJim's PlainJim's PlainJim's PlainJim's Plain
Woolnorth Lot 1Woolnorth Lot 1Woolnorth Lot 1Woolnorth Lot 1Woolnorth Lot 1Woolnorth Lot 1Woolnorth Lot 1Woolnorth Lot 1Woolnorth Lot 1
Bald HillsBald HillsBald HillsBald HillsBald HillsBald HillsBald HillsBald HillsBald Hills
TooraTooraTooraTooraTooraTooraTooraTooraTooraDollarDollarDollarDollarDollarDollarDollarDollarDollar
BreamelaBreamelaBreamelaBreamelaBreamelaBreamelaBreamelaBreamelaBreamela
HeemskirkHeemskirkHeemskirkHeemskirkHeemskirkHeemskirkHeemskirkHeemskirkHeemskirk
CanundaCanundaCanundaCanundaCanundaCanundaCanundaCanundaCanunda
Green PointGreen PointGreen PointGreen PointGreen PointGreen PointGreen PointGreen PointGreen Point
Windfarms in the Orange-bellied Parrot zone

Windfarms in the Tasmanian Wedge-tailed Eagle zone
Figure: Windfarm locationsBiosis Research Pty. Ltd.
38 Bertie Street(PO Box 489)Port MelbourneVICTORIA 3207
DATE: 23 June 2005Checked by: ISLocation: projects\MRG 4800's\4857\Mapping\4857 general2.wor
File number: 4857Scale: 15 30 45 60 750
kilometres
Woolborth Lot 1Woolborth Lot 1Woolborth Lot 1Woolborth Lot 1Woolborth Lot 1Woolborth Lot 1Woolborth Lot 1Woolborth Lot 1Woolborth Lot 1Woolnorth Lot 2Woolnorth Lot 2Woolnorth Lot 2Woolnorth Lot 2Woolnorth Lot 2Woolnorth Lot 2Woolnorth Lot 2Woolnorth Lot 2Woolnorth Lot 2
Jim's PlainJim's PlainJim's PlainJim's PlainJim's PlainJim's PlainJim's PlainJim's PlainJim's Plain
Huxley Hill stage 1/2Huxley Hill stage 1/2Huxley Hill stage 1/2Huxley Hill stage 1/2Huxley Hill stage 1/2Huxley Hill stage 1/2Huxley Hill stage 1/2Huxley Hill stage 1/2Huxley Hill stage 1/2
HeemskirkHeemskirkHeemskirkHeemskirkHeemskirkHeemskirkHeemskirkHeemskirkHeemskirk
MussleroeMussleroeMussleroeMussleroeMussleroeMussleroeMussleroeMussleroeMussleroe
Flinders IslandFlinders IslandFlinders IslandFlinders IslandFlinders IslandFlinders IslandFlinders IslandFlinders IslandFlinders Island

Windfarms in the Swift Parrot zone
Figure 2: Swift Parrot distribution zones and modelled windfarms.Biosis Research Pty. Ltd.
38 Bertie Street(PO Box 489)Port MelbourneVICTORIA 3207
DATE: 18 October 2005Checked by: ISLocation: ...\MRG 5200s\5238\Mapping\5238 Swift Parrot windfarms.wor
File number: 5238Scale: 50 100 150 200 2500
kilometres
Tasmania
South Australia
Victoria
New South Wales
Cape Sir William Grant
Cape Sir William Grant
Cape Sir William Grant
Cape Sir William Grant
Cape Sir William Grant
Cape Sir William Grant
Cape Sir William Grant
Cape Sir William Grant
Cape Sir William Grant
BlayneyBlayneyBlayneyBlayneyBlayneyBlayneyBlayneyBlayneyBlayney
DollarDollarDollarDollarDollarDollarDollarDollarDollar
TooraTooraTooraTooraTooraTooraTooraTooraTooraWonthaggiWonthaggiWonthaggiWonthaggiWonthaggiWonthaggiWonthaggiWonthaggiWonthaggi
Jim's PlainJim's PlainJim's PlainJim's PlainJim's PlainJim's PlainJim's PlainJim's PlainJim's Plain
Woolnorth Lot 1Woolnorth Lot 1Woolnorth Lot 1Woolnorth Lot 1Woolnorth Lot 1Woolnorth Lot 1Woolnorth Lot 1Woolnorth Lot 1Woolnorth Lot 1Woolnorth Stage 3Woolnorth Stage 3Woolnorth Stage 3Woolnorth Stage 3Woolnorth Stage 3Woolnorth Stage 3Woolnorth Stage 3Woolnorth Stage 3Woolnorth Stage 3
NirrandaNirrandaNirrandaNirrandaNirrandaNirrandaNirrandaNirrandaNirranda
Cape Bridgewater
Cape Bridgewater
Cape Bridgewater
Cape Bridgewater
Cape Bridgewater
Cape Bridgewater
Cape Bridgewater
Cape Bridgewater
Cape Bridgewater
Cape Nelson
Cape Nelson
Cape Nelson
Cape Nelson
Cape Nelson
Cape Nelson
Cape Nelson
Cape Nelson
Cape Nelson
Kongorong
Kongorong
Kongorong
Kongorong
Kongorong
Kongorong
Kongorong
Kongorong
Kongorong
Green Point
Green Point
Green Point
Green Point
Green Point
Green Point
Green Point
Green Point
Green PointLake Bonney stage 2
Lake Bonney stage 2
Lake Bonney stage 2
Lake Bonney stage 2
Lake Bonney stage 2
Lake Bonney stage 2
Lake Bonney stage 2
Lake Bonney stage 2
Lake Bonney stage 2
Lake Bonney stage 1
Lake Bonney stage 1
Lake Bonney stage 1
Lake Bonney stage 1
Lake Bonney stage 1
Lake Bonney stage 1
Lake Bonney stage 1
Lake Bonney stage 1
Lake Bonney stage 1
CanundaCanundaCanundaCanunda
CanundaCanundaCanundaCanundaCanunda
Flinders Island 1Flinders Island 1Flinders Island 1Flinders Island 1Flinders Island 1Flinders Island 1Flinders Island 1Flinders Island 1Flinders Island 1Flinders Island 2Flinders Island 2Flinders Island 2Flinders Island 2Flinders Island 2Flinders Island 2Flinders Island 2Flinders Island 2Flinders Island 2
BreamleaBreamleaBreamleaBreamleaBreamleaBreamleaBreamleaBreamleaBreamlea
MussleroeMussleroeMussleroeMussleroeMussleroeMussleroeMussleroeMussleroeMussleroeWoolnorth Lot 2Woolnorth Lot 2Woolnorth Lot 2Woolnorth Lot 2Woolnorth Lot 2Woolnorth Lot 2Woolnorth Lot 2Woolnorth Lot 2Woolnorth Lot 2
King Island Huxley Hill stage 1King Island Huxley Hill stage 1King Island Huxley Hill stage 1King Island Huxley Hill stage 1King Island Huxley Hill stage 1King Island Huxley Hill stage 1King Island Huxley Hill stage 1King Island Huxley Hill stage 1King Island Huxley Hill stage 1
HeemskirkHeemskirkHeemskirkHeemskirkHeemskirkHeemskirkHeemskirkHeemskirkHeemskirk
Bald HillsBald HillsBald HillsBald HillsBald HillsBald HillsBald HillsBald HillsBald HillsNirranda SouthNirranda SouthNirranda SouthNirranda SouthNirranda SouthNirranda SouthNirranda SouthNirranda SouthNirranda South
YaloakYaloakYaloakYaloakYaloakYaloakYaloakYaloakYaloak
CodringtonCodringtonCodringtonCodringtonCodringtonCodringtonCodringtonCodringtonCodringtonYambukYambukYambukYambukYambukYambukYambukYambukYambuk
AuroraAuroraAuroraAuroraAuroraAuroraAuroraAuroraAurora
Challicum HillsChallicum HillsChallicum HillsChallicum HillsChallicum HillsChallicum HillsChallicum HillsChallicum HillsChallicum Hills
CrookwellCrookwellCrookwellCrookwellCrookwellCrookwellCrookwellCrookwellCrookwell
HamptonHamptonHamptonHamptonHamptonHamptonHamptonHamptonHampton
KooragangKooragangKooragangKooragangKooragangKooragangKooragangKooragangKooragang
GunningGunningGunningGunningGunningGunningGunningGunningGunning
Swift Parrot Distribution Zones
ResidentMigrationIncidental
LegendWindfarm location

Windfarms in the White-bellied Sea-Eagle zone
Figu
re 2
: Loc
ation
of w
ind fa
rms a
cros
s the
rang
e of
the
Whit
e-be
llied
Sea-
eagle
Bi
osis
Rese
arch
Pty.
Ltd
.
38 B
ertie
Stre
et(P
O Bo
x 489
)Po
rt Me
lbour
neVI
CTOR
IA 32
07
DATE
: 18
Octob
er 2
005
Chec
ked b
y: IS
Loca
tion:
...\M
RG 5
200s
\523
8\Ma
pping
\523
8 W
BSE
wind
farm
s.wor
File
num
ber:
5238
Scale
:15
030
045
060
075
00
kilom
etre
s
Figu
re 2
: Loc
ation
of w
ind fa
rms a
cros
s the
rang
e o
f the
Whit
e-be
llied
Sea-
eagle
Vic
toria
Tasm
ania
New
Sou
th W
ales
Sout
h Au
stra
lia
Wes
tern
Aus
tralia
Que
ensl
and
Nor
ther
n Te
rrito
ry
Sw
an V
alle
y, W
A
Frem
antle
, WA
Hope
toun,
WA 9 M
ile B
each
, WA
10 M
ile La
goon
, WA
Bre
mer
Bay
, WA
Rot
tnes
t Is,
WA
Mum
bida
stg
1, W
A
Alban
y, W
A
Denm
ark, W
A
Mall
acoo
ta, V
ic
Torto
ise H
ead,
Vic
Pt H
icks
, Vic
Lake
Bon
ney S
tage 2
, SA
Lake
Bon
ney S
tage 1
, SA Ni
rrand
a Sou
th, V
ic
Brea
mlea
, Vic
Won
thagg
i, Vic
Cape
Sir W
illiam
Gra
nt, V
ic
Nirra
nda,
Vic
Kin
g Is
Hux
ley
Hill
Sta
ges
1 &
2, T
as
Cape
Brid
gewa
ter, V
ic
Cape
Nels
on, V
icKo
ngoro
ng, S
A
Canu
nda,
SAYa
mbu
k, Vic
Gree
n Poin
t, SA
Codri
ngton
, Vic
Wait
pinga
, SA
Star
fish H
ill, SA
Trou
bridg
e Poin
t, SA
Cathe
dral R
ocks
, SA
Sheri
nga,
SA
Stud
land
Bay
, Tas
Vince
nt No
rth (S
he O
ak F
lat), S
A
Mypo
nga,
SAW
attle
Point
, SA
Moun
t Milla
r, SA
Tung
etta H
ill & Lo
ch W
ell B
each
, SA
Bluf
f Poi
nt, T
asC
ape
Barre
n Is
, Tas
Den
ham
, WA
Em
u D
owns
, WA
Exm
outh
, WA
Flin
ders
Isla
nd, T
as
Fras
er Is
, Qld
Gab
o Is
, Vic
Hee
msk
irk, T
as
Kem
mis
s H
ill R
oad,
SA
Koor
agan
g, N
SW
Mus
sler
oe, T
as
Nor
th K
eppe
l Is,
Qld
Thur
sday
Is, Q
ld
Toor
a, V
ic
Wal
kaw
ay A
linta
, WA
Wils
ons
Pro
mon
tory
, Vic
Lege
ndW
indf
arm
loca
tion