wind gust analysis in rtma
DESCRIPTION
Wind Gust Analysis in RTMA. Yanqiu Zhu, Geoff DiMego, John Derber, Manuel Pondeca, Geoff Manikin, Russ Treadon, Dave Parrish, Jim Purser. Environmental Modeling Center. National Centers for Environmental Prediction. Real-Time Mesoscale Analysis (RTMA). - PowerPoint PPT PresentationTRANSCRIPT

Wind Gust Analysis in RTMAWind Gust Analysis in RTMA
Yanqiu Zhu, Geoff DiMego, John Derber, Yanqiu Zhu, Geoff DiMego, John Derber, Manuel Pondeca, Geoff Manikin, Russ Treadon, Manuel Pondeca, Geoff Manikin, Russ Treadon,
Dave Parrish, Jim PurserDave Parrish, Jim Purser
Environmental Modeling Center
National Centers for Environmental Prediction

Real-Time Mesoscale Analysis (RTMA)Real-Time Mesoscale Analysis (RTMA)
RTMA is a NOAA-NWS gridded surface analysis system developed at EMC of NCEP in collaboration with the Global Systems Division (GSD)
One of its important applications is to provide a comprehensive set of high spatial and temporal resolution analyses that can be used to monitor potential severe weather events
2DVAR-version of Gridded Statistical Interpolation2DVAR-version of Gridded Statistical Interpolation
Terrain-following anisotropic background error covariances
Background fields for CONUS is generated by downscaling RUC 1h forecasts

Generalizing GSI Control VariablesGeneralizing GSI Control Variables
• RTMA analyses for surface pressure, 10 m wind, 2m temperature and moisture over CONUS on the 5-km NDFD grid
• Enhanced GSI flexibility to add/remove 2D and 3D control variables
• Wind gust was added as a new control variable• A univariate analysis for wind gust
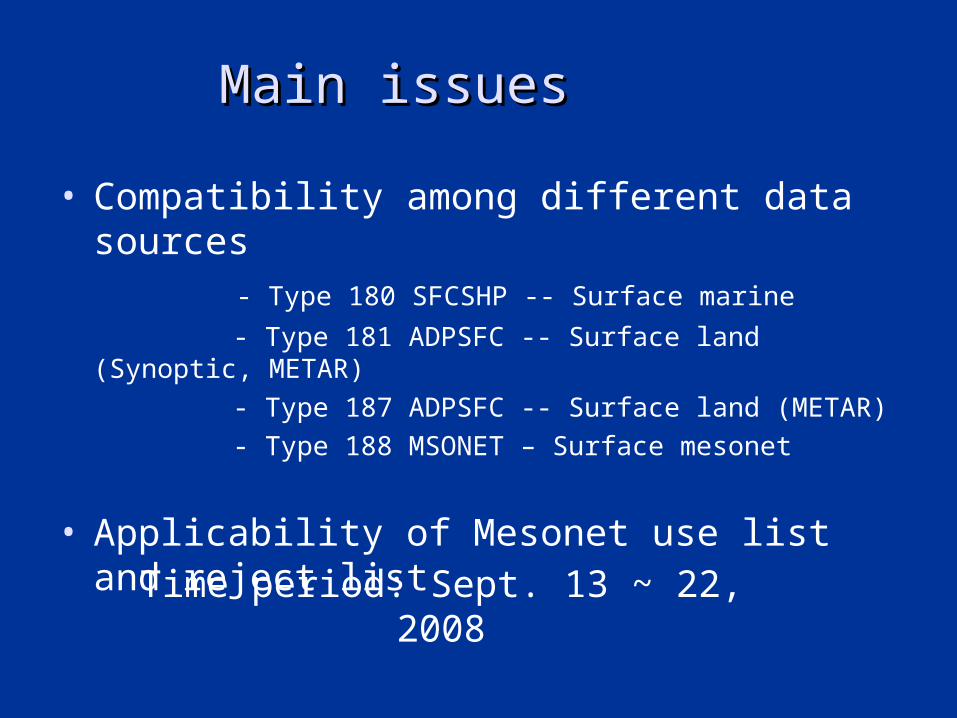
Main issuesMain issues
• Compatibility among different data sources - Type 180 SFCSHP -- Surface marine
- Type 181 ADPSFC -- Surface land (Synoptic, METAR)
- Type 187 ADPSFC -- Surface land (METAR)
- Type 188 MSONET – Surface mesonet
• Applicability of Mesonet use list and reject list
Time period: Sept. 13 ~ 22, 2008

2D-pattern: Bias of O-F

Break-down of mesonet gust data after applying mesonet use & reject lists(Only a total of 43.4% of 1951945 remained)

Gust data handlingGust data handling
• For the observations which were at the same location, the one that was closest to the analysis time was chosen
• Observation error was inflated based on the relative time to the analysis time. Less weight was given to the observations that were far away from the analysis time
• mesonet use list and reject list were applied• Less weight was given to mesonet data that were less
than 7.2m/s • The discrepancy of observation station elevation and
model surface was taken into account• Gust background correlation length was chosen to be
comparable to that of 10m wind

Bias and RMS of QC-ed O-F|O-A
T180 T181 T187 T188
Bias -0.237|-0.069 0.512|0.340 -0.300|-0.096 -1.464|-1.285
RMS 2.258|0.815 3.161|1.141 3.086|1.189 3.020|2.640

Case studyCase study
• A high wind event on Dec. 31, 2008
• Very strong wind across mid-Atlantic as low deepened off east coast
• 19m/s + gusts at DCA, IAD, BWI
• Tree and power line damage

1500Z gust observations

1500Z Guess and Analysis
Guess over-forecasted in
most of the area
Analysis improved gust field, small
scale features were evident

1800Z guess and analysis1800Z guess and analysis

ConclusionsConclusions• Wind gust speed was added as a new control variable• Gust data from various data sources were examined and
assimilated for an arbitrary time period• Surface marine gust data showed reasonable good O-F bias• METAR and strong mesonet gust data exhibited a pattern
with negative bias over eastern regions except Florida and positive bias over western regions, while weak mesonet gust data had a significant negative bias over the CONUS
• The results implied the incompatibility between METAR gust data and weak mesonet gust data.
• The application of mesonet use and reject lists to mesonet gust data removed stations with very large O-F departures
• The use of gust data led to significant improvement of the gust field with detailed small scale features.

Future workFuture work
• Conduct routine gust analysis • Further refine parameters used to construct
gust background error covariance• Gust data quality control
- utilize wind data information
- variational quality control• Bias correction of gust background