wind integration study report - idaho powerconditions on wind integration, the study also considered...
TRANSCRIPT

Wind Integration Study Report
Idaho Power, 1221 W Idaho Street, Boise, Idaho 83702
February 2013 © 2012 Idaho Power

Idaho Power Company Wind Integration Study Report
Page i
TABLE OF CONTENTS Table of Contents ......................................................................................................................................... i
List of Tables .............................................................................................................................................. ii
List of Figures ............................................................................................................................................ iii
List of Appendices ..................................................................................................................................... iii
Executive Summary .....................................................................................................................................5
Balancing Reserves ................................................................................................................................5
Study Design ..........................................................................................................................................6
Wind Integration Costs ..........................................................................................................................7
Curtailment ............................................................................................................................................7
Incremental Cost of Wind Integration ...................................................................................................8
Introduction ................................................................................................................................................11
Technical Review Committee ..............................................................................................................12
Energy Exemplar Contribution ............................................................................................................13
Idaho Power System Overview ..................................................................................................................15
Hydroelectric Generating Projects .......................................................................................................15
Coal-Fired Generating Projects ............................................................................................................16
Natural Gas-Fired Generating Projects ................................................................................................16
Transmission and Wholesale Market ...................................................................................................16
Power Purchase Agreements................................................................................................................18
System Demand ...................................................................................................................................18
System Scheduling ...............................................................................................................................19
Study Design ..............................................................................................................................................21
Balancing Reserves Calculations and Operating Reserves ........................................................................23
Balancing Reserves for Variability and Uncertainty in System Demand ............................................25
Contingency Reserve Obligation .........................................................................................................25
System Modeling .......................................................................................................................................27
Day-Ahead Scheduling ........................................................................................................................27
Demand and Wind Forecasts ...............................................................................................................28
Transmission System Modeling ...........................................................................................................28
Overgeneration in System Modeling ...................................................................................................29
Results ........................................................................................................................................................31

Wind Integration Study Report Idaho Power Company
Page ii
Wind Integration Costs ........................................................................................................................31
Incremental Cost of Wind Integration .................................................................................................32
Spilling Water ......................................................................................................................................33
Maximum Idaho Power System Wind Penetration ..............................................................................34
Effect of Wind Integration on Thermal Generation .............................................................................36
Recommendations and Conclusions ..........................................................................................................37
Issues Not Addressed by the Study ......................................................................................................38
Measures Facilitating Wind Integration...............................................................................................39
Future Study of Wind Integration ........................................................................................................39
Literature Cited ..........................................................................................................................................41
LIST OF TABLES Table 1 Balancing reserves requirements (MW) ..............................................................................6
Table 2 Wind integration costs ($/MWh) .........................................................................................7
Table 3 Wind integration costs with the Boardman to Hemingway transmission line ($/MWh) .......................................................................................................................7
Table 4 Incremental wind integration costs ($/MWh) ......................................................................9
Table 5 Balancing reserve requirements (MW) ..............................................................................25
Table 6 Modeled transmission constraints (MW) ...........................................................................28
Table 7 Modeled transmission constraints—simulations with 500-kV Boardman to Hemingway transmission line (MW) .................................................................................29
Table 8 Wind penetration levels and water conditions ...................................................................31
Table 9 Integration costs ($/MWh) .................................................................................................32
Table 10 Integration costs with the Boardman to Hemingway transmission line ($/MWh) ............................................................................................................................32
Table 11 Incremental wind integration costs ($/MWh) ....................................................................33
Table 12 Incremental Hells Canyon Complex spill (thousands of acre-feet) ...................................34
Table 13 Curtailment of wind generation (annual MWh) .................................................................35
Table 14 Annual generation for thermal generating resources for the test case (GWh) ................................................................................................................................36
Table 15 Integration costs ($/MWh) .................................................................................................37
Table B1 Monthly and annual capacity factors (percent of installed nameplate capacity) .............................................................................................................................45

Idaho Power Company Wind Integration Study Report
Page iii
LIST OF FIGURES Figure 1 Installed wind capacity connected to the Idaho Power system ............................................5
Figure 2 Curtailment of wind generation (average annual MWh) .....................................................8
Figure 3 Integration costs with incremental integration costs ($/MWh)............................................9
Figure 4 Installed wind capacity connected to the Idaho Power system (MW) ...............................11
Figure 5 Idaho Power transmission paths.........................................................................................17
Figure 6 Wind-forecasting and generation data ...............................................................................23
Figure 7 Deviations between forecast and actual wind generation with monthly balancing reserves requirements (MW) .............................................................................24
Figure 8 Integration costs with incremental integration costs ($/MWh)..........................................33
Figure 9 Curtailment of wind generation (average annual MWh) ...................................................35
Figure 10 Curtailment of wind generation (average annual MWh) ...................................................38
LIST OF APPENDICES Appendix A. May 9, 2012, Explanation on wind data...............................................................................43
Appendix B. Wind data summaries ...........................................................................................................45

Wind Integration Study Report Idaho Power Company
Page iv
This page left blank intentionally.

Idaho Power Company Executive Summary
Page 5
EXECUTIVE SUMMARY As a variable and uncertain generating resource, wind generators require Idaho Power to modify power system operations to successfully integrate such projects without impacting system reliability. The company must build into its generation scheduling extra operating reserves designed to allow dispatchable generators to respond to wind’s variability and uncertainty.
Idaho Power, similar to much of the Pacific Northwest, has experienced rapid growth in wind generation over recent years. As of January 2013, Idaho Power has reached on-line wind generation totaling 678 megawatts (MW) of nameplate capacity. The rapid growth in wind generation is illustrated in Figure 1.
Figure 1 Installed wind capacity connected to the Idaho Power system
This rapid growth has led to the recognition that Idaho Power’s finite capability for integrating wind is nearing depletion. Even at the current level of wind penetration, dispatchable thermal and hydro generators are not always capable of providing the balancing reserves necessary to integrate wind. This situation is expected to worsen as wind penetration levels increase.
Balancing Reserves This investigation quantified wind integration costs for wind installed capacities of 800 MW, 1,000 MW, and 1,200 MW. Synthetic wind generation data and corresponding day-ahead wind generation forecasts at these build-outs were provided by Energy Exemplar (formerly PLEXOS

Executive Summary Idaho Power Company
Page 6
Solutions) and 3TIER. Based on analysis of these data, the following monthly balancing reserves requirements were imposed in system modeling. Table 1 Balancing reserves requirements (MW)
Wind Gen 800 MW 1,000 MW 1,200 MW
Reg Up Reg Down Reg Up Reg Down Reg Up Reg Down January 199 -262 246 -325 295 -390 February 252 -246 319 -297 379 -351
March 226 -295 281 -368 339 -444
April 255 -353 331 -450 395 -540 May 258 -290 328 -366 392 -439 June 266 -285 339 -363 409 -436
July 274 -256 355 -322 423 -384
August 172 -179 215 -224 257 -267 September 242 -219 309 -280 371 -337
October 217 -248 275 -308 329 -367
November 226 -336 277 -421 333 -507 December 267 -338 326 -424 394 -510
The term Reg Up is used for generating capacity that can be brought online in response to a drop in wind relative to the forecast. Reg Down is used for on-line generating capacity that can be turned down in response to a wind up-ramp. The balancing reserves requirements assume a 90 percent confidence level and thus are designed to cover deviations in wind relative to forecast except for extreme events comprising 5 percent at each end.
Study Design The study employed the following two-scenario design:
• Base scenario for which the system was not burdened with the incremental balancing reserves necessary for integrating wind
• Test scenario for which the system was burdened with the incremental balancing reserves necessary for integrating wind
System simulations for the two scenarios were identical, except that generation scheduling for the test scenario included the condition that dispatchable thermal and hydro generators must provide the appropriate amount of incremental balancing reserves. Having the prescribed balancing reserves positions these generators such that they can respond to changing wind.
System simulations were conducted for a 2017 test year. Customer demand for 2017, as projected for the 2011 Integrated Resource Plan (IRP), was used in system modeling. To investigate the effect of water conditions on wind integration, the study also considered Snake River Basin stream flows for three separate historic years representing low (2004), average (2009), and high (2006) water years.

Idaho Power Company Executive Summary
Page 7
Wind Integration Costs The integration costs in Table 2 were calculated from the system simulations. Table 2 Wind integration costs ($/MWh)
Nameplate Wind
Water Condition 800 MW 1,000 MW 1,200 MW Average (2009) $7.18 $11.94 $18.15 Low (2004) $7.26 $12.44 $18.15 High (2006) $9.73 $14.79 $20.73 Average $8.06 $13.06 $19.01
Simulations with the proposed Boardman to Hemingway transmission line were also performed, yielding the results in Table 3. Table 3 Wind integration costs with the Boardman to Hemingway transmission line ($/MWh)
Nameplate Wind Water Condition 800 MW 1,000 MW 1,200 MW Average (2009) $6.51 $11.03 $16.38 Low (2004) $6.66 $11.04 $16.67 High (2006) $9.72 $13.78 $19.53 Average $7.63 $11.95 $17.53
Curtailment The study results indicate customer demand is a strong determinant of Idaho Power’s ability to integrate wind. During low demand periods, the system of dispatchable resources often cannot provide the incremental balancing reserves paramount to successful wind integration without creating an imbalance between generation and demand. Under these circumstances, curtailment of wind generation is often necessary to maintain balance. Modeling demonstrates that the frequency of curtailment is expected to accelerate greatly beyond the 800 MW installed capacity level. While the maximum penetration level cannot be precisely identified, study results indicate wind development beyond 800 MW is subject to considerable curtailment risk. Importantly, curtailed wind generation was removed from the production cost analysis for the wind study modeling, and consequently had no effect on integration cost calculations. The curtailed wind generation simply could not be integrated, and the cost-causing modifications to system operations designed to allow its integration were assumed to not be made. The curtailment of wind generation observed in the wind study modeling is shown in Figure 2.

Executive Summary Idaho Power Company
Page 8
Figure 2 Curtailment of wind generation (average annual MWh)
Incremental Cost of Wind Integration The integration costs previously provided in Tables 2 and 3 represent the cost per MWh to integrate the full installed wind at the respective penetration levels studied. For example, the results of Table 2 indicate that the full fleet of wind generators making up the 800 MW penetration level bring about costs of $8.06 for each MWh integrated. However, wind generators comprising the 678 MW of current installed capacity on the Idaho Power system are assessed an integration cost of only $6.50/MWh1.
In order to fully cover the $8.06/MWh integration costs associated with 800 MW of installed wind capacity, wind generators in the increment between the current penetration level (678 MW) and the 800 MW penetration level will need greater assessed integration costs. Study analysis indicates that these generators will need to recognize integration costs of $16.70/MWh to allow full recovery of integration costs associated with 800 MW of installed wind capacity. Similarly, generators between the 800 MW and 1000 MW penetration levels introduce incremental system operating costs requiring the assessment of integration costs of $33.42/MWh, and generators between 1000 MW and 1,200 MW require incremental integration costs of $49.46/MWh. A graph showing both integration costs and incremental integration costs is provided in Figure 3 below. The incremental integration costs are summarized in Table 4.
1 Integration cost stipulated by Idaho Public Utilities Commission Case No. IPC-E-07-03, Order No. 30488.

Idaho Power Company Executive Summary
Page 9
Figure 3 Integration costs with incremental integration costs ($/MWh)
Table 4 Incremental wind integration costs ($/MWh)
Nameplate Wind 678 - 800 MW 800 - 1,000 MW 1,000 - 1,200 MW Incremental cost per MWh $16.70 $33.42 $49.46

Executive Summary Idaho Power Company
Page 10
This page left blank intentionally.

Idaho Power Company Introduction
Page 11
INTRODUCTION Electrical power generated from wind turbines is commonly known to exhibit greater variability and uncertainty than that from conventional generators. Because of the incremental variability and uncertainty, it is widely recognized that electric utilities incur increased costs when their systems are called on to integrate wind power. These costs occur because power systems are operated less optimally to successfully integrate wind generation without compromising the reliable delivery of electrical power to customers. Idaho Power has studied the unique modifications it must make to power system operations to integrate the rapidly expanding amount of wind generation connecting to its system. The purpose of this report is to describe the operational modifications taken to integrate wind and the associated costs. The study of these costs is viewed by Idaho Power as an important part of efforts to ensure prices paid for wind power are fair and equitable to customers and generators alike.
Idaho Power first reported on wind integration in 2007. While there was a sizable amount of wind generation under contract in 2007, the amount of wind actually connected to the Idaho Power system at the time of the first study report was just under 20 MW nameplate. Over recent years, the amount of wind generation connected to the Idaho Power system has sharply risen. As of January 2013, Idaho Power has reached on-line wind generation totaling 678 MW nameplate. The rapid growth in wind generation is illustrated in Figure 4.
Figure 4 Installed wind capacity connected to the Idaho Power system (MW)
The steep upturn in wind generation has driven Idaho Power to expand its area of concern beyond the operational costs associated with wind integration to the consideration of the maximum wind penetration

Introduction Idaho Power Company
Page 12
level its system can reliably integrate. Thus, the objective of the Idaho Power wind integration study is to answer the following two questions:
• What are the costs of integrating wind generation on the Idaho Power system?
• How much wind generation can the Idaho Power system accommodate without impacting reliability?
A critical principle in the operation of a bulk power system is that a balance between generation and demand must generally be maintained. Power system operators have long studied the variability and uncertainty present on the demand side of this balance, and as a matter of standard practice carry operating reserves on dispatchable generators designed to accommodate potential changes in demand. The introduction of significant wind power causes the variability and uncertainty on the generation side of the balance to markedly increase, requiring power system operators to plan for carrying incremental amounts of operating reserves, in this case necessary to accommodate potential changes in wind generation.
For the purposes of this study report, the term balancing reserves is used to denote the operating reserves necessary for integrating wind. A document review on wind integration indicates a variety of terms for this quantity. Regardless of term, the property being described is generally the flexibility a balancing authority must carry to reliably respond to variability and uncertainty in wind generation and demand.
A key component in the study of wind integration, as well as the successful in-practice operation of a power system integrating wind, involves the estimation of the additional balancing reserves dispatchable generators must carry to allow the balance between generation and demand to be maintained. Thus, three essential objectives of this report are to describe the analysis performed by Idaho Power to estimate the incremental balancing reserves requirements attributable to wind generation, describe the power system simulations conducted to model the scheduling of the reserves, and estimate associated costs. The study also evaluates situations where the incremental wind-caused balancing reserves exceed the capabilities of Idaho Power’s dispatchable generators, putting the system in a position where it cannot accept additional output from wind generators without compromising reliability.
Technical Review Committee Idaho Power held a public workshop on April 6, 2012, to discuss its work on wind integration. This workshop included a discussion of methodology and preliminary results, as well as a question and answer session. Following the workshop, the company began working with a technical review committee comprised of individuals selected by Idaho Power based on their knowledge of regional issues surrounding wind generation and the operation of electric power systems.
The following members agreed to serve on the committee:
• Ken Dragoon (Ecofys/Northwest Power and Conservation Council)
• Kurt Myers (Idaho National Laboratory [INL])
• Frank Puyleart (Bonneville Power Administration [BPA])
• Rick Sterling (Idaho Public Utilities Commission [IPUC]) The purpose of the work with the technical review committee was to describe in greater detail the study methodology, including an in-depth review of the model used for system simulations for the study. Given this information, the company asked the members of the committee for their specific comments

Idaho Power Company Introduction
Page 13
upon release of this wind integration study report. These comments will be specially noted as having been provided by the technical review committee on the basis of its in-depth review of study methods.
Energy Exemplar Contribution Idaho Power contracted with Energy Exemplar (formerly PLEXOS Solutions) for assistance with the wind integration study. Energy Exemplar’s involvement was critical in the development of the wind generation data used for the study, particularly in the development of representative wind generation forecasts used in the analysis to estimate appropriate balancing reserves requirements. Energy Exemplar was also instrumental in the design of the study methodology, providing key counsel in the formulation of the two-scenario study design detailed later in this report.
With respect to system simulations for the wind study, Idaho Power has developed considerable expertise modeling the power system over recent years. In parallel with the Energy Exemplar efforts, Idaho Power developed a model that optimizes the wind, hydro, and thermal generation production. This internally-developed model was used for system simulations included in the wind study.

Introduction Idaho Power Company
Page 14
This page left blank intentionally.

Idaho Power Company Idaho Power System Overview
Page 15
IDAHO POWER SYSTEM OVERVIEW Idaho Power serves approximately 500,000 customers in southern Idaho and eastern Oregon through the operation of a diversified power system composed of supply- and demand-side resources, as well as significant transmission and distribution infrastructure. From the supply-side perspective, Idaho Power relies heavily on generation from 17 hydroelectric plants on the Snake River and its tributaries. These resources provide the system with electrical power that is low-cost, dependable, and renewable. Idaho Power also shares joint ownership of three coal-fired generating plants and is the sole owner of three natural gas-fired generating plants, including the recently commissioned Langley Gulch Power Plant. With respect to demand-side resources, Idaho Power has received recognition for its demand response programs, particularly the part these dispatchable programs have played in meeting critical summertime capacity needs. Finally, Idaho Power maintains an extensive system of transmission and distribution resources, allowing it to connect to regional power markets, as well as distribute power reliably at the customer level.
Hydroelectric Generating Projects Idaho Power operates 17 hydroelectric projects located on the Snake River and its tributaries. Together, these hydroelectric facilities provide a total nameplate capacity of 1,709 MW and annual generation equal to approximately 970 average megawatts (aMW), or 8.5 million megawatt hours (MWh), under median water conditions. The backbone of Idaho Power’s hydroelectric system is the Hells Canyon Complex (HCC) in the Hells Canyon reach of the Snake River. The HCC consists of Brownlee, Oxbow, and Hells Canyon dams and the associated generation facilities. In a normal water year, the three plants provide approximately 68 percent of Idaho Power’s annual hydroelectric generation. Water storage in Brownlee Reservoir also enables the HCC projects to provide the major portion of Idaho Power’s peaking and load-following capability. The capability to respond to varying load is increasingly being called on to regulate the variable and uncertain delivery of wind generation.
Hydro is Idaho Power’s wind integration resource of choice because of its quick response capability as well as large response capacity. However, the capacity of the hydro system to respond to wind variability is recognized as finite; power-system operation, in practice and as simulated for this study, indicates the hydro system is not always able to sufficiently provide the balancing reserves needed for responding to wind. Using the hydro system for wind integration also limits its availability for other opportunities. The costs of these lost opportunities are a significant part of wind integration costs.
For the wind integration study, the hydroelectric generators at the Brownlee and Oxbow dams were designated in the modeling as available for providing wind-caused balancing reserves. This is consistent with system operation in practice, where the generators at these projects are dispatched to provide the overwhelming majority of operating reserves. Under standard operating practice, the remaining hydroelectric generators of the Idaho Power system are not called on for providing operating reserves. Generators at the Lower Salmon, Bliss, and C. J. Strike plants are capable of some ramping for responding to intra-day variation in load. However, under certain flow conditions, the flexibility of the smaller reservoirs to follow even load trends is greatly diminished, and the facilities are operated strictly as run-of-river (ROR) projects.

Idaho Power System Overview Idaho Power Company
Page 16
Coal-Fired Generating Projects Idaho Power co-owns three coal-fired power plants having a total nameplate capacity of 1,118 MW. With relatively low operating costs, these plants have historically been a reliable source of stable baseload energy for the system. The output from these plants over recent years is somewhat diminished because of a variety of conditions, including relatively high Snake River and Columbia River stream flows, lagging regional demand for electricity associated with slow economic growth, and an oversupply of energy in the region. Idaho Power is currently studying the economics of operating its coal-fired plants, specifically the cost effectiveness of plant upgrades needed for environmental compliance at the Jim Bridger and North Valmy coal plants. The Boardman coal plant in northeastern Oregon will not operate beyond 2020 and Idaho Power’s 64 MW share of the plant will no longer be available to serve customer load.
Coal is one of the thermal resources Idaho Power uses to integrate wind generation. Unlike hydro, the fuel for the coal plants comes at a cost. These fuel costs, as well as the lost opportunities created by using the coal capacity to integrate wind, make up another part of the wind integration costs. The coal generators do not have the large range and rapid response provided by the hydro units.
Natural Gas-Fired Generating Projects Idaho Power owns and operates four simple-cycle combustion turbines totaling 416 MW of nameplate capacity, and recently commissioned a 300 MW combined-cycle combustion turbine. The simple-cycle combustion turbines (located at Danskin and Bennett Mountain project sites) have relatively low capital costs and high variable operating costs. As a consequence of the high operating costs, the simple-cycle turbines have been historically operated primarily in response to peak demand events and have seldom been dispatched to provide operating reserves. Expansion of their operation to provide balancing reserves for integrating wind is projected to lead to a substantial increase in power supply costs.
Idaho Power commissioned in July 2012 the 300 MW Langley Gulch Power Plant. As a combined-cycle combustion turbine, this generating facility has markedly lower operating costs than the simple-cycle units and is consequently expected to be a critical part of the fleet of generators dispatched to provide balancing reserves for responding to variable wind generation.
Transmission and Wholesale Market Idaho Power has significant transmission connections to regional electric utilities and regional energy markets. The company uses these connections considerably as part of standard operating practice to import and export electrical power. Utilization of these paths on a day-to-day basis is typically driven by economic opportunities; energy is generally imported when prices are low and exported when prices are high. Transmission capacity across the connections does not reduce system balancing reserves requirements. Thus, balancing reserves necessary for reliable power system operation in practice are provided by dispatchable generators. The wholesale power market, as accessed through regional transmission connections, is not able to provide balancing reserves.
Idaho Power’s existing transmission system spans southern Idaho from eastern Oregon to western Wyoming and is composed of transmission facilities having voltages ranging from 115 kilovolts (kV) to 500 kV. The sets of lines transmitting power from one geographic area to another are known as transmission paths. There are defined transmission paths to other states and between southern Idaho load

Idaho Power Company Idaho Power System Overview
Page 17
centers such as Boise, Twin Falls, and Pocatello. Idaho Power’s transmission system and paths are shown in Figure 5.
Figure 5 Idaho Power transmission paths
The critical paths from the perspective of providing access to the regional wholesale electricity market are the Idaho–Northwest, Idaho–Utah (Path C), and Idaho–Montana paths. The Boardman to Hemingway transmission line identified by Idaho Power in the preferred portfolio of its 2011 IRP will be an upgrade to the Idaho-Northwest path. The combination of these paths provides Idaho Power effective access to the regional market for the economic exchange of energy.
While Idaho Power does not consider the regional market part of its day-to-day solution for integrating wind generation, it may be necessary during extreme events to use the regional transmission connections and rely on the regional energy market to accommodate wind. The company expects that at times even the regional market will be insufficient to integrate wind. During these times when Idaho Power and the regional market have insufficient balancing reserves to successfully integrate wind generation, it may be necessary to curtail wind, or even curtail customer load, to maintain electrical system stability and integrity.

Idaho Power System Overview Idaho Power Company
Page 18
Power Purchase Agreements In addition to power purchases in the wholesale market, Idaho Power purchases power pursuant to long-term power purchase agreements (PPA). The company has the following notable firm wholesale PPAs and energy exchange agreements:
• Raft River Energy I, LLC—For up to 13 MW (nameplate generation) from its Raft River Geothermal Power Plant Unit #1 located in southern Idaho. The contract term is through April 2033.
• Telocaset Wind Power Partners, LLC—For 101 MW (nameplate generation) from the Elkhorn Valley wind project located in eastern Oregon. The contract term is through 2027.
• USG Oregon LLC—For 22 MW (estimated average annual output) from the Neal Hot Springs geothermal power plant located near Vale, Oregon. The contract term is through 2037 with an option to extend.
• Clatskanie People’s Utility District—For the exchange of up to 18 MW of energy from the Arrowrock project in southern Idaho for energy from Idaho Power’s system or power purchased at the Mid-Columbia trading hub. The initial term of the agreement is January 1, 2010 through December 31, 2015. Idaho Power has the right to renew the agreement for two additional five-year terms.
System Demand Idaho Power’s all-time system peak demand is 3,245 MW, set on July 12, 2012, and the all-time winter peak demand is 2,527 MW, set on December 10, 2009. An important characteristic of the Idaho Power system is the intra-day range from minimum to maximum customer demand, which during the summer commonly reaches 1,000 MW and occasionally exceeds 1,200 MW. Thus, generating resources that can follow this demand as it systematically grows during the day are critical to maintaining reliable system operation. Hydro generators, particularly those of the HCC, provide much of the demand following capability. Recent natural gas-fired resource additions are also instrumental in allowing the system to reliably meet system demand. An additional resource available to the system is the targeted dispatch of demand response programs. These demand-side programs have proven to dependably reduce system demand during extreme summer load events. From the perspective of system reliability, the nature of Idaho Power’s customer demand places a premium on the value associated with capacity-providing resources; energy resources, such as wind, contribute markedly less towards promoting system reliability.
It is recognized that production from wind projects does not dependably occur in concert with peak customer demand. In fact, there is a tendency to experience periods during which production from wind and hydro facilities is high and customer demand is low. The coincidence of these circumstances leads to an excess generation condition, where the capability of system generators to reduce their output in response to wind is severely diminished. Such excess generation events have been observed in recent years by Idaho Power and other balancing authorities in the Pacific Northwest. System stability for the balancing authority is maintained during these events through the curtailment of generation, including that from wind-powered facilities.

Idaho Power Company Idaho Power System Overview
Page 19
System Scheduling Idaho Power schedules its system with the primary objective of ensuring the reliable delivery of electricity to customers at the lowest possible cost. System planning is conducted for multiple time frames ranging from years/months in advance for long-term planning to hour-ahead for real-time operations planning. A fundamental principle in system planning is that each time frame should be driven by the objective of readying the system for more granular time frames. Long-term resource planning (i.e., the IRP) should ensure the system has adequate resources for managing customer demand over the 18-month long-term operations planning window. Long-term operations planning should position the system such that customer demand can be managed over the balance-of-month perspective. Balance-of-month planning should result in a system that can manage demand when scheduling generation day-ahead. Day-ahead scheduling should enable operators to meet demand from a real-time perspective. Finally, real-time energy schedulers should ensure the system is positioned hour-ahead such that reliable service is maintained within the hour.
With the possible exception of the IRP, the scheduling horizons considered by Idaho Power involve transacting with the regional wholesale market. Where the economic scheduling of system generation is insufficient to meet demand, Idaho Power enters into contracts to purchase power off-system through its transmission connections. Conversely, where economically scheduled generation exceeds customer demand, surplus power is sold into the market. Importantly, Federal Energy Regulatory Commission (FERC) rules (FERC order nos. 888/890) stipulate that surplus power sales are sourced by generating resources that have been undesignated from network load service. Undesignation of a variable generating resource, such as wind, for sourcing a third-party sales transaction results in the transacted energy being given a dynamic tag, where tag is the North American Electricity Reliability Corporation (NERC) term representing an energy transaction in the wholesale electricity market. Balancing authorities experience considerable difficulty attracting a purchaser of dynamically tagged energy. Therefore, as a standard operating practice, Idaho Power sources off-system power sale contracts from its fleet of hydro and thermal generators. With their recognized level of dependability, hydro and thermal generators can be undesignated for sourcing surplus power sales while allowing conventional tagging procedures to be followed.

Idaho Power System Overview Idaho Power Company
Page 20
This page left blank intentionally.

Idaho Power Company Study Design
Page 21
STUDY DESIGN Idaho Power designed its wind integration study with the objective of isolating in its operations modeling the effects directly related to integrating wind generation. A common study design used towards meeting this objective, and employed by Idaho Power for this study, is to simulate system operations of a future year with projected wind build-outs under the following two scenarios:
• Base scenario for which the system is not burdened with the incremental balancing reserves necessary for integrating wind
• Test scenario for which the system is burdened with the incremental balancing reserves necessary for integrating wind
A critical feature of this design is to hold equivalent model parameters and inputs between these two scenarios except for balancing reserves. The incremental balancing reserves built into the test scenario simulation necessarily result in higher production costs for the system, a cost difference that can be attributed to wind integration.
The test year selected by Idaho Power for its study is 2017. While in-service for the 500-kV Boardman to Hemingway transmission line is not anticipated before 2018, the study still considered scenarios to investigate the effects of the expanded transmission on wind integration costs. The study assumed customer demand and Mid-Columbia trading hub wholesale prices as projected for 2017 in the 2011 IRP.
As noted previously, as of January 2013 Idaho Power has 678 MW of nameplate wind capacity. Future wind penetrations considered in the study are 800 MW, 1,000 MW, and 1,200 MW of nameplate capacity. The synthetic wind data at these penetration levels, as well as representative day-ahead forecasts, were provided by 3TIER and Energy Exemplar. The synthetic wind data were provided for 43 wind project locations requested by Idaho Power corresponding to project sites having a current purchase agreement with the company, as well as sites proposed to the company for future projects. Further discussion of the study wind data and associated day-ahead forecasts is provided in a May 9, 2012 explanation released by the company (Appendix A).
To investigate the effect of water conditions on wind integration, the study considered Snake River Basin stream flows for three separate historic scenarios representing low (2004), average (2009), and high (2006) water years. Because of their importance in providing balancing reserves to integrate wind, the HCC projects were simulated using the study model to determine their hydroelectric generation under the selected water years. Generation for the remaining hydroelectric projects, which are not in practice called on to provide balancing reserves for integrating wind, was entered for the study as recorded in actual operations for the water years selected.

Study Design Idaho Power Company
Page 22
This page left blank intentionally.

Idaho Power Company Balancing Reserves Calculations and Operating Reserves
Page 23
BALANCING RESERVES CALCULATIONS AND OPERATING RESERVES
Critical to the two-case study design is the calculation of the incremental balancing reserves necessary for successfully integrating the future wind penetration build-outs considered. The premise behind these calculations is that Idaho Power’s dispatchable generators must have capacity in reserve, allowing them to respond at an acceptable confidence level to the variable and uncertain delivery of wind. Estimates of the appropriate amount of balancing reserves were based on an analysis of errors in day-ahead forecasts of system wind for the wind build-outs considered in the study. In addition to the synthetic time series of hourly wind-generation data, 3TIER provided a representative day-ahead forecast of hourly wind generation. To provide a larger sampling, Energy Exemplar created 100 additional day-ahead forecasts having similar accuracy as the 3TIER forecast. Summaries of the synthetic wind data and day-ahead forecasts are included in Appendix B. An illustration of this design is given in Figure 6.
Figure 6 Wind-forecasting and generation data
In recognition of the seasonality of wind, the data were grouped by month, yielding balancing reserves estimates specific to each month. The sample size for each month was extremely large. As an example, for July there were 74,400 deviations between the day-ahead forecast and actual wind generation (100 forecasts × 31 days × 24 hours). The balancing reserves requirements were calculated as the bi-directional capacity covering 90 percent of the deviations. The use of the 90 percent confidence level for the wind integration analysis is consistent with the criterion used for hydro conditions in assessing peak-hour resource adequacy in integrated resource planning.
Figure 7 is an illustration of a full year of deviations for a single forecast iteration at the 1,200 MW penetration level. In this figure, the deviations on the positive side correspond to deviations where actual wind was lower than day-ahead forecast wind, while deviations on the negative side reflect instances where actual wind exceeded the forecast. Importantly, the balancing reserves requirements did not cover the full extent of the deviations, leaving extreme tail events in both directions uncovered.

Balancing Reserves Calculations and Operating Reserves Idaho Power Company
Page 24
Figure 7 Deviations between forecast and actual wind generation with monthly balancing reserves requirements (MW)
The requirements are dynamic in that the forecast wind was taken into account in imposing the amount of balancing reserves. For example, the requirements suggest that for the 1,200 MW wind penetration level, 295 MW of unloaded generating capacity should be held as balancing reserves in January to guard against a drop in wind relative to the forecast. However, if the forecast wind generation is only 250 MW, then the most wind can drop relative to forecast is 250 MW, which is then the amount of balancing reserves built into the generation schedule. As a second example, if the forecast wind generation is 350 MW, the analysis of wind data indicates that balancing reserves should be held to guard against wind dropping to 55 MW. The likelihood of wind dropping below 55 MW is small (5 percent), and balancing reserves are not scheduled on dispatchable generators for covering a drop in wind to less than 55 MW.
The monthly requirements for balancing reserves are given in Table 5 for the wind penetration levels studied. The term Reg Up is used for generating capacity that can be brought online in response to a drop in wind relative to the forecast. Reg Down is used for online generating capacity that can be turned down in response to a wind up-ramp.

Idaho Power Company Balancing Reserves Calculations and Operating Reserves
Page 25
Table 5 Balancing reserve requirements (MW)
Wind Gen 800 MW 1,000 MW 1,200 MW Reg Up Reg Down Reg Up Reg Down Reg Up Reg Down
January 199 -262 246 -325 295 -390 February 252 -246 319 -297 379 -351 March 226 -295 281 -368 339 -444 April 255 -353 331 -450 395 -540 May 258 -290 328 -366 392 -439 June 266 -285 339 -363 409 -436 July 274 -256 355 -322 423 -384 August 172 -179 215 -224 257 -267 September 242 -219 309 -280 371 -337 October 217 -248 275 -308 329 -367 November 226 -336 277 -421 333 -507 December 267 -338 326 -424 394 -510
Balancing Reserves for Variability and Uncertainty in System Demand As described previously, power system operation has long needed to hold bidirectional capacity for responding to variability and uncertainty in system demand. For the wind study modeling, Idaho Power imposed a balancing reserves requirement equal to 3 percent of the system demand as capacity reserved to allow for variability and uncertainty in load. This capacity was carried in equal amounts in the two scenarios modeled: the base scenario where the system was not burdened with wind-caused balancing reserves, and the test scenario where a wind-caused balancing reserves requirement was assumed necessary. For the test scenario modeling, the separate load- and wind-caused reserves components were added to yield the total bidirectional balancing reserves requirement. This approach for combining the reserves components is consistent with Idaho Power operations in practice for which system operators receive separate forecasts for wind and demand and combine the estimated uncertainty about these projections through straight addition.
Contingency Reserve Obligation The variability and uncertainty in demand and wind are routine factors in power system operation and require a system to carry the bidirectional balancing reserves described in this section for maintaining compliance with reliability standards. However, balancing authorities, such as Idaho Power, are also required to carry unloaded capacity for responding to system contingency events, which have traditionally been viewed as large and relatively infrequent system disturbances affecting the production or transmission of power (e.g., loss of a major generating unit or major transmission line). System modeling for the wind study imposed a contingency reserve intended to reflect this obligation equal to 3 percent of load and 3 percent of generation, setting aside this capacity for both scenarios (i.e., base and test). The requirement to carry at least half of the contingency reserve obligation on generators that are spinning and grid-synchronized was also captured in the modeling.

Balancing Reserves Calculations and Operating Reserves Idaho Power Company
Page 26
This page left blank intentionally.

Idaho Power Company System Modeling
Page 27
SYSTEM MODELING Idaho Power used an internally developed system operations model for this study. The model determines optimal hourly scheduling of dispatchable hydro and thermal generators with the objective of minimizing production costs while honoring constraints imposed on the system. System constraints used in the model capture numerous restrictions governing the operation of the power system, including the following:
• Reservoir headwater constraints
• Minimum reservoir outflow constraints
• Reservoir outflow ramping rate constraints
• Wholesale market activity constraints
• Generator minimum/maximum output levels
• Transfer capacity constraints over transmission paths
• Generator ramping rates The model also stipulated that demand and resources were exactly in balance, and importantly that hourly balancing reserves requirements for variability and uncertainty in load and wind were satisfied. The incremental balancing reserves required for wind variability and uncertainty drove the production cost differences between the study’s two cases.
Day-Ahead Scheduling The hourly scheduling determined by the model was intended to represent the optimal day-ahead system dispatch. This dispatch schedule included generation scheduling for thermal and hydro generators, as well as market transactions. Key inputs to the generation scheduling were the forecasts for wind production and customer demand. These two elements of the generation/load balance commonly carry the greatest uncertainty for power system operation in practice. A fundamental premise of reliable operations for a balancing authority is the need to carry reasonable and prudent flexibility in the day-ahead generation schedule, allowing the system to respond to errors in demand and wind generation forecasts. This principle was built into the wind study modeling in the form of balancing reserves constraints the model must honor. In the two-case study design, the system modeling for the base case included constraints only for demand uncertainty, whereas constraints for the test case included the need to carry additional balancing reserves for wind uncertainty. The derivation of the balancing reserves constraints is described previously in this report.
The critical decision day-ahead generation schedulers must make involves how to schedule dispatchable generation units taking into account the following factors:
• Forecasts for demand and wind production
• Production from other non-dispatchable resources (e.g., PPAs)
• Production from ROR hydro resources
• Operating costs of thermal resources
• Water supply for dispatchable hydro resources

System Modeling Idaho Power Company
Page 28
• Operating reserves for contingency events
• Flexibility in the schedule for dispatchable generation units allowing them to respond if necessary to deviations between forecast and actual conditions in load and wind
The essence of wind integration and the associated costs is that the amount of balancing reserves that must be carried is greater because of the uncertainty and variability of wind generation.
Demand and Wind Forecasts The demand forecast used for the modeling was based on the projected hourly load used in the 2011 IRP for the calendar year 2017. The wind production forecast used for the modeling was based on the average of the 100 forecasts provided by 3TIER and Energy Exemplar.
The forecasts for both elements were identical between the study scenarios; the test scenario simply imposed greater balancing reserves constraints to allow for variability and uncertainty in the wind production forecast.
Transmission System Modeling As noted in the Idaho Power System Overview section, the critical interconnections to the regional market are over the Idaho–Northwest, Idaho–Utah (Path C), and Idaho–Montana paths. For the wind-study modeling, the separate paths were combined to an aggregate path for off-system access. Every October, Idaho Power submits a request to secure firm transmission across its network based on its expected monthly import needs for the next 18 months. The maximum levels used in the modeling for firm import capacity were based on the October 2010 request. The modeling assumed additional import capacity using non-firm transmission. Non-firm imports were assessed a $50/MWh penalty designed to represent the less favorable economics associated with non-firm transmission and typical hourly pricing. The export limits were based on typical levels of outbound capacity observed in practice. The transmission constraints in Table 6 were used in the wind study modeling.
Table 6 Modeled transmission constraints (MW)
Month Maximum Firm Import (MW) Maximum Non-Firm
Import (MW) Maximum Export (MW) January 179 300 500
February 35 300 500
March 0 300 500
April 0 300 500
May 320 300 500
June 262 300 500
July 149 300 500
August 230 300 500
September 217 300 500
October 0 300 500
November 113 300 500
December 325 300 500

Idaho Power Company System Modeling
Page 29
Idaho Power’s transmission network is a fundamental part of the vertically integrated power system, and allows the company to participate in the regional wholesale market to serve load or for economic benefit. However, Idaho Power does not view its transmission network with associated regional interconnections as a resource for providing balancing reserves allowing it to respond to variability and uncertainty in wind generation and customer demand. In the region, each balancing authority provides its own balancing reserves. Idaho Power provides its balancing reserves from company-owned dispatchable generation units (thermal and hydro).
Idaho Power also investigated scenarios with the 500-kV Boardman to Hemingway transmission line. For these scenarios, the maximum firm import constraint was increased by 500 MW during April through September and by 200 MW for the remainder of the year. The maximum export constraint was increased by 150 MW throughout the year. The following transmission constraints were used in the wind study modeling for the system with the proposed Boardman to Hemingway transmission line.
Table 7 Modeled transmission constraints—simulations with 500-kV Boardman to Hemingway transmission line (MW)
Month Maximum Firm Import (MW) Maximum Non-firm Import (MW) Maximum Export (MW) January 379 300 650 February 235 300 650 March 200 300 650 April 500 300 650 May 820 300 650 June 762 300 650 July 649 300 650 August 730 300 650 September 717 300 650 October 200 300 650 November 313 300 650 December 525 300 650
Overgeneration in System Modeling At a fundamental level, the reliable scheduling of the power system is based on the following simple equation:
Forecast load=Forecast generation
An expanded form of this equation is as follows:
Forecast retail sales + Forecast wholesale sales
=
Forecast dispatchable generation + Forecast wind generation + Forecast other generation

System Modeling Idaho Power Company
Page 30
In the expanded equation, dispatchable generation includes scheduled production from resources the balancing authority (i.e., Idaho Power) can vary at its discretion to achieve reliable and economic system operation. Built into this term of the equation is the bidirectional balancing reserves intended for use in case the forecasts for demand or wind generation are incorrect. The other generation in the expanded equation is the amount of energy that cannot be varied. This term includes minimum generation levels at baseload thermal plants, ROR hydro generation, and non-wind power purchased under contract.
At times, the left side of the equation can become very low; Idaho Power customer use is low and wholesale exports are capped by transmission capacity. During these times, providing the balancing reserves necessary for responding to wind, specifically for responding to wind up-ramps, is not possible without upsetting the balance between the two sides of this equation. In effect, the terms of the right side of the equation cannot be reduced enough to match the left. For these times, the wind study modeling assumed the wind, or potential wind, was excessive and could not be accepted; curtailment of wind energy was necessary to maintain balance. Further discussion of overgeneration and curtailment is provided in the following section.

Idaho Power Company Results
Page 31
RESULTS As noted previously, the objective of this study is to answer two fundamental questions:
1. What are the costs of integrating wind generation for the Idaho Power system?
2. How much wind generation can the Idaho Power system accommodate without impacting reliability?
Thus, the results produced by the study’s system modeling were designed to address these two questions.
Wind Integration Costs From a cost perspective, a comparison of annual production costs between two scenarios having different balancing reserves requirements—where the difference in balancing reserves is related to wind’s variability and uncertainty—was used to estimate the costs of integrating wind. The production cost difference between scenarios was divided by the annual MWh of wind generation to yield an estimated integration cost expressed on a per MWh basis. The integration cost calculation is summarized as follows:
• Base scenario for which the system was not burdened with incremental balancing reserves necessary for integrating wind (wind integration is “not our problem”, a theoretical case used as a benchmark for comparing costs)
• Test scenario for which the system was burdened with incremental balancing reserves necessary for integrating wind
The wind integration cost is the net-cost difference of the two scenarios divided by the MWh of wind generation (the amount of wind generation was the same in both scenarios):
Wind integration cost = Test scenario net cost - Base scenario net cost
Wind generation in MWh
As noted earlier, the study included three water years and three wind penetration levels. These conditions are shown in Table 8. Table 8 Wind penetration levels and water conditions
Wind Penetration Level (MW Capacity) Water Year 800 Low (2004)
1,000 Average (2009) 1,200 High (2006)
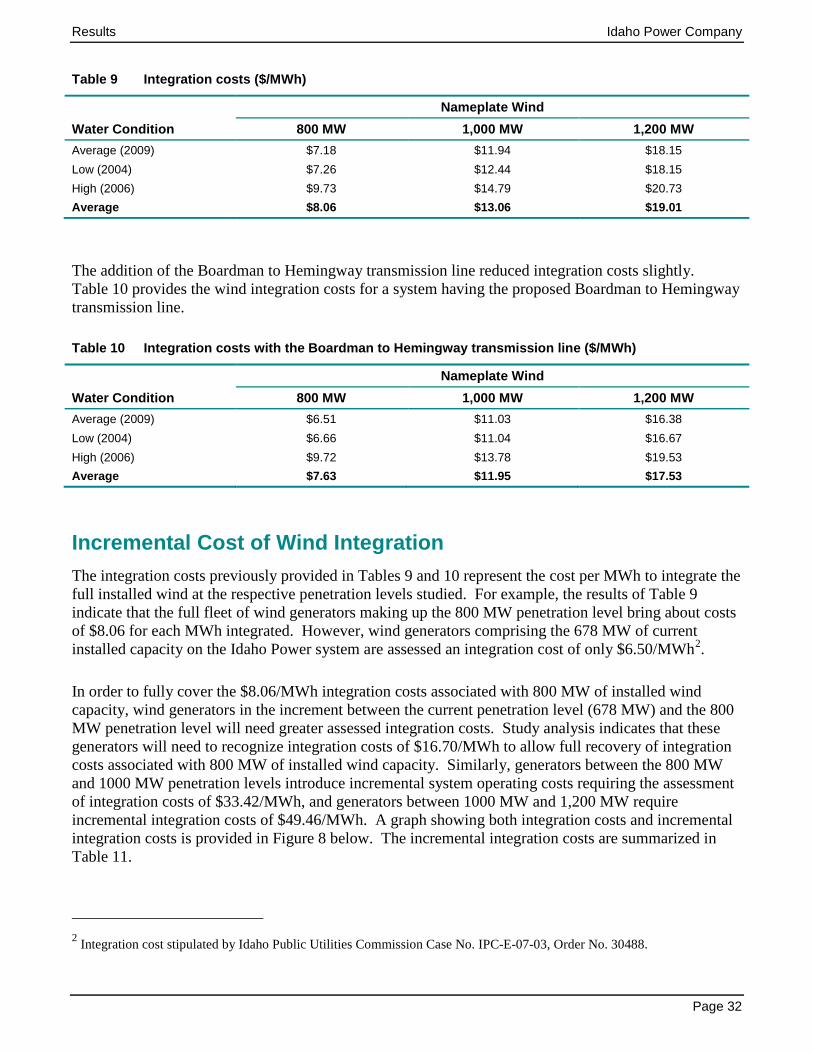
A matrix of the wind integration costs on a per MWh basis is given in Table 9. These costs are based on a system without the proposed Boardman to Hemingway transmission line.
Results Idaho Power Company
Page 32
Table 9 Integration costs ($/MWh)
Nameplate Wind Water Condition 800 MW 1,000 MW 1,200 MW Average (2009) $7.18 $11.94 $18.15 Low (2004) $7.26 $12.44 $18.15 High (2006) $9.73 $14.79 $20.73 Average $8.06 $13.06 $19.01
The addition of the Boardman to Hemingway transmission line reduced integration costs slightly. Table 10 provides the wind integration costs for a system having the proposed Boardman to Hemingway transmission line.
Table 10 Integration costs with the Boardman to Hemingway transmission line ($/MWh)
Nameplate Wind Water Condition 800 MW 1,000 MW 1,200 MW Average (2009) $6.51 $11.03 $16.38 Low (2004) $6.66 $11.04 $16.67 High (2006) $9.72 $13.78 $19.53 Average $7.63 $11.95 $17.53
Incremental Cost of Wind Integration The integration costs previously provided in Tables 9 and 10 represent the cost per MWh to integrate the full installed wind at the respective penetration levels studied. For example, the results of Table 9 indicate that the full fleet of wind generators making up the 800 MW penetration level bring about costs of $8.06 for each MWh integrated. However, wind generators comprising the 678 MW of current installed capacity on the Idaho Power system are assessed an integration cost of only $6.50/MWh2.
In order to fully cover the $8.06/MWh integration costs associated with 800 MW of installed wind capacity, wind generators in the increment between the current penetration level (678 MW) and the 800 MW penetration level will need greater assessed integration costs. Study analysis indicates that these generators will need to recognize integration costs of $16.70/MWh to allow full recovery of integration costs associated with 800 MW of installed wind capacity. Similarly, generators between the 800 MW and 1000 MW penetration levels introduce incremental system operating costs requiring the assessment of integration costs of $33.42/MWh, and generators between 1000 MW and 1,200 MW require incremental integration costs of $49.46/MWh. A graph showing both integration costs and incremental integration costs is provided in Figure 8 below. The incremental integration costs are summarized in Table 11.
2 Integration cost stipulated by Idaho Public Utilities Commission Case No. IPC-E-07-03, Order No. 30488.

Idaho Power Company Results
Page 33
Figure 8 Integration costs with incremental integration costs ($/MWh)
Table 11 Incremental wind integration costs ($/MWh)
Nameplate Wind 678 - 800 MW 800 - 1,000 MW 1,000 - 1,200 MW Incremental cost per MWh $16.70 $33.42 $49.46
Spilling Water The modeling suggests that providing balancing reserves to integrate wind leads to increased spill at the HCC hydroelectric projects. Spill is observed in actual operations during periods of high Brownlee Reservoir inflow coupled with minimal capacity to store water in the reservoir. Minimal storage capacity at Brownlee occurs when the reservoir is nearly full or when the reservoir level is dictated by some other constraint, such as a flood control restriction. Flow through the HCC cannot be significantly reduced during these periods; the three-dam complex is essentially operated as a ROR project during these high-flow periods. As a consequence, holding generating capacity in reserve for balancing

Results Idaho Power Company
Page 34
purposes is frequently achieved only through increasing project spill, rather than reducing turbine flow. Table 12 provides the total incremental HCC spill in thousands of acre-feet (kaf) associated with integrating wind.
Table 12 Incremental Hells Canyon Complex spill (thousands of acre-feet)
Nameplate Wind Water Condition 800 MW 1,000 MW 1,200 MW Average (2009) 534 kaf 949 kaf 1,446 kaf Low (2004) 33 kaf 93 kaf 255 kaf High (2006) 2,101 kaf 2,698 kaf 2,916 kaf
Simulations for the high water condition (2006) with 800 MW of wind capacity provide a good illustration of the effect of wind integration on spill. Under the base scenario, the theoretical “not our problem” case, wind study system simulation shows spill totaling 3,590 kaf at Brownlee alone. For reference, this simulated spill is within 5 percent of the actual total Brownlee spill in 2006, which was about 3,800 kaf. By comparison, the total Brownlee spill under the test scenario, where integrating wind is Idaho Power’s problem, is 4,475 kaf. The excess spill under the test scenario translates to about 185 gigawatt hours (GWh) of lost power production at Brownlee—energy that is no longer available for serving load or off-system sales.
Maximum Idaho Power System Wind Penetration The capability of the Idaho Power system to integrate wind is finite. The rapid growth in wind capacity connecting to the system over recent years has heightened concern that the limits of this integration capability are being neared, and that development beyond these limits will severely jeopardize system reliability. The quantity of wind generation Idaho Power can integrate varies throughout the year as a function of customer load. During times of high load, Idaho Power can integrate more wind than during times of low load.
Modeling performed for the wind study has demonstrated the occurrence during low load periods where the balancing reserves necessary for responding to a wind up-ramp (i.e., generation that can be dispatched down in response to an increase in wind) cannot be provided without pushing the system to an overgeneration condition. Customer load for these periods, where load consists of sales to retail customers and to wholesale customers by way of regional transmission connections, is too low to allow for the integration of a significant quantity of wind. This situation requires curtailment of wind generation to maintain system balance. For the wind study modeling, the curtailed wind generation was removed from the production cost analysis and consequently did not affect the calculated integration cost. Curtailed wind was not integrated in the modeling and had no influence on the calculated integration costs. Not surprisingly, curtailment was found in the wind study modeling to have a strong correlation with customer load, water condition, and wind penetration levels. A summary of the amount of curtailment in the study is provided in Table 13.
Idaho Power Company Results
Page 35
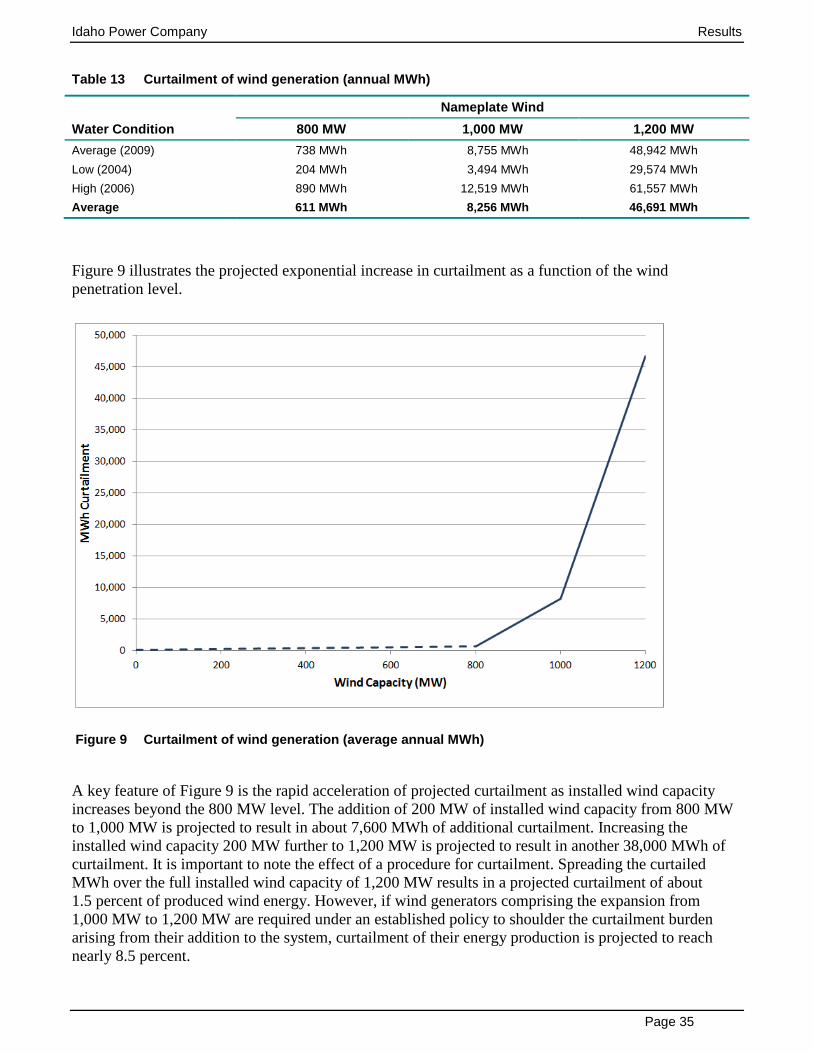
Table 13 Curtailment of wind generation (annual MWh)
Nameplate Wind Water Condition 800 MW 1,000 MW 1,200 MW Average (2009) 738 MWh 8,755 MWh 48,942 MWh Low (2004) 204 MWh 3,494 MWh 29,574 MWh High (2006) 890 MWh 12,519 MWh 61,557 MWh Average 611 MWh 8,256 MWh 46,691 MWh
Figure 9 illustrates the projected exponential increase in curtailment as a function of the wind penetration level.
Figure 9 Curtailment of wind generation (average annual MWh)
A key feature of Figure 9 is the rapid acceleration of projected curtailment as installed wind capacity increases beyond the 800 MW level. The addition of 200 MW of installed wind capacity from 800 MW to 1,000 MW is projected to result in about 7,600 MWh of additional curtailment. Increasing the installed wind capacity 200 MW further to 1,200 MW is projected to result in another 38,000 MWh of curtailment. It is important to note the effect of a procedure for curtailment. Spreading the curtailed MWh over the full installed wind capacity of 1,200 MW results in a projected curtailment of about 1.5 percent of produced wind energy. However, if wind generators comprising the expansion from 1,000 MW to 1,200 MW are required under an established policy to shoulder the curtailment burden arising from their addition to the system, curtailment of their energy production is projected to reach nearly 8.5 percent.

Results Idaho Power Company
Page 36
The study results suggest that the occurrence of low load periods for which curtailment is necessary is likely to remain relatively infrequent for wind penetration levels of 800 MW or less. However, the results indicate that operational challenges are likely to grow markedly more severe with expanding wind penetration beyond 800 MW of installed nameplate capacity. The occurrence of low load periods for which balancing reserves cannot be provided without causing overgeneration is expected to become more frequent and require deeper curtailment of wind production. This is particularly true in that it is often necessary to maintain the operation of thermal (i.e., gas- and coal-fired) generators during periods of low load and high wind, in order to have the dispatchable generation from these resources available should customer loads increase or winds decrease.
Effect of Wind Integration on Thermal Generation Idaho Power operates its coal resources to provide low-cost, dependable baseload energy. However, the study results suggest that the operation of the company’s coal resources is likely to decrease on an annual basis with expanding wind penetration. The reduction in coal output is principally the result of displacement of coal generation by wind generation, as well as the displacement by flexible gas-fired plants required to help balance the variable and uncertain delivery of wind.
The operation of coal-fired generators has been affected by energy oversupply conditions over recent years in the Pacific Northwest. Coal plants have historically been operated less during periods of high hydro production, and maintenance is typically scheduled to coincide with spring runoff when customer demand is relatively low. However, the expansion of wind capacity over recent years in the region has caused overgeneration conditions to become more severe and longer lasting, leading to extended periods during which prices in the wholesale market have been very low or negative. The effect on coal plants has been a decline in annual energy production. However, during periods when customer load is high, such as during summer 2012, Idaho Power’s coal fleet is consistently relied upon for energy to meet the high customer demand.
While the operation of baseload coal-fired power plants is expected to decline as a consequence of adding wind to a power system, this decline is offset by a marked increase in generation from gas-fired plants. The rapidly dispatched capacity from the gas-fired plants is widely recognized as critical to the successful integration of variable generation. Wind study modeling suggests that the need to dispatch gas-fired generators for balancing reserves is likely to displace the economic operation of coal-fired generators, particularly during times of acute transmission congestion.
This situation where relatively low-cost baseload resources are displaced by flexible cycling plants (i.e., gas-fired) is described in a 2010 NREL report (Denholm et al. 2010). Table 14 lists the annual generation from the wind study modeling for thermal resources for the case when Idaho Power is responsible for providing the balancing reserves and integrating the wind energy.
Table 14 Annual generation for thermal generating resources for the test case (GWh)
Nameplate Wind Thermal Resource 800 MW 1,000 MW 1,200 MW Coal-fired 7,568 GWh 7,291 GWh 6,851 GWh Gas-fired 963 GWh 1,238 GWh 1,918 GWh
Idaho Power Company Recommendations and Conclusions
Page 37
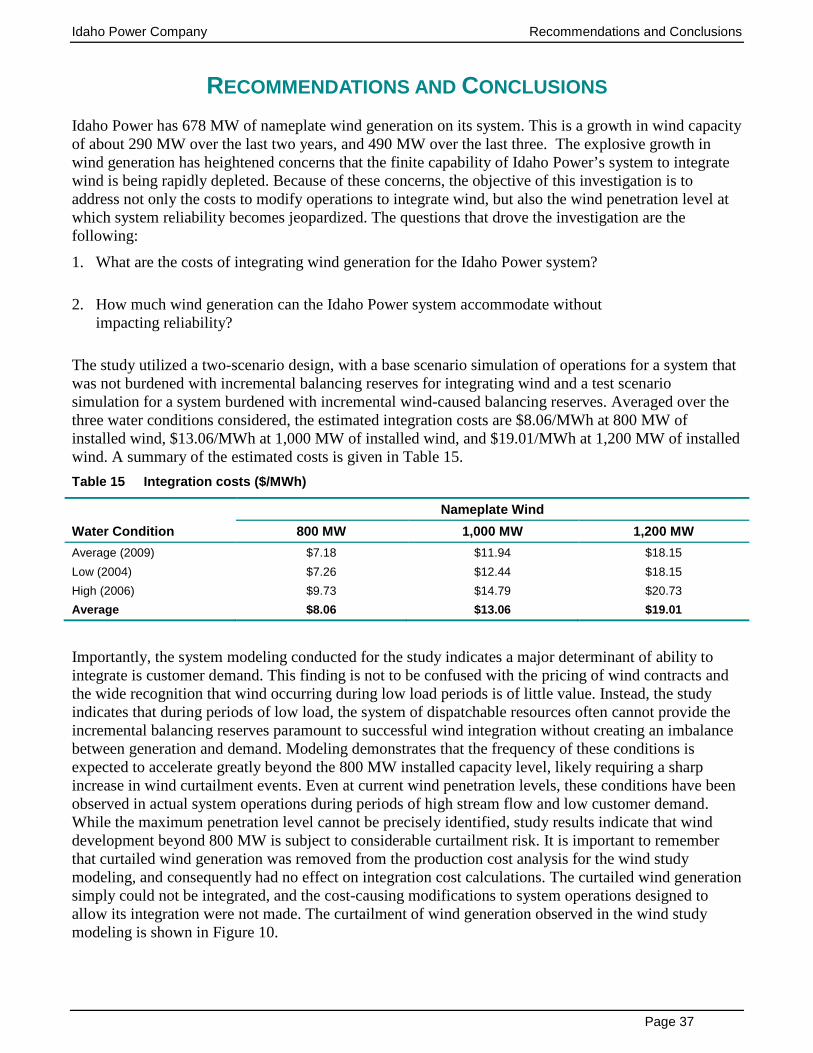
RECOMMENDATIONS AND CONCLUSIONS Idaho Power has 678 MW of nameplate wind generation on its system. This is a growth in wind capacity of about 290 MW over the last two years, and 490 MW over the last three. The explosive growth in wind generation has heightened concerns that the finite capability of Idaho Power’s system to integrate wind is being rapidly depleted. Because of these concerns, the objective of this investigation is to address not only the costs to modify operations to integrate wind, but also the wind penetration level at which system reliability becomes jeopardized. The questions that drove the investigation are the following:
1. What are the costs of integrating wind generation for the Idaho Power system?
2. How much wind generation can the Idaho Power system accommodate without impacting reliability?
The study utilized a two-scenario design, with a base scenario simulation of operations for a system that was not burdened with incremental balancing reserves for integrating wind and a test scenario simulation for a system burdened with incremental wind-caused balancing reserves. Averaged over the three water conditions considered, the estimated integration costs are $8.06/MWh at 800 MW of installed wind, $13.06/MWh at 1,000 MW of installed wind, and $19.01/MWh at 1,200 MW of installed wind. A summary of the estimated costs is given in Table 15. Table 15 Integration costs ($/MWh)
Nameplate Wind Water Condition 800 MW 1,000 MW 1,200 MW Average (2009) $7.18 $11.94 $18.15 Low (2004) $7.26 $12.44 $18.15 High (2006) $9.73 $14.79 $20.73 Average $8.06 $13.06 $19.01
Importantly, the system modeling conducted for the study indicates a major determinant of ability to integrate is customer demand. This finding is not to be confused with the pricing of wind contracts and the wide recognition that wind occurring during low load periods is of little value. Instead, the study indicates that during periods of low load, the system of dispatchable resources often cannot provide the incremental balancing reserves paramount to successful wind integration without creating an imbalance between generation and demand. Modeling demonstrates that the frequency of these conditions is expected to accelerate greatly beyond the 800 MW installed capacity level, likely requiring a sharp increase in wind curtailment events. Even at current wind penetration levels, these conditions have been observed in actual system operations during periods of high stream flow and low customer demand. While the maximum penetration level cannot be precisely identified, study results indicate that wind development beyond 800 MW is subject to considerable curtailment risk. It is important to remember that curtailed wind generation was removed from the production cost analysis for the wind study modeling, and consequently had no effect on integration cost calculations. The curtailed wind generation simply could not be integrated, and the cost-causing modifications to system operations designed to allow its integration were not made. The curtailment of wind generation observed in the wind study modeling is shown in Figure 10.

Recommendations and Conclusions Idaho Power Company
Page 38
Figure 10 Curtailment of wind generation (average annual MWh)
Conversely, during periods of high customer demand, the dispatchable resources providing the balancing reserves for integrating wind are needed and thus are positioned at levels where they are ready to respond to changes in wind. While the costs to integrate wind still exist during these higher customer demand periods, the system can much more easily accommodate high levels of wind without impacting system reliability.
Issues Not Addressed by the Study The focus of this study was the variability and uncertainty of wind generation. The study then established that these attributes of wind bring about the need to have balancing reserves at the ready on system dispatchable resources, and finally that having balancing reserves for integrating wind brings about greater costs of production for the system. A consideration not addressed by the study is the increased maintenance costs expected to occur for thermal generating units called on to frequently adjust their output level in response to changes in wind production or that are switched on and off on a more frequent basis. The effect of wind integration on these costs is likely to become evident and better understood with the expanded cycling of these thermal generators accompanying the growth in wind generation over recent years.
The control of system voltage and frequency is receiving considerable attention in the wind integration community. It is widely recognized that the addition of wind generation to a power system has an impact on grid stability. On some transmission systems, controlling system voltage and frequency during large ramps in generation within acceptable limits can be challenging. Idaho Power’s system has not yet exhibited this problem at current wind penetration levels. However, growth in wind penetration beyond the current level will lead to greater challenges in maintaining system voltage and frequency within control specifications of the electric system, and likely increase the incidence of excursions where

Idaho Power Company Recommendations and Conclusions
Page 39
system frequency deviates from normal bands. The effects of frequency excursions may extend to customer equipment and operations.
Measures Facilitating Wind Integration Idaho Power recognizes the importance of staying current as operating practices evolve and innovations enabling wind integration are introduced. Some changes in operating parameters include mechanisms such as Dynamic Scheduling System (DSS), ACE Diversity Interchange (ADI), and intra-hour markets. Further development of these measures will, to varying degrees, make it easier for balancing authorities to integrate the variable and uncertain delivery of wind generation. At this time, it is Idaho Power’s judgment that the effect of these measures is not substantial enough to warrant their inclusion in the modeling performed for this study.
An additional measure that has been studied over recent years as a Western Electricity Coordinating Council (WECC) field trial is reliability-based control (RBC). The essential effect of RBC on operations is that a balancing authority is permitted to carry an imbalance between generation and demand if the imbalance helps achieve wider system stability across the aggregated balancing area of the participating entities. In effect, the balancing authority area is expanded, and the diversity of the expanded area allows an aggregate balance to be more readily maintained. Idaho Power has participated in the RBC field trial since the program’s inception, and has recognized a resulting decrease in the amount of cycling required of generating units for balancing purposes. However, the effect of RBC was not included in the modeling for this study. This omission is in part related to the status of the program as a field trial, and related uncertainty regarding the structure of RBC in the future, or whether RBC will exist at all. Moreover, while RBC may allow balancing reserves-carrying generators to not respond to changes in load or wind in real-time operations, the scheduling of these generators must still include appropriate amounts of balancing reserves because it is not known at the time of scheduling to what extent an imbalance between generation and load will be permitted.
Future Study of Wind Integration Idaho Power continues to grapple with new challenges associated with wind integration. The expansion in installed wind capacity over recent years has made the establishment of a best management plan for integrating wind problematic; the amount of installed wind simply keeps growing. It is commonly understood that wind does not always blow, leading to the legitimate concern about having backup capacity in place for when wind generators are not producing. Somewhat ironically, integration experience over recent years throughout the Pacific Northwest has led to heightened concerns about what to do when wind generators are producing and that production is not needed and unable to be stored in regional reservoirs because of minimal storage capacity, and the balancing reserves carried on dispatchable generators only add to the amount of unneeded generation. While it has been recognized that balancing reserves need to be carried for responding to wind up-ramps (i.e., balancing reserves need to be bidirectional), it has only recently become apparent that the Idaho Power system, and even the larger regional system, at times cannot provide these balancing reserves. This experience has shown that it is difficult to predict the integration challenges of tomorrow, but it is safe to say that there will be a need for continued analysis as additional tools, methods, and practices for integrating wind become available.
Idaho Power has experienced success in wind-production forecasting. The company has developed an internal forecast model which system operators are using with increasing confidence. It is likely that the future study of wind integration will make use of this forecast model, specifically in that its relative accuracy will ultimately lead to a reduction in the balancing reserves requirement for wind integration.
Recommendations and Conclusions Idaho Power Company
Page 40
However, even accurate wind forecasting cannot eliminate the need for curtailment when wind generation creates a significant imbalance between load and generation.
Finally, the wider region beyond Idaho has added considerable wind capacity over recent years, much of the growth driven by requirements associated with state-legislated renewable portfolio standards. Most of the wind generation has been added outside of local or regional integrated resource planning efforts. The addition of this generating capacity has resulted in recurring energy oversupply issues for the region, a situation that has led the BPA to propose a protocol for managing oversupply (BPA 2013). Regional market prices during these oversupply periods have experienced pronounced declines to very low or even negative levels. Sometimes even the larger regional system and larger regional market cannot successfully integrate all of the wind energy that is produced. It is critical that future modeling for studying wind integration continues to capture the regional expansion of wind generation and its effect on the wholesale market.

Idaho Power Company Literature Cited
Page 41
LITERATURE CITED Bonneville Power Administration (BPA). February 2013. Oversupply management protocol, version 2.
http://transmission.bpa.gov/ts_business_practices/Content/9_Redispatch_and_Curtailment/Oversupply_mgt_protocol.htm. Accessed on: February 2, 2013.
Denholm, P., E. Ela, B. Kirby, and M. Milligan 2010. The role of energy storage with renewable electricity generation. U.S. Department of Energy, Office of Energy Efficiency and Renewable Energy, National Renewable Energy Laboratory. Technical Report NREL/TP-6A2-47187, January 2010.
GE Energy 2010. Western wind and solar integration study. Prepared for: U.S. Department of Energy, Office of Energy Efficiency and Renewable Energy, National Renewable Energy Laboratory. Subcontract Report NREL/SR-550-47434, May 2010.

Literature Cited Idaho Power Company
Page 42
This page left blank intentionally.

Idaho Power Company Appendix A
Page 43
Appendix A. May 9, 2012, Explanation on wind data
WIND INTEGRATION WORKSHOP
STUDY WIND DATA EXPLANATION MAY 9, 2012 Idaho Power received questions during the April 6 wind integration workshop related to the synthetic wind data used for its study of wind integration. The company recognizes the importance of using high-quality wind data, and consequently indicated at the workshop that it would thoughtfully review the wind data in an effort to address the questions raised. As stated at the workshop, the wind data used for the study were provided by 3TIER. 3TIER provided these data for 43 wind project locations requested by Idaho Power corresponding to project sites having a current purchase agreement with the company, as well as sites proposed to the company for purchase agreement. The 43 wind project locations are given as Attachment No. 3 to comments filed by Idaho Power with the IPUC on December 22, 20103. It is important to note that 3TIER did not select from the more than 32,000 existing or hypothetical wind project sites used for the Western Wind and Solar Integration Study (WWSIS), but instead pulled new time series directly from the WWSIS gridded model data set precisely at the 43 locations requested by Idaho Power. Thus, the geographic diversity of the synthetic wind data provided by 3TIER is representative of the geographic diversity for projects proposed to Idaho Power. 3TIER also provided a synthetic day-ahead forecast for the wind generation time series. In providing this forecast, 3TIER notes that a bias found in the forecast during completion of the WWSIS was corrected on a site-by-site basis for the Idaho Power wind study, as opposed to the regional bias correction used for the WWSIS. The site specific correction is preferable to the regional correction because it mimics real forecasting practice, where project data at each site would be used to eliminate long-term bias from the forecast. With respect to accuracy of the synthetic day-ahead forecast, 3TIER reports that hourly wind speed forecast errors for ten operational sites in Idaho or neighboring states were compared to similarly calculated errors for the synthetic day-ahead forecast. 3TIER reports that this comparison yielded values for mean absolute error and root mean squared error for the synthetic day-ahead forecast only about 15% higher than equivalent statistics for the real errors at the ten operational sites in the Idaho vicinity. This result suggests that the error characteristics of the synthetic forecasts are very similar to those of actual wind forecasts. To validate the synthetic actual wind time series, 3TIER has completed validation reports describing the results of comparisons between the synthetic wind data and public tower data. The complete set of validation reports for the WWSIS can be found through the NREL website4. Five of the validation towers are located in Idaho. Review of these reports indicates that the synthetic actual wind time series capture the seasonal and diurnal wind cycles fairly well; however, the synthetic time series are consistently low biased, at a 3TIER-reported average level of about -1.2 m/s at the five validation sites. There is basis in suggesting that the low bias, while reducing the total production of modeled wind projects, would have minimal impact on the overall variability of the synthetic actual wind time series, and would consequently have little effect on the estimated integration cost. 3 Idaho Power Comments, Idaho Public Utilities Commission Case GNR-E-10-04, Attachment No. 3. 4 http://wind.nrel.gov/public/WWIS/ValidationReports/wwis_vrpts.html#vmap

Appendix A Idaho Power Company
Page 44
However, Idaho Power recognizes the critical nature of the synthetic wind data used for the study, and will discuss this low bias further with the technical review committee it has formed.
Finally, the synthetic actual wind time series created for the WWSIS have been found to exhibit excessive ramping as described in the WWSIS final report and as reported by NREL5. The excessive ramping in the WWSIS wind data occurs because the mesoscale model used to generate the synthetic wind data was run in 3-day sections. Smoothing techniques were used to reduce the ramping across the seam at the end of each third day; however, 3TIER reports that excessive variability remains in the WWSIS wind data. 3TIER also reports that review of the synthetic actual wind time series data pulled for the Idaho Power study indicates similar excessive ramping, with ramps tending to be 1.5 to 2.0 times larger from two hours before to eight hours after the start of every third day. While Idaho Power intends to discuss this condition with its technical review committee, the company believes that only a small fraction of hours are affected, and that consequently the impacts on integration cost are likely small.
Idaho Power hopes that this follow-up helps to address questions on the wind data raised at the April 6 workshop. We value the questions and feedback received from workshop participants, and welcome remaining questions related to the wind data or other features of the wind study. We are planning a meeting with our technical review committee in early May, and are looking forward to the added value this group will bring to our effort.
Idaho Power, 1221 W Idaho Street, Boise, Idaho 83702
email:[email protected]
5 http://www.nrel.gov/wind/integrationdatasets/pdfs/western/2009/western_dataset_irregularity.pdf

Idaho Power Company Appendix B
Page 45
Appendix B. Wind data summaries
Table B1 Monthly and annual capacity factors (percent of installed nameplate capacity)
Nameplate Wind Month 800 MW 1,000 MW 1,200 MW January 30% 30% 30% February 20% 20% 19% March 31% 32% 32% April 38% 38% 37% May 24% 24% 24% June 29% 29% 29% July 20% 19% 19% August 17% 17% 17% September 18% 18% 18% October 23% 23% 23% November 36% 35% 35% December 38% 38% 38% Annual 27% 27% 27% Note: Wind generation data for study provided by 3TIER.

Appendix B Idaho Power Company
Page 46
This page left blank intentionally.