wind power in the electricity mix today and tomorro · 2016-02-13 · wind power in the electricity...
TRANSCRIPT
© OECD/IEA 2014 © OECD/IEA 2014
Wind Power in the Electricity Mix Today and Tomorrow
Dr. Paolo Frankl Head, Renewable Energy Division International Energy Agency
Intercontinental Wind Power Congress 2015, Istanbul, 1 April 2015
© OECD/IEA 2014
In 2040…
1. Wind larger than coal worldwide?
2. First source of electricity in Europe?
Yes! According to the WEO 2014 450 Scenario
© OECD/IEA 2014
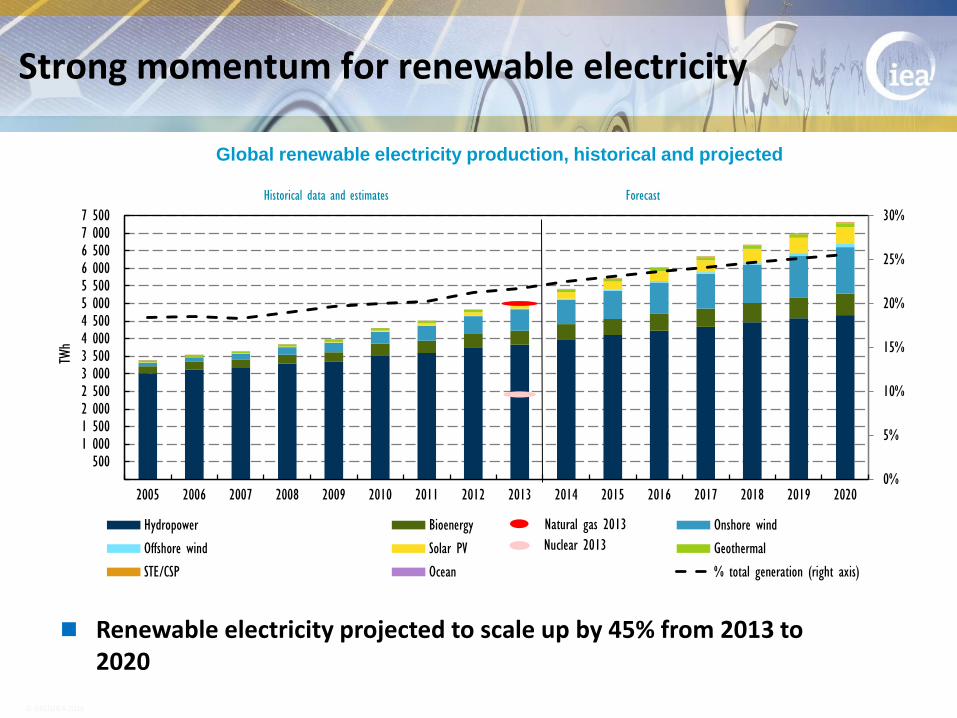
Strong momentum for renewable electricity
Renewable electricity projected to scale up by 45% from 2013 to 2020
Global renewable electricity production, historical and projected
0%
5%
10%
15%
20%
25%
30%
5001 0001 5002 0002 5003 0003 5004 0004 5005 0005 5006 0006 5007 0007 500
2005 2006 2007 2008 2009 2010 2011 2012 2013 2014 2015 2016 2017 2018 2019 2020
TWh
Hydropower Bioenergy Onshore wind
Offshore wind Solar PV Geothermal
STE/CSP Ocean % total generation (right axis)
Historical data and estimates Forecast
Natural gas 2013
Nuclear 2013
© OECD/IEA 2014
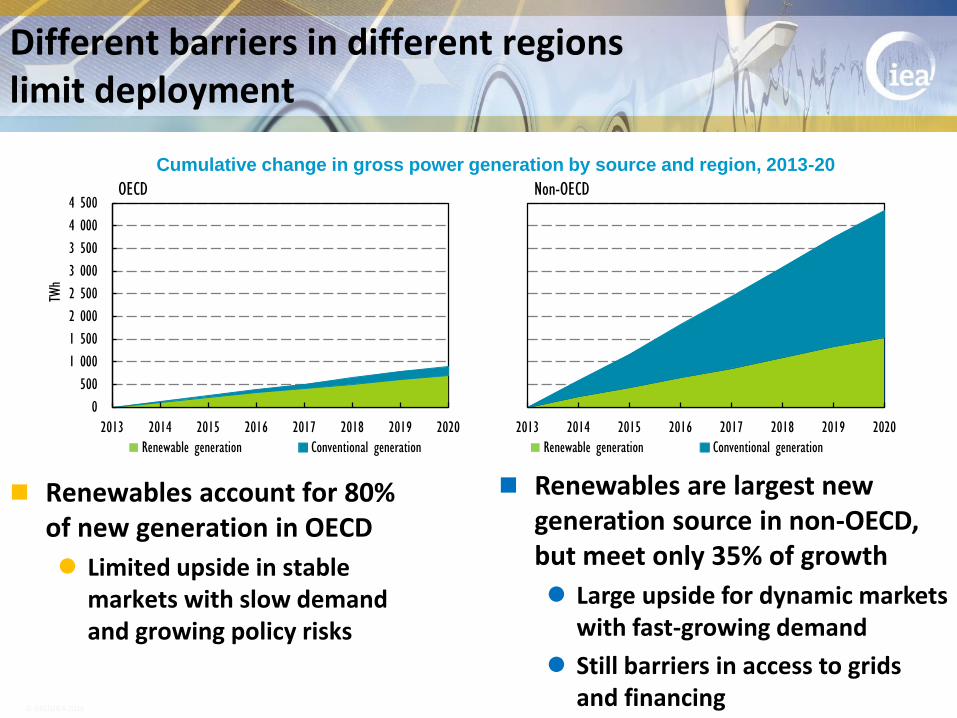
Different barriers in different regions limit deployment
Renewables account for 80% of new generation in OECD
Limited upside in stable markets with slow demand and growing policy risks
Cumulative change in gross power generation by source and region, 2013-20
Renewables are largest new generation source in non-OECD, but meet only 35% of growth
Large upside for dynamic markets with fast-growing demand
Still barriers in access to grids and financing
0
500
1 000
1 500
2 000
2 500
3 000
3 500
4 000
4 500
2013 2014 2015 2016 2017 2018 2019 2020
TWh
OECD
Renewable generation Conventional generation
2013 2014 2015 2016 2017 2018 2019 2020
Non-OECD
Renewable generation Conventional generation
© OECD/IEA 2014
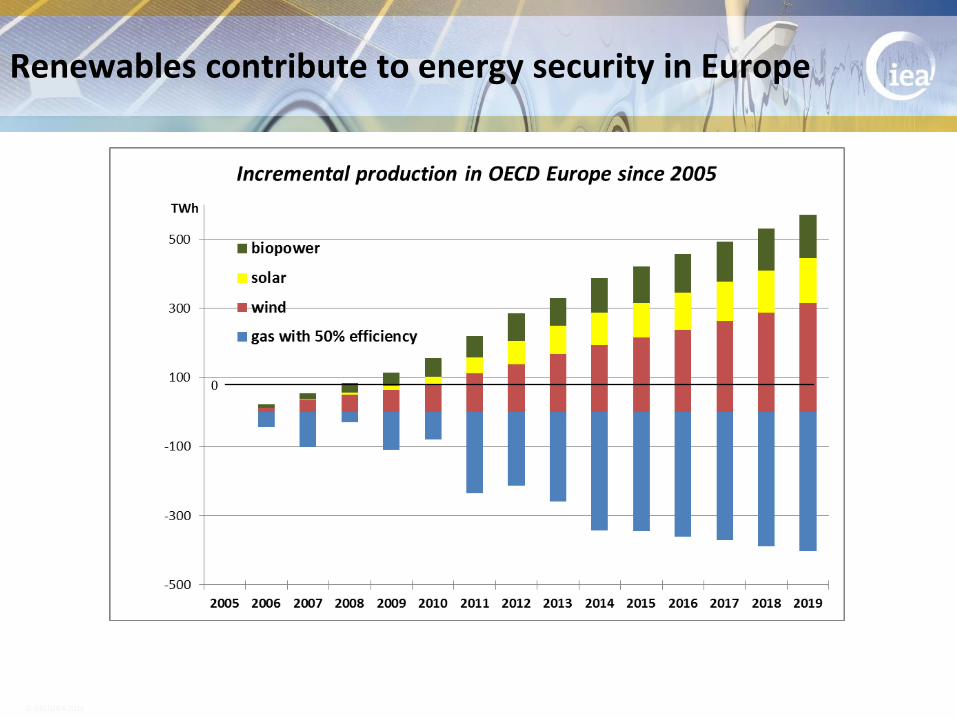
Renewables contribute to energy security in Europe
0
© OECD/IEA 2014
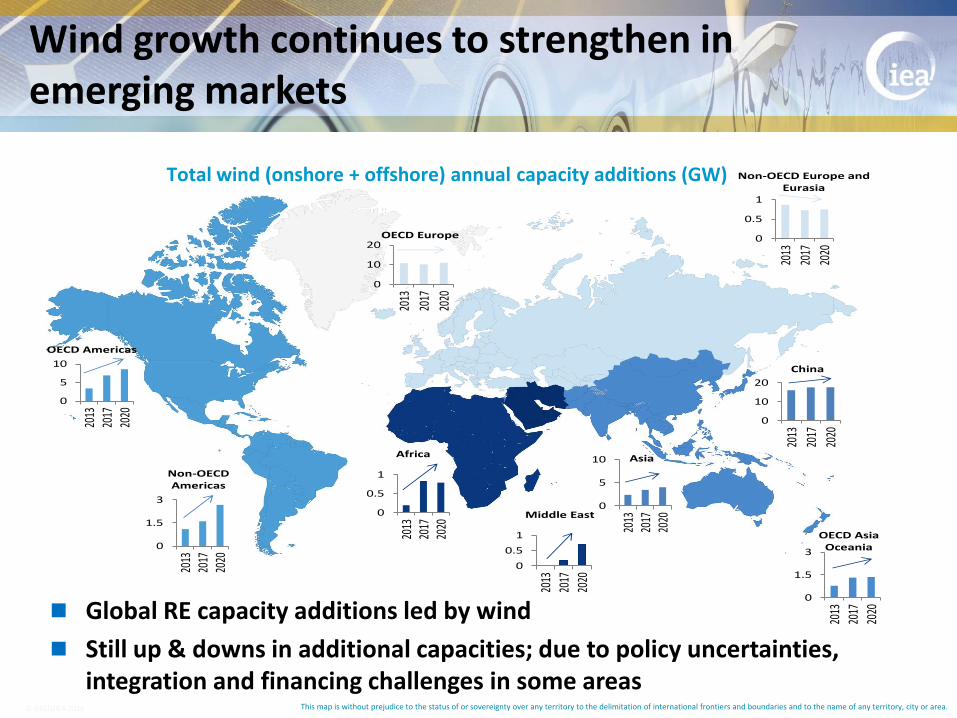
Total wind (onshore + offshore) annual capacity additions (GW)
Wind growth continues to strengthen in emerging markets
This map is without prejudice to the status of or sovereignty over any territory to the delimitation of international frontiers and boundaries and to the name of any territory, city or area.
0
5
10
2013
2017
2020
0
1.5
3
2013
2017
2020
OECD Americas
Non-OECD Americas
0
0.5
1
2013
2017
2020
Africa
0
0.5
120
13
2017
2020
Middle East
0
1.5
3
2013
2017
2020
OECD Asia Oceania
0
10
20
2013
2017
2020
China
0
5
10
2013
2017
2020
Asia
0
10
20
2013
2017
2020
OECD Europe 0
0.5
1
2013
2017
2020
Non-OECD Europe and Eurasia
Global RE capacity additions led by wind
Still up & downs in additional capacities; due to policy uncertainties, integration and financing challenges in some areas
© OECD/IEA 2014
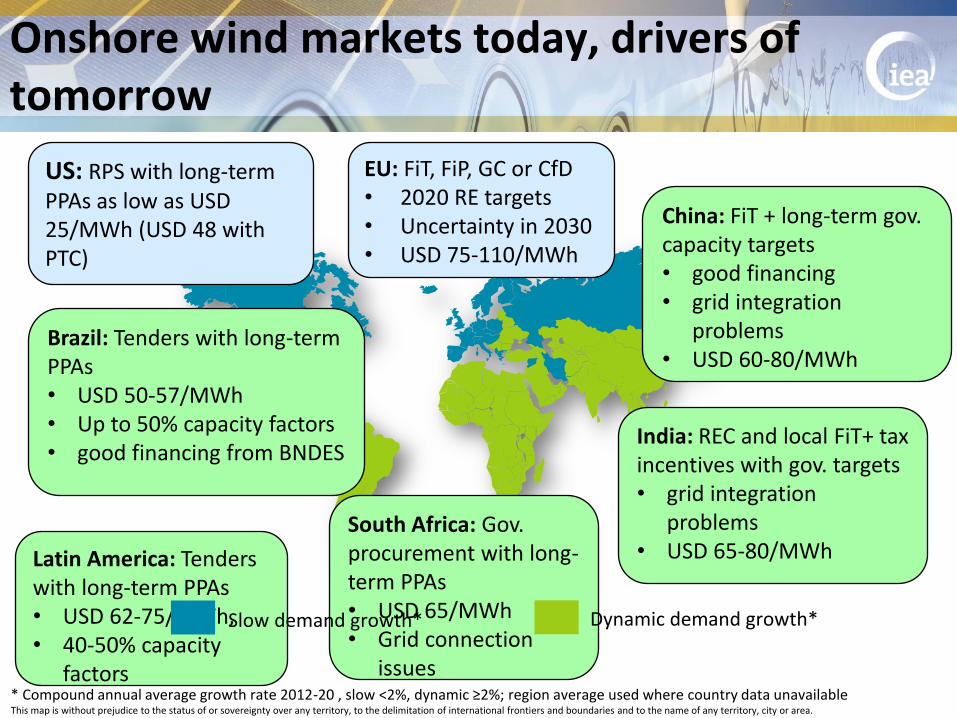
Onshore wind markets today, drivers of tomorrow
US: RPS with long-term PPAs as low as USD 25/MWh (USD 48 with PTC)
Brazil: Tenders with long-term PPAs • USD 50-57/MWh • Up to 50% capacity factors • good financing from BNDES
Latin America: Tenders with long-term PPAs • USD 62-75/MWh, • 40-50% capacity
factors
South Africa: Gov. procurement with long-term PPAs • USD 65/MWh • Grid connection
issues
EU: FiT, FiP, GC or CfD • 2020 RE targets • Uncertainty in 2030 • USD 75-110/MWh
China: FiT + long-term gov. capacity targets • good financing • grid integration
problems • USD 60-80/MWh
India: REC and local FiT+ tax incentives with gov. targets • grid integration
problems • USD 65-80/MWh
Slow demand growth* Dynamic demand growth*
* Compound annual average growth rate 2012-20 , slow <2%, dynamic ≥2%; region average used where country data unavailable This map is without prejudice to the status of or sovereignty over any territory, to the delimitation of international frontiers and boundaries and to the name of any territory, city or area.
© OECD/IEA 2014
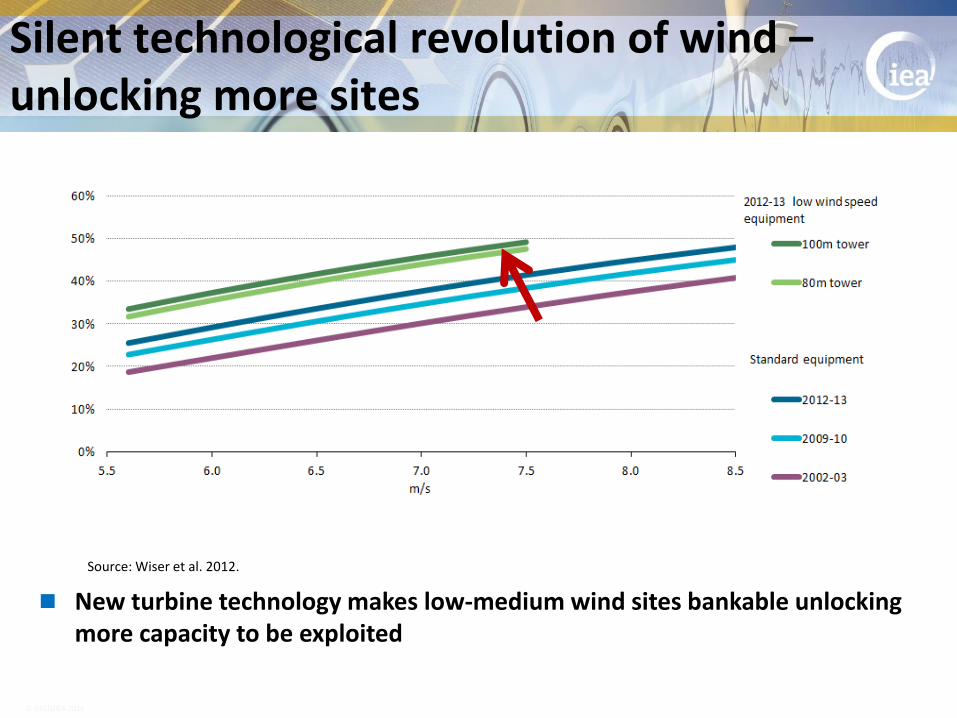
Silent technological revolution of wind – unlocking more sites
New turbine technology makes low-medium wind sites bankable unlocking more capacity to be exploited
Source: Wiser et al. 2012.
© OECD/IEA 2014
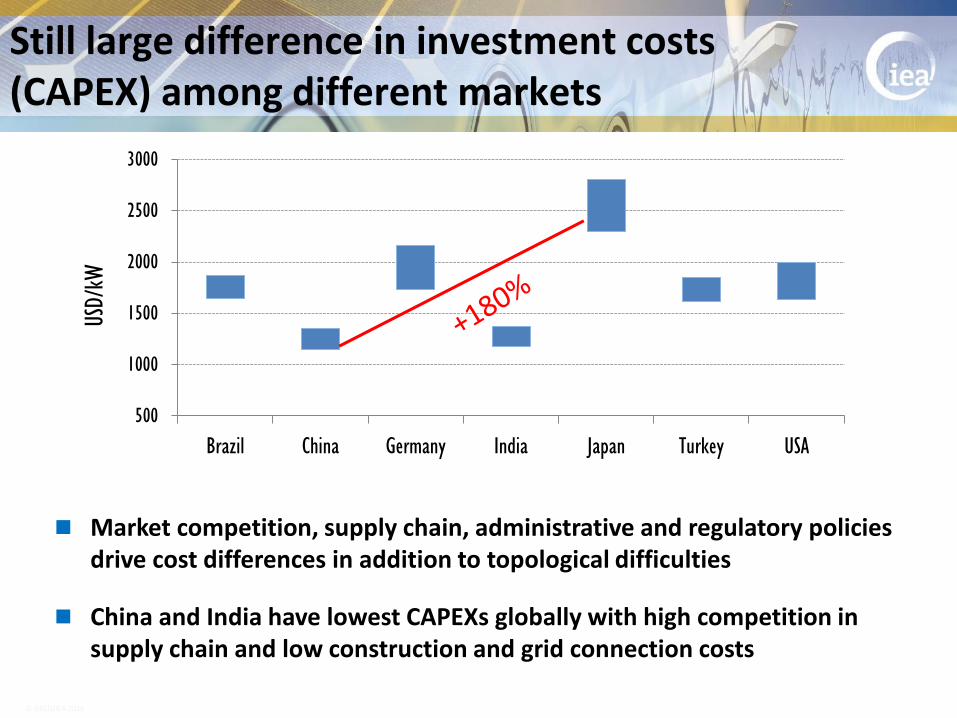
Still large difference in investment costs (CAPEX) among different markets
Market competition, supply chain, administrative and regulatory policies drive cost differences in addition to topological difficulties
China and India have lowest CAPEXs globally with high competition in supply chain and low construction and grid connection costs
500
1000
1500
2000
2500
3000
Brazil China Germany India Japan Turkey USA
USD/
kW
© OECD/IEA 2014
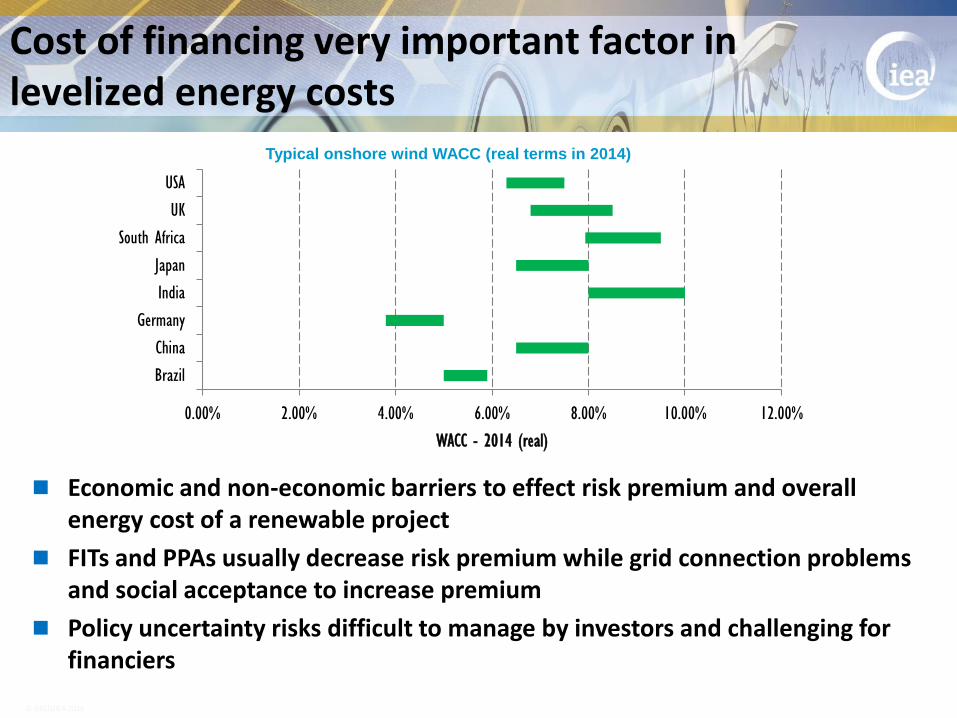
Cost of financing very important factor in levelized energy costs
Economic and non-economic barriers to effect risk premium and overall energy cost of a renewable project
FITs and PPAs usually decrease risk premium while grid connection problems and social acceptance to increase premium
Policy uncertainty risks difficult to manage by investors and challenging for financiers
0.00% 2.00% 4.00% 6.00% 8.00% 10.00% 12.00%
Brazil
China
Germany
India
Japan
South Africa
UK
USA
WACC - 2014 (real)
Typical onshore wind WACC (real terms in 2014)

© OECD/IEA 2014
Large ranges in LCOEs persist Offshore wind costs higher but decreasing
Lower onshore LCOEs values already possible in exceptional sites with good financing
Can offshore wind have the same success story of onshore wind?
Latest tender prices indicate an ambitious cost reduction goals in 2019-2020. Long-term policy framework is an important factor to achieve significant cost reductions.
Typical onshore wind LCOEs (2006-2020) Typical offshore wind LCOEs (2006-2020)
0
50
100
150
200
250
300
2006 2008 2010 2012 2014 2016 2018 2020
UK CfD Denmark Horns Rev 3
0
50
100
150
200
250
300
2006 2008 2010 2012 2014 2016 2018 2020
USD
2014
/MWh
Brazil PPAs US PPAsHorns Rev 3 project PPA does not include grid connection costs (+15-25%).
© OECD/IEA 2014
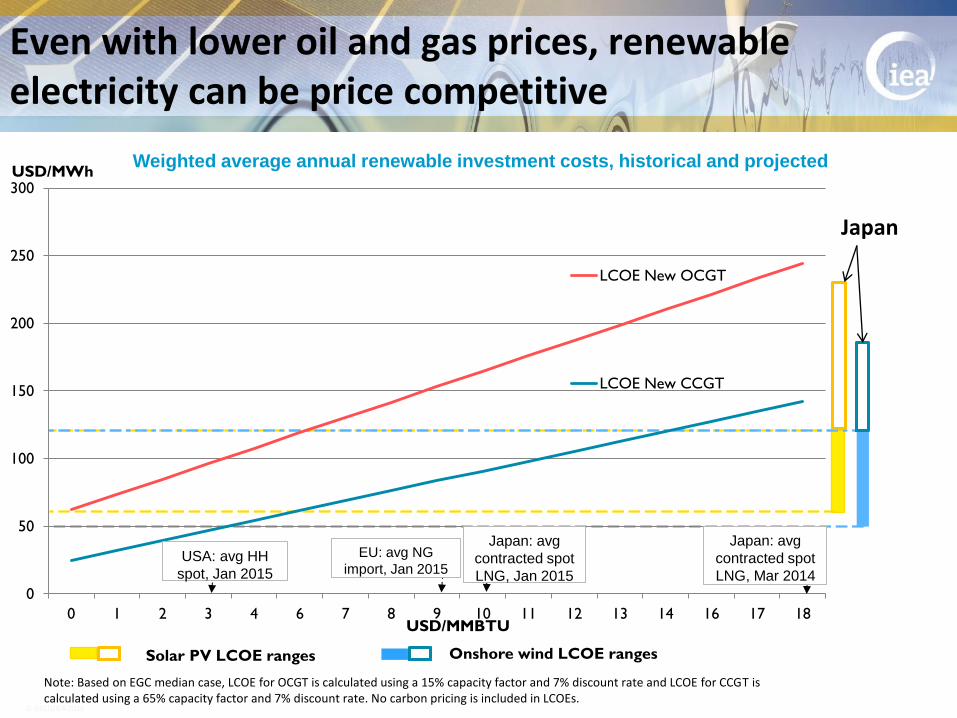
Even with lower oil and gas prices, renewable electricity can be price competitive
Weighted average annual renewable investment costs, historical and projected
Note: Based on EGC median case, LCOE for OCGT is calculated using a 15% capacity factor and 7% discount rate and LCOE for CCGT is calculated using a 65% capacity factor and 7% discount rate. No carbon pricing is included in LCOEs.
0
50
100
150
200
250
300
0 1 2 3 4 6 7 8 9 10 11 12 13 14 16 17 18
USD/MWh
USD/MMBTU
LCOE New OCGT
LCOE New CCGT
Japan: avg
contracted spot
LNG, Jan 2015
USA: avg HH
spot, Jan 2015
EU: avg NG
import, Jan 2015
Japan: avg
contracted spot
LNG, Mar 2014
Solar PV LCOE ranges Onshore wind LCOE ranges
Japan

© OECD/IEA 2014
Grid Integration is the key challenge
“Renewable energies such as sun, hydro or wind cannot
cover more than 4% of our electricity consumption – even in the long run” (Die Zeit, 1993).
Today: Portugal and Denmark >90% vRE share for several days
© OECD/IEA 2014
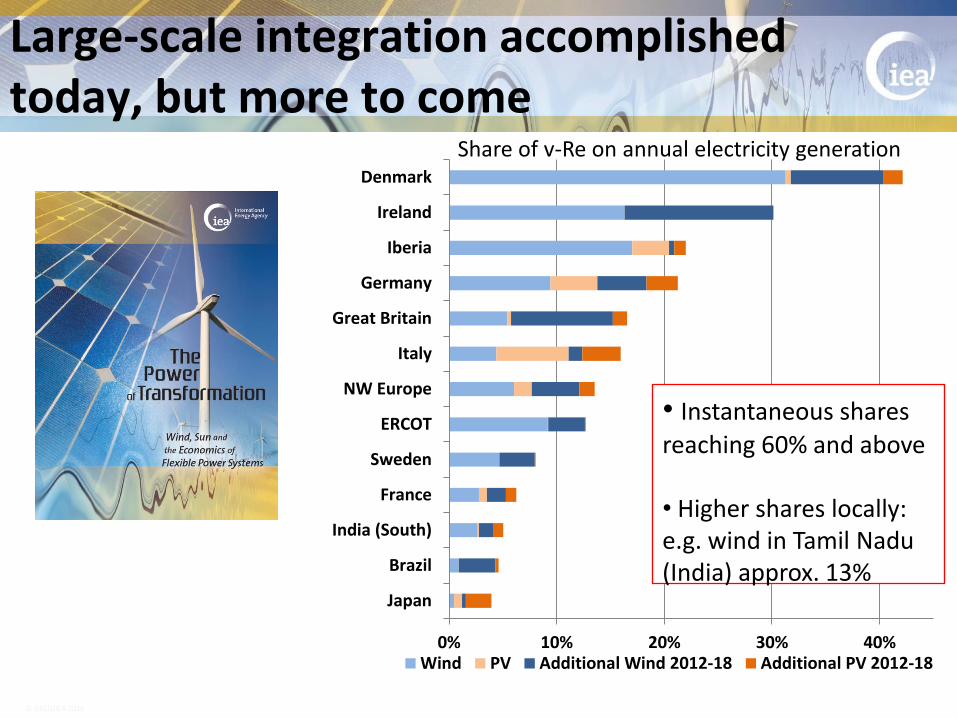
Large-scale integration accomplished today, but more to come
0% 10% 20% 30% 40%
Japan
Brazil
India (South)
France
Sweden
ERCOT
NW Europe
Italy
Great Britain
Germany
Iberia
Ireland
Denmark
Wind PV Additional Wind 2012-18 Additional PV 2012-18
Share of v-Re on annual electricity generation
• Instantaneous shares
reaching 60% and above • Higher shares locally: e.g. wind in Tamil Nadu (India) approx. 13%
© OECD/IEA 2014
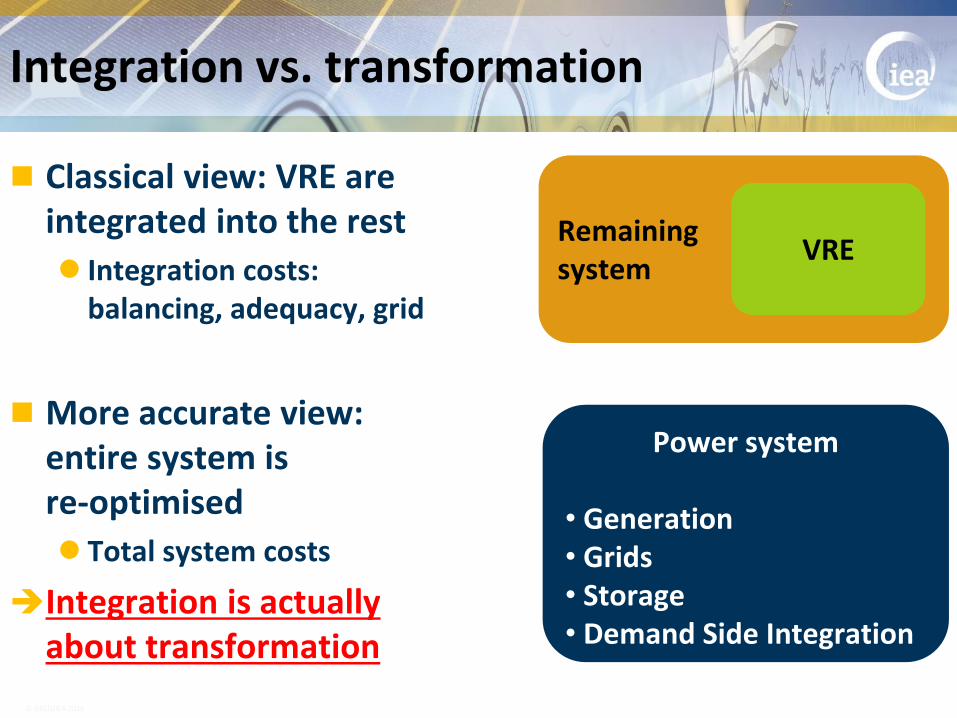
Integration vs. transformation
Classical view: VRE are integrated into the rest
Integration costs: balancing, adequacy, grid
More accurate view: entire system is re-optimised
Total system costs
Integration is actually about transformation
Remaining system
VRE
Power system • Generation • Grids • Storage • Demand Side Integration
© OECD/IEA 2014
0
20
40
60
80
100
120
140
Legacy
low grid costs
Legacy
high grid costs
Transformed generation &
8% DSI, low grid costs
0% VRE
Tota
l sys
tem
co
sts
(USD
/MW
h)
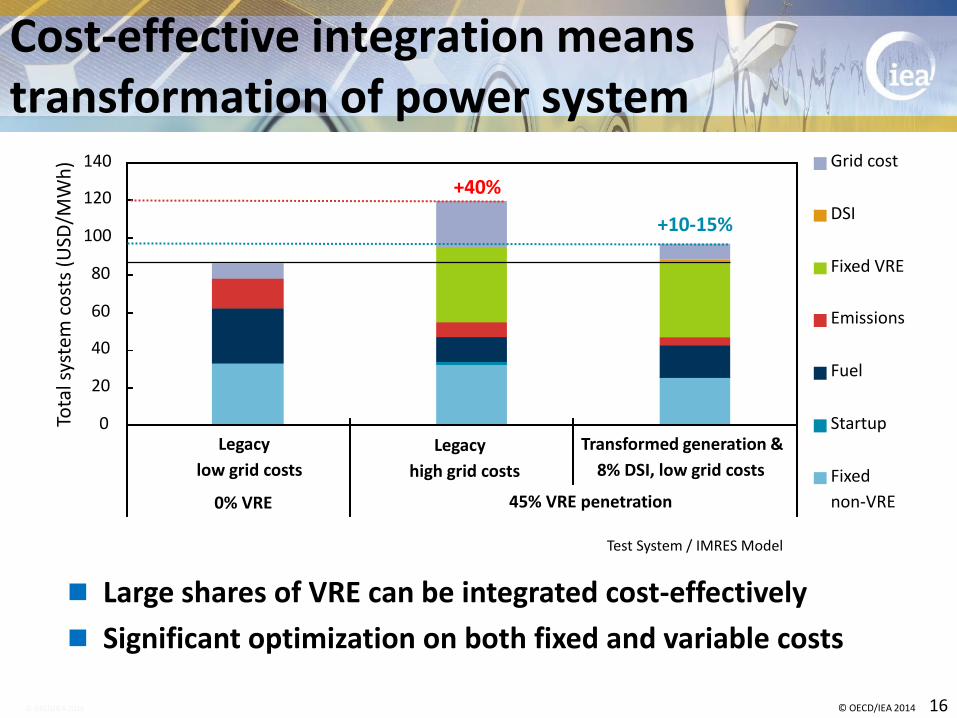
Cost-effective integration means transformation of power system
© OECD/IEA 2014 16
Large shares of VRE can be integrated cost-effectively
Significant optimization on both fixed and variable costs
Test System / IMRES Model
45% VRE penetration
Grid cost
DSI
Fixed VRE
Emissions
Fuel
Startup
Fixed
non-VRE
+40%
+10-15%
© OECD/IEA 2014
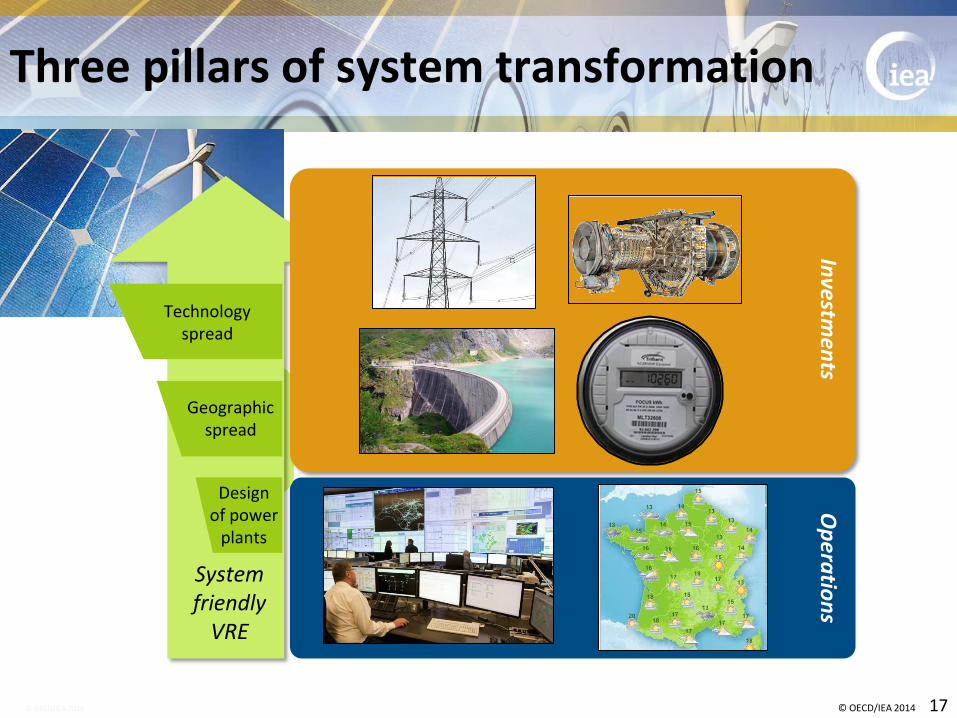
2. Make better use of
what you have
Op
eratio
ns
1. Let wind and solar play their
part
3. Take a system wide-strategic
approach to investments!
System friendly
VRE
Technology spread
Geographic spread
Design of power
plants
Three pillars of system transformation
© OECD/IEA 2014 17
Investm
ents
© OECD/IEA 2014
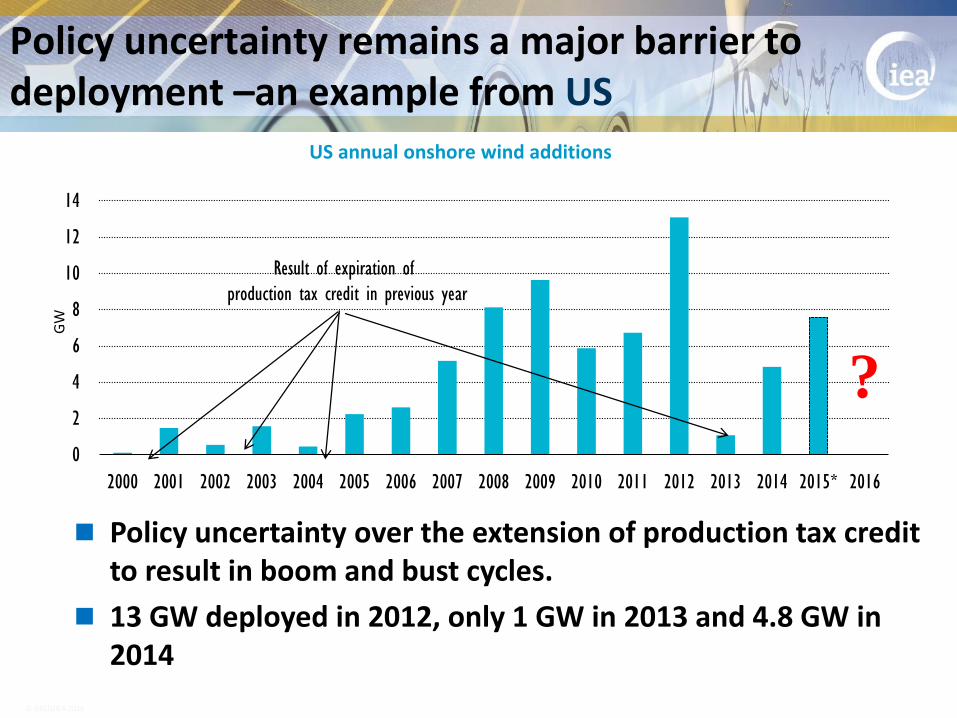
Policy uncertainty remains a major barrier to deployment –an example from US
Policy uncertainty over the extension of production tax credit to result in boom and bust cycles.
13 GW deployed in 2012, only 1 GW in 2013 and 4.8 GW in 2014
US annual onshore wind additions
0
2
4
6
8
10
12
14
2000 2001 2002 2003 2004 2005 2006 2007 2008 2009 2010 2011 2012 2013 2014 2015* 2016
GW
Result of expiration of
production tax credit in previous year
?
© OECD/IEA 2014
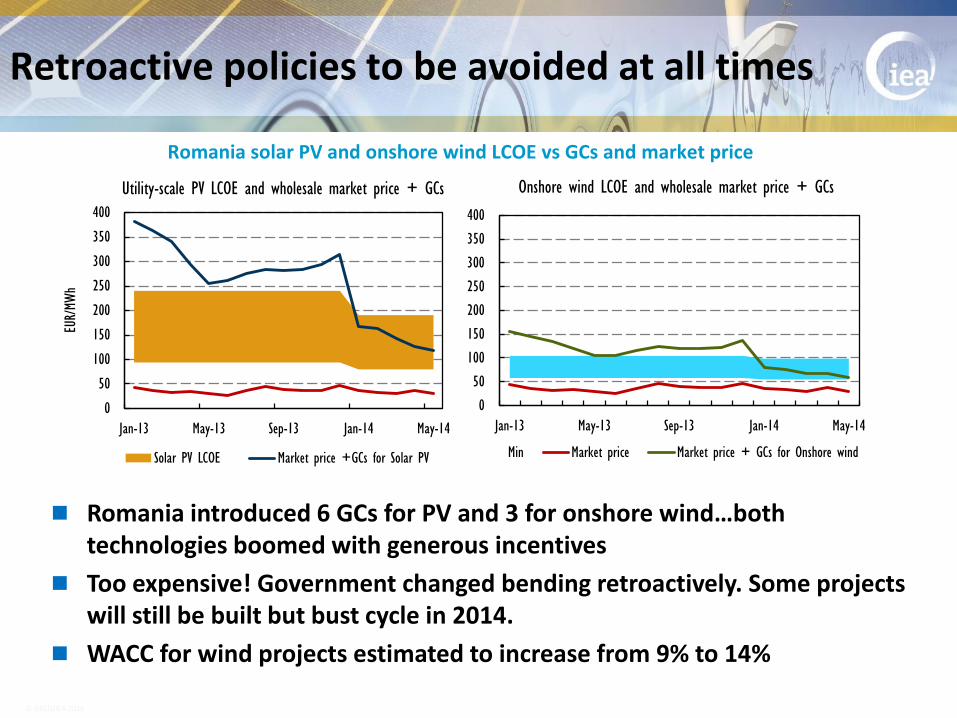
Retroactive policies to be avoided at all times
Romania introduced 6 GCs for PV and 3 for onshore wind…both technologies boomed with generous incentives
Too expensive! Government changed bending retroactively. Some projects will still be built but bust cycle in 2014.
WACC for wind projects estimated to increase from 9% to 14%
Romania solar PV and onshore wind LCOE vs GCs and market price
0
50
100
150
200
250
300
350
400
Jan-13 May-13 Sep-13 Jan-14 May-14
EUR/MW
h
Utility-scale PV LCOE and wholesale market price + GCs
Solar PV LCOE Market price +GCs for Solar PV
0
50
100
150
200
250
300
350
400
Jan-13 May-13 Sep-13 Jan-14 May-14
Onshore wind LCOE and wholesale market price + GCs
Min Market price Market price + GCs for Onshore wind
© OECD/IEA 2014
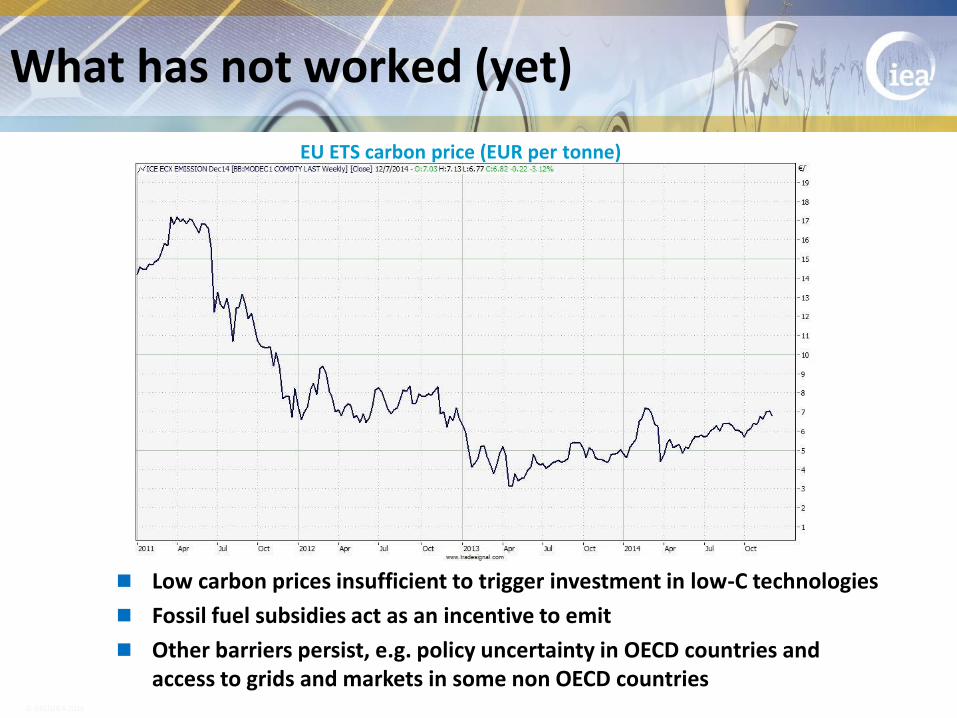
What has not worked (yet)
Low carbon prices insufficient to trigger investment in low-C technologies
Fossil fuel subsidies act as an incentive to emit
Other barriers persist, e.g. policy uncertainty in OECD countries and access to grids and markets in some non OECD countries
EU ETS carbon price (EUR per tonne)
© OECD/IEA 2014
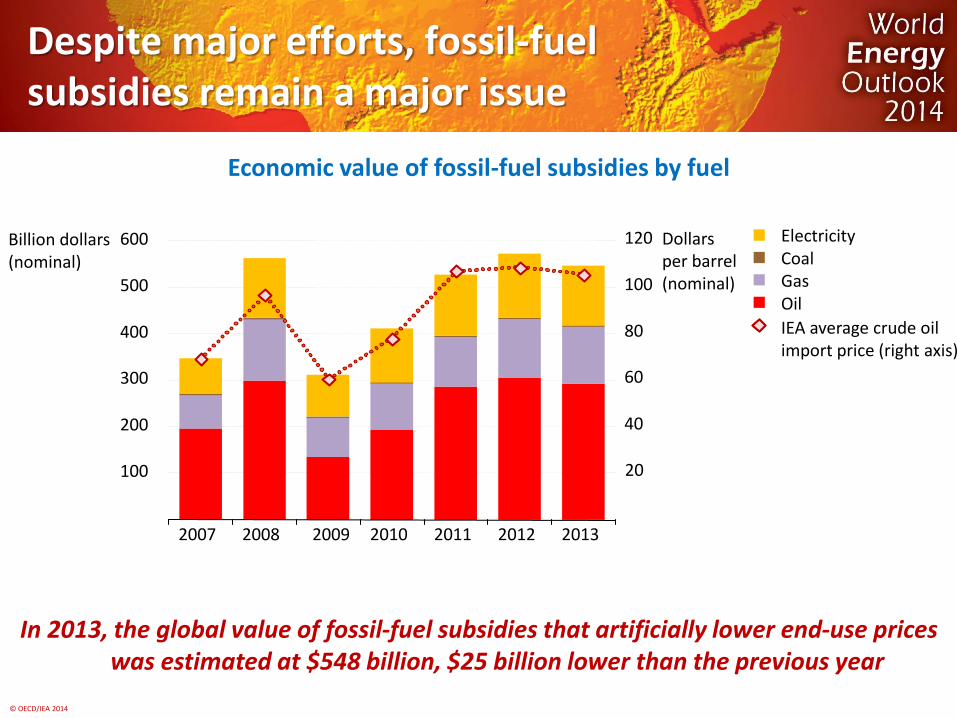
Despite major efforts, fossil-fuel subsidies remain a major issue
Economic value of fossil-fuel subsidies by fuel
In 2013, the global value of fossil-fuel subsidies that artificially lower end-use prices was estimated at $548 billion, $25 billion lower than the previous year
100
200
300
400
500
600 Billion dollars (nominal)
20
40
60
80
100
120 Dollars per barrel (nominal)
Electricity
Coal Gas Oil
IEA average crude oil import price (right axis)
2007 2008 2009 2010 2011 2012 2013
© OECD/IEA 2014
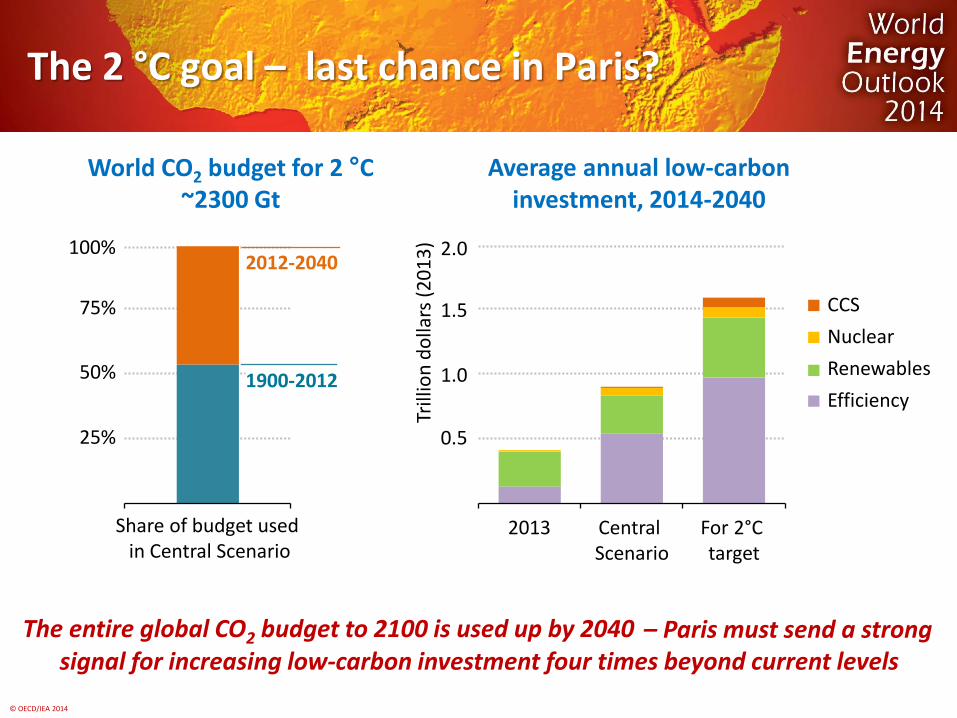
The entire global CO2 budget to 2100 is used up by 2040 – Paris must send a strong signal for increasing low-carbon investment four times beyond current levels
The 2 °C goal – last chance in Paris?
World CO2 budget for 2 °C ~2300 Gt
25%
50%
75%
100%
Share of budget used in Central Scenario
1900-2012
2012-2040
Average annual low-carbon investment, 2014-2040
Central Scenario
For 2°C target
2013
CCS
Nuclear
Renewables
Efficiency
The entire global CO2 budget to 2100 is used up by 2040
0.5
1.0
1.5
2.0
Trill
ion
do
llars
(2
01
3)
© OECD/IEA 2014
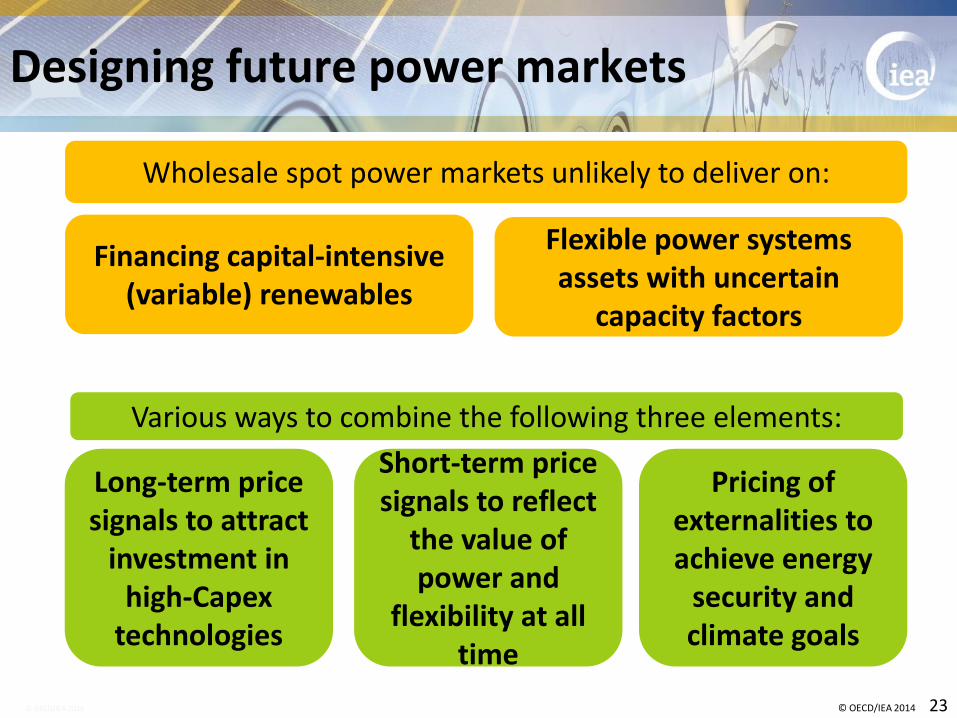
Designing future power markets
© OECD/IEA 2014 23
Short-term price signals to reflect
the value of power and
flexibility at all time
Wholesale spot power markets unlikely to deliver on:
Various ways to combine the following three elements:
Financing capital-intensive (variable) renewables
Flexible power systems assets with uncertain
capacity factors
Long-term price signals to attract
investment in high-Capex
technologies
Pricing of externalities to achieve energy
security and climate goals
© OECD/IEA 2014
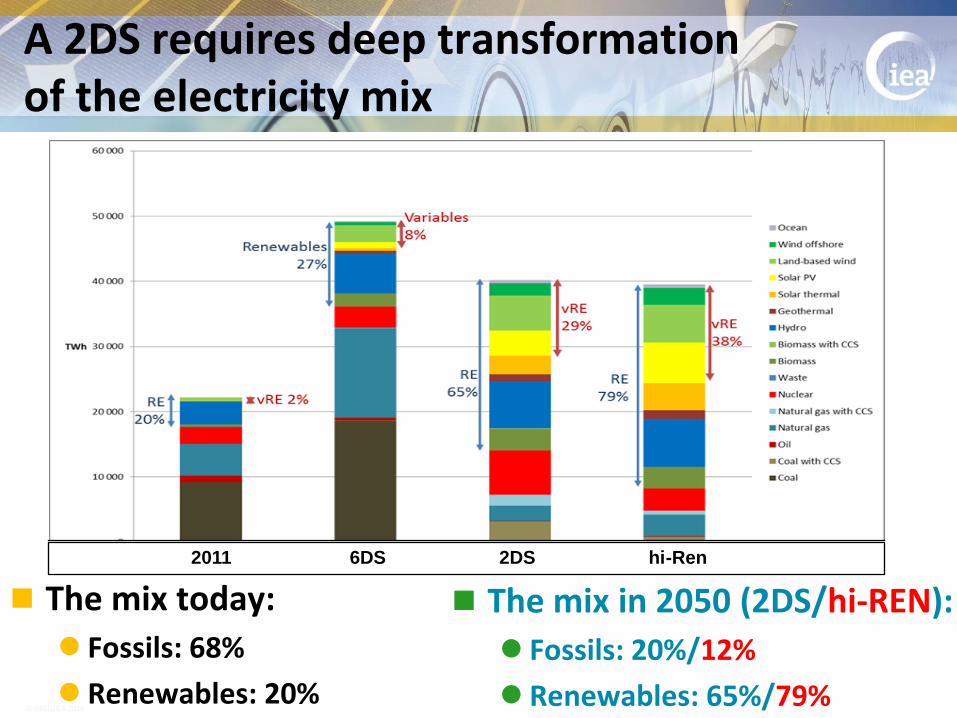
2011 6DS 2DS hi-Ren
The mix today:
Fossils: 68%
Renewables: 20%
The mix in 2050 (2DS/hi-REN):
Fossils: 20%/12%
Renewables: 65%/79%
A 2DS requires deep transformation of the electricity mix

© OECD/IEA 2014
Wind power to provide 15% to 18% of global electricity
China, Europe and the USA together account for two thirds
Wind power deployment to 2050
0%
2%
4%
6%
8%
10%
12%
14%
16%
18%
20%
0
1000
2000
3000
4000
5000
6000
7000
8000
of
glo
bal
ele
ctr
icit
y p
rod
ucti
on
Win
d T
Wh
/yr
2DS
China OECD Europe United States Other Developing Asia
Middle East OECD Asia Oceanic Other OECD NA Africa
India Eastern Europe and FSU Latin America hiRen (TWh)
share of total hiRen (share)
© OECD/IEA 2014
Concluding remarks
High levels of financial support no longer required for RE electricity (wind in particular) if appropriate market and regulatory framework in place
However, solutions to future development rest in policy makers’ hands Policy risk main barrier to investment
Electricity markets sub-optimal today for low-carbon generation
Policies and market design should focus on fostering Competition,
Innovation
Flexible energy systems
Pricing of carbon and other externalities