wind power integration and transmission: addressing some common misconceptions governors wind energy...
TRANSCRIPT
Wind Power Integration and Transmission:Addressing Some Common Misconceptions
Governors Wind Energy Coalition Transmission BriefingNovember 3, 2011 Washington, DC
Ed DeMeoRenewable Energy Consulting Services, Inc.
Technical Advisor: Governors Wind Energy Coalition(EPRI Renewable Energy Programs, 1976-1998)
650 327 3090
Key Questions
What benefits are expected from wind power?
Will these benefits actually be realized?
Address common misconceptions in the context of these questions
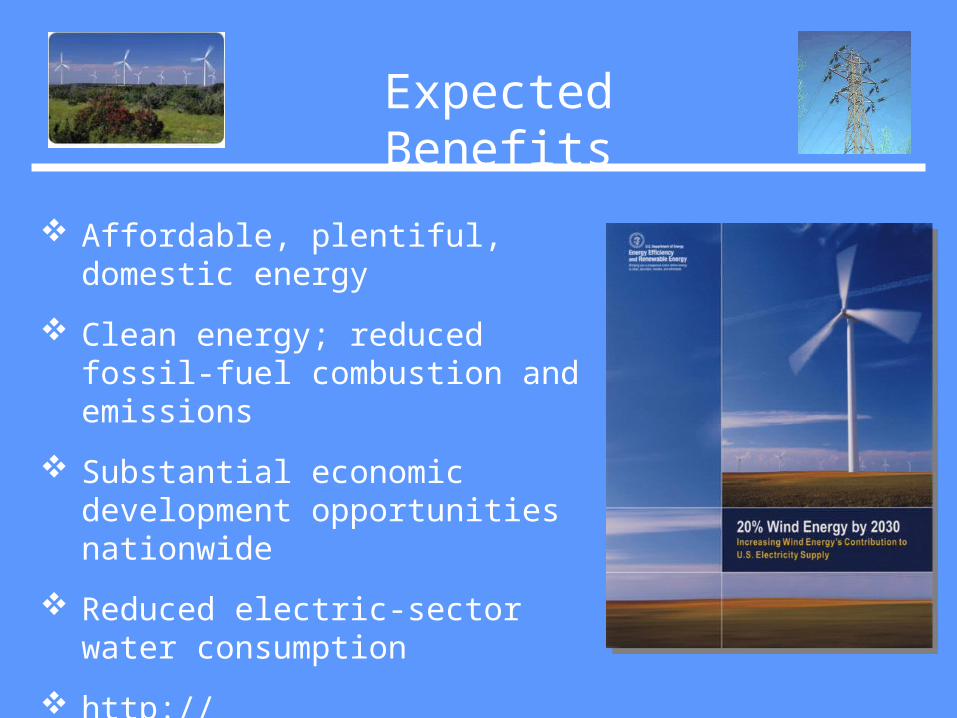
Expected Benefits
Affordable, plentiful, domestic energy
Clean energy; reduced fossil-fuel combustion and emissions
Substantial economic development opportunities nationwide
Reduced electric-sector water consumption
http://www.20percentwind.org
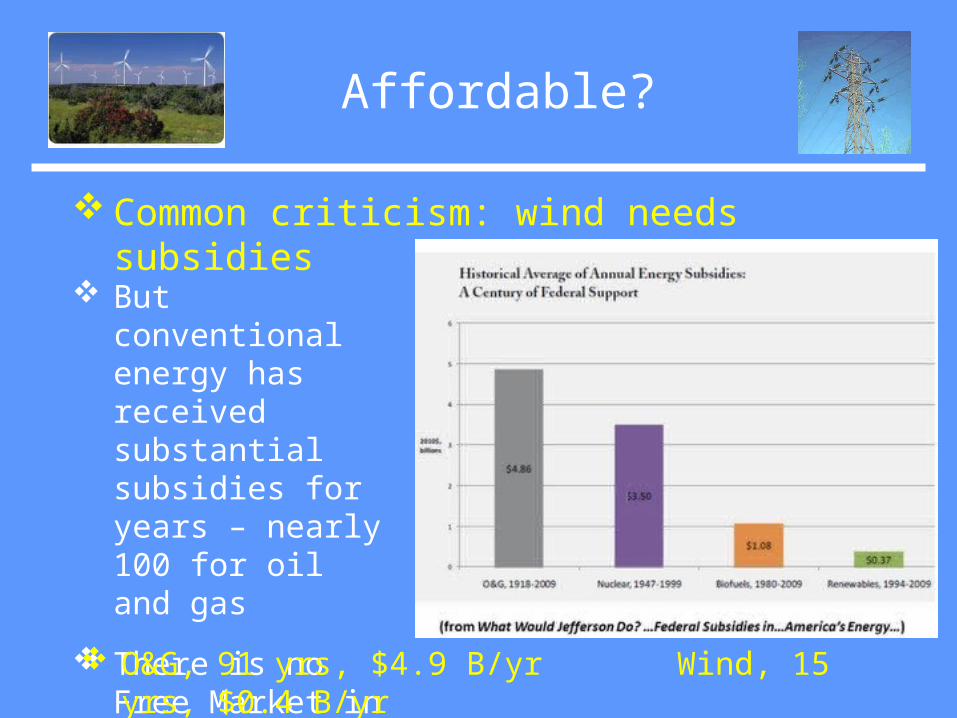
Affordable?
Common criticism: wind needs subsidies
But conventional energy has received substantial subsidies for years – nearly 100 for oil and gas
There is no Free Market in energy!
O&G, 91 yrs, $4.9 B/yr Wind, 15 yrs, $0.4 B/yr
Affordable?
Common criticism: wind’s variability and uncertainty require one-for-one backup and greatly increase power-system operating costs
Balance between demand and generation needs to be continually maintained
Wind’s variability and uncertainty complicates the balancing process over minutes, hours, days
But utilities are used to dealing with variability in demand
Wind’s challenge is one of degree, not kind
One-for-One Backup?
Does a megawatt of wind require a megawatt of conventional backup?

One-for-One Backup?
Does a megawatt of wind require a megawatt of conventional backup? No power plant has dedicated backup All plants work together to serve system
demand for electric energy Generation mix includes reserves to
accommodate a wide range of potential contingencies (10-15%)
Substantial wind increases the need for reserves, increasing operating costs
Incremental operating costs: integration costs
One-for-One Backup?
Does a megawatt of wind require a megawatt of conventional backup? No power plant has dedicated backup All plants work together to serve system
demand for electric energy Generation mix includes reserves to
accommodate a wide range of potential contingencies (10-15%)
Substantial wind increases the need for reserves, increasing operating costs
Incremental operating costs: integration costs With over 40,000 MW of wind in the US, not 1 MW
of backup generation has been added!
2003 through 2010: Many Wind Integration Studies
Across the Nation
Examined larger and larger regions
Wind energy contributions up to ~ 30%
Key Result: Wind integration costs under ~10% of wholesale value (i.e., under ~ ½¢/kWh)
Why? Aggregating wind over larger regions mitigates wind variability Variability tends to average out
Why? Sharing reliability responsibilities over larger regions reduces operating costs
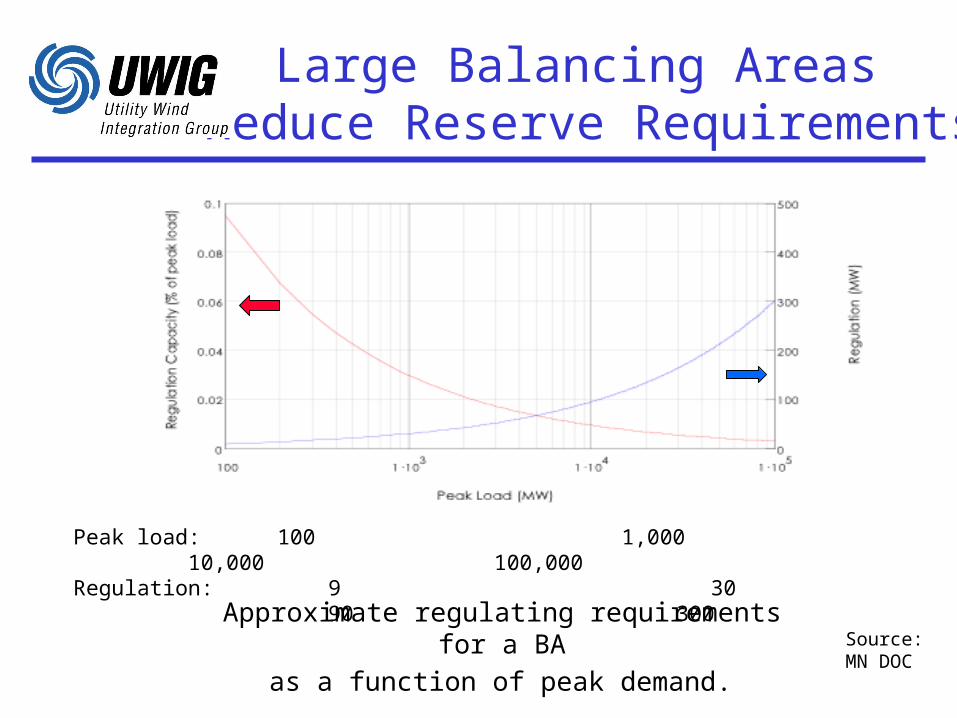
Large Balancing Areas Reduce Reserve Requirements
Approximate regulating requirements for a BA
as a function of peak demand. Source:MN DOC
Peak load: 100 1,000 10,000 100,000Regulation: 9 30 90 300
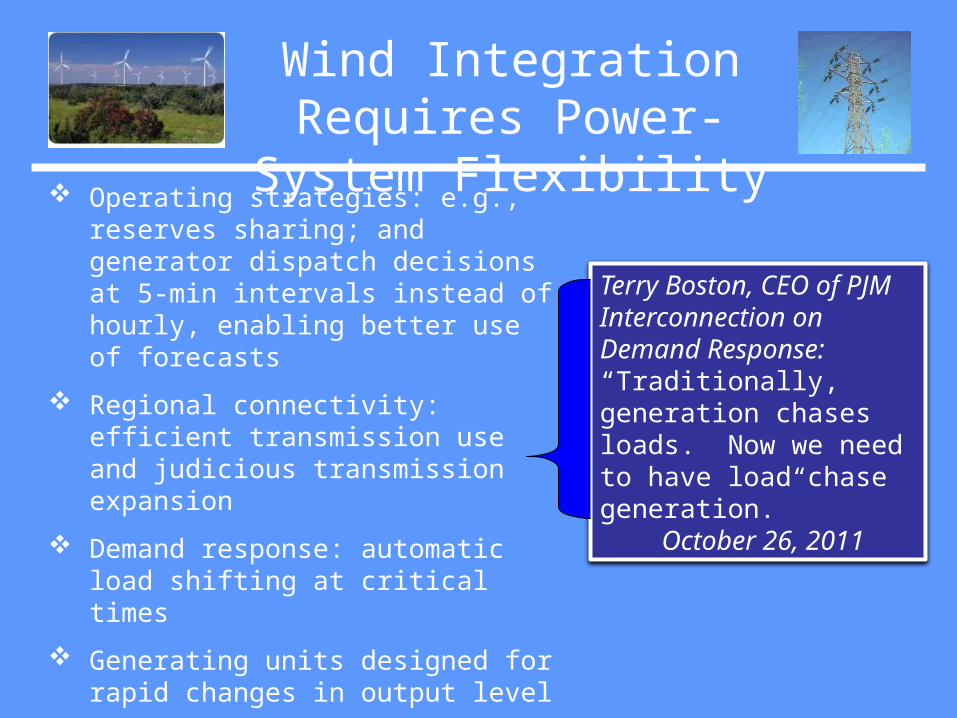
Operating strategies: e.g., reserves sharing; and generator dispatch decisions at 5-min intervals instead of hourly, enabling better use of forecasts
Regional connectivity: efficient transmission use and judicious transmission expansion
Demand response: automatic load shifting at critical times
Generating units designed for rapid changes in output level
Affordable system-level storage (most expensive source of flexibility – may not be needed)
Wind Integration Requires Power-System Flexibility
Terry Boston, CEO of PJM Interconnection on Demand Response: “Traditionally, generation chases loads. Now we need to have load chase generation.”
October 26, 2011
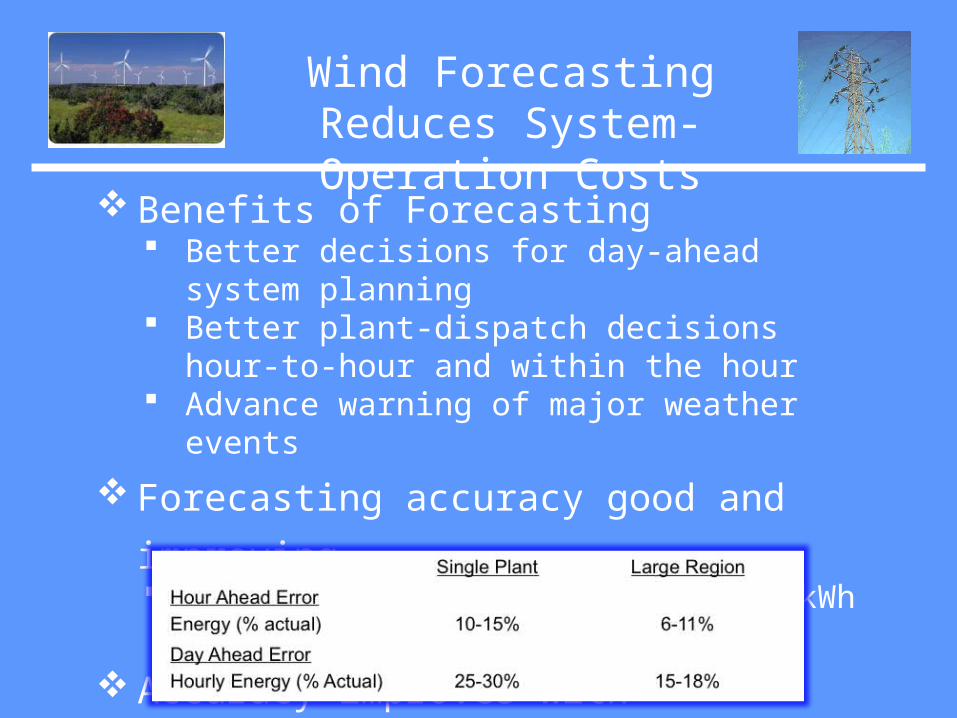
Benefits of Forecasting Better decisions for day-ahead system planning Better plant-dispatch decisions hour-to-hour and
within the hour Advance warning of major weather events
Forecasting accuracy good and improving Value of current forecasts: ~1¢/kWh (NY study)
Accuracy improves with aggregation
Wind Forecasting Reduces System-Operation Costs
Plentiful?
Common criticism: wind requires too much land
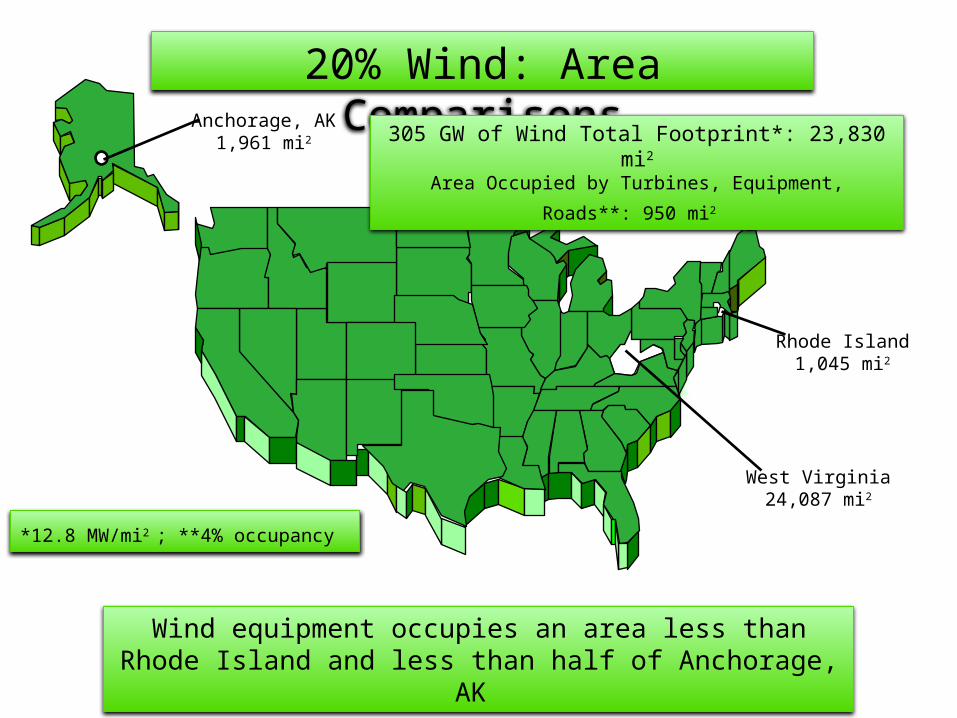
20% Wind: Area Comparisons
Rhode Island1,045 mi2
West Virginia24,087 mi2
Anchorage, AK1,961 mi2 305 GW of Wind Total Footprint*: 23,830 mi2
Area Occupied by Turbines, Equipment, Roads**: 950 mi2
*12.8 MW/mi2 ; **4% occupancy
Wind equipment occupies an area less than Rhode Island and less than half of Anchorage, AK
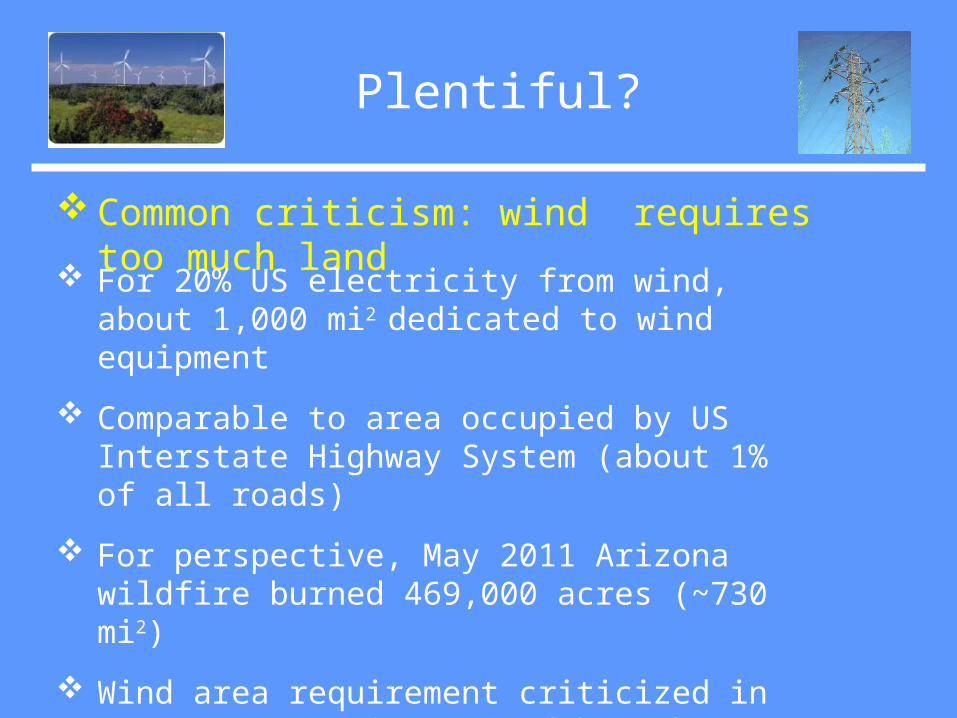
Plentiful?
Common criticism: wind requires too much land
For 20% US electricity from wind, about 1,000 mi2 dedicated to wind equipment
Comparable to area occupied by US Interstate Highway System (about 1% of all roads)
For perspective, May 2011 Arizona wildfire burned 469,000 acres (~730 mi2)
Wind area requirement criticized in June 2011 NY Times Op-Ed by Robert Bryce
GWC Chair and Co-chair rebutted; NYT ignored
But Wind Needs Transmission
Allows access to the best wind resources
Allows pooling of wind plant outputs over wide regions, smoothing variability and reducing integration costs
Allows sharing of reliability responsibilities over wider regions, reducing costs
Provides broad reliability and economic benefits to all in the region
But Wind Needs Transmission
Common criticism: transmission is too expensive
Eastern concern: transmission from Midwest will increase coal generation transport to the East
Allows access to the best wind resources
Allows pooling of wind plant outputs over wide regions, smoothing variability and reducing integration costs
Allows sharing of reliability responsibilities over wider regions, reducing costs
Provides broad reliability and economic benefits to all in the region
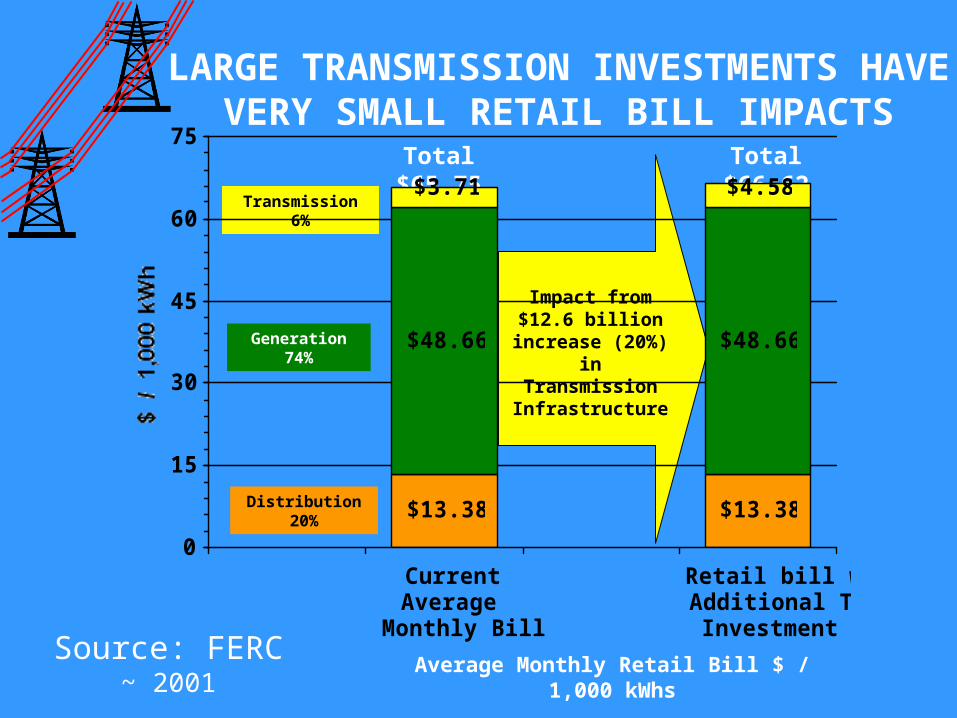
LARGE TRANSMISSION INVESTMENTS HAVE VERY SMALL RETAIL BILL IMPACTS
$13.38 $13.38
$48.66 $48.66
$3.71 $4.58
0
15
30
45
60
75
CurrentAverage
Monthly Bill
Retail bill withAdditional Tx
Investment
Average Monthly Retail Bill $ / 1,000 kWhs
Total $65.75 Total $66.62
Transmission 6%
Generation 74%
Distribution 20%
Impact from $12.6 billion increase
(20%) in Transmission Infrastructure
Source: FERC~ 2001
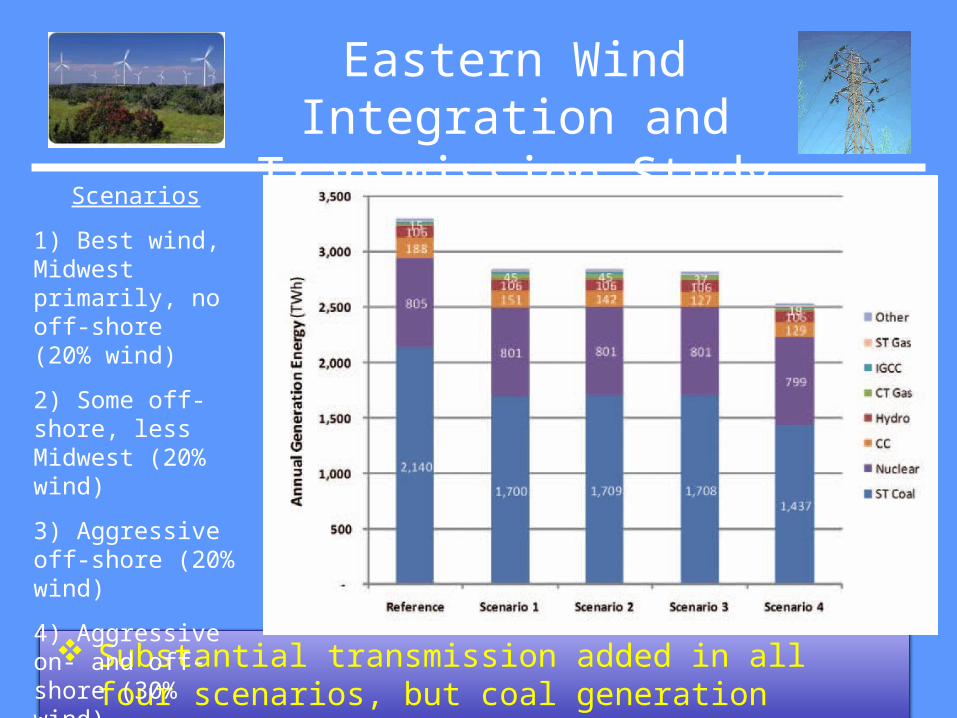
Eastern Wind Integration and Transmission Study
Substantial transmission added in all four scenarios, but coal generation nearly same in the three 20% scenarios
Scenarios
1) Best wind, Midwest primarily, no off-shore (20% wind)
2) Some off-shore, less Midwest (20% wind)
3) Aggressive off-shore (20% wind)
4) Aggressive on- and off-shore (30% wind)
Does Wind Power Really Reduce Emissions?
Ramping of fossil plants introduces inefficiencies
Providing reserves from fossil plants also introduces inefficiencies
Some have claimed that the inefficiencies would cancel out any expected wind emissions benefits
Bentek, LLC originally claimed this but has revised their work and retracted the claim
But naysayers continue to perpetuate this myth
The press seems to love the controversy and gives the naysayers airtime
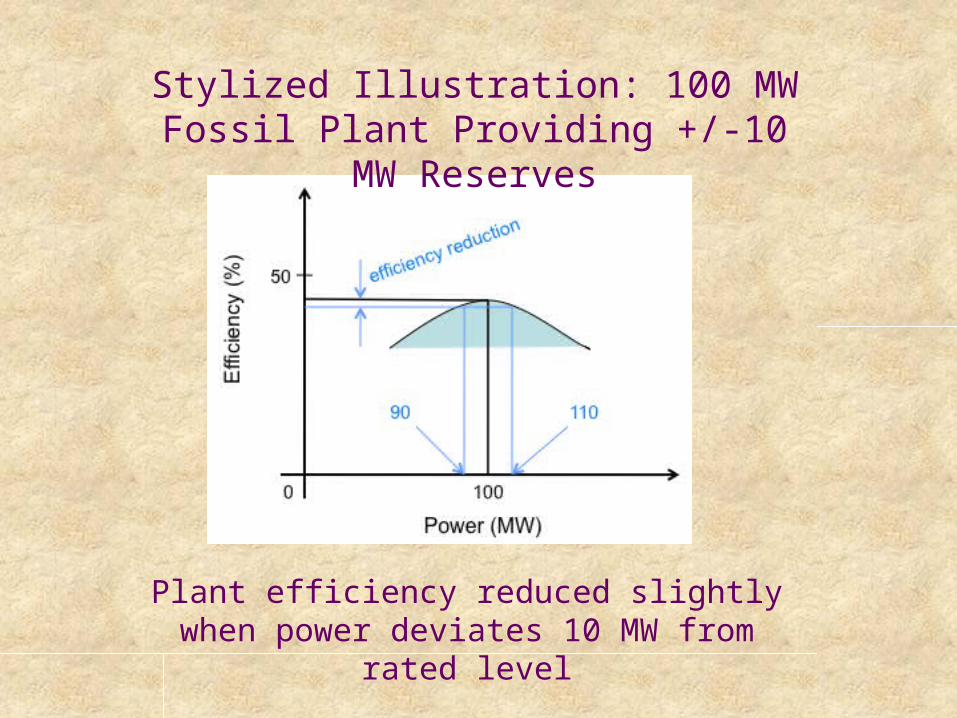
Stylized Illustration: 100 MW Fossil Plant Providing +/-10 MW Reserves
Plant efficiency reduced slightly when power deviates 10 MW from rated level
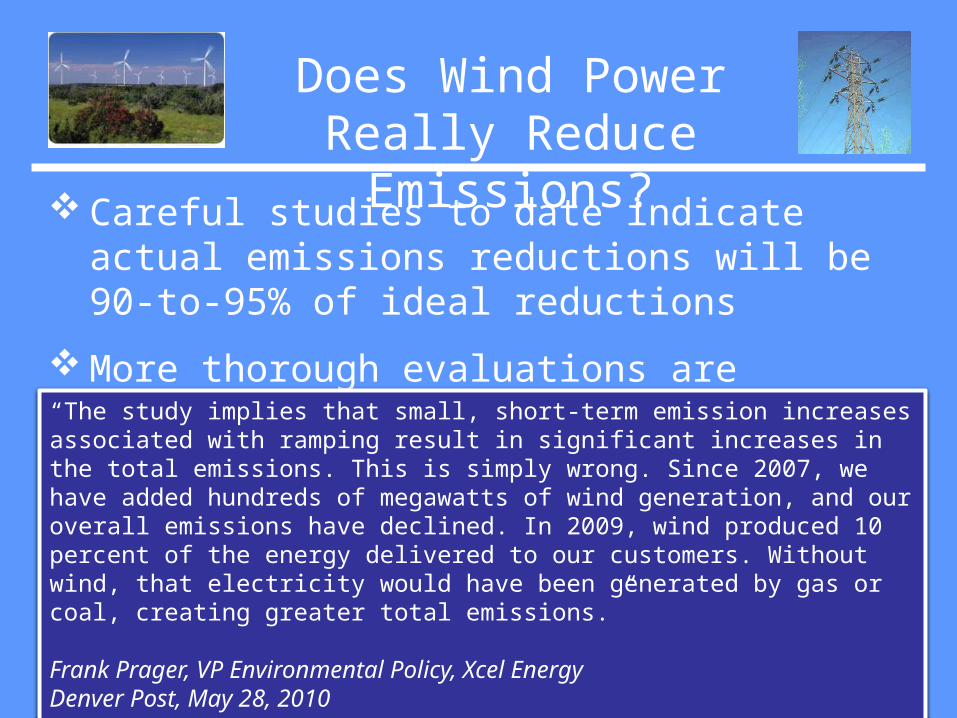
Careful studies to date indicate actual emissions reductions will be 90-to-95% of ideal reductions
More thorough evaluations are underway
Does Wind Power Really Reduce Emissions?
“The study implies that small, short-term emission increases associated with ramping result in significant increases in the total emissions. This is simply wrong. Since 2007, we have added hundreds of megawatts of wind generation, and our overall emissions have declined. In 2009, wind produced 10 percent of the energy delivered to our customers. Without wind, that electricity would have been generated by gas or coal, creating greater total emissions.” Frank Prager, VP Environmental Policy, Xcel EnergyDenver Post, May 28, 2010
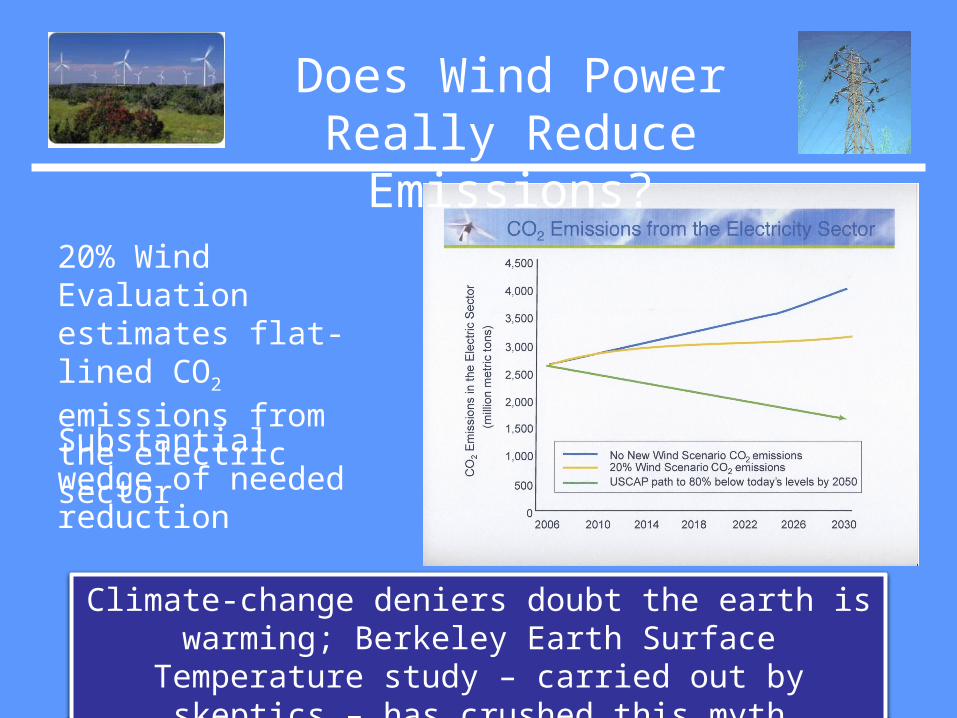
Does Wind Power Really Reduce Emissions?
20% Wind Evaluation estimates flat-lined CO2 emissions from the electric sector
Substantial wedge of needed reduction
Climate-change deniers doubt the earth is warming; Berkeley Earth Surface Temperature study – carried out
by skeptics – has crushed this myth
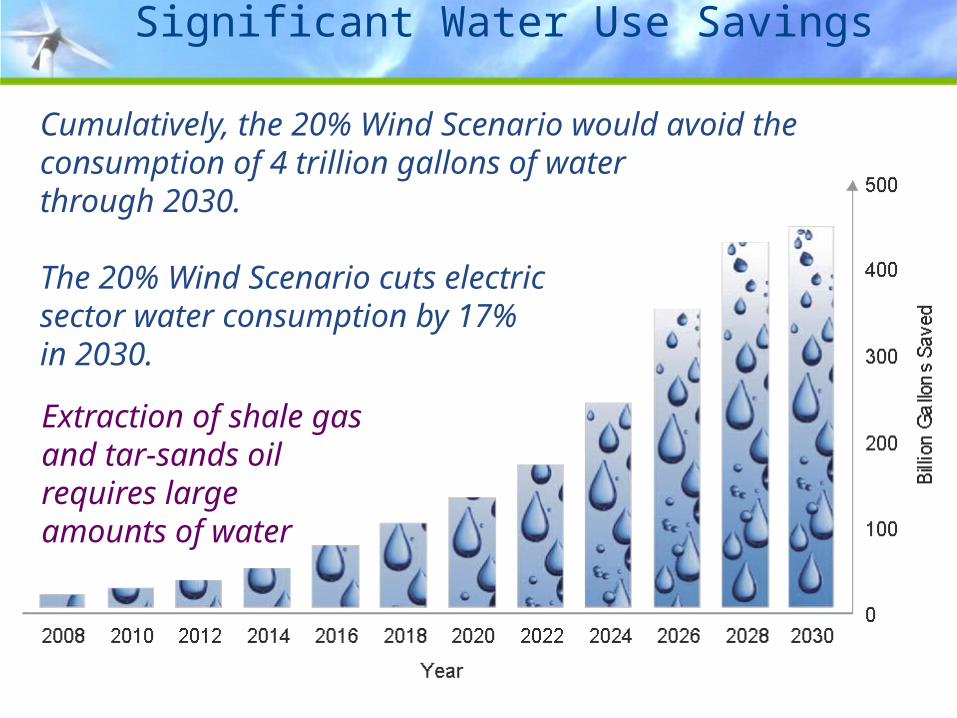
Significant Water Use Savings
Cumulatively, the 20% Wind Scenario would avoid the consumption of 4 trillion gallons of water through 2030.
The 20% Wind Scenario cuts electric sector water consumption by 17% in 2030.
Extraction of shale gas and tar-sands oil requires large amounts of water
Xcel Energy Today: Minnesota and Colorado
Wind now exceeds 10% of retail energy generation
Revising previously approved system expansion plans – with PUC approval
Replacing planned coal plants with wind and gas plants; emissions and costs are key factors driving this strategy
Learning how to deal with wind’s natural characteristics
Actual utility experience is the strongest response to those who perpetuate the myths!
Summary
Wind energy is affordable now
Integration costs are minor; increased power-system flexibility and wind forecasting will reduce them
Wind tax incentives help to compensate for existing subsidies for conventional energy
Transmission is affordable and provides broad benefits
Wind reduces emissions of pollutants and greenhouse gases and saves water
Utilities are relying on wind for substantial and growing portions of their generation portfolio
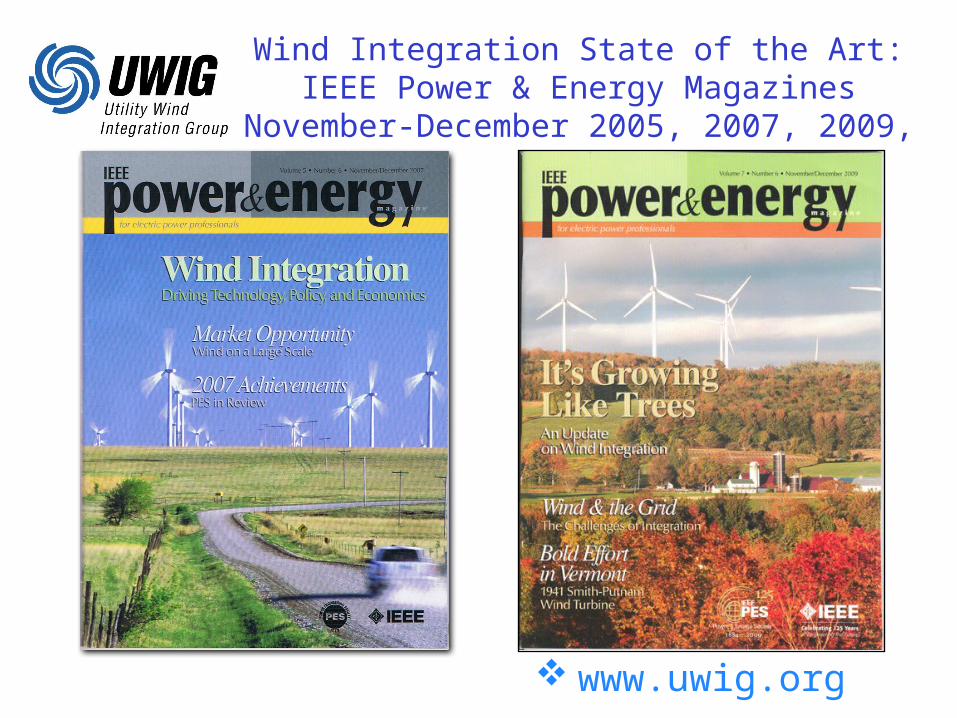
www.uwig.org
Wind Integration State of the Art:IEEE Power & Energy Magazines
November-December 2005, 2007, 2009, 2011
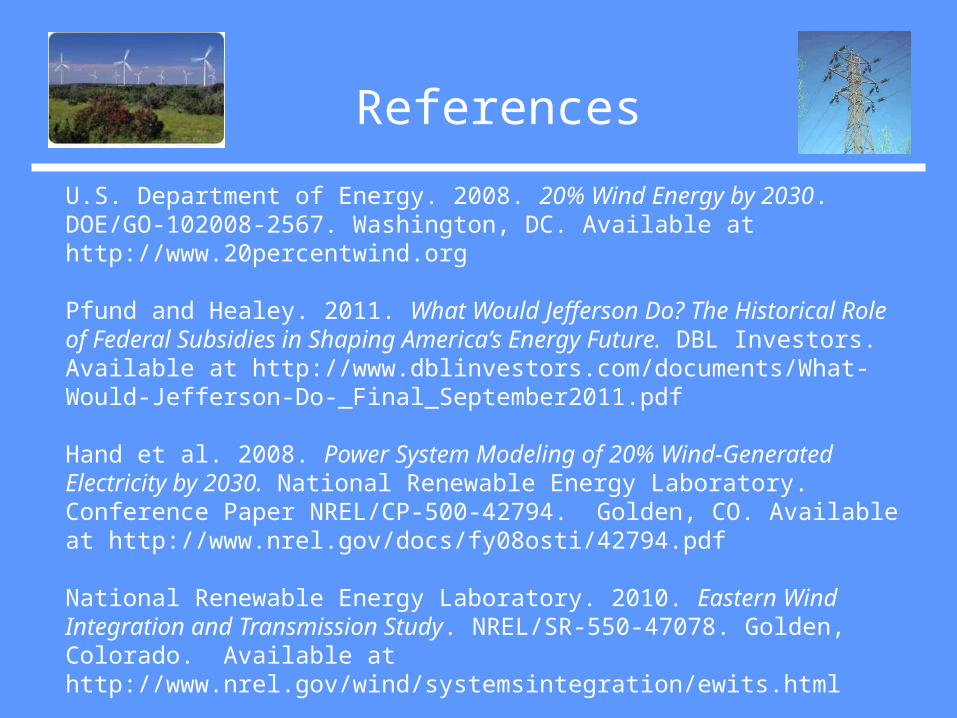
References
U.S. Department of Energy. 2008. 20% Wind Energy by 2030. DOE/GO-102008-2567. Washington, DC. Available at http://www.20percentwind.org
Pfund and Healey. 2011. What Would Jefferson Do? The Historical Role of Federal Subsidies in Shaping America’s Energy Future. DBL Investors. Available at http://www.dblinvestors.com/documents/What-Would-Jefferson-Do-_Final_September2011.pdf
Hand et al. 2008. Power System Modeling of 20% Wind-Generated Electricity by 2030. National Renewable Energy Laboratory. Conference Paper NREL/CP-500-42794. Golden, CO. Available at http://www.nrel.gov/docs/fy08osti/42794.pdf National Renewable Energy Laboratory. 2010. Eastern Wind Integration and Transmission Study. NREL/SR-550-47078. Golden, Colorado. Available at http://www.nrel.gov/wind/systemsintegration/ewits.html
Berkeley Earth Temperature Study. Available at http://berkeleyearth.org/