wind power suppliers’ challenge to meet utility standards …or conservative utilities ability to...
TRANSCRIPT

Wind power suppliers’ challenge to meet utility standards…or conservative utilities ability to understand wind power?
May 2007
2
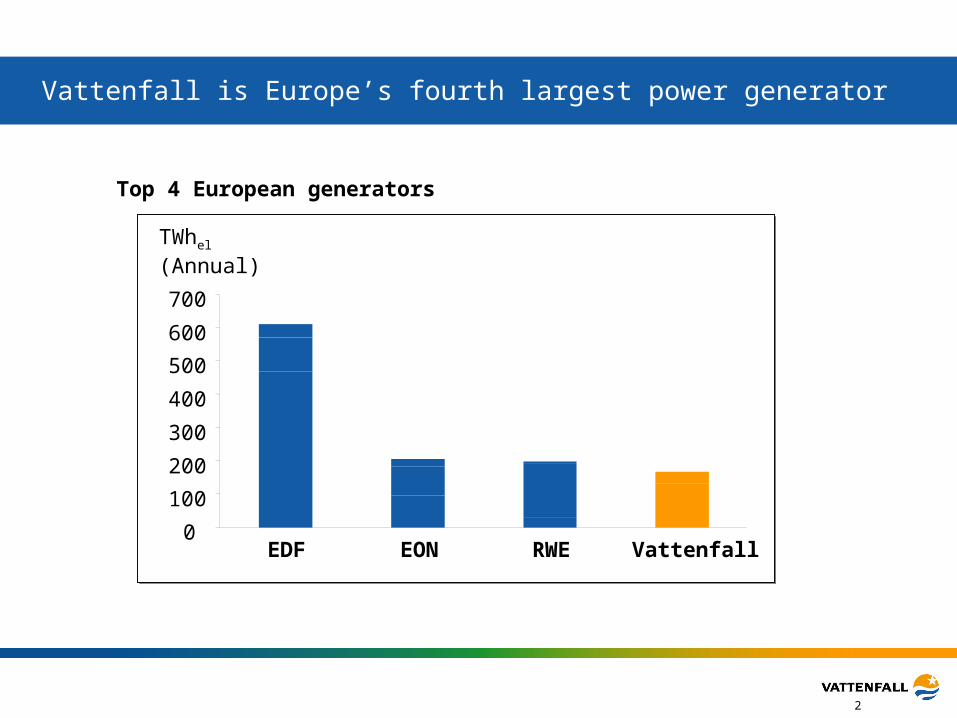
Vattenfall is Europe’s fourth largest power generator
0
100
200
300
400
500
600
700
EDF EON RWE Vattenfall
TWhel
(Annual)
Top 4 European generators

3
Vattenfall is a north European, traditional power producer
Hydro
Nuclear
Fossil
Wind power, bio-fuel and waste
Vattenfall power generation 2006
Current core markets
Current additional markets
Vattenfall markets (May 2007)
165 TWhel
Hydro
Nuclear
Fossil
Other RES

4
• Current portfolio not sustainable from a CO2 perspective
• Vattenfall needs a larger long term portfolio – growth
Wind power is the largest scale RES alternative currently available
Vattenfall wants to grow its RES portfolioVattenfall wind power assets May 2007
165 MW0,5 TWh
311 MW0,8 TWh
90 MW0,3 TWh
600 MW1,7 TWhel
Vattenfall’s aspires for an important position in wind power as well
30 MW0,1 TWh
Vattenfall is prepared to invest 5-10 billion Euro in wind power the next decade
Vattenfall is prepared to invest 5-10 billion Euro in wind power the next decade

5
Vattenfall perceives some supplier issues going forward
System perspective
Generation – Vattenfall’s business
Cost control
• Optimisation on plant level
– Guarantees
– Component suppliers
• Service contracts
– O&M scale harder to achieve
– Philosophy – control
• Double-digit grow for decades to come……eternal delivery challenges
• Where is the customer cost perspective?– Our best guess: Production economics and
supply chain management

6
Happy investors will allocate a lot more money to wind power
2007 2025
CAGR 10%A successful wind industry
CAGR 20%An importantwind industry
Annual wind installations

7
Backupp

8
The global wind power expansion has created large wind power producers
Source: BTM World Market Update 2006
Top 14 wind power generators (end of 2005)
0 1 000 2 000 3 000 4 000
Essent
Vattenfall
RWE
EdF/EnXco
EdP
Shell Renewables
ENEL
DONG
EUROS Energy
Endesa
Babcock Brown
Acciona
Iberdrola
FPL 3 500
4 150*
1 700
1 180
800
750
750
750
740
740
700
600
550
480
Installed MW
• European companies dominate the market
– Only three non-European companies in the top-15 list
• Countries with historically strong support systems for wind power dominate the worldwide capacity
– Three Spanish companies in the top-5
* Including the acquisition of Scottish Power 2007

9
Vattenfall is Europe’s fourth largest power generator
0
100
200
300
400
500
600
700
EDF EON RWE Vattenfall
TWhel
(Annual)
Top 4 European generators
RES
Fossil
Nuclear

10
Wind power suppliers gaining strength, which will ultimately benefit customers
Repower
Siemens
Suzlon
Gamesa
Enercon
GE
Vestas
Large industrials
Large independents
Wind turbine market structure 2005
• Strong consolidation on-going• Industrial production capabilities entering industry
– Areva and Suzlon bids for Repower 2007– Siemens acquired Bonus 2004– GE acquired Enron Wind 2002
• As suppliers grow larger and more capable, production economy likely to improve
• New market entrants expected in booming industry
– Mitsubishi growing strongly in Asia
Source: BTM March 2006
Mitsubishi

11
The learning curve for wind power has historically indicated 13% price decrease for doubled cumulative output
Learning curves for emerging technologies1
Production economy indicates lower prices• Wind power’s cumulative output is currently doubling
every four years, indicating 13% cost reduction every four years
• There may be potential for steeper price decreases: – Strong growth has meant focus on delivery, not
cost– Historic rapid technology development has meant
short production runs
Business environment maintains price levels• Future strong demand limits medium term and possibly
long term price potential • Vattenfall’s potential to affect prices is limited by the fact
that Vattenfall’s ambitions amount to <1% of industry output
Source: Vattenfall 3C initiative
Wind power learning curve