wind project financing - idam infrastructure advisory pvt ltd · idam infrastructure advisory pvt....
TRANSCRIPT
“Theme Paper”Wind Project Financing

Disclaimer:
This report/document has been supported by Shakti Sustainable Energy Foundation, and prepared by
Idam Infrastructure Advisory Pvt. Ltd., (Idam Infra). The views/analysis expressed in this
report/document are based on the research and analysis by Idam Infra, and do not necessarily reflect the
views of Shakti Sustainable Energy Foundation. The Foundation does not guarantee the accuracy of any
data included in this publication nor does it accept any responsibility for the consequences of its use.

Table of Contents
1 Introduction .................................................................................................................................1
1.1 Background ..................................................................................................................................1
1.2 History of Wind Sector Development in India .......................................................................2
1.3 An Initiative for 200 GW by 2032 ..............................................................................................6
1.4 India’s Wind Vision 2032 ...........................................................................................................7
1.5 Coverage of Theme Paper ..........................................................................................................7
2 Financing Wind Vision ...............................................................................................................9
2.1 Financing Scenario for Renewable Energy Sector ..................................................................9
2.2 Investment Scenario in India ...................................................................................................11
2.3 Fund Requirement for Wind Vision .......................................................................................16
3 Debt Financing ...........................................................................................................................18
3.2 External Borrowings / External Debt .....................................................................................23
3.3 Modes of Availing Debt Finance .............................................................................................27
3.4 Other Sources of Funds ............................................................................................................30
3.5 Barriers/Risks in Indian Debt Market Financing .................................................................35
3.6 Risks Management Practices ...................................................................................................40
3.7 Risks Management Instruments ..............................................................................................40
3.8 Recommendations .....................................................................................................................43
4 Source of Equity Financing ......................................................................................................51
4.1 Venture Capital/ Private Equity .............................................................................................51
4.2 Developer’s Equity/ Internal Accruals ..................................................................................52
4.3 Capital Market ...........................................................................................................................52
4.4 Barriers in availing finance from Indian Equity Market......................................................53
4.5 Recommendations .....................................................................................................................54
5 Other Financing Instruments...................................................................................................56
5.1 Partial Risk Guarantee and Loan Support .............................................................................56
5.2 Subordinate Funding/Mezzanine Debt .................................................................................56
5.3 Securitization of Cash Flows of RE Projects Pooled From Multiple Projects ...................57
5.4 Innovative Financing Structures .............................................................................................57
6 Summary of Recommendations ..............................................................................................62
List of Figures
Figure 1: Wind Sector Prior to EA 2003 .................................................................................................... 3
Figure 2: Wind Capacity Addition Post EA 2003 .................................................................................... 5
Figure 3: Approach followed in the Initiative .......................................................................................... 6
Figure 4: Global investments in Renewable Energy by Asset Class(in Billion USD) ......................... 9
Figure 5: Funds Required for New Wind ............................................................................................... 17
Figure 6: Structure of Project Finance in Power Sector ......................................................................... 27
Figure 7: Structure of Corporate Financing in Power Sector ............................................................... 29
Figure 8: Investment Trend in Green Bonds .......................................................................................... 32
Figure 9: Interest Rate Trends .................................................................................................................. 36
Figure 10: Mezzanine Financing .............................................................................................................. 56
Figure 11: Investments in YieldCo ........................................................................................................... 58
Figure 12: YieldCo Structure .................................................................................................................... 59
List of Tables
Table 1: Wind Capacity Target—2032 ....................................................................................................... 7
Table 2: Investments in Renewable Energy Globally by Asset Class ................................................. 10
Table 4: Investments in Renewable Energy in India by Asset Class .................................................. 12
Table 5: Renewable Energy Targets 2022 ................................................................................................ 13
Table 6: Wind Vision 2032 ........................................................................................................................ 16
Table 7: Sources of Debt Financing in India ........................................................................................... 20
Table 8: Sources of External Borrowings in India.................................................................................. 24
Table 9: Types of Green Bonds ................................................................................................................. 32
Table 10: Private Equity Deals .................................................................................................................. 52

Acronyms
AD Accelerated Depreciation
ADB Asian Development Bank
ADIA Abu Dhabi Investment Authority
BAs Bilateral Agencies
BLP Bharat Light & Power
BNEF Bloomberg New Energy Finance
BRICS Brazil, Russia, India, China and South Africa
CEA Central Electricity Authority
CERC Central Electricity Regulatory Commission
COG Cost Of Generation
CPI Consumer Price Index
CUF Capacity Utilization Factor
C-WET Centre for Wind Energy Technology
DNES Department of Non-conventional Energy Sources
DSCR Debt Service Coverage Ratio
EA Indian Electricity Act 2003
ECB External Commercial Borrowings
ECB External Commercial Borrowings
EDGAR Emission Database for Global Atmospheric Research
EGP Enel Green Power SpA
EPC Engineering, Procurement, and Construction
FDI Foreign Direct Investment
FI Financial Institutions
FRN Floating Rate Notes
FY Financial Year
FYP Five Year Plan
GBI Generation Based Incentives
GoI Government of India
GSR Global Status Report
GW Giga Watt
GWEC Global Wind Energy Council
HOLDCO Holding Company
HUDCO Housing and Urban Development Corporation
IBRD International Bank for Reconstruction and Development
IDA International Development Association
IDB Inter-American Development Bank
IDF Infrastructure Debt Funds
IFC Infrastructure Finance Companies
IIFCL India Infrastructure Finance Company Limited
INR Indian Rupee
IOUs Investor Owned Utilities
IPP Independent Power Producers
IREDA Indian Renewable Energy Development Agency
IRFC Indian Railway Finance Corporation
IRR Internal Rate of Return
JICA Japan International Cooperation Agency
kW Kilo Watt
kWh Kilo Watt Hour
LBO Leveraged Buyouts
LGBR Load Generation Balance Report
MDB Multilateral Development Banks
MIBOR Mumbai Interbank Offer Rate
MNES Ministry of Non-conventional Energy Sources
MNRE Ministry of New and Renewable Energy
MoF Ministry of Finance
MU Million Units
MW Megawatt
NBFC Non Banking Financial Company
NCEF National Clean Energy Fund
NEG Nordtank Energy Group
NGO Non Governmental Organisation
NHAI National Highways Authority of India
NIWE National Institute of Wind Energy
NPA Non Performing Asset
NRI Non-Resident Indians
NTPC National Thermal Power Corporation
O&M Operations & Maintenance
PE Private Equity
PFC Power Finance Corporation
PPA Power Purchase Agreement
PPP Public Private Partnership
PSUs Public Sector Undertakings
PV Photo Voltaic

R&D Research & Development
RBI Reserve Bank of India
RE Renewable energy
REC Rural Electrification Corporation
RECI Renewable Energy Corporation of India
REIT Renewable Energy Investment Trust
REN Renewable Energy Network
RIB Resurgent India Bonds
SEBI Securities and Exchange Board of India
SEBs State Electricity Boards
SECI Solar Energy Corporation of India
SPV Special Purpose Vehicle
TUFS Technology Up gradation Fund Scheme
UBI Union Bank of India
UNEP United Nations Environment Programme
USD United States dollar
VC Venture Capital
WTG Wind Turbine Generator

1 | P a g e
1 Introduction
India, the third largest economy in Asia and one of the fastest growing economies in the world,
has an immense appetite for electricity. India’s impressive economic growth in the last decade
has resulted in commensurate rise in the energy requirements of the country. Although the total
power generation capacity has increased from 1,362 MW in 1947 to 3,02,833 MW till April 2016,
electricity generation has not been able to keep pace with the country’s rapid industrialization
and growth in population. Consequently, shortage in energy has been continuing since long.
The Load Generation Balance Report (LGBR) published by Central Electricity Authority (CEA)
stipulates that, the total energy (MUs) and peak (MW) deficits were reported at 2.1% and 3.2%
respectively during FY 2015-16... According to the World Bank analysis, about 22% of India’s
population does not have access to electricity and the country’s per capita consumption of
electricity is lowest among the emerging large economies (viz. Brazil, China, Russia, and South
Africa). Further, the electricity demand is expected to rise significantly in the near future.
Considering the fact that India is currently importing nearly 79% of its total petroleum
requirements and has been relying increasingly on imported coal, it is necessary that India
develops a propensity towards non conventional domestic sources of energy to meet its
demand. Though, India’s per capita carbon emissions (2,340 million tonnes CO2 are amongst
the lowest, ranking 126th as per Emission Database for Global Atmospheric Research (EDGAR),
in terms of total emissions, India with 5.7% share in the annual global emissions, is fourth
largest in the world, only behind China, USA and the European Union. As a result, India is
subjected to increasing global pressure to reduce its overall carbon emissions. These can be most
effectively mitigated through adoption of renewable energy (RE) resources to meet demand.
Wind energy resources, in particular, could play a significant role.
1.1 Background
With the capacity of 26,867 MW as on April 2016, wind energy accounts for more than 62% of
the installed capacity in the renewable energy sector in the country. Presently, Tamil Nadu leads
in terms of installed wind capacity among all wind rich states of India with a installed wind
capacity base accounting to almost one-third of the total wind capacity of India. However, other
states with significant potential such as Maharashtra, Gujarat, Rajasthan, Karnataka, Madhya
Pradesh, Andhra Pradesh and Telangana have been adding to their respective wind capacities at
a faster rate.
The sector is growing rapidly and thus presents substantial opportunities for domestic as well
as international players. As per Global Wind Energy Council (GWEC), 2014, India ranked fifth

2 | P a g e
in terms of wind installed capacity (behind China, Germany, USA and Spain) and fourth
(behind China, USA and Brazil) in annual capacity growth. However in 2015, India superseded
Spain to rank fourth in terms of installed capacity of wind, among all the countries in the world.
India’s wind equipment manufacturing capacity is over 10,000 MW per annum at present and
all most all world-class wind turbine manufacturers are present in the country. Further,
National Institute of Wind Energy (NIWE), has estimated India’s wind potential as 302.25 GW
(at 100 m level). With strong political will, continued favourable policy environment and low
cost financing, wind energy can play a major role in securing a sustainable and clean energy
future for India.
1.2 History of Wind Sector Development in India
The first wind power plant of 40 kW was installed at Verawal in Gujarat in 1984. As on April 30,
2016, out of the total grid-connected renewable energy capacity of 43,086 MW, wind energy
contributes 62% with an installed capacity of 26,867 MW. The main drivers for growth of wind
energy sector in India during past few years were conducive policy framework, regulatory
initiatives, increasing prices of fossil fuel based generation, growing electricity consumption,
technological advancements, and recognition of environmental concerns. The growth of wind
power sector can be grouped into three phases of development:
Period Before FY 1994-95 • Initial Phase of Demonstration Projects
• Structured Policy Program of Erstwhile Ministry of
Non-conventional Energy Sources (MNES) (Now
MNRE)
Period Between FY 1994-95 to
FY 2002-03
• Period Before Enactment of Electricity Act, 2003
Period After FY 2002-03 • Period After Enactment of Electricity Act, 2003
1.2.1 Period before FY 1994-95
In the year 1982, an independent Department of Non-conventional Energy Sources (DNES) was
constituted under Ministry of Energy. DNES constituted the Indian Institute for Tropical
Metrology to publish the first wind resource assessment in the country. In 1984, DNES
supported the commissioning of the first grid-connected wind turbine, of 40 kW capacity at
Verawal, Gujarat. Thereafter, DNES initiated a wind farm demonstration programme, offering
grants to five projects of 550 kW. The initiatives taken during this phase laid the foundation for
wind energy development in subsequent years. Some of the policy initiatives which commenced
in this phase are:
3 | P a g e
a) 100% Accelerated Depreciation on capital investment in equipment in the first year of
installation.
b) 5 years’ Income-tax exemption on income from sale of power generated by wind energy.
c) Mandatory purchase of electricity by State Electricity Boards (SEBs).
d) Industry status to wind equipment manufacturers.
e) Establishment of Indian Renewable Energy Development Agency (IREDA) in 1987, to act as
a dedicated public sector financing arm for renewable energy projects.
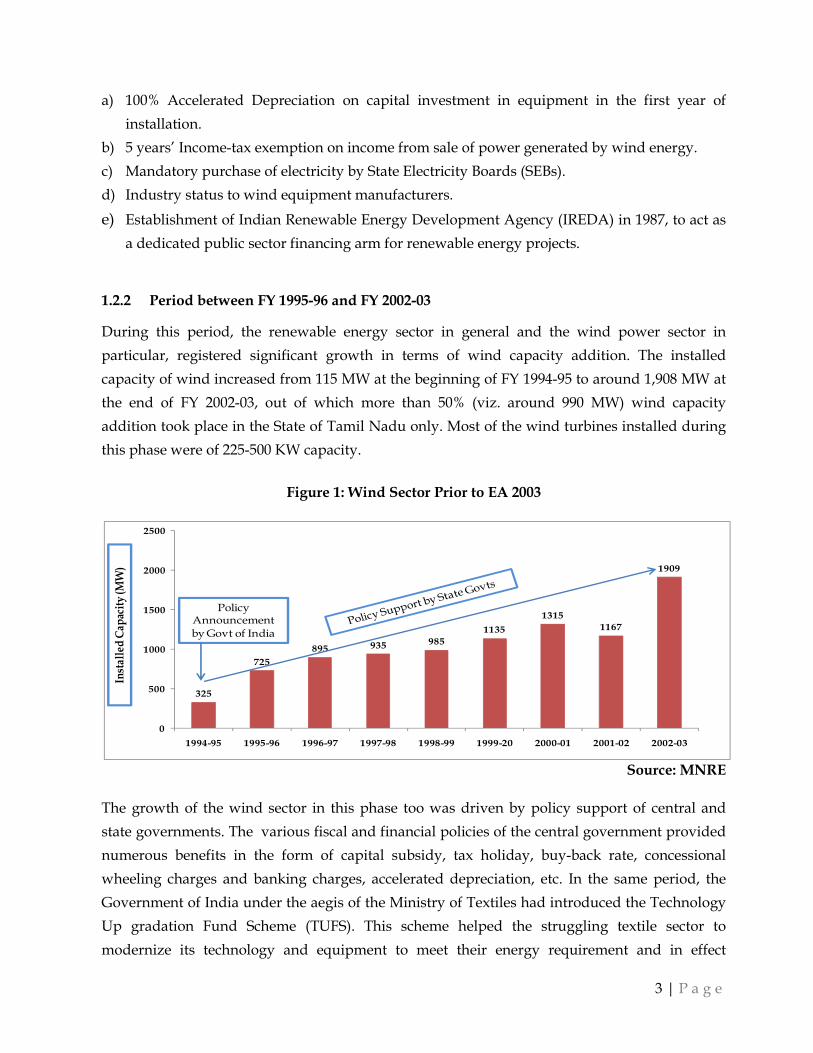
1.2.2 Period between FY 1995-96 and FY 2002-03
During this period, the renewable energy sector in general and the wind power sector in
particular, registered significant growth in terms of wind capacity addition. The installed
capacity of wind increased from 115 MW at the beginning of FY 1994-95 to around 1,908 MW at
the end of FY 2002-03, out of which more than 50% (viz. around 990 MW) wind capacity
addition took place in the State of Tamil Nadu only. Most of the wind turbines installed during
this phase were of 225-500 KW capacity.
Figure 1: Wind Sector Prior to EA 2003
Source: MNRE
The growth of the wind sector in this phase too was driven by policy support of central and
state governments. The various fiscal and financial policies of the central government provided
numerous benefits in the form of capital subsidy, tax holiday, buy-back rate, concessional
wheeling charges and banking charges, accelerated depreciation, etc. In the same period, the
Government of India under the aegis of the Ministry of Textiles had introduced the Technology
Up gradation Fund Scheme (TUFS). This scheme helped the struggling textile sector to
modernize its technology and equipment to meet their energy requirement and in effect
325
725
895 935 985
1135
1315
1167
1909
0
500
1000
1500
2000
2500
1994-95 1995-96 1996-97 1997-98 1998-99 1999-20 2000-01 2001-02 2002-03
Policy Announcement by Govt of India
Inst
alle
dC
apac
ity
(MW
)
4 | P a g e
benefited the wind sector as wind mills were set up to meet the electricity needs of the textile
sector.
The state governments also encouraged wind capacity addition by providing assistance in the
form of concessional land allotment, electricity duty exemption, deferment of sales tax for the
industry and so on. The wind resource development and R&D programmes by erstwhile Centre
for Wind Energy Technology (C-WET); now known as National Institute of Wind Energy
(NIWE) laid down the foundation for growth of wind sector in subsequent years. The growth in
capacity addition in wind turbine generator (WTG) installation in India during this phase was
achieved mainly due to the market development initiatives taken up by the Ministry of Non-
Conventional Energy Sources (MNES); now Ministry of New and Renewable Energy (MNRE),
some of which measures are still continuing.
Wind Sector Development Initiatives Prior to EA 2003
Analysis, compilation and publishing of wind speed and wind energy data.
Setting up of demonstration wind power projects.
Guidelines to State Electricity Boards to formulate policies towards grid
interfacing of wind power, banking and wheeling arrangements and the purchase
rate of electricity from the wind farms.
Policy of accelerated depreciation, concessional import duty, and so on.
Encouraging development of indigenous wind turbine manufacturing facilities.
Involving multilateral and bi-lateral agencies in setting up demonstration projects.
Setting up of IREDA and enabling soft financing to wind farm projects through it.
Guidelines for promotional and fiscal incentives by state governments for power
generation from non-conventional energy sources, popularly known as “Buy-Back
Scheme”.
The favourable policy framework coupled with low manpower cost, raw material availability,
and vast market potential resulted into significant growth of the wind industry. During this
phase, the wind turbine manufacturing also started in India by companies like Vestas, NEG, and
Enercon, which set up their manufacturing facility in collaboration with local manufacturers.
This era also saw the genesis of the largest domestic wind turbine manufacturing company,
Suzlon Energy Limited and many more.
1.2.3 Period after FY 2002-03 (Post Enactment of Electricity Act, 2003)
Post enactment of the Electricity Act, 2003, the installed WTG capacity has increased from 1,909
MW at the beginning of FY 2003-04 to 26,867 MW as on April 30, 2016. This phase may be
termed as golden phase in the development history of wind sector considering the increase in

5 | P a g e
year-on-year capacity additions in the wind capacity. The average annual capacity addition
during the last 11 years has been approx. 1,700 MW per annum, which exceeds the total
addition of 1,584 MW during previous phase of 8 years (from 1994-95 to 2002-03).
Figure 2: Wind Capacity Addition Post EA 2003
Source: MNRE
During this period, the wind technology emerged as a mature technology amongst various
other types of renewable energy technologies. It now contributes to around 9% of total
generation capacity and its share amongst various renewable energy technologies constitutes
nearly 62% of the total installed capacity of renewable. During the period between 2003 till FY
2011-12, the legal clarity and certainty of regulatory principles, coupled with conducive policy
framework, ensured continued developer interest in wind sector, which resulted in significant
growth in wind capacity across various states.
However, post FY 2011-12, the growth slide down to half of the growth in previous years,
mainly due to uncertainty over continuation of Generation Based Incentive (GBI) scheme post
FY 2012-13, withdrawal of Accelerated Benefit (AD) for wind projects, lack of demand for wind
power by utilities, and other state specific issues. The AD and GBI schemes were discontinued
at the end of 11th five year plan, i.e., FY 2011-12. As a result, the annual wind capacity addition
dipped from approx. 3.2 GW in FY 2011-12 to 1.7 GW in FY 2012-13. With the re-introduction of
GBI in FY 2013-14, effective from 01 April 2012 for the entire period of 12th Plan i.e. 2012-17,
25243636
5352
7094
8757
10242
11807
14156
17353
19053
21132
23444
26769
0
5000
10000
15000
20000
25000
30000
2003-04 2004-05 2005-06 2006-07 2007-08 2008-09 2009-10 2010-11 2011-12 2012-13 2013-14 2014-15 2015-16
EA, 2003
Wind GBI Introduced
Inst
all
ed
Ca
pac
ity
(M
W)
GBI and AD Discontinued
GBI and AD Re-introduced
Tariff Policy2006

6 | P a g e
and AD in the budget of FY 2014-15, the capacity addition of wind again rose up to 2.1 GW, 2.3
GW and 3.3 GW in FY 2013-14, FY 2014-15 and FY 2015-16 respectively.
With a massive wind potential still untapped, in order to achieve the targets of 60 GW by 2022
as laid down by the Government, and in furtherance to accomplish the Wind Vision targets of
200 GW by 2032, there is an urgent need for a renewed vision to re-ignite growth in the wind
sector.
1.3 An Initiative for 200 GW by 2032
Shakti Sustainable Energy Foundation initiated a process of – “Evolving Consensus on Thematic
Issues in Wind Sector through Stakeholder Engagement”, and engaged Idam Infrastructure
Advisory Private Limited for execution of the same. This initiative is an effort to establish a
broad platform for evolving consensus around certain identified areas for the development of
wind energy sector in India through open discussions and deliberations amongst various
stakeholders and evolve development and policy approaches that are acceptable to all as well as
practically implementable. Following figure illustrates the approach followed in the initiative.
Figure 3: Approach followed in the Initiative
“Wind Vision 2032” aimed to provide the impetus by undertaking complete analysis of the
wind sector in India. This initiative also aimed to create a “Discussion Forum” to undertake the
brain storming process to evolve solutions for all key challenges being faced by the wind sector.
The objective was to evolve consensus around such aspects among industry and other key
stakeholders through a process of dialogue supported by independent research. This initiative
‘Wind Vision 2032,’ aimed to bring closer focus on all the key challenges related to the wind
sector and initiate the consensus building on the possible strategies. It aimed to identify the

7 | P a g e
bottlenecks and possible policy/regulatory interventions and thereafter define idealistic targets
for the wind sector by the end of 15th five year plan i.e., till FY 2031-32.
It was proposed to form a unique Advisory Group with around 8-10 members, comprising
heads of various wind industry associations, regulatory and policy experts and technology
experts in the sector, to provide continuous guidance during the various stages of the
assignment. The Advisory Group provided continuous guidance during the various stages of
the assignment to facilitate the achievement of the collective goal and played a pivotal role in
evolving consensus on various issues in an efficient manner. In this context, a two-pronged
structure of the ‘Discussion Forum’ and ‘Advisory Group’ was adopted for designing the long-
term Vision besides conducting theme-specific workshops for wider stakeholder consultation.
1.4 India’s Wind Vision 2032
The Wind Vision envisages a target of 200 GW of wind capacity by the end of the year 2032. This
is discussed in details in the Main Report—Setting of 200 GW Target and Business
Opportunities. The following table provides overview of the target of 200 GW by 2032, with
intermediate cumulative targets identified for each of Five Year Plan (FYP).
Table 1: Wind Capacity Target—2032
(Capacity in GW)
Particulars 12th FYP
(FY 2016-17)
13th FYP
(FY 2021-22)
14th FYP
(FY 2026-27)
15th FYP
(FY 2031-32)
Onshore capacity 31 54 97 160
Repowering 1 4 9 20
Small wind - - - 0.10
Offshore wind - 6 12 20
Cumulative Total 32 64 118 200
The above mentioned targets would require average annual wind capacity addition of approx. 8
GW, 10 GW and 15 GW during 13th, 14th and 15th FYP periods respectively.
1.5 Coverage of Theme Paper
The envisaged target of 200 GW of wind capacity by 2032 translates into to an estimated
investment requirement of approx. INR 1,708 thousand crore (details discussed in subsequent
chapter). In order to attract the above stated requirements for gigantic amount of investments

8 | P a g e
for wind power development in India, appropriate options need to be evaluated and
opportunities should be created to facilitate wind power project developers. Since, availability
of funding from public and concessional sources is scarce, an engaged private sector
participation will be needed to make significant investments in the sector. The 200 GW target
can be achieved through public funding assisted by private participation and international
support. Any decision to use public or concessional funds to support wind sector
quintessentially needs a strong commitment of scarce public resources to fund huge
investments. The present Theme paper, discusses various financing instruments available to the
renewable energy developers in the present scenario. It also covers various issues and
interventions required to increase availability of the funds and at the same time, reduce cost of
these financing instruments for wind sector in India. Further, renewable financing mechanisms,
which have been successful internationally, may be introduced in the Indian markets with
necessary customisation.
9 | P a g e
2 Financing Wind Vision
2.1 Financing Scenario for Renewable Energy Sector
Globally there is a growing awareness that increased deployment of renewable energy is critical
for addressing climate change and providing energy access to the billions of people still living
with limited exposure to energy and electricity. Renewable energy is an important element of
climate change adaptation, improving the resilience of existing energy systems and ensuring
delivery of energy services under changing climatic conditions.
Renewable energy contributed about 19.1% of global final energy consumption in 2013. Further
growth in capacity and generation continued to expand since 20141. The most rapid growth and
the largest increase in capacity that occurred in the power sector, was led by increase in the
wind, solar PV and hydropower capacities. Growth has been driven by several factors,
including renewable energy support policies and the increasing cost-competiveness of energy
from renewable sources. In many countries, renewable energy sources are broadly competitive
with conventional energy sources. At the same time, growth continues to be tempered by
subsidies to fossil fuels and nuclear power, particularly in developing countries.
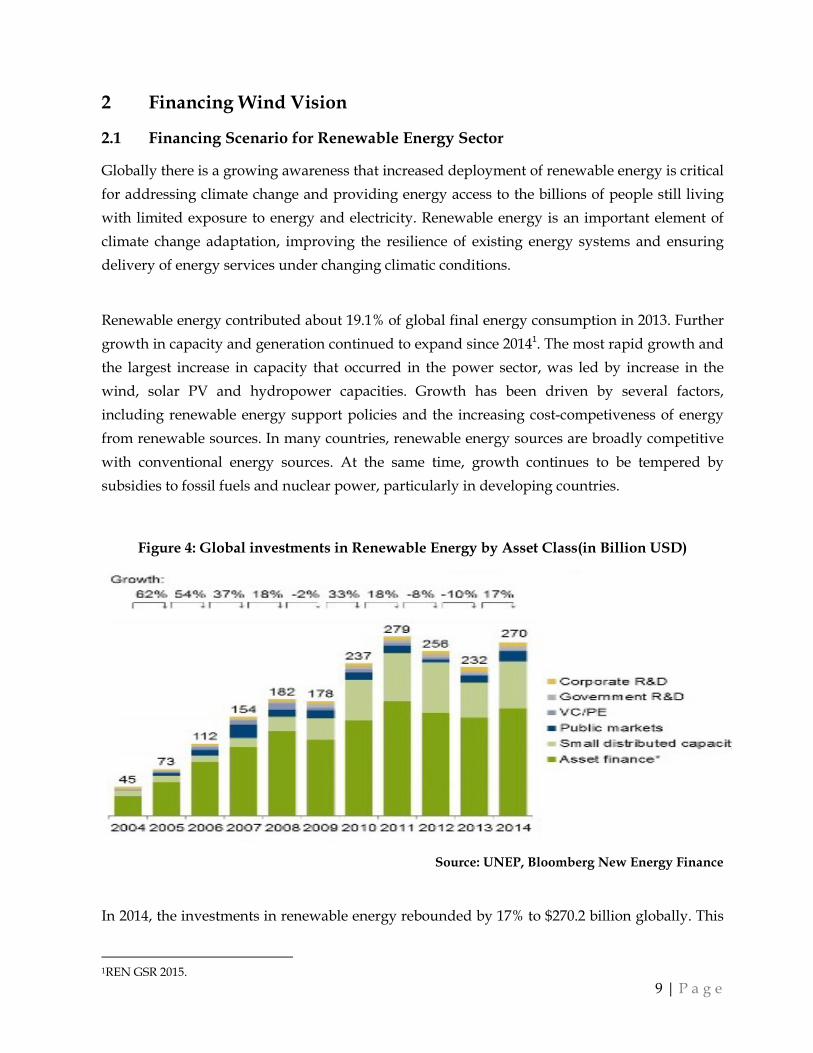
Figure 4: Global investments in Renewable Energy by Asset Class(in Billion USD)
Source: UNEP, Bloomberg New Energy Finance
In 2014, the investments in renewable energy rebounded by 17% to $270.2 billion globally. This
1REN GSR 2015.
10 | P a g e
was the first annual increase in dollar commitments to renewables excluding large hydro for
three years and brought the total up to just 3% below the all-time record of $278.8 billion set in
2011. The performance by renewable energy investment in 2014 was arguably more impressive
than that in 2011, because capital costs in wind and particularly in solar PV, fell sharply in the
intervening three years. So each billion dollars committed added many more MW of capacity
than it did in the earlier years. Around 103 GW of renewable power capacity excluding large
hydro is estimated to have been built in 2014, compared to 86 GW in 2013 and 80.5 GW back in
2011. The year 2014 total was dominated by wind and PV with 49 GW and 46 GW respectively.
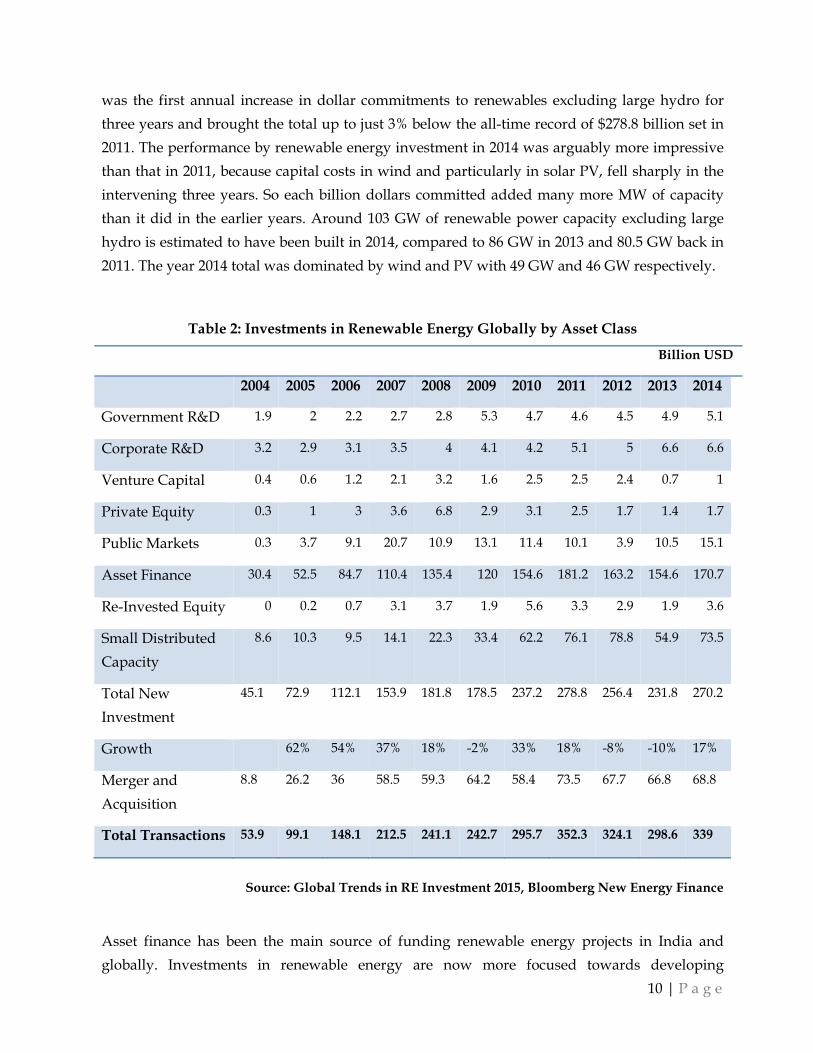
Table 2: Investments in Renewable Energy Globally by Asset Class
Billion USD
2004 2005 2006 2007 2008 2009 2010 2011 2012 2013 2014
Government R&D 1.9 2 2.2 2.7 2.8 5.3 4.7 4.6 4.5 4.9 5.1
Corporate R&D 3.2 2.9 3.1 3.5 4 4.1 4.2 5.1 5 6.6 6.6
Venture Capital 0.4 0.6 1.2 2.1 3.2 1.6 2.5 2.5 2.4 0.7 1
Private Equity 0.3 1 3 3.6 6.8 2.9 3.1 2.5 1.7 1.4 1.7
Public Markets 0.3 3.7 9.1 20.7 10.9 13.1 11.4 10.1 3.9 10.5 15.1
Asset Finance 30.4 52.5 84.7 110.4 135.4 120 154.6 181.2 163.2 154.6 170.7
Re-Invested Equity 0 0.2 0.7 3.1 3.7 1.9 5.6 3.3 2.9 1.9 3.6
Small Distributed
Capacity
8.6 10.3 9.5 14.1 22.3 33.4 62.2 76.1 78.8 54.9 73.5
Total New
Investment
45.1 72.9 112.1 153.9 181.8 178.5 237.2 278.8 256.4 231.8 270.2
Growth 62% 54% 37% 18% -2% 33% 18% -8% -10% 17%
Merger and
Acquisition
8.8 26.2 36 58.5 59.3 64.2 58.4 73.5 67.7 66.8 68.8
Total Transactions 53.9 99.1 148.1 212.5 241.1 242.7 295.7 352.3 324.1 298.6 339
Source: Global Trends in RE Investment 2015, Bloomberg New Energy Finance
Asset finance has been the main source of funding renewable energy projects in India and
globally. Investments in renewable energy are now more focused towards developing

11 | P a g e
economies as compared to developed economies.
Table 3: Investments in Developed and Developing Countries
Billion USD
2004 2005 2006 2007 2008 2009 2010 2011 2012 2013 2014
Developed 36 53 83 108 121 113 162 190 149 135 139
Developing 9 20 29 46 61 66 75 89 107 97 131
Total 45 73 112 154 182 178 237 279 256 232 270
Growth (%) - 62% 54% 37% 18% -2% 33% 18% -8% -10% 17%
Source: Global Trends in RE Investment 2015, Bloomberg New Energy Finance
2.2 Investment Scenario in India
India has been dominating renewable energy investment among developing countries together
with China and Brazil. In 2006, investment activities included a large wind capacity acquisition
and overall investment in wind sector was USD 1.1 billion. Biomass and waste together
received over USD 200 million in investment in the same year, as did small hydro. In 2007,
while India continued to invest heavily in research and development, asset financing also
increased significantly, demonstrating the shift to focus on power generation.
In particular, investment in the wind sector skyrocketed in 2007, comprising of investments of
around USD 2.5 billion2. The financial crisis impacted investments in 2008 and 2009, which
shrank due to banks adopting a more cautious attitude towards RE lending in the wake of the
global economic recession. However, investment nevertheless remained stable in bio-fuels and
biomass and a first series of investment occurred in the solar sector during these years.
Compared to the 2010 and 2011 investment levels, the wind energy sector suffered a slight
slowdown in growth in 2012.
Clean energy investments in India jumped to USD 7.4-7.9 billion levels in 2014, helping the
country maintain its position as the 7th largest clean energy investor in the world3. The upswing
was driven by the newly elected government in May 2014, which support clean energy reforms.
Bloomberg New Energy Finance (BNEF) estimates that 2015 will be the second time ever that
2IRENA, Financial Mechanisms and Investment Frameworks for Renewables in Developing Countries, December 2012. 3Bloomberg New Energy Finance.

12 | P a g e
clean energy investments will pass USD 10 billion. A record USD 13.1 billion was deployed in
2011. Interest in India from domestic and foreign investors has grown in first half of 2015. Early
signs of impact of policy interventions are positive. Specific yearly installation targets would
further help investors.
BNEF analysis shows that India has one of the lowest levelised costs of renewable energy
generation in the world. With the increasing cost competitiveness of renewables and increasing
interest in clean energy consumption by large commercial and industrial consumers, project
installations are also expected to rise this year. BNEF expects 2,500 MW of new solar capacity in
2015—1.5 times increase over last year. Wind installations are estimated to reach 2,800 MW—up
22% from 2014.
Table 4: Investments in Renewable Energy in India by Asset Class
Billion USD
India 2004 2005 2006 2007 2008 2009 2010 2011 2012 2013 2014
Government R&D Information Not Available 0.1
Corporate R&D Information Not Available 0.2
Venture capital 0.1 - 0.1 0.2 0.5 0.2 0.1 0.3 0.2 0.2 0.1
Private Equity Information Not Available
Public Markets Information Not Available 0 0.6
Asset Finance 2.6 2.8 4.7 5.2 5.1 3.9 8 12.4 7.1 6 6.3
Re-Invested Equity Information Not Available
Small Distributed
Capacity
Information Not Available
Total New
Investment
2.7 3.1 4.9 6.3 5.6 4.3 9 12.7 7.4 6.4 7.4
Growth 15% 58% 29% -11% -23% 109% 41% -42% -14% 16%
Source: UNEP, Bloomberg New Energy Finance
In India, quantum of investments rose by over 25% between 2004 and 2011, but then faltered in
part because of expiry of incentive schemes. However, last year saw rise in investment by 16%
to USD 7.4 billion, as political uncertainty was alleviated after the general election and the
restoration of accelerated depreciation for wind projects in May 2014. In H1 2014, renewable
energy investment in India reached only USD 2.4 billion —25%, below the total for H1 2013 on
account of elections in May 2014 and related political uncertainty. However, better lending
norms, loan tenors and policy implementation helped boost financing to USD 7.1 billion over
13 | P a g e
the year as a whole – 13% increase on 2013. Private Equity (PE)/ Venture Capital (VC)
investments in India declined by 72% in 2014 as against 2013 to USD 0.1 billion. Wind attracted
nearly half of the total investment, with USD 3.4 billion, but this was the lowest sector total
since 2009. The year-on-year decrease would have been even greater, if the government had not
restored accelerated depreciation. Solar was the only sector to see investment growth in India in
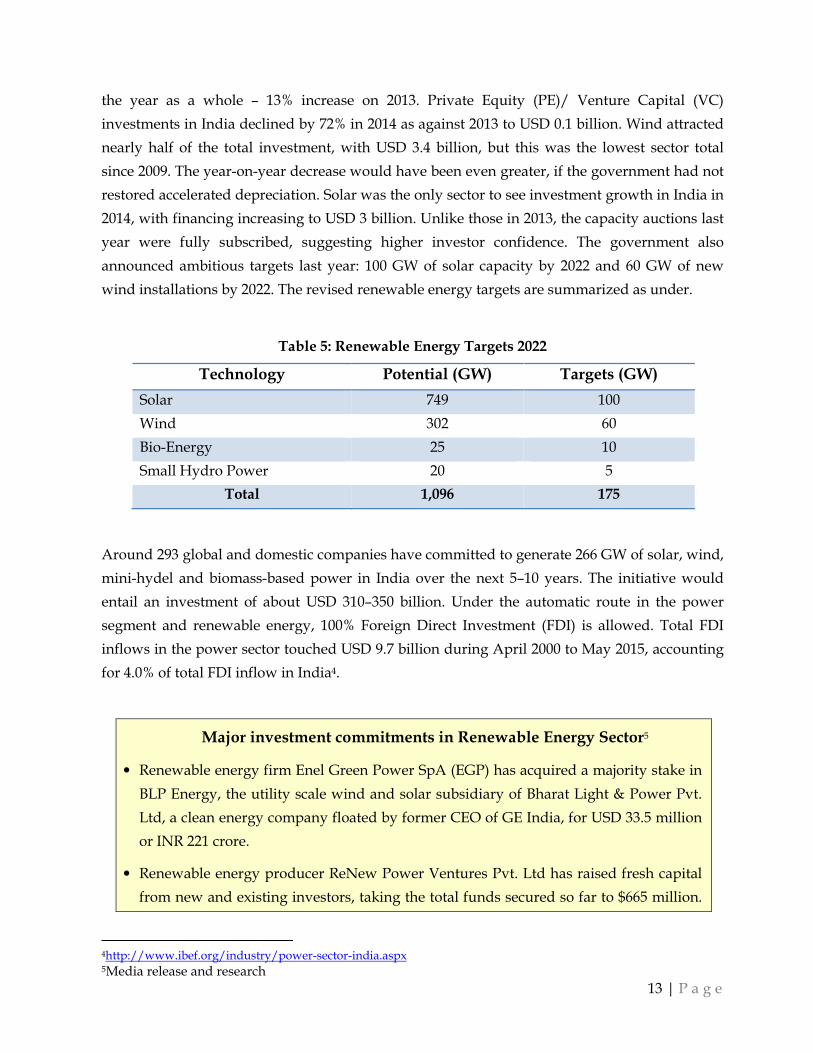
2014, with financing increasing to USD 3 billion. Unlike those in 2013, the capacity auctions last
year were fully subscribed, suggesting higher investor confidence. The government also
announced ambitious targets last year: 100 GW of solar capacity by 2022 and 60 GW of new
wind installations by 2022. The revised renewable energy targets are summarized as under.
Table 5: Renewable Energy Targets 2022
Technology Potential (GW) Targets (GW)
Solar 749 100
Wind 302 60
Bio-Energy 25 10
Small Hydro Power 20 5
Total 1,096 175
Around 293 global and domestic companies have committed to generate 266 GW of solar, wind,
mini-hydel and biomass-based power in India over the next 5–10 years. The initiative would
entail an investment of about USD 310–350 billion. Under the automatic route in the power
segment and renewable energy, 100% Foreign Direct Investment (FDI) is allowed. Total FDI
inflows in the power sector touched USD 9.7 billion during April 2000 to May 2015, accounting
for 4.0% of total FDI inflow in India4.
Major investment commitments in Renewable Energy Sector5
• Renewable energy firm Enel Green Power SpA (EGP) has acquired a majority stake in
BLP Energy, the utility scale wind and solar subsidiary of Bharat Light & Power Pvt.
Ltd, a clean energy company floated by former CEO of GE India, for USD 33.5 million
or INR 221 crore.
• Renewable energy producer ReNew Power Ventures Pvt. Ltd has raised fresh capital
from new and existing investors, taking the total funds secured so far to $665 million.
4http://www.ibef.org/industry/power-sector-india.aspx 5Media release and research
14 | P a g e
The firm raised USD 265 million (INR 1,722 crore) in the fresh round led by Abu Dhabi
Investment Authority (ADIA), which is one of the two sovereign funds of the UAE
and represents the emirate of Abu Dhabi. ADIA put in USD 200 million to pick up a
significant minority stake while the rest came from existing investors.
• Asian Development Bank (ADB), Goldman Sachs and Global Environmental Fund
have together invested USD 140 million in ReNew Wind Power on July 03, 2014.
• EIG Global Energy Partners made an investment of USD 125 million in Greenko
Group, which is planning to develop its wind farms and hydro power assets in India
by means of Green field projects and acquisitions
• Inox Wind Ltd., a subsidiary of Gujarat Fluorochemicals, a wind energy solutions
provider, plans to double its manufacturing capacity to 1,600 MW at a total investment
of INR 200 crore (USD 31.6 million) by the end of the next financial year.
• The Dilip Shanghvi family, founders of Sun Pharma, acquired 23% stake in Suzlon
Energy, with a preferential issue of fresh equity for INR 1,800 crore (USD 284.8
million).
• Reliance Power Ltd. signed an accord with the Government of Rajasthan for
developing 6,000 MW of solar power projects in the state over the next 10 years.
• Hilliard Energy plans to invest INR 3,600 crore (USD 600 million) in Ananthapur
district of Andhra Pradesh in the solar and wind power sector for the generation of 650
MW of power.
• Solar technology provider SunEdison signed a definitive agreement to acquire
Continuum Wind Energy, Singapore, with assets in India. The company,
headquartered in Belmont, California, would take over 242 MW of operating wind
assets that Continuum owns and operates in Maharashtra and Gujarat as well as 170
MW of assets under construction.
• Japanese internet and telecommunications giant SoftBank, along with Bharti
Enterprises (of Sunil Mittal) and Taiwanese manufacturing giant Foxconn, plan to
invest USD 20 billion in solar energy projects in India.
• The Government has also decided to enlarge the scope of the activities of Solar Energy
Corporation of India (SECI) to cover all renewable energy sources, with a view to
provide a comprehensive and optimized solution for generation of renewable energy
integrating various renewable energy sources. Considering this aspect, the
Government has allowed the change of name from "Solar Energy Corporation of India

15 | P a g e
(SECI)" to "Renewable Energy Corporation of India (RECI)" in 2015.
• Yes Bank raised INR 315 crore (~USD 49.2 million) from the International Finance
Corporation (IFC) to fund renewable energy and energy efficiency projects in India, in
the second green bond issue launched by Yes Bank. The green bonds were issued at
8.95% for 10 years in August 2015.
• Two state-owned companies, Indian Renewable Energy Development Agency
(IREDA) and Housing and Urban Development Corporation (HUDCO) are planning
to raise a total of INR 1,949 crore by placing out tax-free bonds to institutional
investors. IREDA is planning to raise up to INR 600 crore while HUDCO aims to raise
INR 1,349 crore through a private placement of tax-free bonds— both with a maturity
of 10 years.
Owing to the twin features of 1) being the fastest growing economies and 2) lowest per capita
consumption at 1,010 kWh among the large emerging economies, India is witnessing rise in
demand for electricity. Thus, its main objective is to build a cost effective and reliable power
portfolio. However, power project investments are lagging considerably due to:
a) Artificially low electricity prices
b) Many near-bankrupt distribution companies
c) Complex and inefficient processes
Unlike conventional energy technologies, renewable energy technologies often tend to have
high capital costs and very low operating costs. Thus, the cost of capital (finance) emerges as
one of the most significant contributors to the delivery of clean energy. In India, the cost of
capital is inherently high - typically in the range of 11-14%, vis-à-vis 3-7% range in the
developed economies. Obviously, expectations for Equity returns are even higher. This can
mostly be attributed to the inherent structure of India’s financial sector and the state of the
economy which influences factors such as the cost of money, its variability and tenor, and
inflation. These terms adversely affect RE projects.
The erstwhile Planning Commission estimates suggested that infrastructure development under
the 12th Five Year Plan would require more than a trillion USD, and the investment
requirements for RE may enhance it further. Therefore, financing is certain to be a challenge for
RE. Renewable energy tariffs, of which 70% are financing costs (but no fuel costs for 25-30
years), will reduce if loans can be provided at lower interest rates.
16 | P a g e
Biggest challenge faced for development of wind projects in India is affordable financing.
Affordable financing is one of the critical factors inhibiting the usage of wind energy in India.
High financing cost for wind energy can be closely related to the unpredictable
cash flows realized from wind energy projects. This paper discusses the various venues of
financing wind energy and optimizing costs.
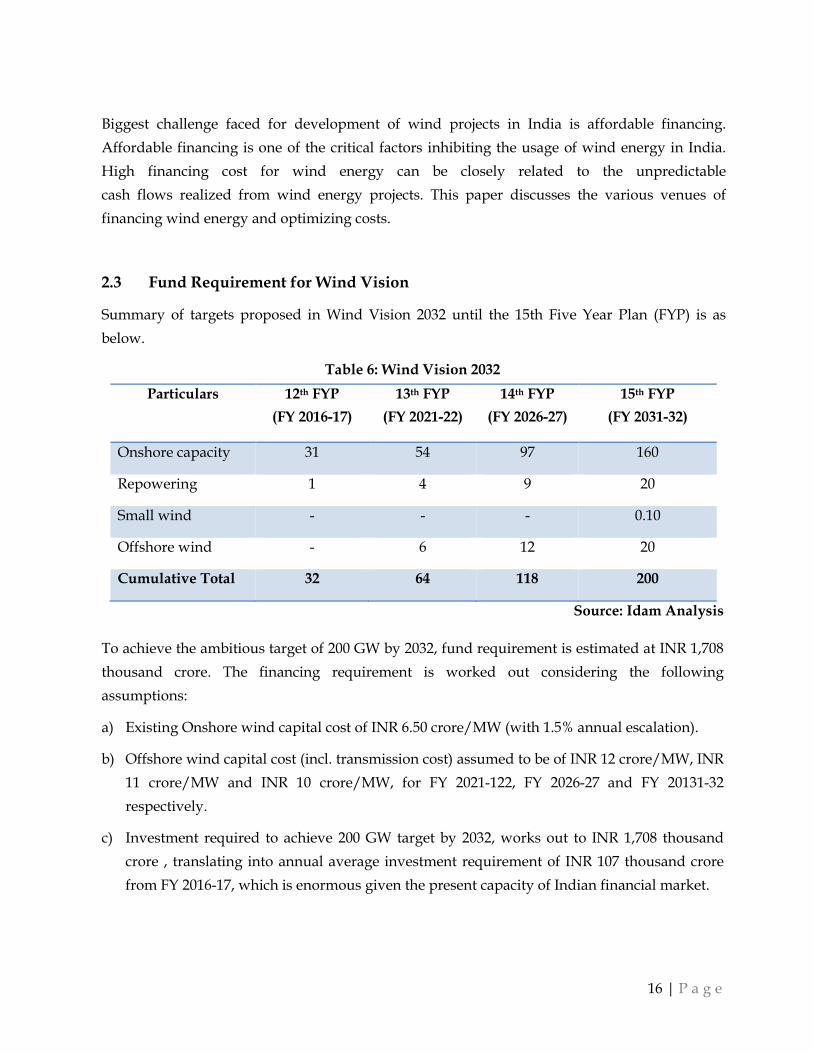
2.3 Fund Requirement for Wind Vision
Summary of targets proposed in Wind Vision 2032 until the 15th Five Year Plan (FYP) is as
below.
Table 6: Wind Vision 2032
Particulars 12th FYP
(FY 2016-17)
13th FYP
(FY 2021-22)
14th FYP
(FY 2026-27)
15th FYP
(FY 2031-32)
Onshore capacity 31 54 97 160
Repowering 1 4 9 20
Small wind - - - 0.10
Offshore wind - 6 12 20
Cumulative Total 32 64 118 200
Source: Idam Analysis
To achieve the ambitious target of 200 GW by 2032, fund requirement is estimated at INR 1,708
thousand crore. The financing requirement is worked out considering the following
assumptions:
a) Existing Onshore wind capital cost of INR 6.50 crore/MW (with 1.5% annual escalation).
b) Offshore wind capital cost (incl. transmission cost) assumed to be of INR 12 crore/MW, INR
11 crore/MW and INR 10 crore/MW, for FY 2021-122, FY 2026-27 and FY 20131-32
respectively.
c) Investment required to achieve 200 GW target by 2032, works out to INR 1,708 thousand
crore , translating into annual average investment requirement of INR 107 thousand crore
from FY 2016-17, which is enormous given the present capacity of Indian financial market.
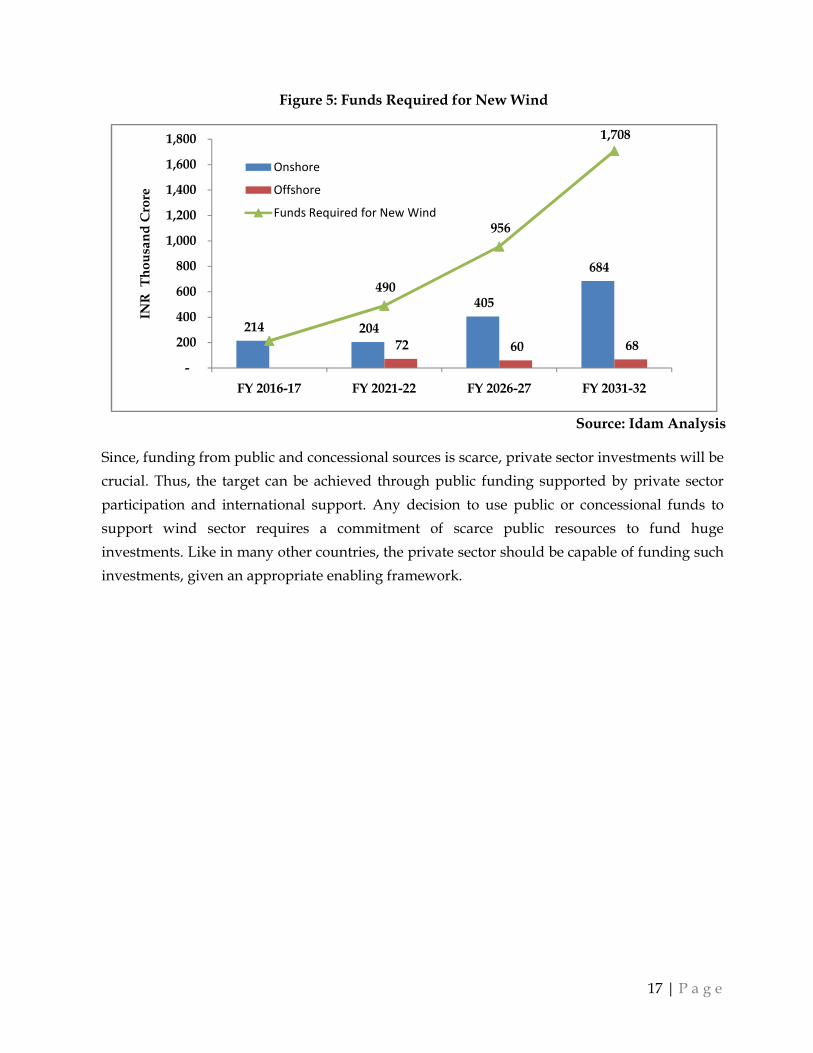
17 | P a g e
Figure 5: Funds Required for New Wind
Source: Idam Analysis
Since, funding from public and concessional sources is scarce, private sector investments will be
crucial. Thus, the target can be achieved through public funding supported by private sector
participation and international support. Any decision to use public or concessional funds to
support wind sector requires a commitment of scarce public resources to fund huge
investments. Like in many other countries, the private sector should be capable of funding such
investments, given an appropriate enabling framework.
214 204
405
684
72 60 68
490
956
1,708
-
200
400
600
800
1,000
1,200
1,400
1,600
1,800
FY 2016-17 FY 2021-22 FY 2026-27 FY 2031-32
INR
T
ho
usa
nd
Cro
re
Onshore
Offshore
Funds Required for New Wind

18 | P a g e
3 Debt Financing
Wind sector, a part of the power sector, forms an important constituent of the infrastructure
sector of the country’s economy. Therefore, the terms and conditions for financing wind
projects are same as that for the infrastructure sector.
3.1 Source of Debt Financing
3.1.1 Commercial Banks
Infrastructure financing for private sector projects in India has been led by commercial banks.
Commercial banks can be classified in two ways— one as rupee loan and foreign currency loan,
and the other is public and private banks. These banks are different from each other in terms of
their appetite for giving long tenure rupee loans to wind projects.
3.1.2 Infrastructure Finance Companies (IFCs)
Infrastructure Finance Companies (IFCs) are also playing a key role in financing renewable
energy projects in India. IREDA, Rural Electrification Corporation Limited, IDFC and Power
Finance Corporation are some of the IFCs having large credit exposure to the power projects.
Many private IFCs like L&T Infrastructure Finance and Tata Capital are more receptive to
financing RE projects. These financial institutions raise funds from multilateral agencies like
World Bank, Asian Development Bank (ADB) (with sovereign guarantee), issue infrastructure
tax-free bonds and explore other sources of low cost financing such as external commercial
borrowings (ECBs) and so on.
3.1.3 Institutional Investors
Multilateral development banks (MDBs)/Bilateral Agencies (BAs) includes World Bank, Asian
Development Bank, Japan International Cooperation Agency (JICA), KfW Development Bank,
Inter-American Development Bank (IDB) and the recently announced BRICS Bank. The MDBs
and BAs provide financial assistance to developing countries in order to promote economic and
social development. They primarily fund large infrastructure and other development projects.
3.1.4 Corporate Bonds
Bond market in India is one of the largest in Asia and includes issuances by the government
(central and state governments), public sector undertakings, other government bodies, financial
institutions, banks and corporates. In spite of the presence of a large number of players, bond
issuances are dominated by central and state governments that issue government securities. In

19 | P a g e
direct contrast, the corporate bond market is not well developed. Further, market for corporate
bonds is dominated by issuances from financial institutions. Bond issues by private sector
companies are limited. India has a short history of infrastructure bond issuance by financial
institutions. Many development finance institutions used to issue infrastructure bonds for retail
investors. These bonds were made attractive by offering options of tax free interest or tax saving
bonds.
Following table summarizes the common lending practice of various lending institutions as
discussed above.

20 | P a g e
Table 7: Sources of Debt Financing in India
Particulars Commercial Banks Infrastructure Finance Companies
Institution Investors Corporate Bond
Drivers in Raising Funds
• Credit rating of investor.
• Techno-commercial feasibility of the project.
• Past relationship with the bank.
• Financing structure (i.e., project finance or balance sheet financing).
• Credit rating of investor.
• Techno-commercial feasibility of the project.
• Financing structure (i.e., project finance or balance sheet financing).
• Sanction received from any bank.
• High credit rating of security.
• Low risk and high/optimum return.
• Past performance of the company/project.
• Loan tenure. • Market condition.
• Credit rating of security.
• Interest rate versus bank rate.
• Past performance of the company/project.
• Maturity period. • Above investment
grade debt instrument.
• Market condition. Door to Door Loan Period
• 10 to 12 years • 10 to 15 years • Maximum up to 15 years.
• Maximum up to 20 years.
Interest Rate • Normally floating rates.
• Sometimes Fixed rate also provided, but only for limited period.
• Interest rate = Base rate of bank + spread.
• Spread is dependent on credit rating/credit appraisal of the borrower.
• Interest rates comparable to Commercial Banks
• Some IFCs gives rebates in the interest rate, post commissioning of the project.
• IREDA provides loan at concessional rates to renewable projects.
• Fixed coupon rates. • Fixed coupon rates.
Special Features • Priority lending for Wind Sector approved by RBI.
• Investor may negotiate with the IFCs on some terms & conditions like DSRA, DSCR, repayment schedule and fixation of interest rate for specified
• Coupon rates are fixed till maturity of the security (Low Interest Rate Risk).
• Coupon rates for public issue are lower than the private placement.
• Coupon rates are fixed till maturity of the bond.
• Win-win situation for both bond investor and company, as investor receive higher interest

21 | P a g e
Particulars Commercial Banks Infrastructure Finance Companies
Institution Investors Corporate Bond
period. than bank deposit and company receive debt at lower interest than bank.
• Coupon rates for public issue are lower than the private placement.
Risk Hedging • Project Appraisal focus on DSCR and Project IRR.
• Pledging of shares and control on management.
• Penalty clause for payment default.
• Opening of trust and retention account.
• Maintaining debt service reserve account equivalent of repayment of 2 quarters.
• First right on the proceeding in case of distressed sale due to non-performance of the SPV/asset.
• Minimum and average DSCR of more than 1.25 and 1.50 respectively.
• Project IRR should be more than the industry average.
• Guarantee from parent organisation
• Pledging of shares with the IFCs and control on management.
• Penalty clause for payment default.
• Opening of trust and retention account with the lead bank.
• Maintaining debt service reserve account.
• First right on the proceeding in case of distressed sale due to non-performance of the SPV/asset.
• First right on the proceeding in case of distressed sale due to non-performance of the SPV/asset.
• First right on the proceeding in case of distressed sale due to non-performance of the SPV/asset.
• SEBI regulate market and screens market to avoid fraudulent activities.
Commitment • 2-3% of the loan • 2-3% of the loan • 0.5-1% of issue amount. • 0.5-1% of issue amount.

22 | P a g e
Particulars Commercial Banks Infrastructure Finance Companies
Institution Investors Corporate Bond
Charges amount. amount. Remarks • Needs to develop new
schemes to provide long term loans to wind projects.
• Need to cut short the project appraisal process to avoid delay in project execution.
• Need to increase exposure in the wind sector.
• Need to cut short their appraisal process to avoid delays.
• Need to secure low cost funds from multilateral agencies and / or international market.
• Interest Rate should be set in such a way that investor can predict project cash-flows with high accuracy.
• As coupon rates are fixed therefore loan has lower interest rate risk.
• Investor/Developer with high credit rating may secure debt by providing periodic fixed return, which increases certainty in cash-flow for the project.
• Low cost, low fluctuation risk, longer tenure as compared to domestic sources.
• Still relatively new to India, thus, require necessary boost from by the regulatory bodies.
• Need to create awareness among investors.

23 | P a g e
3.2 External Borrowings / External Debt
Gross external debt is defined as “the outstanding amount of those actual current and not
contingent, liabilities that require payment(s) of principal and/or interest by the debtor at some
point(s) in the future and that are owed to non-residents by residents of an economy.”
3.2.1 Multilateral and Bilateral Debt
Multilateral creditors are primarily multilateral institutions such as the International
Development Association (IDA), International Bank for Reconstruction and Development
(IBRD), ADB and so on. Bilateral creditors are sovereign countries with whom sovereign and
non-sovereign entities enter into one-to-one loan arrangements. Some of India’s bilateral
creditors who extend loans to both sovereign and non-sovereign debtors include Japan,
Germany, United States, France, Netherlands, Russian Federation, etc.
3.2.2 Trade Credits/Export Credits
Trade credits/export credits refer to loans and credits extended for imports directly by overseas
supplier, bank and financial institution to sovereign and non-sovereign entities. Depending on
the source of finance, such credits can be either suppliers’ credit or buyers’ credit.
• Suppliers’ credit: Such credit is extended by the overseas supplier of goods in the form of
deferred payments
• Buyers’ credit: Such credit is provided by a bank or financial institution and is generally
governed by OECD consensus terms and carries insurance from export credit agency of the
concerned country
3.2.3 External Commercial Borrowings
Commercial borrowing includes loans from commercial banks, other commercial financial
institutions, money raised through issue of securitized instruments like Bonds (including India
Development Bonds (IDBs) and Resurgent India Bonds (RIBs)), Floating Rate Notes (FRN) etc.
It also includes borrowings through Buyers’ credit & Supplier credit mechanism of the
concerned countries, International Finance Corporation, Washington [IFC (W)], Nordic
Investment Bank and private sector borrowings from Asian Development Bank (ADB).
Following table summarizes the common lending practice of external debt as discussed above.

24 | P a g e
Table 8: Sources of External Borrowings in India
Particular Multilateral and Bilateral
Agencies
External Commercial
Borrowings
Export Credit Agencies
Drivers in Raising Funds • Credit rating of the project/program and country.
• Government guarantee. • Techno-commercial
feasibility of project/program.
• Abide by strict restrictions imposed by agencies.
• Credit rating of the company and country.
• Guarantee (case to case basis).
• Techno-commercial feasibility of project.
• Should be in conformity of ECB guidelines/RBI regulations and directions.
• Availability of swap facility.
• Credit rating of the borrower and country.
• Guarantee (case to case basis).
• Techno-commercial feasibility of project.
• Relation of India with the country of ECA.
Door to Door Loan Period 20 to 30 years depends upon
type of project.
Up to 20 years depends upon
type of project and source of
finance
Up to 10 years.
Interest Rate • Interest rates charged by some multi-lateral agencies:
− World Bank: LIBOR + 0.2% + 0.25% (upfront fees) + sovereign guarantee.
− ADB: LIBOR + 0.4% + 0.15% (commitment charges) + sovereign guarantee.
• Sovereign guarantee fee ranges between 1% to 2% and is applicable when Govt. agency is undertaking the
Six months LIBOR + cost for
currency swapping + cost for
conversion into long term loan
+ lender premium on the
project.
LIBOR + hedging cost +
premium.

25 | P a g e
Particular Multilateral and Bilateral
Agencies
External Commercial
Borrowings
Export Credit Agencies
project.
• Additional spread of 2% to 3% (assumed) in case of non-sovereign loan.
• Additional cost of 3% to 6% for hedging interest rate risk and foreign exchange risk.
Lead Time for Project
Appraisal
6 to 12 months depending
upon the type of project.
Lead time depends upon the
type of project.
Lead time in raising debt will
depend upon sourcing of
equipments and negotiations
with the EXIM banks, which is
longer than domestic debt
raising.
Special Features Compliance by the
international best practice is
mandatory for the project
developer.
• Abide by the ECB Guidelines and RBI Regulations & Directives.
• All-in-Cost Ceiling. • Issuance of guarantee,
standby letter of credit, letter of undertaking or letter of comfort by banks, financial institutions and NBFCs relating to ECB is not permitted.
• ECA financing is restricted for project developer.
• Financing terms depends upon the country from where equipment is imported.
Risk Hedging • Sovereign guarantee require approval from Ministry of Finance.
• Abide to compliance with the international best practices.
Creation of charges over
immovable assets and financial
securities such as shares is
subjected to FEMA regulations.
Export Credit Agency executes
loan agreement with the
borrower.

26 | P a g e
Particular Multilateral and Bilateral
Agencies
External Commercial
Borrowings
Export Credit Agencies
Commitment Charges 0.5% to 1% of the issue amount. Charges vary with the type of
ECB source.
Higher as compared to
domestic debt raising.
Remarks • As coupon rates are fixed therefore loan has lower interest rate risk.
• Investor/Developer with high credit rating may secure debt from institutional investors by providing periodic fixed return. This shall also provide the certainty in cash-flow for the project.
• Lower interest rate than domestic rates therefore securing loans from ECB for wind project will result reduction in the capital cost.
• Process need to be simplified for ECB financing in wind sector.
• Microfinance need to be promoted in the sector.
• Considering the lower interest rates offered by ECAs, this financing should definitely be explored to the extent of import of equipments.
27 | P a g e
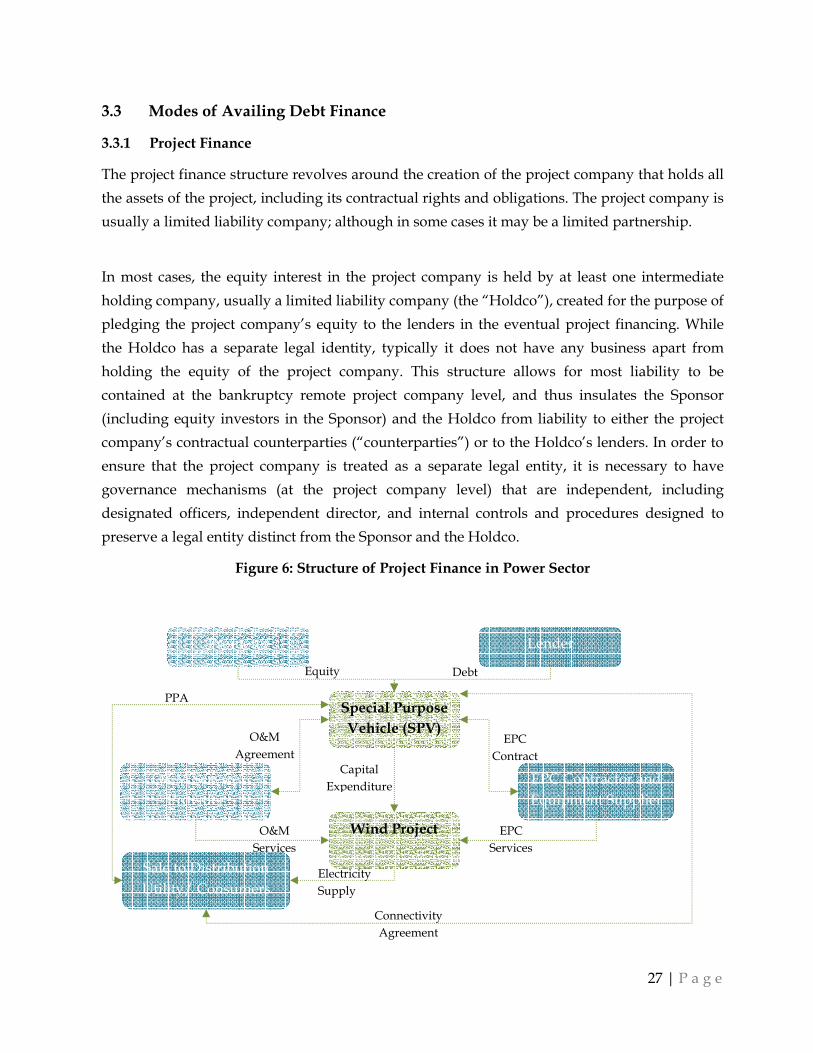
3.3 Modes of Availing Debt Finance
3.3.1 Project Finance
The project finance structure revolves around the creation of the project company that holds all
the assets of the project, including its contractual rights and obligations. The project company is
usually a limited liability company; although in some cases it may be a limited partnership.
In most cases, the equity interest in the project company is held by at least one intermediate
holding company, usually a limited liability company (the “Holdco”), created for the purpose of
pledging the project company’s equity to the lenders in the eventual project financing. While
the Holdco has a separate legal identity, typically it does not have any business apart from
holding the equity of the project company. This structure allows for most liability to be
contained at the bankruptcy remote project company level, and thus insulates the Sponsor
(including equity investors in the Sponsor) and the Holdco from liability to either the project
company’s contractual counterparties (“counterparties”) or to the Holdco’s lenders. In order to
ensure that the project company is treated as a separate legal entity, it is necessary to have
governance mechanisms (at the project company level) that are independent, including
designated officers, independent director, and internal controls and procedures designed to
preserve a legal entity distinct from the Sponsor and the Holdco.
Figure 6: Structure of Project Finance in Power Sector
Promoter Lender
Special Purpose
Vehicle (SPV)
Sale to Distribution
Utility/ Consumers
O&M Service
Provider
EPC Contractor and
Equipment Supplier
Equity Debt
O&M
Agreement EPC
Contract
PPA
Wind Project O&M
Services
EPC
Services
Electricity
Supply
Capital
Expenditure
Connectivity
Agreement
28 | P a g e
Project financing has been used extensively by wind independent power producers (IPPs). In
some cases, project finance is the only alternative for RE producers because they often do not
have the assets, track record, or credibility to obtain corporate financing on favorable terms.
From the developer’s perspective, project financing does provide certain advantages, as
compared to corporate-finance. First, project-finance is generally non-recourse (sometimes
limited recourse) to the parent company and therefore does not have a substantial impact on
their balance sheet or creditworthiness. Second, the greater debt capacity typically associated
with project-finance can result in reduced financing costs because debt funds are less costly
than equity. Consistent with industry practice, developers using project-finance typically seek
to maximize the fraction of debt in the capital structure of their projects subject to lender
constraints. The most important lender constraint is the Debt Service Coverage Ratio (DSCR).
However apart from positive aspects, some negative aspects of project finance include the large
transaction costs associated with arranging the various contracts, high legal fees, higher debt
and equity costs and a greater array of restrictive loan covenants.
3.3.2 Corporate Finance
Investor Owned Utilities (IOUs) depend primarily on corporate finance structures, which rely
on the attractiveness of a firm’s balance sheet and prospective cash-flows. Therefore, when
IOUs borrow money from public markets, the support for their credit comes from the income
stream of their entire asset base (generation, transmission, and distribution) and not from any
individual project. Corporate finance, therefore, lacks the degree of specificity found in project
finance. Similarly, equity contribution in Corporations differs from those in Project-financed
power facilities because returns are based on the multiple income streams of the company’s
asset base, not an individual project.
Debt and equity investors in IOUs typically require lower returns than investors in individual
power projects. This is due to the asset diversity of corporate finance, the increased liquidity
and information flow associated with public markets, the franchise monopoly provided to
IOUs, and the implicit social contract with regulatory agencies to maintain the existence of firms
barring catastrophic events. The benefits associated with IOU corporate finance include:

29 | P a g e
Figure 7: Structure of Corporate Financing in Power Sector
a) Lower interest rate debt;
b) Longer debt amortization;
c) Lower cost equity; and,
d) No project specific debt service coverage requirements.
3.3.3 Take-Out Financing
Commercial bank funding of infrastructure projects runs the risk of asset-liability mismatch. An
innovative method is to encourage the use of “take-out” finance. Here, a bank which is funding
an infrastructure project gets into an arrangement with a financial institution, where the
institution commits to buying the bank’s loans after a certain period. There are two versions to
this arrangement: Unconditional and conditional takeout finance. The unconditional takeout
finance involves full or partial credit risk with the institution agreeing to take over the finance
from the original lender. Under conditional takeout finance, the institution commits to taking
over the finance from the lending institution only if it is satisfied with certain stipulated
conditions.
Hence, it is only unconditional takeout financing that helps bank resolve the asset-liability
mismatch since under the conditional takeout financing model, the long-term risk still remains
on the books of the banks until the take out actually happens. While unconditional takeout
financing is not very common, it can give a fillip to infrastructure financing by addressing both
Lender
Promoter
Sale to Distribution
Utility/ Consumers
O&M Service
Provider
EPC Contractor and
Equipment Supplier
Capital Debt
O&M
Agreement EPC
Contract
PPA
Wind Project O&M
Services
EPC
Services
Electricity
Supply
Capital
Expenditure
Income from
Other Businesses
Connectivity
Agreement

30 | P a g e
the unwillingness and the lack of experience of institutional investors to participate in
infrastructure financing. Indian banks may provide such takeout financing to the wind project
developer where loan is required for longer period. This will ascertain better liquidity
management for the banks and longer duration loan for investor.
3.4 Other Sources of Funds
3.4.1 National Clean Energy Fund (NCEF)
The Government of India has set up the NCEF to serve as a separate corpus for funding green
energy projects with the broader objective of cutting down India’s carbon footprint. Initially
starting from INR 50 per ton imposed on production/import of coal, lignite and peat, the clean
energy cess was increased to INR 100 per ton in FY 2014-15 and INR 200 per ton in FY 2015-16.
Up to FY 2014-15, the government has collected INR 16,389 crore as cess and the budget
estimates expect to further collect an amount of INR 13,118 crore in FY 2015-16. However,
recently, there have been several news articles reporting utilization of NCEF for balancing fiscal
deficit. A statement published by the Ministry of Finance, Government of India, states that the
Inter-Ministerial Group in its 11th meeting held on 25 September 2014recommended projects
amounting to INR 16,511 crore to obtain funding from NCEF. This also includes INR 2,500 crore
recommended to be provided to IREDA for on-lending to viable Renewable Energy (RE)
projects. IREDA has released funds amounting to INR. 1080.65 crore until August 2015 for
Implementation of Generation Based Incentives (GBI) for grid interactive wind power
projects6.
3.4.2 Infrastructure Debt Funds (IDF-NBFC)
An IDF-NBFC is a new vehicle designed to facilitate the flow of low-cost, long-term funds from
domestic and global debt investors, to capital-intensive infrastructure projects. IDF-NBFCs will
provide long-term funds to operational infrastructure projects, enabling them to refinance their
existing bank loans. An innovative credit enhancement mechanism allow IDF-NBFCs to bridge
the gap between the low-risk appetite of long-term debt investors and the relatively higher risks
associated with infrastructure projects.
The Ministry of Finance incubated the idea of an infrastructure debt fund that can supplement
bank finance in infrastructure by taking over a substantial share of outstanding loans. IDFs can
6http://www.ireda.gov.in/forms/contentpage.aspx?lid=744

31 | P a g e
be set up as a trust through mutual fund route and regulated by the Securities and Exchange
Board of India (SEBI) or as a company through the non-banking finance company route and
regulated by the Reserve Bank of India (IDF-NBFC). Currently, two IDF-NBFCs (L&T Infra
Debt Fund Ltd and India Infradebt Ltd, both rated CRISIL AAA/Stable) are operational.
Key features of IDF-NBFCs:
a) Investment is allowed only in PPP projects with a minimum operating track record of one
year, which ensures elimination of construction risks.
b) Mandatory tripartite agreement between the project authority, Project Company and the
IDF-NBFC provides credit enhancement in the event of a financial default --with the right to
terminate the concession agreement, priority access to termination payment from project
authority and well-defined timelines for completion of the termination process.
c) Buyout guarantee from project authority, which require the project authority to take over
the project and repay the lender in the event of default. However, there is a need for a
central body for the renewable sector to provide such guarantees as project authorities for
most renewable projects will be state distribution companies which, in turn, have weak
credit profiles.
To incentivize overseas investments in these funds, government has lowered withholding tax
on interest payments by IDF from 20% to 5% and exempted income of IDFs from tax. During FY
2014, India Infrastructure Finance Company Limited (IIFCL) mobilized long-term resources of
INR16.1 billion primarily from multilateral and bilateral institutions, approximately 50% more
than FY 2013. IIFCL was also allowed to offer financial assistance to PPP projects with the
flexibility of tenors to be longer than other consortium lenders to spread debt repayments over
a longer period, for improved liquidity, better viability and reduced restructuring risk.
3.4.3 Green Bonds7
Green bonds are fixed-income securities that raise capital exclusively for projects or activities
with specific climate or environmental sustainability aims such as renewable energy, waste
management and energy efficiency. A growing number of investors, issuers and intermediaries
believe that bonds are particularly well-suited as a source of capital to finance a transition to a
low-carbon economy.
7http://ifcextapps.ifc.org/ifcext/Pressroom/IFCPressRoom.nsf/0/3EEBDBE938EBEF0F85257E96006C578E Moody’s Report on Environmental Risks and Developments - Green Bonds Start to Bloom
32 | P a g e
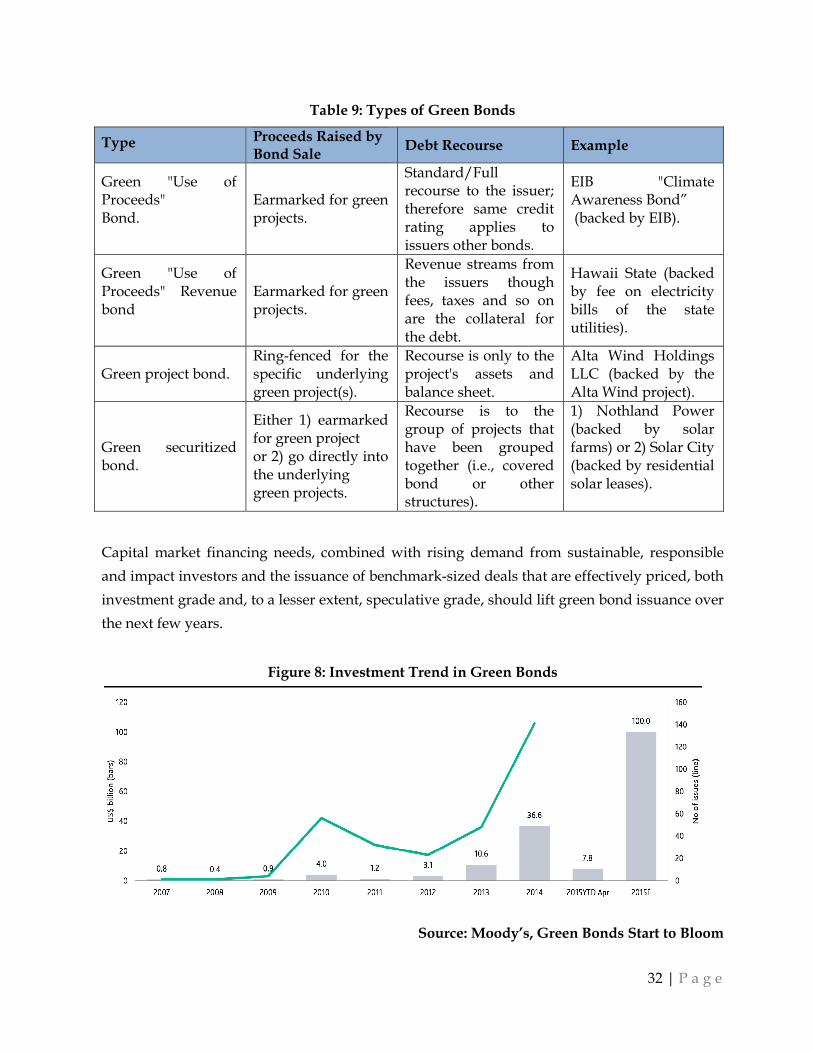
Table 9: Types of Green Bonds
Type Proceeds Raised by Bond Sale
Debt Recourse Example
Green "Use of Proceeds" Bond.
Earmarked for green projects.
Standard/Full recourse to the issuer; therefore same credit rating applies to issuers other bonds.
EIB "Climate Awareness Bond” (backed by EIB).
Green "Use of Proceeds" Revenue bond
Earmarked for green projects.
Revenue streams from the issuers though fees, taxes and so on are the collateral for the debt.
Hawaii State (backed by fee on electricity bills of the state utilities).
Green project bond. Ring-fenced for the specific underlying green project(s).
Recourse is only to the project's assets and balance sheet.
Alta Wind Holdings LLC (backed by the Alta Wind project).
Green securitized bond.
Either 1) earmarked for green project or 2) go directly into the underlying green projects.
Recourse is to the group of projects that have been grouped together (i.e., covered bond or other structures).
1) Nothland Power (backed by solar farms) or 2) Solar City (backed by residential solar leases).
Capital market financing needs, combined with rising demand from sustainable, responsible
and impact investors and the issuance of benchmark-sized deals that are effectively priced, both
investment grade and, to a lesser extent, speculative grade, should lift green bond issuance over
the next few years.
Figure 8: Investment Trend in Green Bonds
Source: Moody’s, Green Bonds Start to Bloom

33 | P a g e
The data from the Climate Bonds Initiative (CBI) shows that the volume of green bonds sold in
2014 tripled to almost USD 37 billion from the previous year. The CBI, a not-for-profit
organization and some investment banks think issuance could triple again to USD 100 billion in
2015, although this looks less likely based on volumes so far this year. Bloomberg New Energy
Finance (BNEF) estimates $80bn green bonds to be issued in 2015.
As per Moody’s report, the global green bond market is expected to exceed USD 40 billion, with
countries such as India and China offering sizeable growth potential, as India is looking to raise
these low-cost, long-term funds to finance its plan to quadruple its renewable energy
production and to make it economically viable. India‘s Yes Bank Limited (Baa3 stable) sold the
first green bond in the country, the world’s third-largest emitter of greenhouse gases, in March
2015. It aims to use proceeds from the 10-year INR10 billion note to fund renewable energy
projects. Companies and municipal governments combined overtook development banks, the
pioneers of green bonds, as the biggest issuers last year, accounting for 46% of the total. That
was followed by the Export-Import Bank of India (Baa3 positive) which issued a five-year USD
500 million bond to finance low-carbon transport, solar and wind projects.
3.4.4 Green Masala Bond
IFC, a member of the World Bank Group, has issued a Green Masala Bond for raising
INR 3.15 billion—approximately USD 49.2 million—for private sector investments that address
climate change in India. The bond, listed on the London Stock Exchange, is the first green bond
issued in the offshore rupee markets. IFC will invest the proceeds of the bond in a green bond
issued by Yes Bank, one of India’s largest commercial banks. Yes Bank will invest the proceeds
of its bond in renewable energy and energy efficiency projects, mainly in the solar and wind
sectors.
The bond is issued under IFC’s USD 3 billion offshore rupee Masala bond program and yields
6.45% p.a. Under the program, IFC has issued bonds worth over INR 103 billion (USD 1.66
billion) in a range of tenure, building a triple-A yield curve and attracting new investors to the
offshore rupee markets. IFC has also issued onshore Maharaja bonds under a USD 2.5 billion
program for issuances in India’s domestic capital markets.
IFC also is one of the earliest issuers of green bonds, launching a green bond program in 2010 to
help catalyze the market and unlock investment for private sector projects that support RE and
energy efficiency. As of June 2015, IFC had issued USD 3.8 billion in green bonds, including two

34 | P a g e
benchmark USD 1 billion issuances that were, at the time, the largest such issuances in the
markets; and a 500 million renminbi-denominated (approximately USD 80.29 million) green
bond that was the first such issuance listed on the London Stock Exchange.
Masala bonds will create an alternative funding source and firms like Indian Railway Finance
Corporation (IRFC), Power Finance Corporation (PFC), Rural Electrification Corporation (REC),
NTPC Ltd. along with big NBFCs could issue these rupee denominated overseas bonds in the
next 12 months. Indian companies could raise up to USD 5 billion over the next three years
through issue of offshore rupee or masala bonds, but success of the new instrument will depend
on competitive pricing and attractive returns.8
3.4.5 Partial credit-enhancement facility for corporate bonds
The Reserve Bank of India (RBI) has allowed banks to provide credit enhancement to corporate
bonds either as a subordinated loan facility or as a non-funded contingent line of credit. The
subordinated credit/loan facility is similar to mezzanine finance and ranks below senior bond
but ahead of equity in terms of repayment priority.
If allowed, banks can also provide credit enhancement as a non-funded facility in the form of an
irrevocable and revolving contingent credit line, which may be drawn on the occurrence of a
credit event such as cash shortfall during construction or debt service shortfall after project
completion. In the event, the project runs into difficulties and the credit line is drawn, the bank
will inject funds to create a mezzanine instrument similar to the funded credit facility. Partial
credit enhancement provided by banks will, however, be limited to improving the credit rating
of bonds by two notches, or 20% of the entire bond issue, whichever is lower.
In September 2015, IIFCL has announced the issuance of India’s first “credit enhanced”
infrastructure bond to be issued by Renew Wind Energy (Jath) Ltd for INR451 crore which shall
be partially guaranteed by the Infrastructure Finance Company and counter-guaranteed by the
Asian Development Bank. The rating of this bond has been enhanced based on partial credit
guarantee by IIFCL under its “credit enhancement scheme,” with a counter-guarantee up to
50% from the ADB. This has enhanced the rating of the bond to AA+ (SO).
8”The Success of Masala Bonds Will Depend on Satisfying International Investors' Palate,”, Standard & Poor's Ratings Services
35 | P a g e
3.5 Barriers/Risks in Indian Debt Market Financing
Lenders in underdeveloped economy aim to minimize their risk by providing funds to a project
which are provided as guarantee by the government or fundamentally strong corporates.
Foreign developer and medium/small size promoters generally undertake project on their own
and faces issues in securing funds from domestic market as under:
3.5.1 Limited Long-Term Debt Market
Most wind projects fructify into profit making entities 10 to 15 years after the initial investment
and hence require longer tenor financing (with long drawn out repayments) to ensure financial
viability of the project. However, long-term debt is not easily available in India for several
reasons:
a) Under-developed Bond Market: The availability of a developed bond market is an
important backbone to project financing for infrastructure, as it increases the prospects for
project finance banks to eventually off-load their assets and for project developers to lock in
fixed interest rates at lower margin, when the project has stabilized after a few years of
operation. In 2013, India’s total outstanding bonds amounted to 54.5% as a percentage of
GDP, compared to other Asian countries such as Malaysia (105.5%), China (46.2%), Korea
(126.2%) and Thailand (74.4%). India is lagging far behind other countries in the corporate
debt market, which accounted for around only 4% of the total debt market, a tiny amount
when compared to other countries. The growth of the corporate bond market in India has
been limited largely due to stringent regulations and under-developed financial markets.
Foreign investment has traditionally remained controlled with SEBI and RBI imposing
periodic limits on foreign participation.
b) Asset-Liability Mismatch: Commercial bank funding of infrastructure projects run the risk
of asset-liability mismatch. Banks has short-term deposit and funds which restrict them to
provide long tenure loans to the wind projects. According to the Reserve Bank of India
(RBI), nearly 79% of bank deposits in 2009-10 had an average maturity of below three years.
Banks in India have an appetite of providing loan not more than 5 to 7 years, while the
infrastructure sector requires long-term debt of more than 10 years.
c) Limited Takeout Financing Schemes: India has not seen examples of takeout financing
between Banks and FIs for promotion of renewable energy financing. Union Bank of India
(UBI) and India Infrastructure Finance Company Limited (IIFCL) had launched a scheme of
takeout financing for identified projects to promote infrastructure projects in India.
However, due to lack of agreement on the terms between bank and FIs, not much of such
schemes came into existence.

36 | P a g e
d) High Financing Cost: In India, high interest rate regime is seen as a major reason for the
slowdown in the growth and low appetite for investment. Unless inflation is tamed,
nominal rates cannot come down, as real interest rates will tend to move to unsustainable
levels. Uncertainty around the government’s future borrowing needs and the value of the
Rupee create a longer term ambiguity about the development of long term debt market.
In the current scenario, securing loan from external resource also results in higher interest rate
owning to high swapping cost in India and high risk premium by the foreign lenders. Since
2008 till 2014, India and China witnessed considerable increase in benchmark interest rates, as
compared to developed countries have marked reduction in their benchmark interest rate.
Figure 9: Interest Rate Trends
e) Volatile Market: Indian market is considered to be among the volatile market. High
inflation rate results into instability in economy, forces fluctuation in the interest rates and
uncertainty among the investors. Overseas lenders are anxious of investing in volatile
market where interest rate fluctuates and results in the loss due to fluctuation. Overseas
lenders have advantage of providing low cost loans over domestic lenders. Uncertain
market may result into loss of advantage over domestic lenders.
2008 2009 2010 2011 2012 2013 2014
India 7% 4.25% 6.25% 8.50% 8% 7.74% 8%
China 5.60% 5.30% 5.80% 6.56% 6% 6% 6%
US 1% 0.25% 0.25% 0.25% 0.25% 0.25% 0.25%
Brazil 13.75% 8.84% 10.75% 11% 7.25% 10% 11%
Indonesia 9.24% 6.50% 6.50% 6% 5.75% 7.50% 7.50%
UK 2% 0.50% 0.50% 0.50% 0.50% 0.50% 0.50%
0%
2%
4%
6%
8%
10%
12%
14%
16%
37 | P a g e
f) Lack of Fixed Interest Rate Loans: In India, lenders prefer to provide loan at floating rates
as compared to fixed interest rate loans for longer tenure, due to the following reasons:
• Asset liability mismatch
• Unavailability of long term hedging instruments
• High cost of term swaps
• Weak bond market
• Uncertainty in financial markets
• Risks related to a growing economy
However, in some cases lenders provide fixed interest rate loans for fixed period and reset such
rates periodically. Floating interest rate reduced certainty in cash-flows for the equity holder
and lenders, which directly effects financial viability of the project.
In India, the lender as well as the equity holder perceive incurring losses due to variability in
the interest rate. Equity holder presumes that interest rate will fall in future. However, lender
presumes that interest rate shall increase in future. Lenders while providing fixed interest rate
loan adds premium to the prevailing interest rate for securing equity holder from variability of
interest rate.
g) Limited Credit Exposure Limit: Most of the banks/FIs specify their limits for power sector
as a whole. Commercial banks in India cap investments in infrastructure at 10-15% of their
total domestic advances based on the Reserve Bank of India (RBI) prudential lending
norms. At present, the RE sector is coupled with the power sector, which is governed by
(implicit and self-enforced) sub -sector limits in the range of 4.5-5.0%. During the last few
years, due to large capacity additions, primarily of coal based power projects, commercial
banks in India almost reached their lending limits for the power sector potentially leaving
limited funds for renewable power projects. Further, resulting increase in cost of debt due
to increase in demand for funds.
h) Wind Variability: At the time of commissioning and in the early years of operation, wind
variability risk manifests in the form of estimation error and/or sharp deviation in actual
energy output compared with estimates in wind velocity studies. The error could arise due
to technical glitches such as measuring wind velocity at an incorrect mast height, sample
bias because data used to estimate average energy output is of relatively small periods,
faulty estimation of power curve of a wind turbine and so on.

38 | P a g e
Thus, the inherent risk of wind variability year-on-year is characteristic of the wind energy
sector and could impact cash flows and credit qualities of wind-based IPPs. Among the key
assumptions in modelling debt service coverage ratio (DSCR) for projects, capacity utilization
factor (CUF) has the most impact on the viability of any wind project. Seasonality in wind flow
and therefore intra-year variability in energy output can be planned for in a much better
manner by crafting debt repayment to match cash flows and building additional liquidity
through mechanisms such as debt service reserve accounts and so on.
i) Non-Recourse Financing Is Limited in India: Typically in India, lenders finance any
project based on the credibility of the promoter. Promoter has to provide security or
guarantee to the lenders. Under non-recourse financing, the project is set up as a separate
company and the loan is disbursed to that company. Since the lender only has recourse to
that project, if the project company fails, the lender loses their investment. The project
owner, meanwhile, loses only their investment in that specific project company. That
means there is no recourse to the parent company of the project developer. Developers
often prefer this type of financing because it is less risky to their company and they can
leverage the balance sheet of the parent company more aggressively. Developers typically
pay a significant premium for project debt over recourse debt at the parent company level,
because the lower risk to the parent company enables them to take on additional projects.
Financial institutions like IREDA support non-recourse subject to the project viability, its cash-
flow and credentials of the promoters.
j) Capital Limit on ECB: RBI has imposed limit on ECB for infrastructure projects, same limit
applies on the renewable and wind projects. Companies operating in RE sector can avail
ECB up to USD 500 million per year through automatic route. However, companies can
raise an additional USD 250 million per year with government’s approval. According to the
market, limit on ECB may not be impacting RE projects at the moment due to the scale of
the wind projects in India, but they may bind in the future and ECB ceiling may become a
barrier for investments in RE projects.
At the project level, assuming a typical debt-equity ratio of 70:30, Indian wind and solar
renewable projects have reached only 55% and 63% respectively, of the USD 500 million ECB
limit. At an average cost of USD 1.3 million per MW, it is estimated that more than 550MW
wind project would surpass the ECB limit.
k) Interest Rate Ceilings on ECB: According to the ECB guidelines, interest rates are capped
at Libor+350 basis points for loans with an average maturity of three to five years and at
39 | P a g e
Libor+500 basis points for loans with an average maturity of more than five years. It has
been argued that, while these caps may be adequate for “normal” industrial projects, they
are too low to attract funds for wind and renewable projects. They limit the compensation
which lenders can receive for longer tenure or higher credit risk and, in effect, reduce the
availability of long term loan funds for infrastructure, where credit needs are typically for
longer durations and where risk profiles often require pricing at spreads higher than those
allowed by ECB caps. For many investors, these conditions may be so stringent as to make
investing in Indian renewable energy unattractive.
According to the project developers and banks, a typical foreign loan may cost approximately
2% less than an equivalent domestic loan and loans provided by banks could be even cheaper.
However, not many RE projects in India are being financed by foreign loans due to high
hedging costs, as well as the interest rate ceiling. The availability of foreign loans is further
limited by international lenders in need of a company (or project) rating equivalent to India’s
sovereign rating (BBB-), in addition also requires credit guarantees from the holding companies.
Higher international funding transaction costs also make it difficult for small project developers
to opt for foreign loans.
l) Lack of Deep Forwards Market in Foreign Exchange: Renewable projects require long
tenure loans and if financed through foreign currency borrowings these need to be
adequately hedged against currency risks. Inability to hedge long term currency risk in a
market which is limited to one year’s forward cover, poses a big challenge to the use of
foreign currency loans in renewable energy projects. Further, swap rate needs to be
rationalized, based on the inflation rates of the countries.
m) Non Performing Asset (NPA) Issue: According to the RBI guidelines for Banks and
NBFCs, loan is considered as the NPA if it remains overdue for more than 90 days for
banks and 6 months for NBFCs. Wind power producer generally has 5 to 6 months of
accounts receivables which delays debt servicing by same period and convert their account
into NPA. As banks has shorter overdue period, therefore, delay in interest payment and
principal of loan by 90 days impacts books of the banks. Hence, banks generally do not
prefer to provide loans to the asset which results even into temporary NPA in their books.
n) Distribution Utility’s Poor Financial Health: Therefore, lending is restricted in those states
considering the poor financial condition of their state Discoms who are the counter-parties
to many of the contracts that pay the RE projects. The dichotomy of the wind power sector
in India is that, states with rich wind resource, have Discoms with among the weakest
financial profile such as Tamil Nadu and Rajasthan.

40 | P a g e
3.6 Risks Management Practices
To attract investments or debt financing, project developers should exhibit stable performance
driven by healthy risk-management practices. Some of the key risk-management practices being
adopted by project developers in India are:
a) Focus on States with Low Counterparty Risk: One of the key counterparty risks that
Independent Power Producers (IPPs) face arises from the weak financial profile of Discoms.
In the past, there have been significant payment delays by some Discoms, such as in the
high-wind potential states of Tamil Nadu and Rajasthan. To mitigate this, IPPs have
focused on setting up capacities in states having good payment record such as Maharashtra
saw a sharp increase in capacity addition, even as it declined in Tamil Nadu.
b) Geographical Diversification at the Special Purpose Vehicle (SPV) Level and at a Group
Level: To address counterparty risk, IPPs have focused on diversifying their portfolio
across states both at the (SPV) and group levels. When different projects get executed under
one SPV, cash flows between SPVs ease the pressure on receivables to some extent.
c) Longer Tenures and Innovative Structuring of Debt to Partially Offset Wind Variability
Risks: IPPs with credit ratings have been exploring longer-tenure debt of 12-13 years with
one or two-year moratoriums, apart from customised repayment structures with higher
repayment in the months of high wind speeds. Some of the IPPs have also resorted to
pooling of cash flows of several projects to raise debt, instead of linking cash flows of a
single project to debt repayments. As a part of loan structuring, projects also maintain cash
in the form of debt service reserve account. As a prudent measure, IPPs also maintain cash
at the group level for contingencies.
d) Strategies to Offset Preconstruction Risks: In the last three years, there had been strong
growth in RE projects, especially wind and solar. However, this was not supported by
adequate infrastructure in many states. Hence, despite their must-run status, many projects
had to reduce production, especially in Tamil Nadu. Wary of this, IPPs now plan their
evacuation infrastructure before investing in projects.
e) Others: To mitigate design and construction risks, IPPs have diversified their procurement
across various wind turbine equipment manufacturers.
3.7 Risks Management Instruments
3.7.1 Partial Guarantee
Partial guarantee helps in raising the credit quality of debt issued by project SPVs to levels
41 | P a g e
where bond market investors become comfortable. India Infrastructure Finance Company
Limited (IIFCL), a government-owned enterprise, set up to provide long-term finance for
infrastructure projects, offers partial guarantee to enhance the ratings of bonds issued by
infrastructure companies. The key features of the partial guarantee scheme are mentioned
below.
a) The project should be in the post-commissioning phase, and its standalone credit rating
should be at least “BBB”. This ensures guarantees are available only for viable and
creditworthy projects, and investors do not take exposure to development risks in the pre-
commissioning phase.
b) On project cash flows, IIFCL will have a subordinated charge to bond investors and pari-
passu charge with other senior debt holders to the extent of the invoked guarantee, after the
bond investors are paid in full.
c) IIFCL will provide unconditional and irrevocable credit guarantee to enhance the rating up
to a maximum of “AA” on the issuer's bonds.
d) The guarantee/credit enhancement by IIFCL for the project bonds should not exceed 40% of
the total project cost and 50 per cent of the aggregate bonds issued.
e) Partial guarantee thus de facto elevates the rating on an instrument from the issuer's rating
to that of the guarantor's. The level of enhancement depends on factors such as coverage,
timing and nature of the guarantee, the extent of cash flow recoveries that can be expected
on delay or default by the issuer and the legal and payment structure.
3.7.2 Loan Guarantee by Parent Companies
As large wind projects are developed under SPV model, lenders always look for the guarantee
from the parent company of the SPV. Guarantee from the parent company hedge risk of lenders
depending upon the type of guarantee provided by the parent company. In most cases, SPV is
financed by the lenders based on balance sheet and credit rating of parent company.
3.7.3 Government Share in Project
In India some of the state governments adopt Public Private Partnership (PPP) model for
development of infrastructure project. Government, being one of the stakeholders in the project
under this model, increase confidence in the lenders to provide loans to such projects.
Government may replicate the same model in development of large scale wind projects.

42 | P a g e
3.7.4 Government Guarantee to Agencies
Government guarantees are given by host governments to assure project lenders that they will
take certain actions or refrain from taking certain actions affecting the project. Typically,
multilateral agencies provide debt at lower rates to the emerging economies. To safeguard their
money, they demand guarantee from government of the concerned country. The Government
in turn charges sovereign guarantee fee from the borrower, such as Government of India (GoI)
charges 1-2% guarantee fee from the borrower. However, GoI gives guarantee only to the
government companies or Public sector undertakings (PSUs) and not to the private companies.
For example, Indian Renewable Energy Development Agency (IREDA) avail loans from
multilateral agencies with sovereign guarantee and use the proceeds for renewable project
development.
3.7.5 Securitization
Securitization is the process of pooling and packaging financial assets, relatively illiquid, into
liquid marketable securities. Securitization allows an entity to assign (i.e., sell) its interest in a
pool of financial assets (and the underlying security) to other entities. Loans extended to wind
power developers can also be bundled together and sold in the form of securities in capital
markets. However, as per RBI regulations, lending institutions can undertake securitization
only for risk transfer and not for profit booking.
3.7.6 Quantification of Risk for Each Stage of Project
While conducting project appraisal, banks/FIs may identify risk for different stages of project
development. Banks/FIs may quantify each risk in terms of interest rate premium and suggest
interest rate for each stage. This shall reduce the cost of funds for the projects with reduction of
risk. Further, some of the Banks/FIs provides interest rate rebate for successful commissioning
of the project i.e., IREDA provides rebate of 0.5% in interest rate after commissioning. However,
methodologies to rationalize interest rate vis-à-vis risk need to be identify.
3.7.7 Letter of Comfort by Banks/FIs
In India, some of the banks/FIs provide letter of comfort on behalf of investor to the foreign
lenders. Under letter of comfort, banks/FIs bear the payment risk of the foreign lenders.
Further, same can be implemented for financing the wind projects for foreign financing.

43 | P a g e
3.8 Recommendations
3.8.1 Establish Apex Body to Promote Refinancing
It is felt that there is a need to develop refinancing market, under which an apex refinancing
body should be established for better governance of the market. Institutional framework need
to be established to enable easy availability of refinancing options for wind projects where risks
are contained.
3.8.2 Developing a Longer Term Bond Market
a) New Products: Government should encourage financial intermediaries to offer new
product structures (e.g., credit enhancement, bond insurance) that enable
sub-investment grade corporate to access financing.
b) Increasing the Appetite of Long-Term Investors: Given the current stage of market
development, where long term institutional investors are yet to develop, the banking
system could play an important role in the development of the corporate debt market.
Regulatory caps on banks’ investments in corporate bonds could be relaxed as per the
minimum rating requirement (minimum investment grade, i.e., AA and above).
c) New Investors: Allowing pension funds, insurance companies and sovereign funds
having long term horizons to invest in wind projects through encouraging securitization
market; will permit access to long term investments via subscription of long term
tranches to such organizations. Domestic pension funds have been allowed to invest in
corporate debt securities up to a limit and similarly, other investors could also be
brought in.
d) The credit ratings of projects continue to be an important factor impacting the investor
interest which is also driven by the off taker risk. Hence, continuity of incentives,
regulatory clarity and capacity building to reduce risk perception are some of the
measures that would be required to develop investor interest in these financing
mechanisms. Reducing risks in projects is also important as fiduciary responsibilities of
pension funds would remain paramount. Further, although such structures are
prevalent in foreign markets, Indian investors have preferred simple structures.
e) Beyond that, the credit enhancement or guarantees also have costs which depend on the
extent of support/recourse and so on. Liquidity is also a concern as the secondary bond
market is not active currently. When there is greater depth of market and secondary
trading, there is likely to be higher interest from investors in such structures.

44 | P a g e
f) Green/Tax-Free Bonds: Tax free bonds are the securities which provide tax exemption
on the interest earned from the infrastructure bonds. IREDA has been issuing the tax
free bonds for lending to the renewable energy projects. Similarly, other financier can
also be allowed to issue tax free bonds especially for financing of new wind projects.
g) Inflation Linked Bonds: Raising funds through inflation linked/floating rate bonds is
an option that may be considered for new wind projects.
h) From the issuer’s perspective, the risk of the fixed rate borrowing is taken by the issuer.
A floating rate bond can transfer the risk to the investor and it also matches the lending
rates with the borrowing rates over the period of the loan. As compared to pure tax free
bonds, where the retail investor interest is also dependent on which tax bracket he is in,
inflation linked bonds could help investor have returns in line with inflation or cost of
living.
i) In the corporate bond market, both floating and fixed rate bonds are common. Typically
floating rate bonds are linked to Mumbai Interbank Offer Rate (MIBOR). If a new
benchmark is being used (e.g. Consumer Price Index (CPI) inflation), prior approval of
RBI is required the first time it is used.
j) Capital Gains Tax Bonds: Capital gains tax exempt bonds, currently being allowed for
REC and National Highways Authority of India (NHAI), providing interest rate of 6%
and lock in of 3 years, may be allowed for wind energy lenders. Option may be provided
to investors of higher lock in period with higher interest rates as well.
3.8.3 Reduction in Sovereign Guarantee Fee
Guarantee fee is levied by Government of India for providing sovereign guarantee to
multilaterals agencies on behalf of NBFCs for financing infrastructure projects. The government
may reduce guarantee fee for financing wind energy projects. This shall increase the exposure
of NBFCs in financing wind energy projects.
3.8.4 Modify Asset Classification Norms
RBI needs to modify its asset classification norms to bring more consistency and similarity in
NPA definition for bank and NBFC. Differential in norms results one asset NPA for bank and
revenue generating asset for NBFC. Due to the inconsistency, banks do not prefer to provide
loans to the projects and fear to have accounts receivables of more than 90 days.
45 | P a g e
3.8.5 Relaxation in Investment Guidelines
The investment guidelines for insurance companies need to be modified to allow investment in
instruments with a rating of less than AA. At present these investments are counted towards
‘unapproved’ investments. Investment guidelines for pension funds should be modified to
allow them to invest in wind energy projects, which have a guarantee from the central
government. The cost of such funding will be lower since these will not carry any currency risk.
3.8.6 Increase Involvement of FIs
Specialized infrastructure financing institutions need to participate at the design stage of a wind
project. The backing of such institutions at an early stage will carry at least two advantages.
First, it will make it easier for project developers to obtain finance from other sources. Second, it
will provide the developer with the opportunity to use the expertise of such institutions in
project financial structuring.
3.8.7 Encouraging Mezzanine and Takeout Financing
Removing interest rate caps on ECBs can encourage foreign investors to use instruments like
mezzanine and take out financing for wind project investment. The government should
consider either removing 350 basis point interest rate caps above LIBOR on infrastructure loans
above 5 years, or, increase the limit of capping. In addition, tools for mitigating the risks
involved for international lenders should be developed. Rationalization of stamp duties will
facilitate the use of takeout financing and securitization in states where these duties remain
high. High stamp duties levied at ad valorem rates are barriers to securitization as well as
takeout financing. Given that stamp duties are state subjects, the central government can play a
persuasive and demonstrative role. While it is desirable to waive stamp duties for transactions
relating to wind energy projects, this may not be possible because these duties often form a
sizable part of a state’s revenue. An alternative is to reduce the duties to a uniform low rate
across all states for wind projects.
3.8.8 Capacity Building
Capacity building of the lenders in wind sector would help them to understand the risks
associated with wind projects better and could lower the risk perception. Another mechanism is
for the Government/MNRE to empanel a set of agencies who would appraise new wind

46 | P a g e
projects. This would provide additional comfort for lenders who do not have full in house
capability to assess wind projects.
3.8.9 National Clean Energy Funds
Government should designate an agency to take care the disbursal of funds to project developer
interested in setting up the wind projects. Fund exposure should be fixed for each technology
based on the expected benefits and amount of investment required to achieve set targets. Else,
long tenure loan can be made available to the developer which shall be backed by grants
through National Clean Energy Fund. This shall act as the guarantee for the wind projects.
3.8.10 Crowd Funding
Collecting small amount of capital from large number of individuals for financing new project
is known as crowd-funding. Crowd-funding makes use of the easy accessibility of vast
networks of people through internet to attract investors. Crowd funding can be classified as
under:
a) Reward Based Crowd Funding: In return for a donation from fans of a project, a business or
non-profit organisation, typically gives some type of incentive for participating.
b) Equity Based Crowd Funding: Equity-based crowd-funding is the collective effort of
individuals to support efforts initiated by other people or organizations through the
provision of finance in the form of equity.
c) Credit Based Crowd Funding: In credit based crowd funding, prospective borrowers first
submit their requirements, and are then matched with pools of investors who are willing to
accept the credit terms.
Small investors may arrange funds for the small wind projects from the crowd funding. Crowd
funding is very popular in European9 countries for financing clean energy projects. This type of
funding may be implemented in India also for financing renewable projects however regulatory
framework for such financing needs to develop to avoid any fraudulent activities.
3.8.11 Micro Finance
Under micro finance, NGOs and micro finance institutes provide loans to the projects for
development of poor population at lower interest rate. Micro finance can be utilized for
9http://www.energypost.eu/crowdfunding-renewables-game-changer-energy-sector

47 | P a g e
financing the small scale wind projects located in the rural areas. Government may designate an
agency to appraise various small scale wind projects, which will be financed by NGOs. Further,
micro finance will help in reducing cost of the wind projects.
3.8.12 Benefits of Low-Cost Credit Lines
Low-cost foreign credit lines along with cost of hedging and other administrative cost comes
approximately equal to domestic funds and thus, there is no major difference in the financing
cost between domestic lending and external commercial borrowings as popularly believed.
Hence project developers require fixed cost loan which can be secured through external
borrowings. The advantage of such credit line is that, fixed cost and long term loan provides
certainty to the project vulnerable to cost variation.
3.8.13 Flexible Loans
Another innovative financing mechanism is generation linked repayment loans. Under this
project, developer repay loan based on the generation of projects. Therefore, lenders also share
operational risk related to the project.
3.8.14 Promote Foreign Currency Long Term Deposits
RBI may promote foreign currency long term deposits in banks from NRIs and foreigners. This
will provide low cost deposit to the banks and enough liquidity to meet their asset liability
mismatch. Long term deposits will enable banks to extend finance to the wind projects thereby
increasing exposure to the renewable sector.
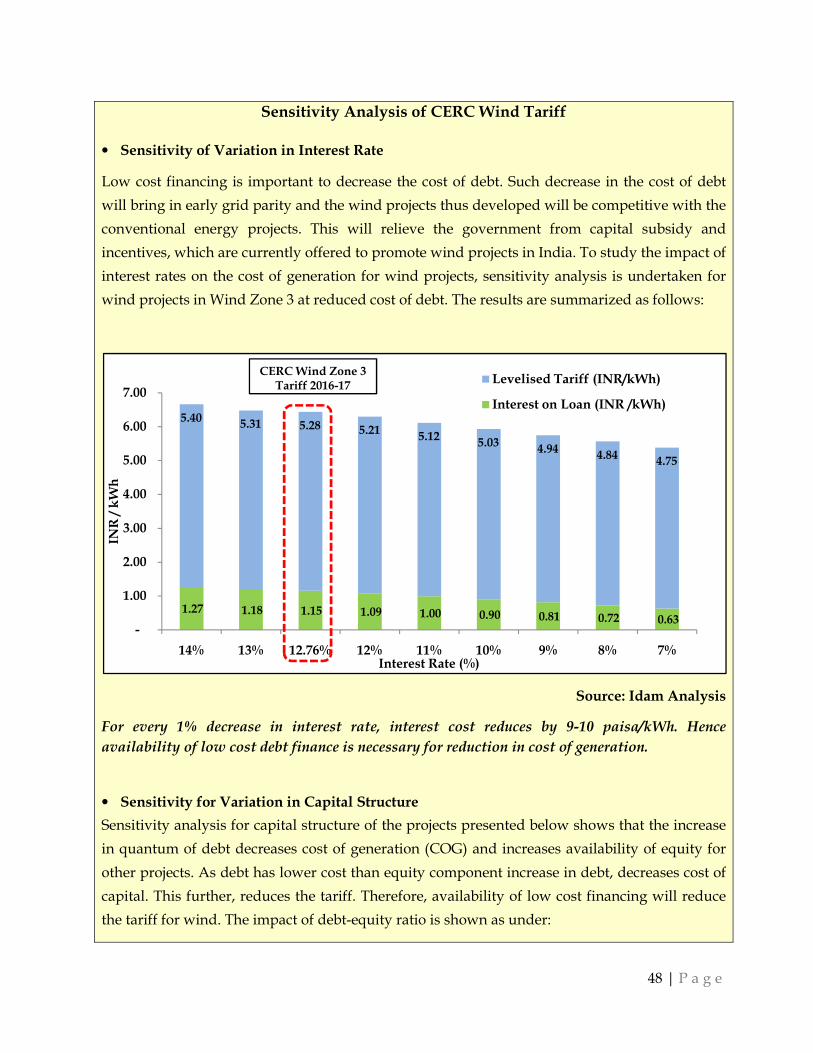
48 | P a g e
Sensitivity Analysis of CERC Wind Tariff
• Sensitivity of Variation in Interest Rate
Low cost financing is important to decrease the cost of debt. Such decrease in the cost of debt
will bring in early grid parity and the wind projects thus developed will be competitive with the
conventional energy projects. This will relieve the government from capital subsidy and
incentives, which are currently offered to promote wind projects in India. To study the impact of
interest rates on the cost of generation for wind projects, sensitivity analysis is undertaken for
wind projects in Wind Zone 3 at reduced cost of debt. The results are summarized as follows:
Source: Idam Analysis
For every 1% decrease in interest rate, interest cost reduces by 9-10 paisa/kWh. Hence
availability of low cost debt finance is necessary for reduction in cost of generation.
• Sensitivity for Variation in Capital Structure
Sensitivity analysis for capital structure of the projects presented below shows that the increase
in quantum of debt decreases cost of generation (COG) and increases availability of equity for
other projects. As debt has lower cost than equity component increase in debt, decreases cost of
capital. This further, reduces the tariff. Therefore, availability of low cost financing will reduce
the tariff for wind. The impact of debt-equity ratio is shown as under:
1.27 1.18 1.15 1.09 1.00 0.90 0.81 0.72 0.63
5.405.31 5.28 5.21
5.125.03
4.944.84
4.75
-
1.00
2.00
3.00
4.00
5.00
6.00
7.00
14% 13% 12.76% 12% 11% 10% 9% 8% 7%
INR
/ k
Wh
Interest Rate (%)
Levelised Tariff (INR/kWh)
Interest on Loan (INR /kWh)
CERC Wind Zone 3 Tariff 2016-17

49 | P a g e
Source: Idam Analysis
For every 5% increase in debt component, interest cost reduces by 6-8 paisa/kWh. Hence
availability of low cost debt finance is necessary for reduction in cost of generation.
• Impact of Interest Rate and Tenure on Interest Cost
Source: Idam Analysis
0.80 0.87 0.95 1.02 1.09 1.15 1.22 1.28 1.34
6.44 6.21 5.99 5.76 5.52 5.28 5.04 4.794.54
-
1.00
2.00
3.00
4.00
5.00
6.00
7.00
8.00
45% 50% 55% 60% 65% 70% 75% 80% 85%
INR
/ k
Wh
Debt (%)
Levelised Tariff (INR/kWh)
Interest on Loan (INR /kWh)
CERC Wind Zone - 3Tariff FY 2016-17
1.04
1.36
0.96
1.25
0.88
1.15
0.80
1.04
0.72
0.94
0.64
0.84
0.56
0.73
0.40
0.50
0.60
0.70
0.80
0.90
1.00
1.10
1.20
1.30
1.40
10 11 12 13 14 15
INR
/ k
Wh
Loan Tenure (Years)
13% 12% 11% 10% 9% 8% 7%

50 | P a g e
Long Term Debt’s rate and tenure also have impact on the feasibility of project. Higher interest
rate results into higher interest liability, which may further result into higher cost of generation.
Further, the increase in tenure of the loan also increases the overall interest component, and
hence the levelised per unit component in the cost of generation. High interest rate liability
overcomes benefit of reduction in annual repayment. Therefore, before increasing the tenure of
loan, we should see the impact of interest liability on COG to determine the best possible option
of loan tenure and interest rate.
The long tenure of loan is only beneficial if it comes with reduced interest rate also, as evident
from the figure above.

51 | P a g e
4 Source of Equity Financing
Equity financing is considered as the most risky investment, as equity investor always stands at
the end of the stakeholder queue. Therefore, equity investors focus on commercial scale wind
projects especially large scale projects which provide economy of scale to them. At present in
wind project development, private equity funds have dominated the equity investment scene.
Most investments made are in Indian Rupees for a period of five to seven years in the
companies.
Equity typically comprises 30% to 40% of the total project cost, while rest is financed by debt.
Strategic investors, venture capital, private equity and tax equity investors are the key providers
of equity to wind projects. In India, the hurdle rates for direct equity investments range
between 16% and 20% and are dependent on factors such as the size of the project, the
background of sponsor, the technology risk, the stage of maturity and geographic and policy
risks.
4.1 Venture Capital/ Private Equity
Private equity capital is an equity capital that is not quoted on a public exchange. Private equity
investors or funds make investments directly into private companies or conduct buyouts of
public companies that result in a delisting of public equity. Capital for private equity is raised
from retail and institutional investors and can be used to fund start-ups (venture capital), make
acquisitions (growth equity, buyout), or to strengthen a balance sheet (special situations). Such
investments are commonly made by private equity firms or venture capital firms. Investments
are generally made through a fund partnership having the following characteristics:
• Private equity funds are closed-end investment structures.
• Funds terms and conditions are defined in a limited partnership agreement.
• Term of a fund ranges between 10 to 12 years.
• Investment disciplines include leveraged buyouts (LBO), venture capital, distressed,
growth, mezzanine finance and angel investor.
Private equity funds have always been actively investing in RE projects in India since 2008.
They have supported IPPs. In many cases, these funds invested in majority owned RE
aggregation vehicles. Such vehicles include Green Infra Private Limited (99% owned by IDFC
Private Equity), Renew Power Ventures Private Ltd. (99% owned by Goldman Sachs Private
Equity), and Continuum Wind Energy (majority owned by Morgan Stanley Infrastructure

52 | P a g e
Partners). Most equity investments in Indian wind companies have been made at the parent
company level, and not at the project level.
In July 2014, GE Energy Financial Services has invested equity in three Atria Power wind
projects under construction in India, supporting GE's commitment to invest USD 1 billion
annually in renewable energy projects worldwide. The wind farms will have a combined
capacity of 126 MW and will support the Indian Ministry of New and Renewable Energy's
program to generate competitively priced grid–interactive wind power through feed–in tariffs.
Table 10: Private Equity Deals
Source: ibef
4.2 Developer’s Equity/ Internal Accruals
Sponsors equity comes from reserves and surplus of sponsors existing businesses. Large
business houses would play an important role in achieving the Wind Vision 2032 targets. Large
companies have high risk taking and execution abilities to undertake capital intensive projects.
To ensure successful achievement of the target, it is imperative to select technically equipped
and financially sound companies with committed management. It is also imperative to
channelize PSUs’ attention in promoting wind in the same way they have come forward for
developing the solar photovoltaic (PV) sector.
4.3 Capital Market
Capital market is the market where established players raises equity for the investment in the
53 | P a g e
project/businesses. However, tapping capital markets is feasible only for those companies
which have achieved significant scale and have profitable operations. For small scale
developers, raising equity from market will be an issue. However, for large scale wind capacity
development, capital market may play a vital role.
At present, private equity investment is more popular in India for financing wind projects.
Private equity investors make their investment at parent company level to minimize their risk.
Further, to reduce their risk, private equity investors invest through fund partnership. Such
investors do not make any direct investments in the projects to insulate themselves from the
associated risks. Such investors look for the opportunity which has minimal risk and maximum
returns.
Developer’s equity is the conventional equity financing method, which is followed in India for
most of the projects. These equity investors have higher risk taking ability and therefore may
undertake large scale wind energy projects. Raising equity from capital market is available for
the bigger business houses. Small private players do not have access to the capital market due
to lack of creditworthiness.
4.4 Barriers in availing finance from Indian Equity Market
4.4.1 Returns on Equity vis-a-vis Interest Rate
In a rational world, expected return on equity should be higher than the cost of debt outside
exceptional circumstances. Equity decided has more risk and thus should attract higher returns.
The role of debt, in fact, is to concentrate the risks to the equity holder and therefore enhance
equity returns. Another role is to replace the equity capital of the developer so that they can
recycle the money into the next project.
The spread between equity costs and debt costs represents the allocation of risks and returns
between debt and equity. As more debt is taken on, that is, as a project has more leverage, it is
expected that equity returns to rise as risks are more concentrated.
As electricity sector is a regulated market and cost of equity is fixed for the wind energy
generation, increase in cost of debt in the country is decreasing the spread between cost of
equity and debt. Thus equity investors are taking on more risk by assuming debt, but, due to
high cost of debt, do little to enhance their returns. On the face of it, at lower return levels and
higher cost of debt, equity investors might not be interested in wind sector.

54 | P a g e
4.4.2 False Expectation
Developer’s face issues in initial years of operation i.e., post commissioning of the project, when
equity investors earn lower returns from the project due to initial high proportion of debt
servicing. Equity investors make investment in the project with the perception of refinancing
the project at better terms once it gets commissioned. However, reduction in cash flows in initial
years makes it difficult for investor to negotiate better terms for the project and reduce its cost
of fund.
4.4.3 Availability of Equity
Equity induces developers to take on and develop a project and eventually, negotiate PPAs and
loans. Availability of equity from both domestic and foreign sources is comparatively better
than the availability of debt. In fact, international equity may be more readily available than
domestic equity.
However, lack of availability of debt to refinance a project may actually force equity to be locked
in a project for too long and hence restrict the availability of equity for recycling and starting
new projects. In particular, developers who have financed projects on their own balance sheets
during construction-- when debt is usually more expensive and difficult to get due to related
risks and uncertainty -- are finding it difficult to raise reasonably priced debt even after the
project is built and operating.
4.5 Recommendations
4.5.1 Rational Risk Pricing for Equity Investor
Strategy of accepting lower returns in the short term to capture the market is not sustainable
over time, because the high risk investment environment in India will require correspondingly
higher expected returns. In the long run, the flow of information in the market about the risk
profile of projects will help in obtaining more rational risk pricing.
4.5.2 Equity as Combination of Debt and Equity
Some of the developers typically use multiple levels of leverage to increase their effective IRR.
For example, some private equity funds raise equity as a combination of equity and debt. This
reduces the cost of equity and inflates returns from the initial equity investments. Further, this
also provides enough liquidity to developers to invest in the subsequent projects. This way,

55 | P a g e
equity investor may invest in more than one project and maintain their effective IRR even in the
regulated market.
4.5.3 Community Based Financing
In rural areas, community based financing may provide better way of tapping small scale wind
projects. In India, lenders are hesitant to provide financing for wind projects located in rural
areas. Under community based model, people shall self finance and utilize power generated
from the wind projects. Further, Government may also provide grant to such project for
promotion of wind power in rural areas.
4.5.4 Specialized Project Developer
The large developers conduct wind assessment, procure land, take clearances and develop
project and further sell that project to various investors who are reluctant to invest due to high
risk of development. The developer bearing the entire risk till commissioning of project may
charge risk premium from the investors willing to invest in project.
4.5.5 Build Investment Ecosystem for Wind
Build an effective investment ecosystem level view for the wind sector instead of dealing
individual issues i.e., grid, financing, incentive, manufacturing in bits and pieces. The entire
system should be driven by some national authority which may guide development of wind
sector. The national action plan and policy can be made available for conducive progress, which
may set the target for wind and drive the entire ecosystem.

56 | P a g e
5 Other Financing Instruments
5.1 Partial Risk Guarantee and Loan Support
Partial risk guarantees protect foreign lenders from specific risk, such as political risk and
exchange rate risk. Partial risk guarantee attracts foreign funds by mitigating political risks
such as breach of contract by the state, expropriation and currency inconvertibility, thereby
reducing the cost of financing. A partial risk guarantee typically covers the entire debt amount
as well as interest payments.
While partial credit guarantee covers default arising from all risks subject to a predetermined
maximum amount. It also covers default arising from a specific risk. Furthermore, it can be
structured to protect either the lender or project developers. Partial risk guarantee and loan
support can mitigate political and exchange rate risks, which facilitate access to foreign capital
and can reduce the cost of wind energy.
5.2 Subordinate Funding/Mezzanine Debt
Mezzanine debt capital generally refers to that layer of financing between a company's senior
debt and equity, filling the gap between the two. Structurally, it is subordinate in priority of
payment to senior debt, but senior in rank to common stock or equity. In a broader sense,
mezzanine debt may take the form of convertible debt, senior subordinated debt or private
securities.
Figure 10: Mezzanine Financing
Mezzanine finance is less risky than equity for investors, as it provides fixed interest along with
principal repayment and minimum guaranteed returns to investors. It is used in situations
SENIOR DEBT FINANCING/ASSET
BACKED FINANCING
SENIOR SUBORDINATED DEBT
CONVERTIBLE SUBORDINATED DEBT
REDEEMABLE PREFERRED STOCK
EQUITY
MEZZANINE
FINANCING

57 | P a g e
where the company is generating adequate cash flows to service coupon payments; the
promoters are unwilling to dilute their equity stake in the company; short term conversion
options are valuable (e.g., when the company is close to initial public offering or there is a clear
exit path); or where the investors deem equity investment risky.
Mezzanine finance instruments work like debt instruments with fixed coupon payments that
last until a liquidity event, at which point these coupons are converted into equity; thereby
providing the investor an upside. Base returns (minimum guaranteed returns) range between
16% to 18% on capital invested and coupon rates are between 4% to 6% for finance provided by
international investors and 8% to 11% for finance provided by Indian investors. The Indian RE
market has seen very few mezzanine finance transactions because of interest rate caps on ECBs,
which prevent the pricing of mezzanine financing commensurate with the associated risks.
5.3 Securitization of Cash Flows of RE Projects Pooled From Multiple Projects
Securitization of cash flows from RE projects is akin to a typical future-flow securitization
transaction that relies on receivables. Securitization along with structural features such as a
trustee-monitored escrow mechanism, well-documented payment priorities (waterfall
mechanism), creation of liquidity reserve, etc., elevate the credit quality of the instrument.
Further, securitization can help renewable projects get additional debt based on the strength of
operational cash flows to fund other business investments or other under-construction projects.
In these transactions, the project SPV issues bonds by securitizing the project cash flows and the
proceeds from bonds are used to refinance existing bank debt. The securitization process can
also be used to aggregate cash flows from a portfolio of high-quality operating projects from
single or multiple developers. This diversifies counterparty, geography and technology risks.
The cash flows can be also be in tranches with priority on debt servicing. Debt servicing
coverage ratios are set according to investor’s risk appetite. Payments to investor (bond holder)
will be met through future cash flows from the receivables of the renewable project.
5.4 Innovative Financing Structures
A deeper and more diversified financial sector can certainly help increase public and private
participation in development of wind project. Developing local capital markets can play a
critical role in facilitating investment in wind energy. On the other hand, foreign funds need to
be tapped to fill the gap between target investment and locally available funds.
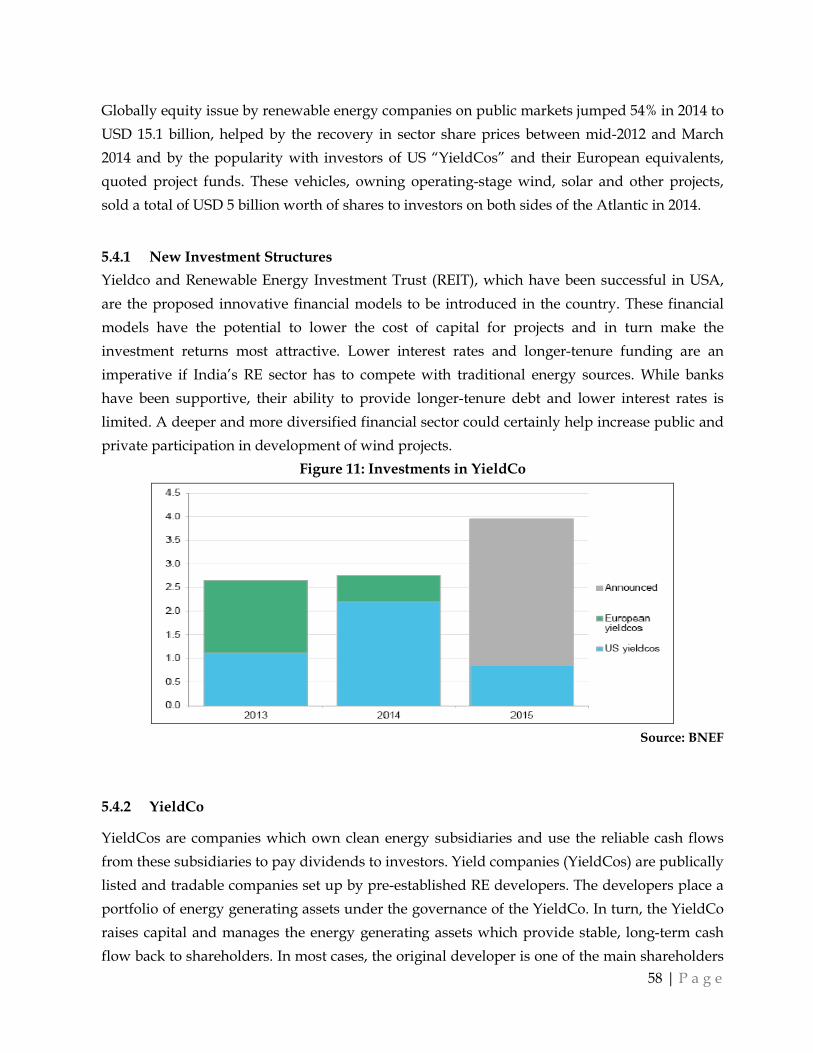
58 | P a g e
Globally equity issue by renewable energy companies on public markets jumped 54% in 2014 to
USD 15.1 billion, helped by the recovery in sector share prices between mid-2012 and March
2014 and by the popularity with investors of US “YieldCos” and their European equivalents,
quoted project funds. These vehicles, owning operating-stage wind, solar and other projects,
sold a total of USD 5 billion worth of shares to investors on both sides of the Atlantic in 2014.
5.4.1 New Investment Structures
Yieldco and Renewable Energy Investment Trust (REIT), which have been successful in USA,
are the proposed innovative financial models to be introduced in the country. These financial
models have the potential to lower the cost of capital for projects and in turn make the
investment returns most attractive. Lower interest rates and longer-tenure funding are an
imperative if India’s RE sector has to compete with traditional energy sources. While banks
have been supportive, their ability to provide longer-tenure debt and lower interest rates is
limited. A deeper and more diversified financial sector could certainly help increase public and
private participation in development of wind projects.
Figure 11: Investments in YieldCo
Source: BNEF
5.4.2 YieldCo
YieldCos are companies which own clean energy subsidiaries and use the reliable cash flows
from these subsidiaries to pay dividends to investors. Yield companies (YieldCos) are publically
listed and tradable companies set up by pre-established RE developers. The developers place a
portfolio of energy generating assets under the governance of the YieldCo. In turn, the YieldCo
raises capital and manages the energy generating assets which provide stable, long-term cash
flow back to shareholders. In most cases, the original developer is one of the main shareholders
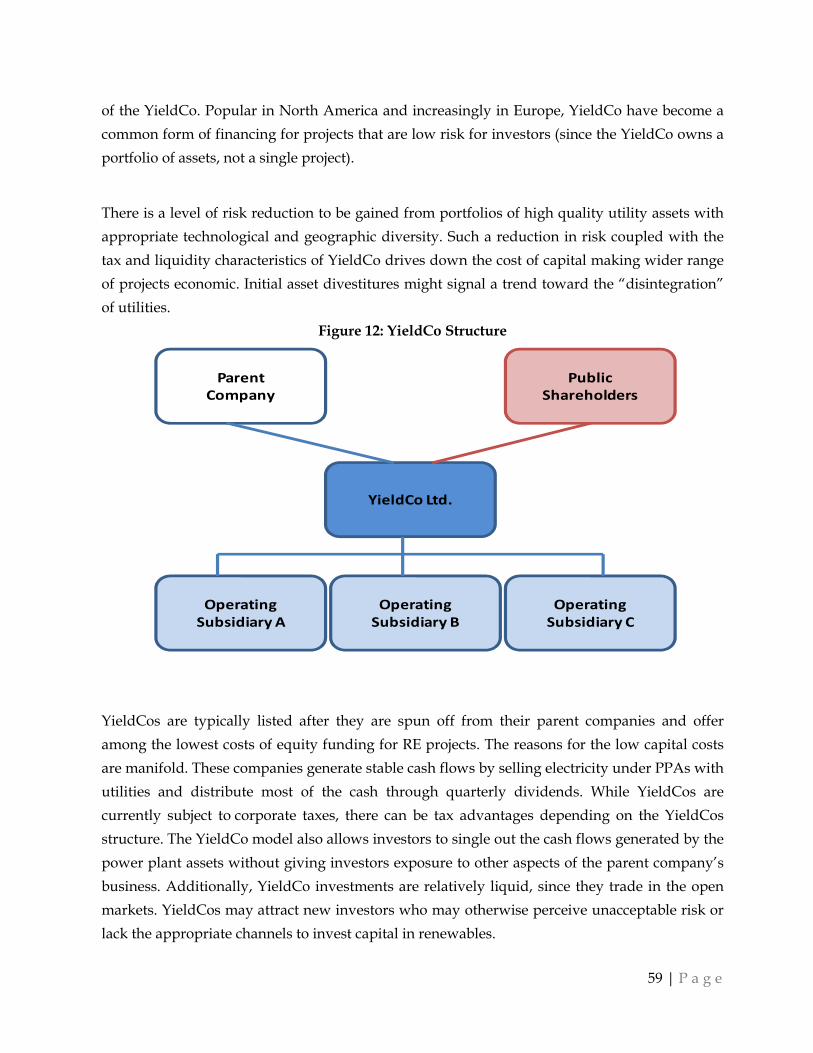
59 | P a g e
of the YieldCo. Popular in North America and increasingly in Europe, YieldCo have become a
common form of financing for projects that are low risk for investors (since the YieldCo owns a
portfolio of assets, not a single project).
There is a level of risk reduction to be gained from portfolios of high quality utility assets with
appropriate technological and geographic diversity. Such a reduction in risk coupled with the
tax and liquidity characteristics of YieldCo drives down the cost of capital making wider range
of projects economic. Initial asset divestitures might signal a trend toward the “disintegration”
of utilities.
Figure 12: YieldCo Structure
YieldCos are typically listed after they are spun off from their parent companies and offer
among the lowest costs of equity funding for RE projects. The reasons for the low capital costs
are manifold. These companies generate stable cash flows by selling electricity under PPAs with
utilities and distribute most of the cash through quarterly dividends. While YieldCos are
currently subject to corporate taxes, there can be tax advantages depending on the YieldCos
structure. The YieldCo model also allows investors to single out the cash flows generated by the
power plant assets without giving investors exposure to other aspects of the parent company’s
business. Additionally, YieldCo investments are relatively liquid, since they trade in the open
markets. YieldCos may attract new investors who may otherwise perceive unacceptable risk or
lack the appropriate channels to invest capital in renewables.
Parent
Company
YieldCo Ltd.
Public
Shareholders
Operating
Subsidiary A
Operating
Subsidiary B
Operating
Subsidiary C

60 | P a g e
Key Benefits of YieldCo:
a) YieldCos can provide a liquid means of investing in renewable energy such as solar and
wind.
b) Financing through YieldCos is an attractive option to fund projects without raising debt
levels.
c) They offer the lowest cost of equity funding for renewable energy projects.
d) Since the assets dropped down into the YieldCo are stabilized, they generally do not carry
development risk.
e) The long-term, low-risk and contracted asset profile of the YieldCo can support a lower cost
of capital for the YieldCo and for the parent company.
f) The tendency for YieldCos to pool multiple assets can diversify geographical and single-
asset risk.
5.4.3 REIT
Renewable Energy Investment Trusts are similar to the Real Estate Investment Trusts. REITs are
companies that own or finance and often manage income-producing real estates. Modelled after
mutual funds, REITs provide investors all types of regular income streams, diversification and
long-term capital appreciation. REITs typically pay out all of their taxable income as dividends
to shareholders. In turn, shareholders pay the income taxes on those dividends. REITs are
publicly traded as liquid stocks on major exchanges. There are some small capitalization REITs
that focus on investment in energy efficiency and renewable energy, but these are small
minority of total asset class.
Globally, the concept of REITs was first introduced in the United States and is present in
Australia, UK, Germany, Singapore, Japan, Hong Kong and among other nations. In India, the
concept of Real Estate Investment Trust was first introduced by SEBI in 2007 as draft REIT
regulations. However, due to inherent limitations in the draft regulations, the final regulations
were not announced for a long time. In September 2013, SEBI released a revised set of draft
REIT regulations for public comments. The REIT regulations have been approved by SEBI after
a few modifications and the final regulations was released on 26 September 2014. Introduction
of REIT regulations by SEBI and providing a tax framework by the Ministry of Finance (MoF) is
a great step in the right direction and clearly illustrates the vision of the government.
Since REITs would be governed by many regulations, the most important being that, they must
distribute at least 90% of their taxable income to shareholders each year as dividends. That’s
why they’re so popular with investors seeking steady income.

61 | P a g e
Figure 13: REIT Structure
Key Benefits of REITs:
a) Investors are able to diversify within the market by holding an interest in multiple assets.
b) Pass profits directly to its investors and are thus not taxed at a corporate level, but taxed
only at the shareholder level.
c) Risk is pooled among many investors instead of a sole asset owner.
d) REITs pay high cash dividends.
e) Many REITs offer high liquidity.
f) Investors share ownership in large assets, which would otherwise be difficult to afford.
g) Foreign individuals, otherwise restricted from owning asset, can have an interest in such
property via REIT.
h) Depreciation expenses can minimize shareholder taxes on dividends.
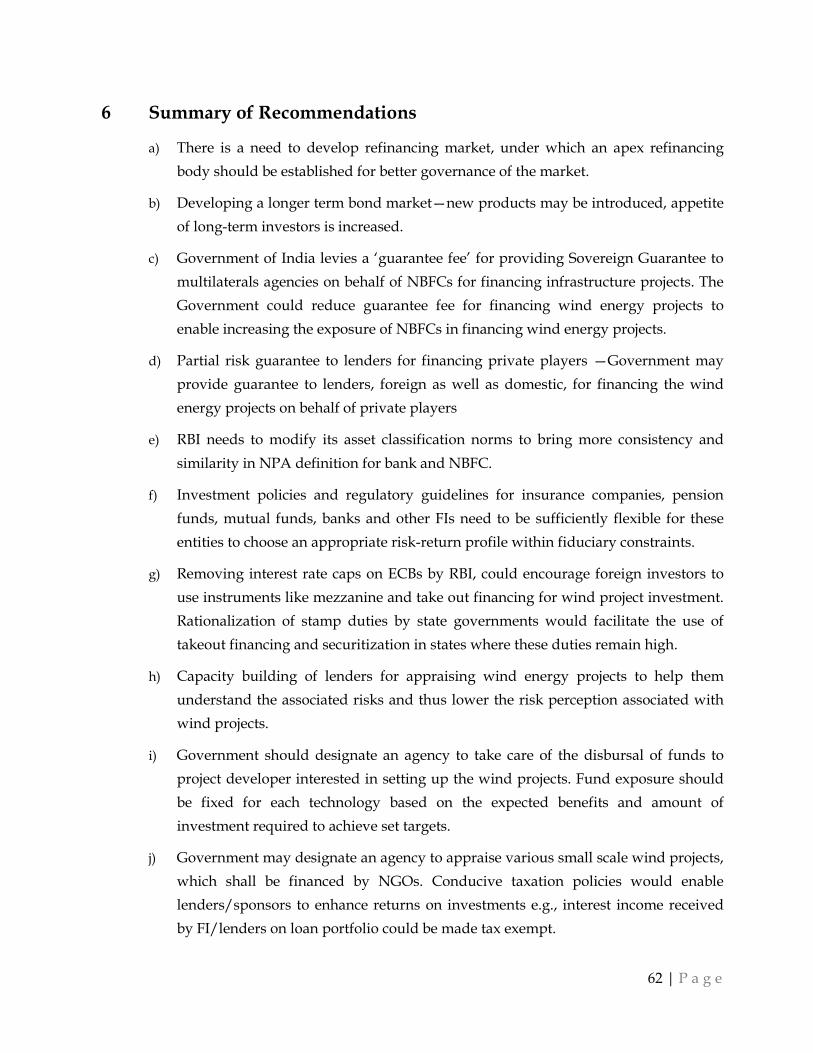
62 | P a g e
6 Summary of Recommendations
a) There is a need to develop refinancing market, under which an apex refinancing
body should be established for better governance of the market.
b) Developing a longer term bond market—new products may be introduced, appetite
of long-term investors is increased.
c) Government of India levies a ‘guarantee fee’ for providing Sovereign Guarantee to
multilaterals agencies on behalf of NBFCs for financing infrastructure projects. The
Government could reduce guarantee fee for financing wind energy projects to
enable increasing the exposure of NBFCs in financing wind energy projects.
d) Partial risk guarantee to lenders for financing private players —Government may
provide guarantee to lenders, foreign as well as domestic, for financing the wind
energy projects on behalf of private players
e) RBI needs to modify its asset classification norms to bring more consistency and
similarity in NPA definition for bank and NBFC.
f) Investment policies and regulatory guidelines for insurance companies, pension
funds, mutual funds, banks and other FIs need to be sufficiently flexible for these
entities to choose an appropriate risk-return profile within fiduciary constraints.
g) Removing interest rate caps on ECBs by RBI, could encourage foreign investors to
use instruments like mezzanine and take out financing for wind project investment.
Rationalization of stamp duties by state governments would facilitate the use of
takeout financing and securitization in states where these duties remain high.
h) Capacity building of lenders for appraising wind energy projects to help them
understand the associated risks and thus lower the risk perception associated with
wind projects.
i) Government should designate an agency to take care of the disbursal of funds to
project developer interested in setting up the wind projects. Fund exposure should
be fixed for each technology based on the expected benefits and amount of
investment required to achieve set targets.
j) Government may designate an agency to appraise various small scale wind projects,
which shall be financed by NGOs. Conducive taxation policies would enable
lenders/sponsors to enhance returns on investments e.g., interest income received
by FI/lenders on loan portfolio could be made tax exempt.
63 | P a g e
k) Lenders may promote innovative financing mechanism like generation linked
repayment loans, wherein a project developer is allowed to repay loan based on the
generation of projects.
l) RBI may promote foreign currency long term deposits in banks from NRIs and
foreigners.
m) Equity as combination of debt and equity — some of the developers typically use
multiple levels of leverage to increase their effective IRR. For example, some private
equity funds raise equity as a combination of equity and debt. This reduces the cost
of equity and inflates returns from the initial equity investments. Further, it
provides enough liquidity to developers to invest in the subsequent projects. This
way, equity investor may invest in more than one project and maintain their
effective IRR even in the regulated market.
